04_machine-learning
Created by yamamoto.kosuke on Monday, August 24th, 2020機械学習による雨量推定

yamamoto.kosukeMonday, August 24th, 2020 at 5:06:06 PM GMT+09:00
@yamamoto.kosukeさんがチャンネルに参加しました

kobayashi_yusukeMonday, August 24th, 2020 at 5:30:54 PM GMT+09:00
@kobayashi_yusukeさんがチャンネルに参加しました

uwatokoMonday, August 24th, 2020 at 5:37:04 PM GMT+09:00
@uwatokoさんがチャンネルに参加しました

takao-yMonday, August 24th, 2020 at 5:45:38 PM GMT+09:00
@takao-yさんがチャンネルに参加しました

keiyoshi08Monday, August 24th, 2020 at 6:00:22 PM GMT+09:00
@keiyoshi08さんがチャンネルに参加しました
kobayashi_yusukeTuesday, August 25th, 2020 at 6:03:37 PM GMT+09:00
@takao-y
吉兼先生
先日の打合せではありがとうございました。
打合せでお話しのございました1点ではなく7x7の49点 で計測した結果をお伝えいたします。
-----
RをPythonに変換したプログラムでの全体の処理時間計測
環境: EORCの計算機(zico-n)
処理時間:8時間46分10秒
(auto.shの開始時間から終了時間まで)
パラメータ:
テスト年:2007~2018年の7月
学習年:2007~2018年の7月(テスト年を除く)
データ: RESTECで全国を5つに分けて作成したMSM,解析雨量データセット
サイト:siteC(西日本・九州)
地点(x,y) 7x7の49点
x='20 30 40 50 60 70 80'
y='20 30 40 50 60 70 80'
ガンマ: 0.5,0.05,0.005,0.0005,0.00005,0.000005,0.0000005,0.00000005の8通り
コスト:10
エプシロン:0.001
-----
また、吉兼先生のRでの時間も別途計測しました。こちらは吉兼先生のデータを用いて行っております。
-----
Rでの全体の処理時間計測
環境: EORCの計算機(zico-n)
処理時間:18時間18分2秒
(auto.shの開始時間から終了時間まで)
パラメータ:
テスト年:2007~2018年の7月
学習年:2007~2018年の7月(テスト年を除く)
データ: 吉兼先生のサンプルデータデータセット(MSM,レーダ)
地点(x,y) 7x7の49点
x='20 30 40 50 60 70 80'
y='20 30 40 50 60 70 80'
ガンマ: 0.5,0.05,0.005,0.0005,0.00005,0.000005,0.0000005,0.00000005の8通り
コスト:10
エプシロン:0.001
-----
計算は2台で並行して行いますが、1つあたりの時間がかかりすぎておりますので、時間がかかりすぎていることに対する対応は検討させてください。
以上、よろしくお願いいたします。
takao-yWednesday, August 26th, 2020 at 9:29:36 AM GMT+09:00
@kobayashi_yusuke 小林様
takao-yWednesday, August 26th, 2020 at 9:32:51 AM GMT+09:00
ありがとうございます。少し遅い気もしますが、12年間全てをデータ変換から実施するとそのくらいはかかるのかもしれません。もしよろしければ、結果の図を添付してもらえますでしょうか。
kobayashi_yusukeWednesday, August 26th, 2020 at 10:05:51 AM GMT+09:00


@takao-y
吉兼先生
RをPythonに変換したプログラムでのグラフを添付します。
パラメータは以下のとおりです。
また、現在RとPythonでのstep別の処理時間を計算しております。
よろしくお願いします。
全体の処理時間計測
環境: EORCの計算機(zico-n)
処理時間:8時間46分10秒
(auto.shの開始時間から終了時間まで)
パラメータ:
テスト年:2007~2018年の7月
学習年:2007~2018年の7月(テスト年を除く)
データ: RESTECで全国を5つに分けて作成したMSM,解析雨量データセット
サイト:siteC(西日本・九州)
地点(x,y) 7x7の49点
x='20 30 40 50 60 70 80'
y='20 30 40 50 60 70 80'
ガンマ: 0.5,0.05,0.005,0.0005,0.00005,0.000005,0.0000005,0.00000005の8通り
コスト:10
エプシロン:0.001
-----
takao-yWednesday, August 26th, 2020 at 10:22:14 AM GMT+09:00
@kobayashi_yusuke 小林様。ありがとうございます。図を見る限り正常に作動しているように思います。それでは、同様にしてRegion AからEまで同様に実施していただけますでしょうか。領域の広さの違いと欠損値に注意する必要がありますが、基本的には、それぞれの領域に対してauto.shを変更すれば大丈夫だと思います。
kobayashi_yusukeWednesday, August 26th, 2020 at 4:15:25 PM GMT+09:00
@takao-y
吉兼先生
お返事ありがとうございます。正常に作動しているように思えるとのご意見をいただき、ありがたく思います。
同様にしてsiteAからsiteEまで処理するにあたり、領域の大きさや形が異なりますが、xnumとynumは20から80までの10ごとでよろしいでしょうか。siteごとに変える必要がございましたらご教授ください。
まずは欠損値の処理の対応を行い、次にsiteごとにガンマ値を変えたグラフを出力したいと考えております。
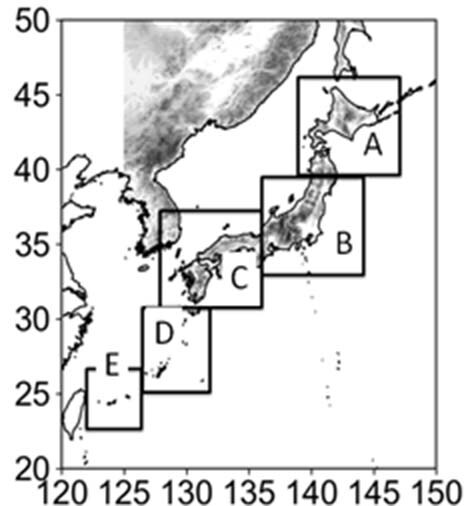
siteAからsiteEの位置は以下のとおりです。
X:東経、Y:北緯
(X,Yともに0.06度ごと。南西を原点に北東へ正)
siteA X:139-147 Y:40-46
siteB X:135-143 Y:33-40
siteC X:129-135 Y:30-36
siteD X:126-131 Y:24-30
siteE X:122-127 Y:23-28
パラメータは以下のとおりです。これでよろしければこのままsiteAからsiteEまで計算します。
------
allyears='2007 2008 2009 2010 2011 2012 2013 2014 2015 2016 2017 2018'
testyears='2007 2008 2009 2010 2011 2012 2013 2014 2015 2016 2017 2018'
months='07’
## Grids
xnums='20 30 40 50 60 70 80'
ynums='20 30 40 50 60 70 80'
nums='441'
rg2='10'
## Hyper-parameter (Gamma)
gm='0.5 0.05 0.005 0.0005 0.00005 0.000005 0.0000005 0.00000005'
## Hyper-parameter (Cost)
c2='10'
## Hyper-parameter (Epsilon)
ep='0.001'
------
よろしくお願いいたします。
吉兼先生
お返事ありがとうございます。正常に作動しているように思えるとのご意見をいただき、ありがたく思います。
同様にしてsiteAからsiteEまで処理するにあたり、領域の大きさや形が異なりますが、xnumとynumは20から80までの10ごとでよろしいでしょうか。siteごとに変える必要がございましたらご教授ください。
まずは欠損値の処理の対応を行い、次にsiteごとにガンマ値を変えたグラフを出力したいと考えております。
siteAからsiteEの位置は以下のとおりです。
X:東経、Y:北緯
(X,Yともに0.06度ごと。南西を原点に北東へ正)
siteA X:139-147 Y:40-46
siteB X:135-143 Y:33-40
siteC X:129-135 Y:30-36
siteD X:126-131 Y:24-30
siteE X:122-127 Y:23-28
パラメータは以下のとおりです。これでよろしければこのままsiteAからsiteEまで計算します。
------
allyears='2007 2008 2009 2010 2011 2012 2013 2014 2015 2016 2017 2018'
testyears='2007 2008 2009 2010 2011 2012 2013 2014 2015 2016 2017 2018'
months='07’
## Grids
xnums='20 30 40 50 60 70 80'
ynums='20 30 40 50 60 70 80'
nums='441'
rg2='10'
## Hyper-parameter (Gamma)
gm='0.5 0.05 0.005 0.0005 0.00005 0.000005 0.0000005 0.00000005'
## Hyper-parameter (Cost)
c2='10'
## Hyper-parameter (Epsilon)
ep='0.001'
------
よろしくお願いいたします。
kobayashi_yusukeWednesday, August 26th, 2020 at 5:17:06 PM GMT+09:00
@takao-y
吉兼先生
お世話になっております。
PythonとRによるstepごとの時間計測を行いましたのでお知らせします。
変更したのはstep02のためこの時間がRよりPythonのほうが短くなっておりますが、やはりstep02で時間はかかっております。
2台で並行して処理できますので、まずは欠損値の処理の対応を行い、次にこのままsiteごとにガンマ値等パラメータを変えて結果を出したいと考えております。
よろしくお願いいたします。
---
Python:
step01:5分
step02:8時間23分43秒
step03:46分55秒
step04,終了:1分10秒
全体:9時間16分48秒
---
R:
step01:4分48秒
step02:14時間13分23秒
step03:52分59秒
step04,終了:4秒
全体:15時間11分14秒
※step04,終了の時間でRが極端に短いのはstep04のRのほうのプログラムをLinuxの環境に調整しておらず、プログラムが動かない箇所があるためで、動けばPythonと同様1分程度かかると考えられます。
-----
パラメータ:
テスト年:2007~2018年の7月
学習年:2007~2018年の7月(テスト年を除く)
データ: RESTECで全国を5つに分けて作成したMSM,解析雨量データセット
サイト:siteC(西日本・九州)
地点(x,y) 7x7の49点
x='20 30 40 50 60 70 80'
y='20 30 40 50 60 70 80'
ガンマ: 0.5,0.05,0.005,0.0005,0.00005,0.000005,0.0000005,0.00000005の8通り
コスト:10
エプシロン:0.001
-----
takao-yWednesday, August 26th, 2020 at 7:17:00 PM GMT+09:00
@kobayashi_yusuke 小林様。ご報告ありがとうございます。「siteAからsiteEまで処理するにあたり、領域の大きさや形が異なりますが、xnumとynumは20から80までの10ごと」は領域の大きさに合わせて適宜調整してもらえますでしょうか。計算量が多くなるようでしたら、15グリッドごとのようにグリッド数を減らしても大丈夫です。よろしくお願いいたします。
kobayashi_yusukeWednesday, August 26th, 2020 at 8:06:06 PM GMT+09:00
@takao-y
吉兼先生
お返事ありがとうございます。吉兼先生のご意見を踏まえ、領域の大きさにあわせ以下のように設定しました。134グリッドある場合につきましては15グリッドごとにし、領域が100より小さい場合にはそれに合わせて減らしました。
siteAのメッシュ数 (x,y)= (100,134)
パラメータ
x='20 30 40 50 60 70 80'
y='20 35 50 65 80 95 110'
siteBのメッシュ数 (x,y)= (117,134)
パラメータ
x='20 30 40 50 60 70 80'
y='20 35 50 65 80 95 110'
siteCのメッシュ数 (x,y)= (100,100)
パラメータ
x='20 30 40 50 60 70 80'
y='20 30 40 50 60 70 80'
siteDのメッシュ数 (x,y)= (100,84)
パラメータ
x='20 30 40 50 60 70 80'
y='20 30 40 50 60 70'
siteEのメッシュ数 (x,y)= (84,84)
パラメータ
x='20 30 40 50 60 70'
y='20 30 40 50 60 70'
こちらで行いたいと考えております。
以上、よろしくお願いいたします。
kobayashi_yusukeFriday, August 28th, 2020 at 4:45:04 PM GMT+09:00
@takao-y
吉兼先生
現状のご報告をいたします。
上記のパラメータでそれぞれのsiteで動かしたところ不具合が発生し、その対応を行っております。不具合が解消し、ガンマの結果が出た時点で、結果が出たところから吉兼先生にその結果のグラフをご報告いたします。そしてその時点で、ガンマのパラメータの決定と次のパラメータにつきましてご相談させてください。
よろしくお願いいたします。
吉兼先生
現状のご報告をいたします。
上記のパラメータでそれぞれのsiteで動かしたところ不具合が発生し、その対応を行っております。不具合が解消し、ガンマの結果が出た時点で、結果が出たところから吉兼先生にその結果のグラフをご報告いたします。そしてその時点で、ガンマのパラメータの決定と次のパラメータにつきましてご相談させてください。
よろしくお願いいたします。
takao-yTuesday, September 1st, 2020 at 9:30:26 AM GMT+09:00
@kobayashi_yusuke
小林様
もしよろしければ、不具合の内容を共有していただけますでしょうか。
小林様
もしよろしければ、不具合の内容を共有していただけますでしょうか。
kobayashi_yusukeTuesday, September 1st, 2020 at 1:56:42 PM GMT+09:00
@takao-y
吉兼先生
ご連絡ありがとうございます。
弊財団で作成したMSM,解析雨量のデータセットから指定された位置での学習、そしてパラメータごとの精度を出すことを行っております。
その作業におきまして、現在の不具合は、MSM,解析雨量のデータセットから読み込む場所および指定された位置の値の抽出のところで発生しております。現在、Fortranでセグメンテーションフォルトが起きる場合がありその対応を行っております。
このFortranの不具合は弊財団でFortranに詳しいものが修正を行っております。
引き続きよろしくお願いいたします。
吉兼先生
ご連絡ありがとうございます。
弊財団で作成したMSM,解析雨量のデータセットから指定された位置での学習、そしてパラメータごとの精度を出すことを行っております。
その作業におきまして、現在の不具合は、MSM,解析雨量のデータセットから読み込む場所および指定された位置の値の抽出のところで発生しております。現在、Fortranでセグメンテーションフォルトが起きる場合がありその対応を行っております。
このFortranの不具合は弊財団でFortranに詳しいものが修正を行っております。
引き続きよろしくお願いいたします。
takao-yWednesday, September 2nd, 2020 at 8:56:27 AM GMT+09:00
@kobayashi_yusuke
小林様
ありがとうございます。セグメンテーションエラーの多くは、定義した変数の次元が一致していなかったり、ファイル指定が適切でなかったりします。もしよろしければ、フォートランのエラーメッセージを添付してもらえますでしょうか。
小林様
ありがとうございます。セグメンテーションエラーの多くは、定義した変数の次元が一致していなかったり、ファイル指定が適切でなかったりします。もしよろしければ、フォートランのエラーメッセージを添付してもらえますでしょうか。
kobayashi_yusukeWednesday, September 2nd, 2020 at 10:23:51 AM GMT+09:00
@takao-y
吉兼先生
お返事ありがとうございます。フォートランのエラーメッセージを添付します。またエラー発生箇所であるstep01-make_training_data.shも添付します。
直接ご覧になりたい場合には、
/goemon_disk2/trmmauto/AI_GSMaP/tool/ml-region3/ml-region3-check-CUI-siteA/
においておりますのでご覧ください。
siteAはセグメンテーションフォルトの原因となっている配列はmrain2(m,kk)で、kkの値が248の場合に発生します。
しかし必ず発生するわけではなくiyという変数の値が95または110の場合にkkが248になると発生します。
kkの範囲は(1~248),iyは(20,35,50,65,80,95,110)サンプルのynumの座標です。ynumはsiteAの大きさに応じて変更しております。
kk,iyの値はいずれも必ず処理する値で、なぜこの組み合わせになった場合だけセグメンテーションフォルトになるのかは分かっておりません。
auto-check.shのynumは以下のように修正しております。
xnums='020 030 040 050 060 070 080'
ynums='020 035 050 065 080 095 110'
原因がわかりましたらご教授いただけると大変ありがたく思います。
以上、よろしくお願いいたします。
takao-yWednesday, September 2nd, 2020 at 11:22:20 AM GMT+09:00
@kobayashi_yusuke
小林様。ynums=110の時にセグメンエラーになっているので、恐らくこれは選択した領域の外側になっていると思われます。確認をお願いいたします。
小林様。ynums=110の時にセグメンエラーになっているので、恐らくこれは選択した領域の外側になっていると思われます。確認をお願いいたします。
kobayashi_yusukeWednesday, September 2nd, 2020 at 11:27:09 AM GMT+09:00
@takao-y
吉兼先生
ありがとうございます。確認いたします。
吉兼先生
ありがとうございます。確認いたします。
takao-yThursday, September 3rd, 2020 at 10:17:18 AM GMT+09:00
@kobayashi_yusuke
小林様。確認の結果はいかがでしょうか。例えば、ynums の110を削除する、もしくは96などに変更して試してみると手っ取り早いかと思います。それから、フォートランのwarningが多くて見にくいので、warningをoffにした方が良いかもしれません。
小林様。確認の結果はいかがでしょうか。例えば、ynums の110を削除する、もしくは96などに変更して試してみると手っ取り早いかと思います。それから、フォートランのwarningが多くて見にくいので、warningをoffにした方が良いかもしれません。
kobayashi_yusukeThursday, September 3rd, 2020 at 10:38:20 AM GMT+09:00
@takao-y
吉兼先生
ご連絡ありがとうございます。今回の修正はFortranとshellに詳しいものが担当しているのですが、全国を5領域に分けたMSM,解析雨量を読み込むための修正(大きさが異なる、ハイパーパラメター解析対象地点の変更等)により、このセグメンテーションフォルトだけでなく、全体的に修正が必要になってくると考えております。今、その確認をお願いしておりますので、その進捗を随時ご報告いたします。
よろしくお願いいたします。
吉兼先生
ご連絡ありがとうございます。今回の修正はFortranとshellに詳しいものが担当しているのですが、全国を5領域に分けたMSM,解析雨量を読み込むための修正(大きさが異なる、ハイパーパラメター解析対象地点の変更等)により、このセグメンテーションフォルトだけでなく、全体的に修正が必要になってくると考えております。今、その確認をお願いしておりますので、その進捗を随時ご報告いたします。
よろしくお願いいたします。
takao-yThursday, September 3rd, 2020 at 10:57:52 AM GMT+09:00
@kobayashi_yusuke
小林様。現時点の作業はハイパーパラメータを決めるための過程ですので、あまり難しく考えずにそれぞれの領域で臨機応変に対応していただければ問題ないかと思います。基本的にはxnums,ynumsを調整すれば済むと思います。あるいは何か別の問題があるのでしょうか。詳細に教えていただけますでしょうか。
小林様。現時点の作業はハイパーパラメータを決めるための過程ですので、あまり難しく考えずにそれぞれの領域で臨機応変に対応していただければ問題ないかと思います。基本的にはxnums,ynumsを調整すれば済むと思います。あるいは何か別の問題があるのでしょうか。詳細に教えていただけますでしょうか。
kobayashi_yusukeThursday, September 3rd, 2020 at 11:18:29 AM GMT+09:00
@takao-y
吉兼先生
お返事ありがとうございます。臨機応変の対応承知しました。現在問題は、吉兼先生からいただいたサンプルのMSM、レーダのデータを弊財団で作成した全国5領域に区切ったMSM、解析雨量に切り替えて結果を出すというところです。もちろん、セグメンテーションフォールトのようにxnum,ynumで不具合を起こしているというのもございます。
y=110で選択した領域の外側とのことでしたので、一旦これを外した以下のパラメータで動かしてみたいと思います。
アドアイスありがとうございます。
siteAのメッシュ数 (x,y)= (100,134)
パラメータ
x='20 30 40 50 60 70 80'
y='20 35 50 65 80 95'
siteBのメッシュ数 (x,y)= (117,134)
パラメータ
x='20 30 40 50 60 70 80'
y='20 35 50 65 80 95'
siteCのメッシュ数 (x,y)= (100,100)
パラメータ
x='20 30 40 50 60 70 80'
y='20 30 40 50 60 70 80'
siteDのメッシュ数 (x,y)= (100,84)
パラメータ
x='20 30 40 50 60 70 80'
y='20 30 40 50 60 70'
siteEのメッシュ数 (x,y)= (84,84)
パラメータ
x='20 30 40 50 60 70'
y='20 30 40 50 60 70'
takao-yThursday, September 3rd, 2020 at 4:23:20 PM GMT+09:00
@kobayashi_yusuke
小林様。ありがとうございます。承知いたしました。5つの領域について、同時平行RUNができれば短時間で終わると思いますが、そちらの環境では可能でしょうか。同じファイルシステム内で、4RUN程度であれば問題なく作動すると思います。よろしくお願いいたします。
小林様。ありがとうございます。承知いたしました。5つの領域について、同時平行RUNができれば短時間で終わると思いますが、そちらの環境では可能でしょうか。同じファイルシステム内で、4RUN程度であれば問題なく作動すると思います。よろしくお願いいたします。
kobayashi_yusukeThursday, September 3rd, 2020 at 5:07:47 PM GMT+09:00
@takao-y
吉兼先生
ご連絡ありがとうございます。弊財団で作成した5つの領域のMSMと解析雨量を用いたプログラムが正常に動くようにしましたら上記パラメータで結果を出します。
そしてその際の解析についてですが、2台のマシンを同時に動かせますのでまずそこで分散させます。そしてそれぞれで複数プロセスで動かすことで同時に処理をしたいと考えております。よろしくお願いいたします。
吉兼先生
ご連絡ありがとうございます。弊財団で作成した5つの領域のMSMと解析雨量を用いたプログラムが正常に動くようにしましたら上記パラメータで結果を出します。
そしてその際の解析についてですが、2台のマシンを同時に動かせますのでまずそこで分散させます。そしてそれぞれで複数プロセスで動かすことで同時に処理をしたいと考えております。よろしくお願いいたします。
takao-yFriday, September 4th, 2020 at 1:41:44 PM GMT+09:00
@kobayashi_yusuke
小林様。もし不都合がなければ、終了したものから図を添付していただけますでしょうか。
よろしくお願いいたします。
小林様。もし不都合がなければ、終了したものから図を添付していただけますでしょうか。
よろしくお願いいたします。
kobayashi_yusukeFriday, September 4th, 2020 at 6:13:10 PM GMT+09:00
@takao-y
吉兼先生
ご連絡ありがとうございます。不具合の解消を弊財団でFortranに詳しいものが行っておりました。
プログラムを確認したところ、吉兼先生から頂いたプログラムにおきましてx,yの定義が逆であった箇所があったとのことです。
step01-make_training_data.sh / step01-make_testing_data.sh
のfortranプログラムの最初のところで定義している
parameter (idem2=${ydim},jdim2=${xdim},nn2=249,nn2b=248)
parameter (idem3=${ydim},jdim3=${xdim})
のxdimとydimを逆にして
parameter (idem2=${xdim},jdim2=${ydim},nn2=249,nn2b=248)
parameter (idem3=${xdim},jdim3=${ydim})
としたところ、セグメンテーションフォールトは発生しなくなりました。
これでsiteAを計算をさせており、他に不具合が出ずに結果が出ましたらご連絡いたします。
以上、よろしくお願いいたします。
kobayashi_yusukeFriday, September 4th, 2020 at 6:26:53 PM GMT+09:00
siteD,siteEにつきましては別途計算させておりましたが、Fortranのセグメンテーションフォールトは発生しませんでしたが、
RuntimeWarning: invalid value encountered in true_divide
とどこかで0で割っているためエラーが発生しております。
こちらも別途原因を探り、不具合を修正したいと考えております。
RuntimeWarning: invalid value encountered in true_divide
とどこかで0で割っているためエラーが発生しております。
こちらも別途原因を探り、不具合を修正したいと考えております。
kobayashi_yusukeMonday, September 7th, 2020 at 11:12:07 AM GMT+09:00


@takao-y
吉兼先生
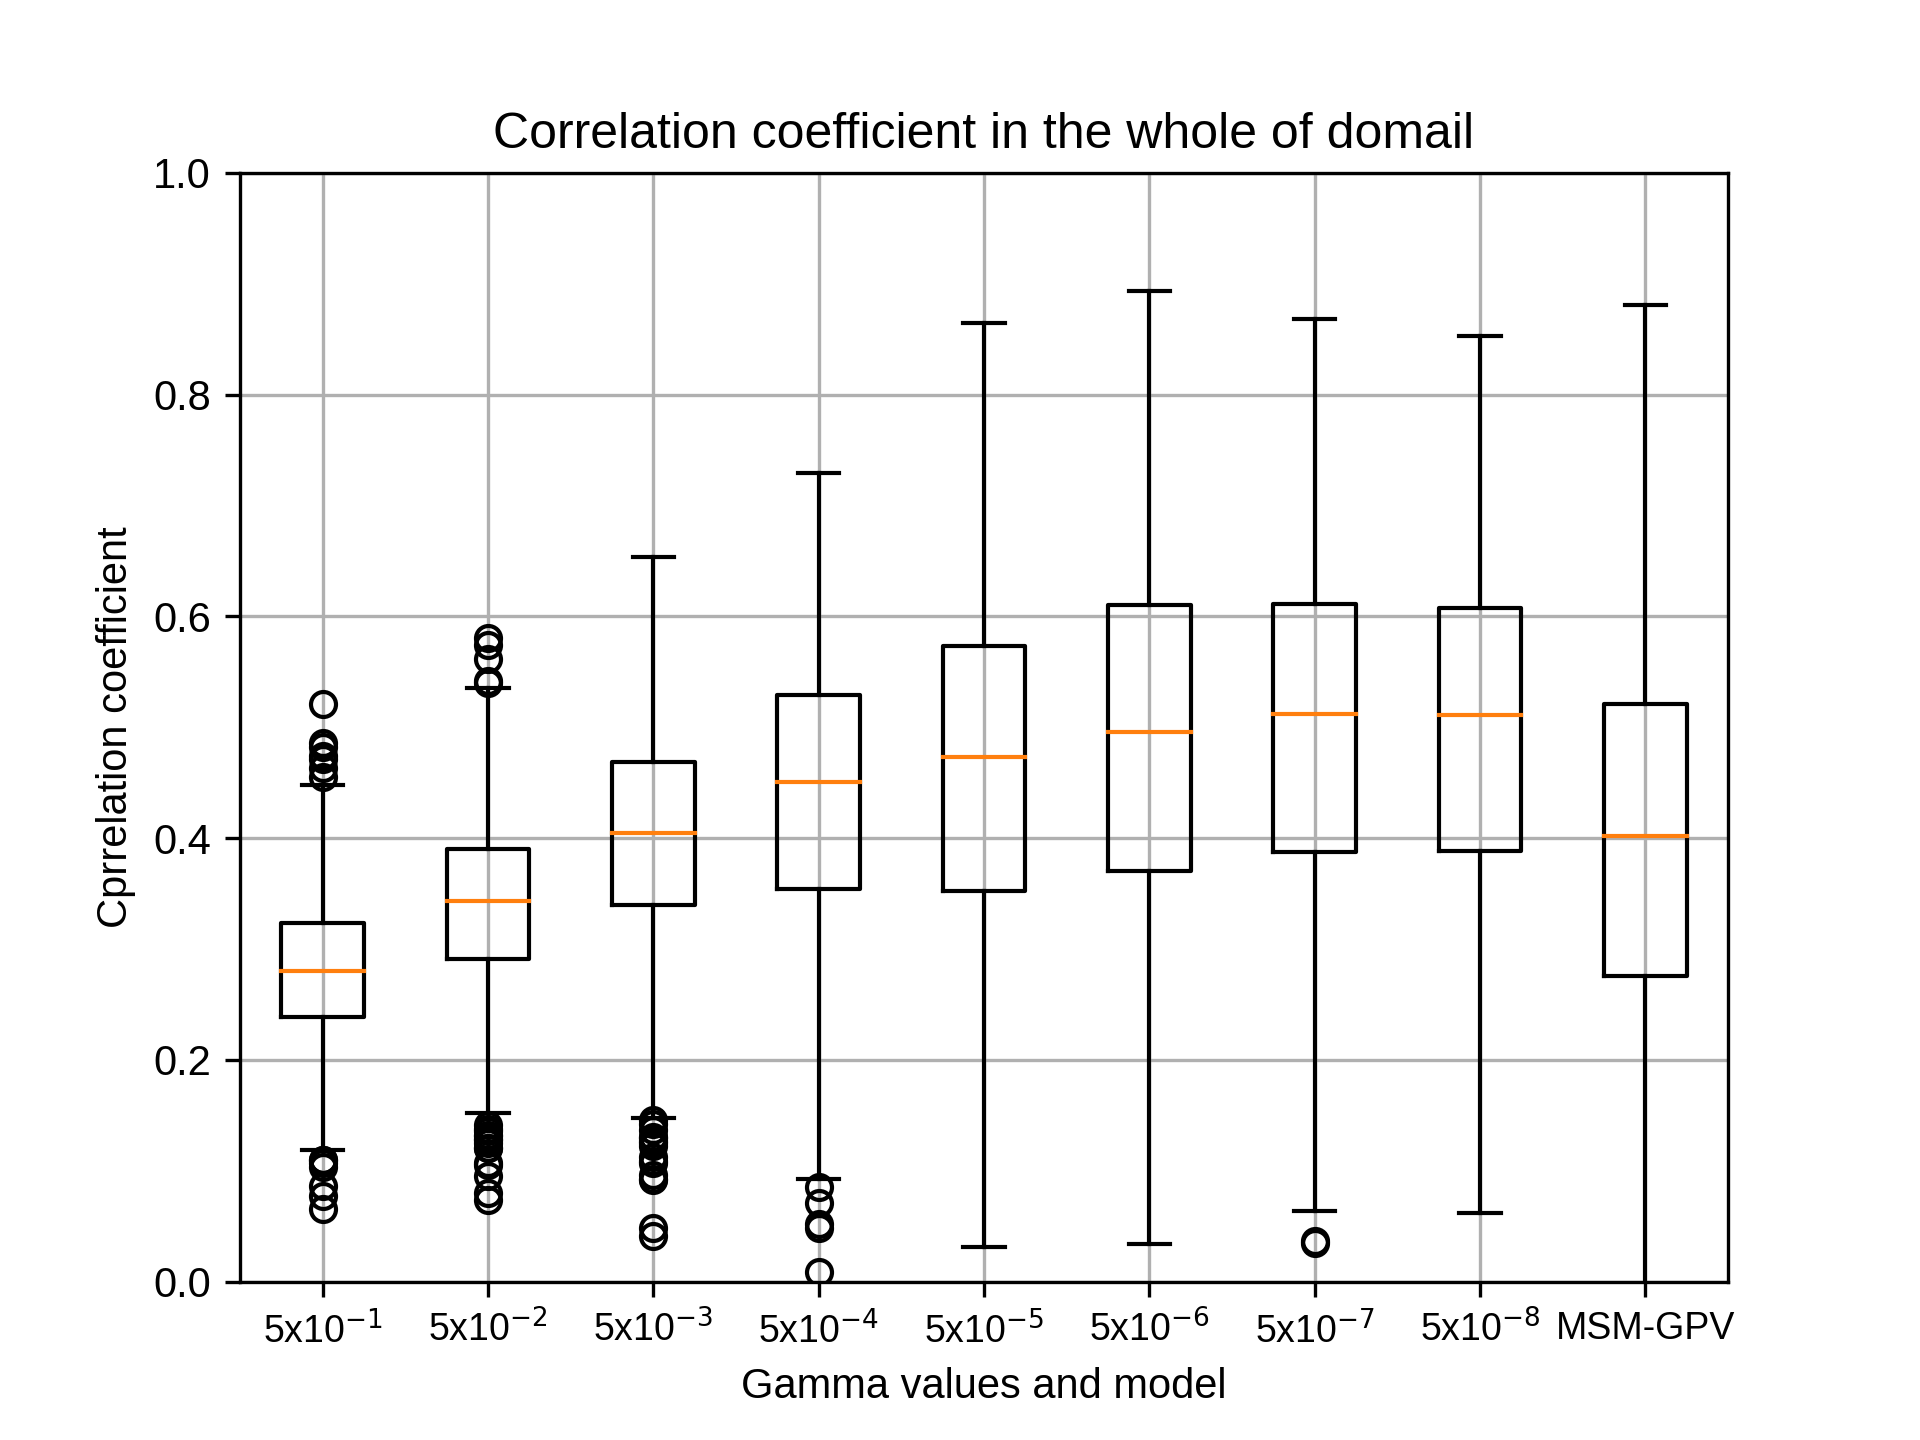
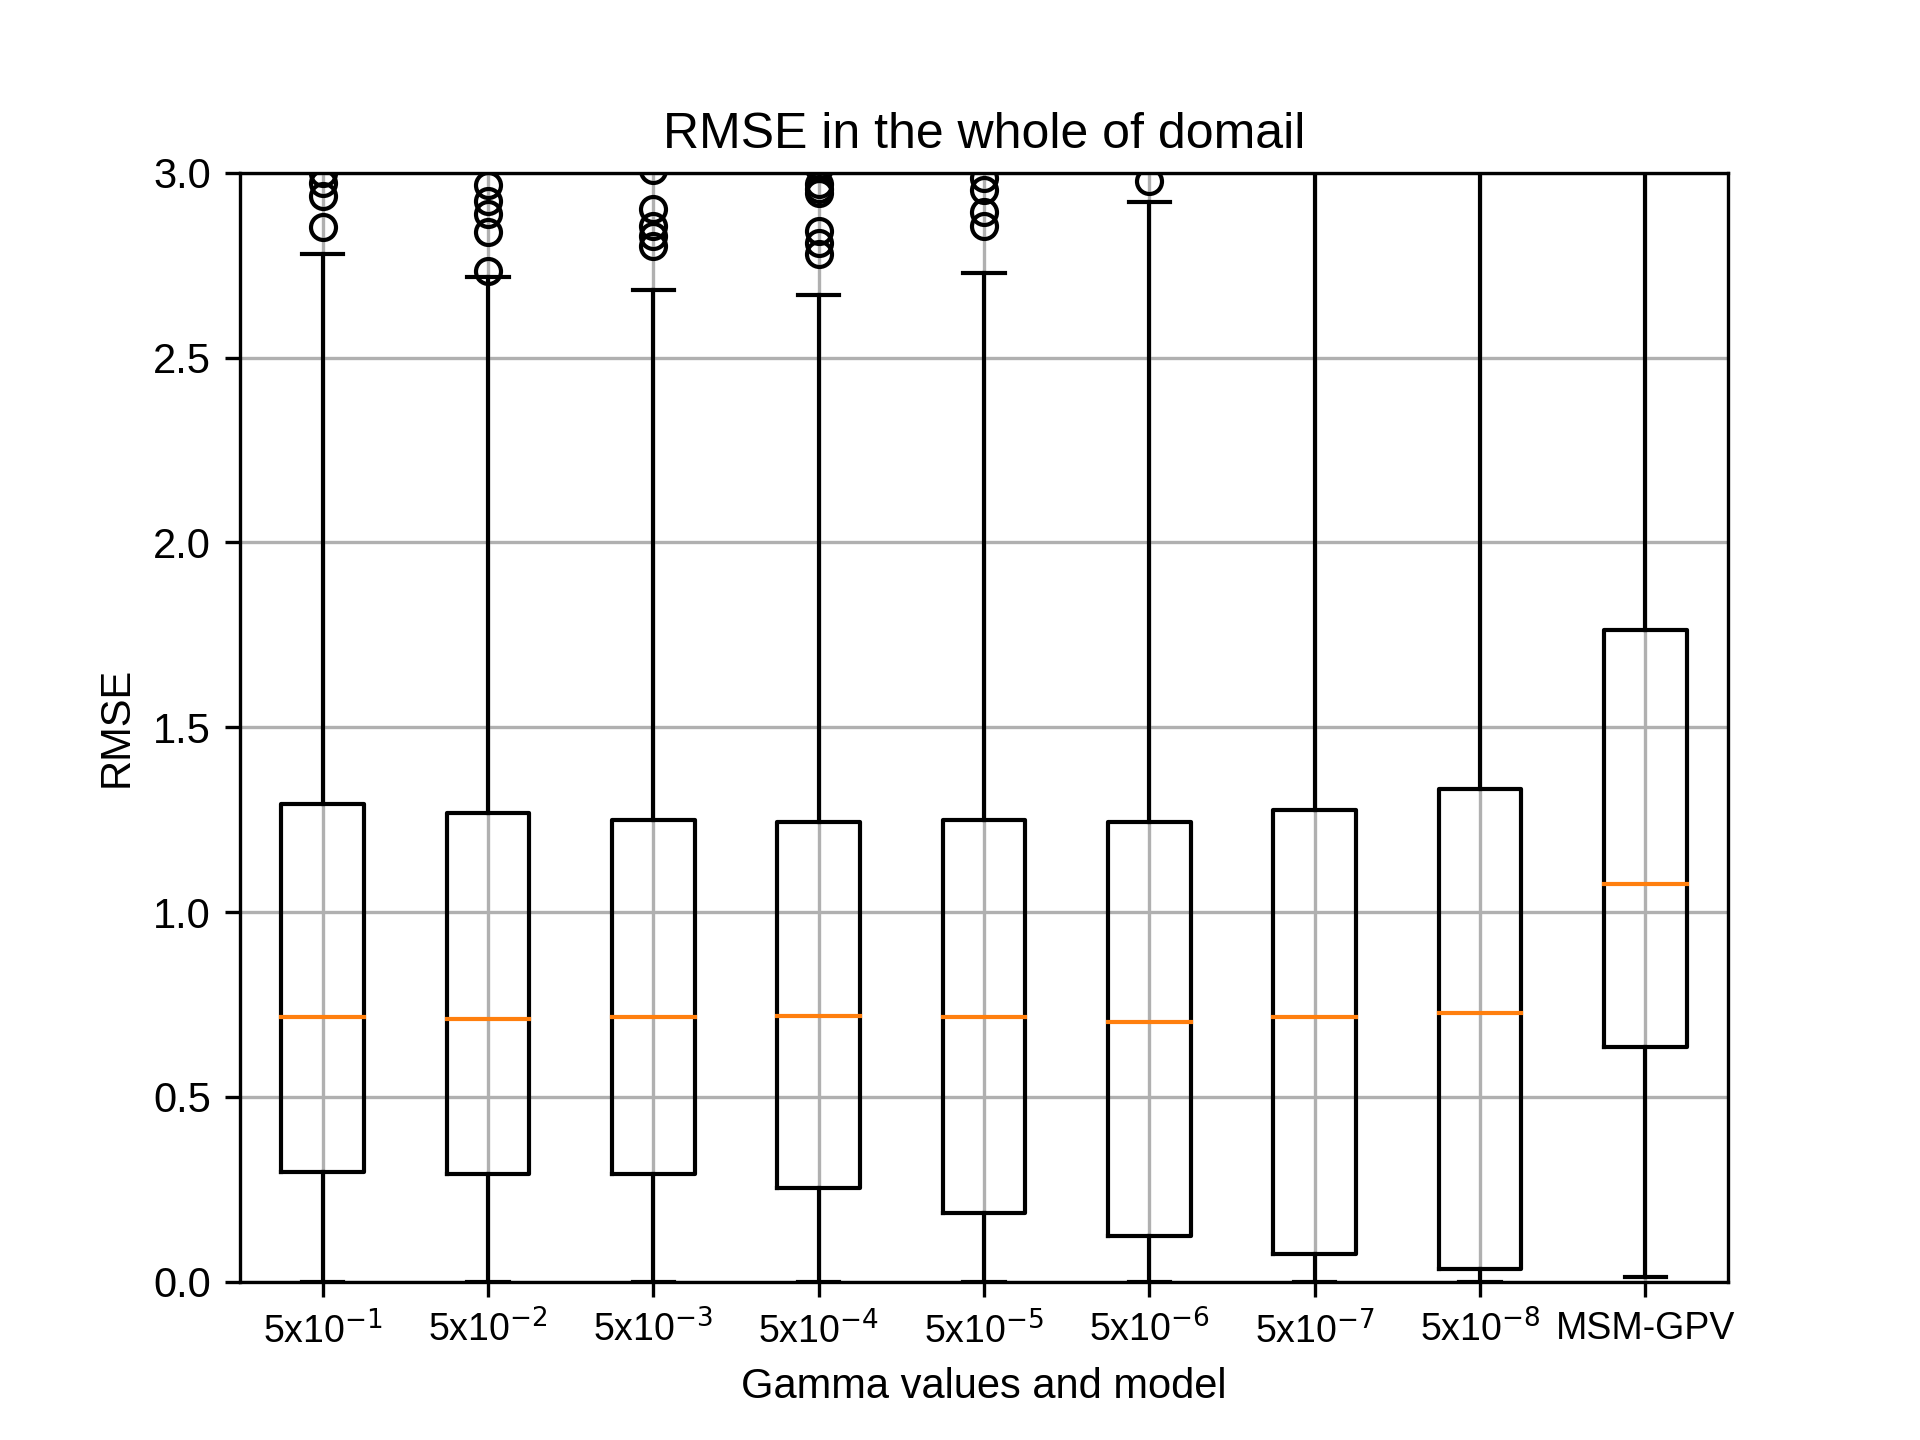
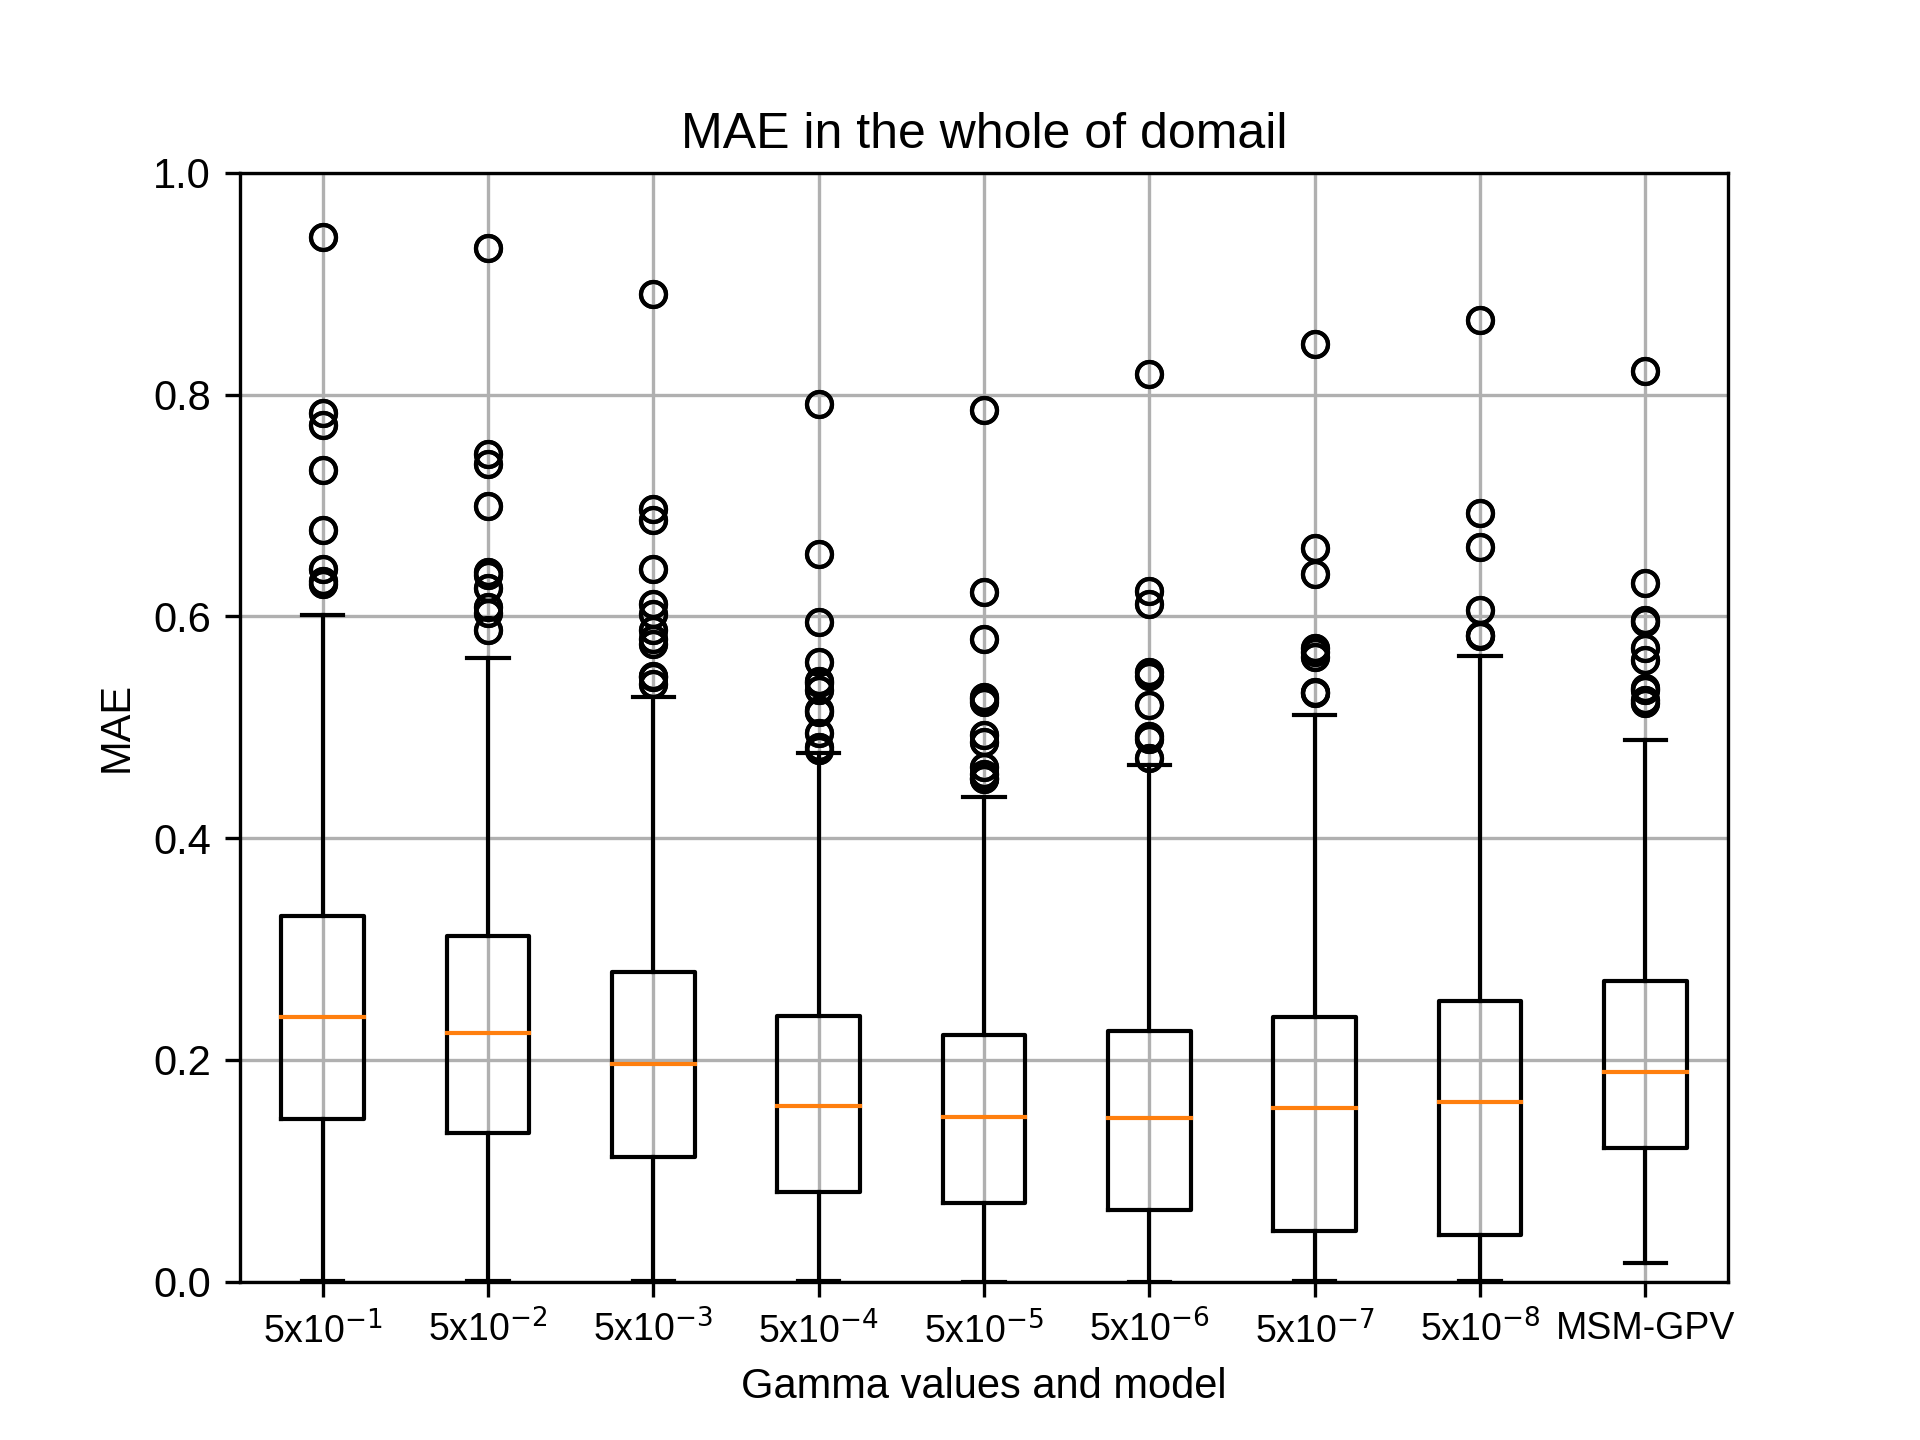
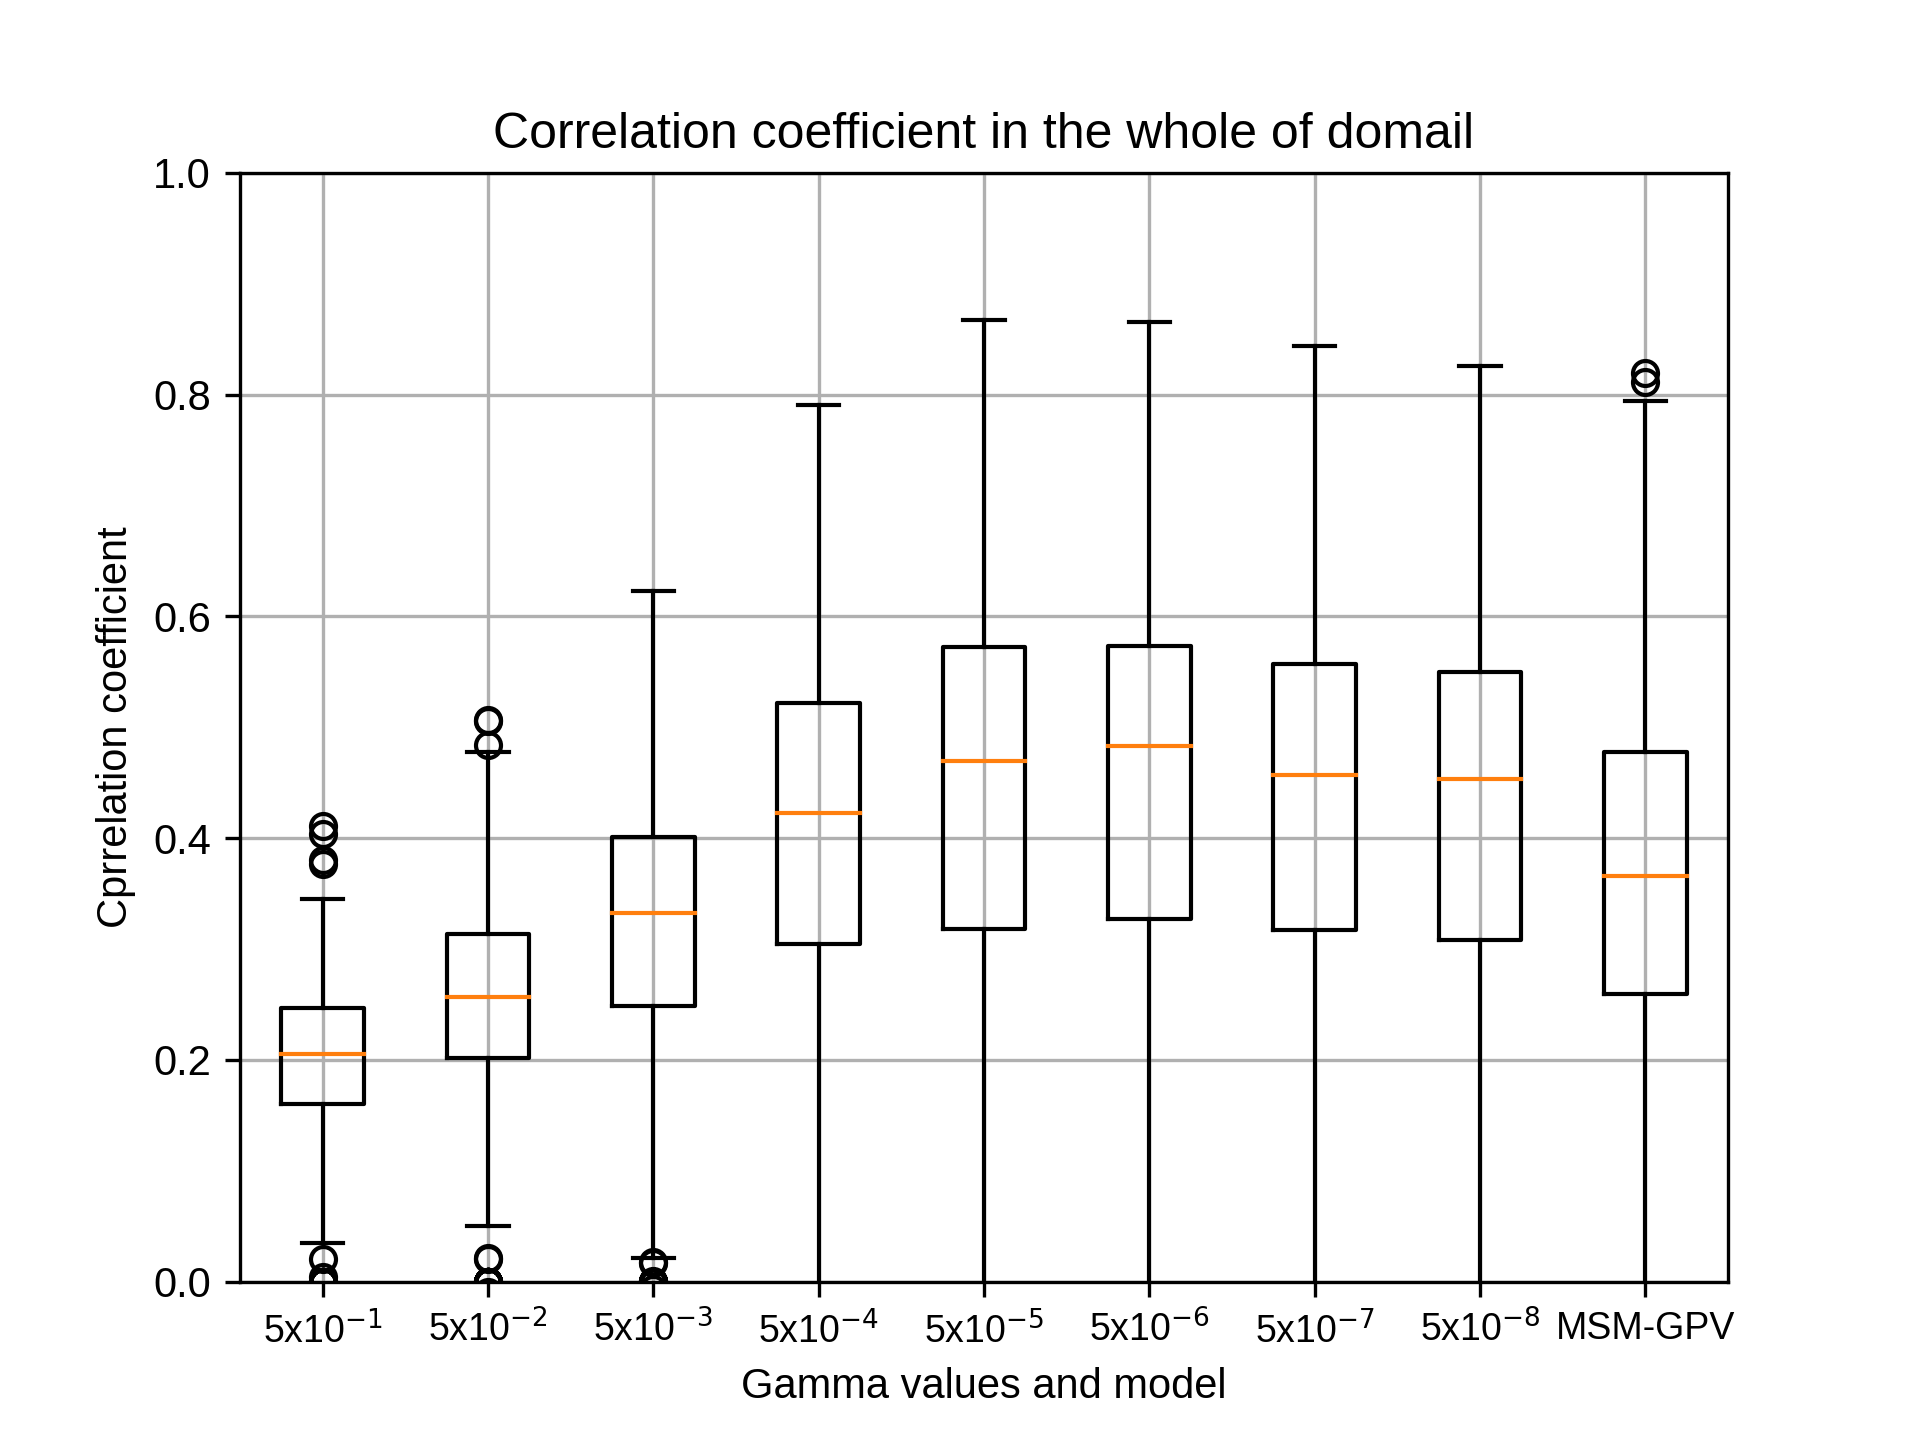
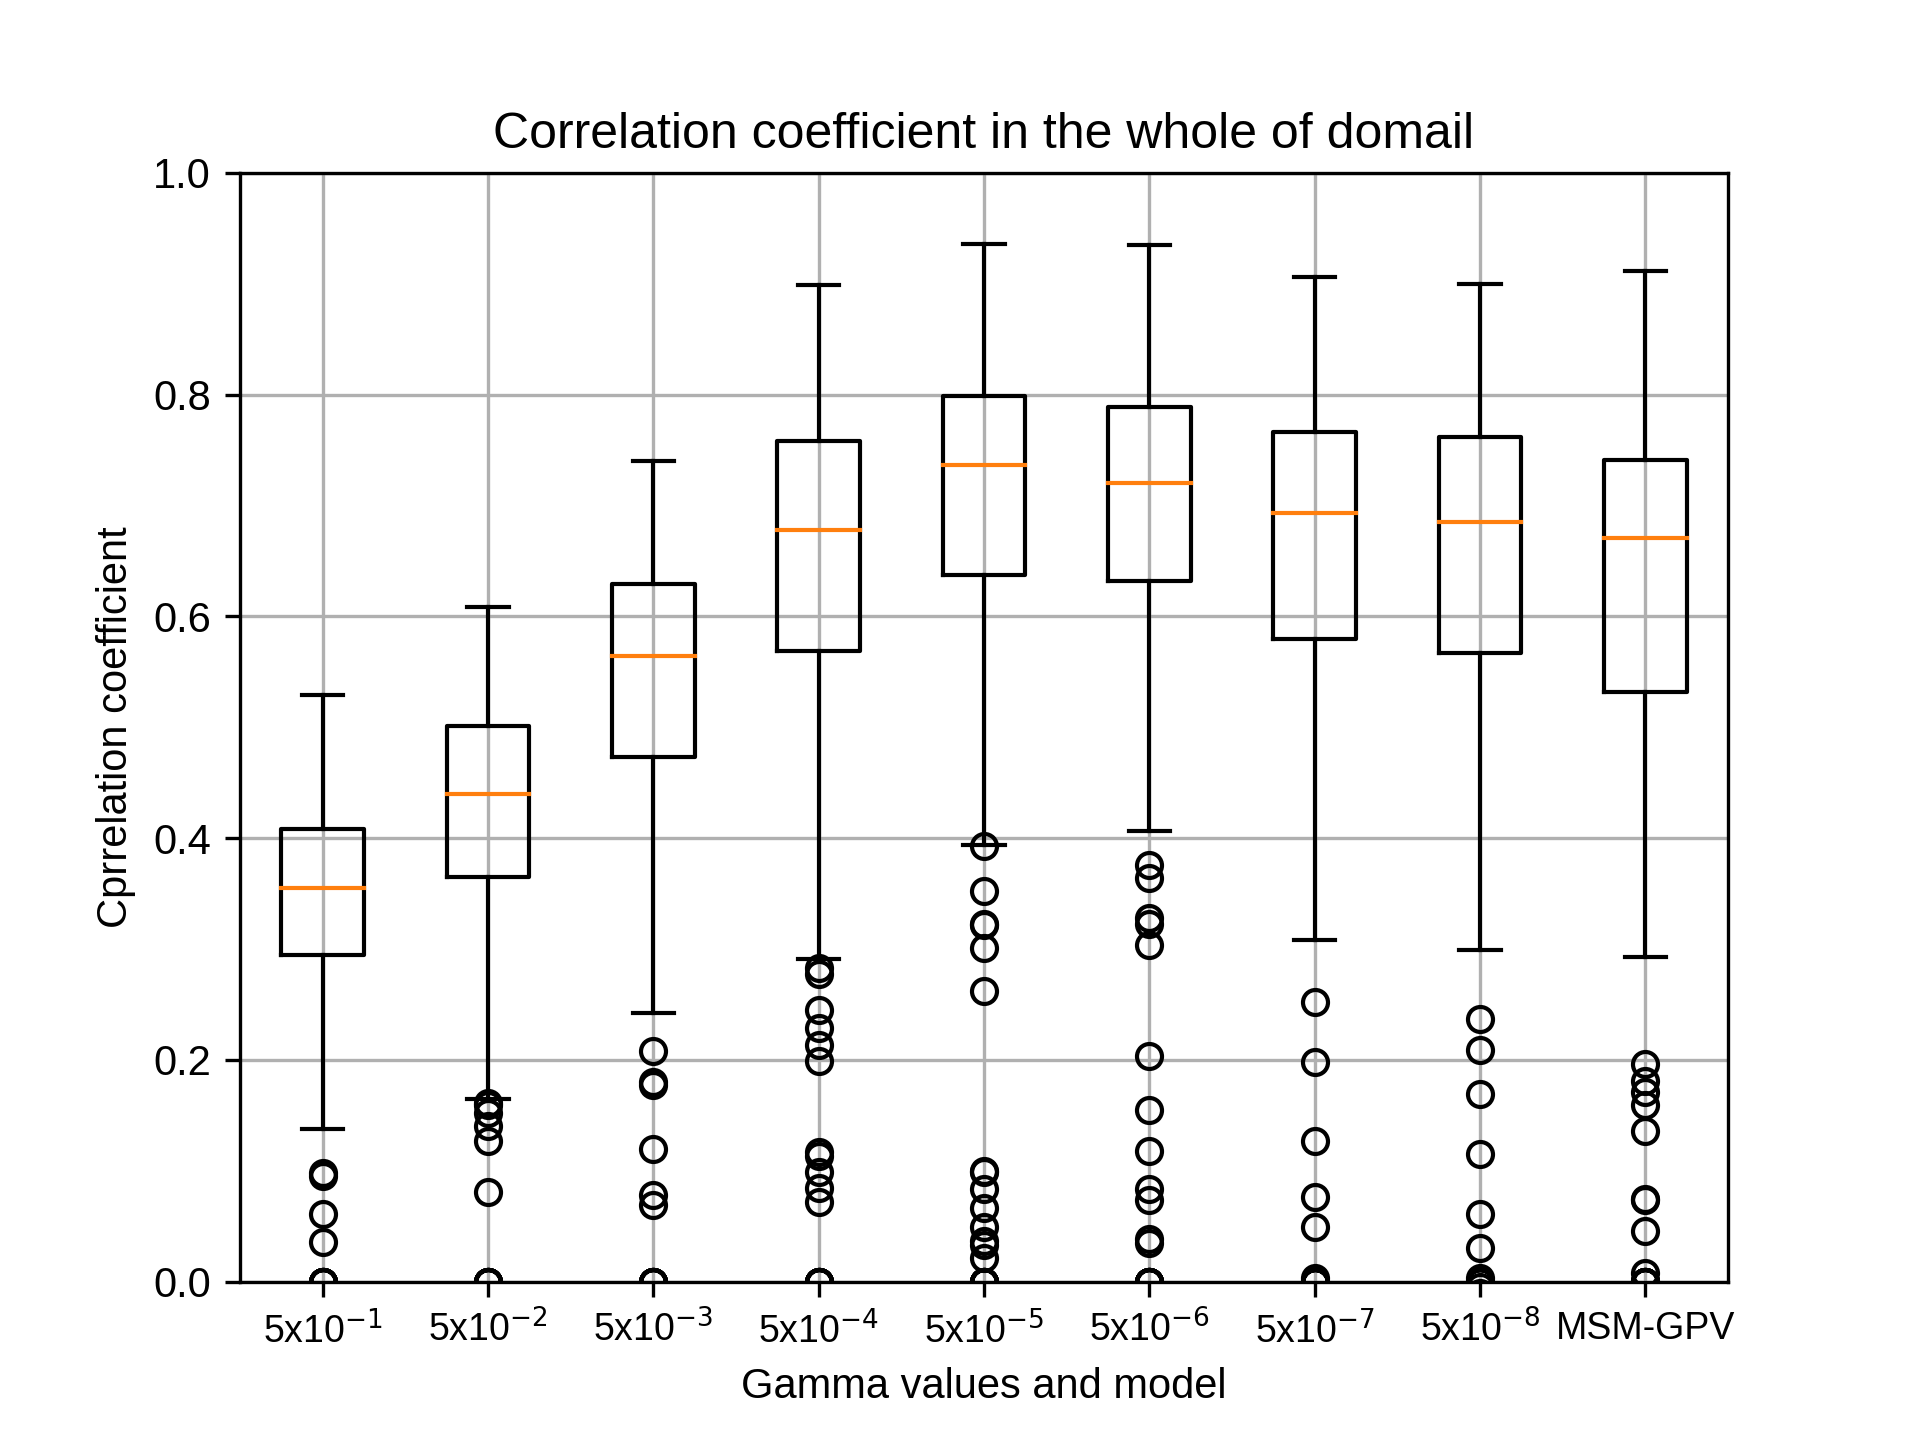
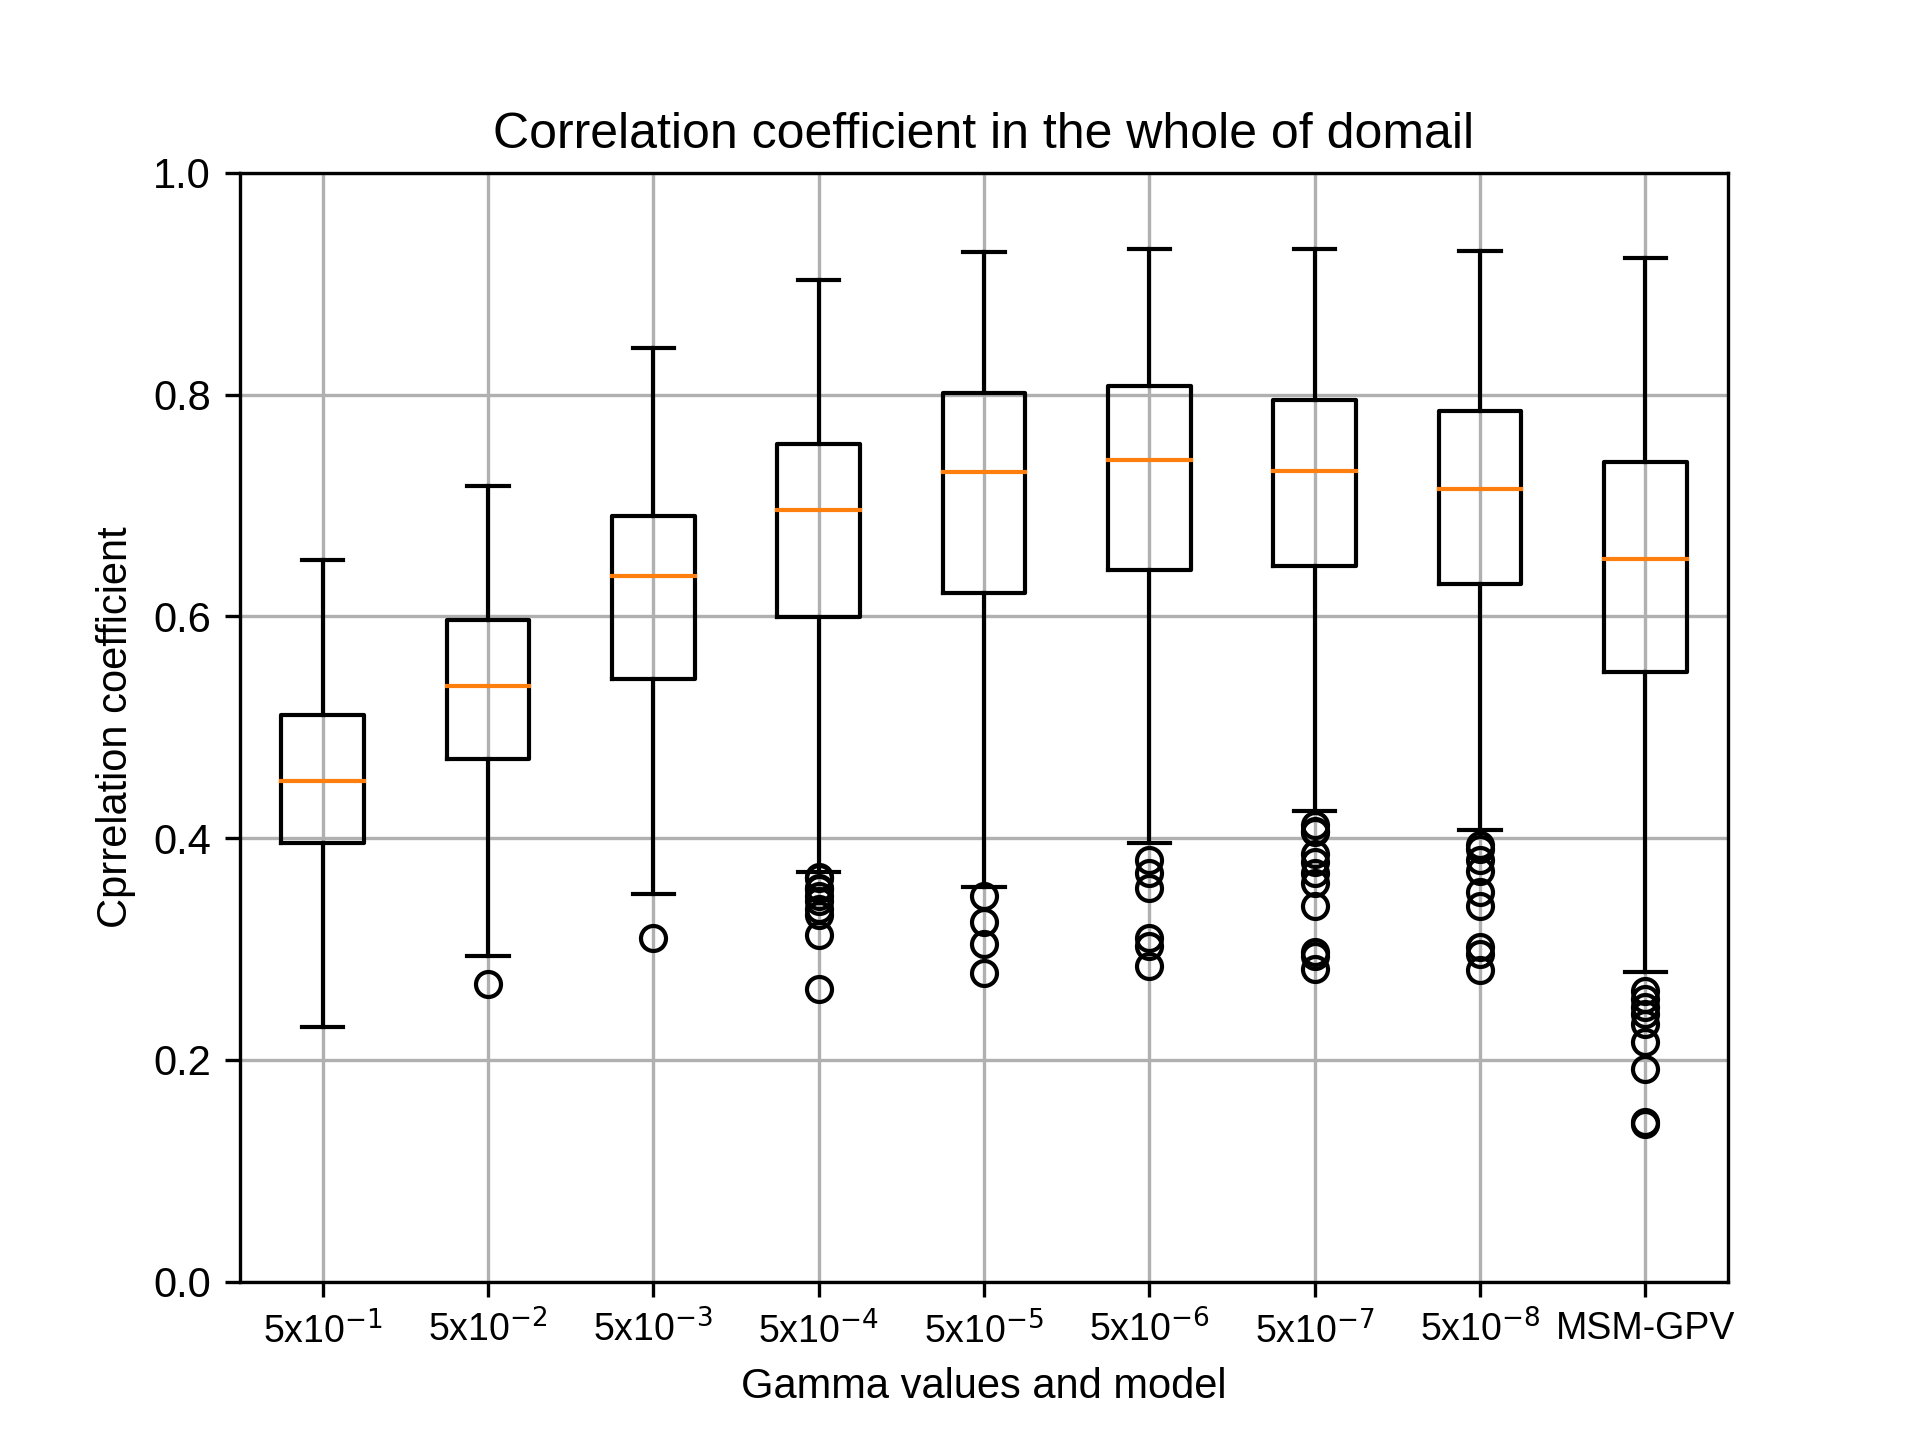
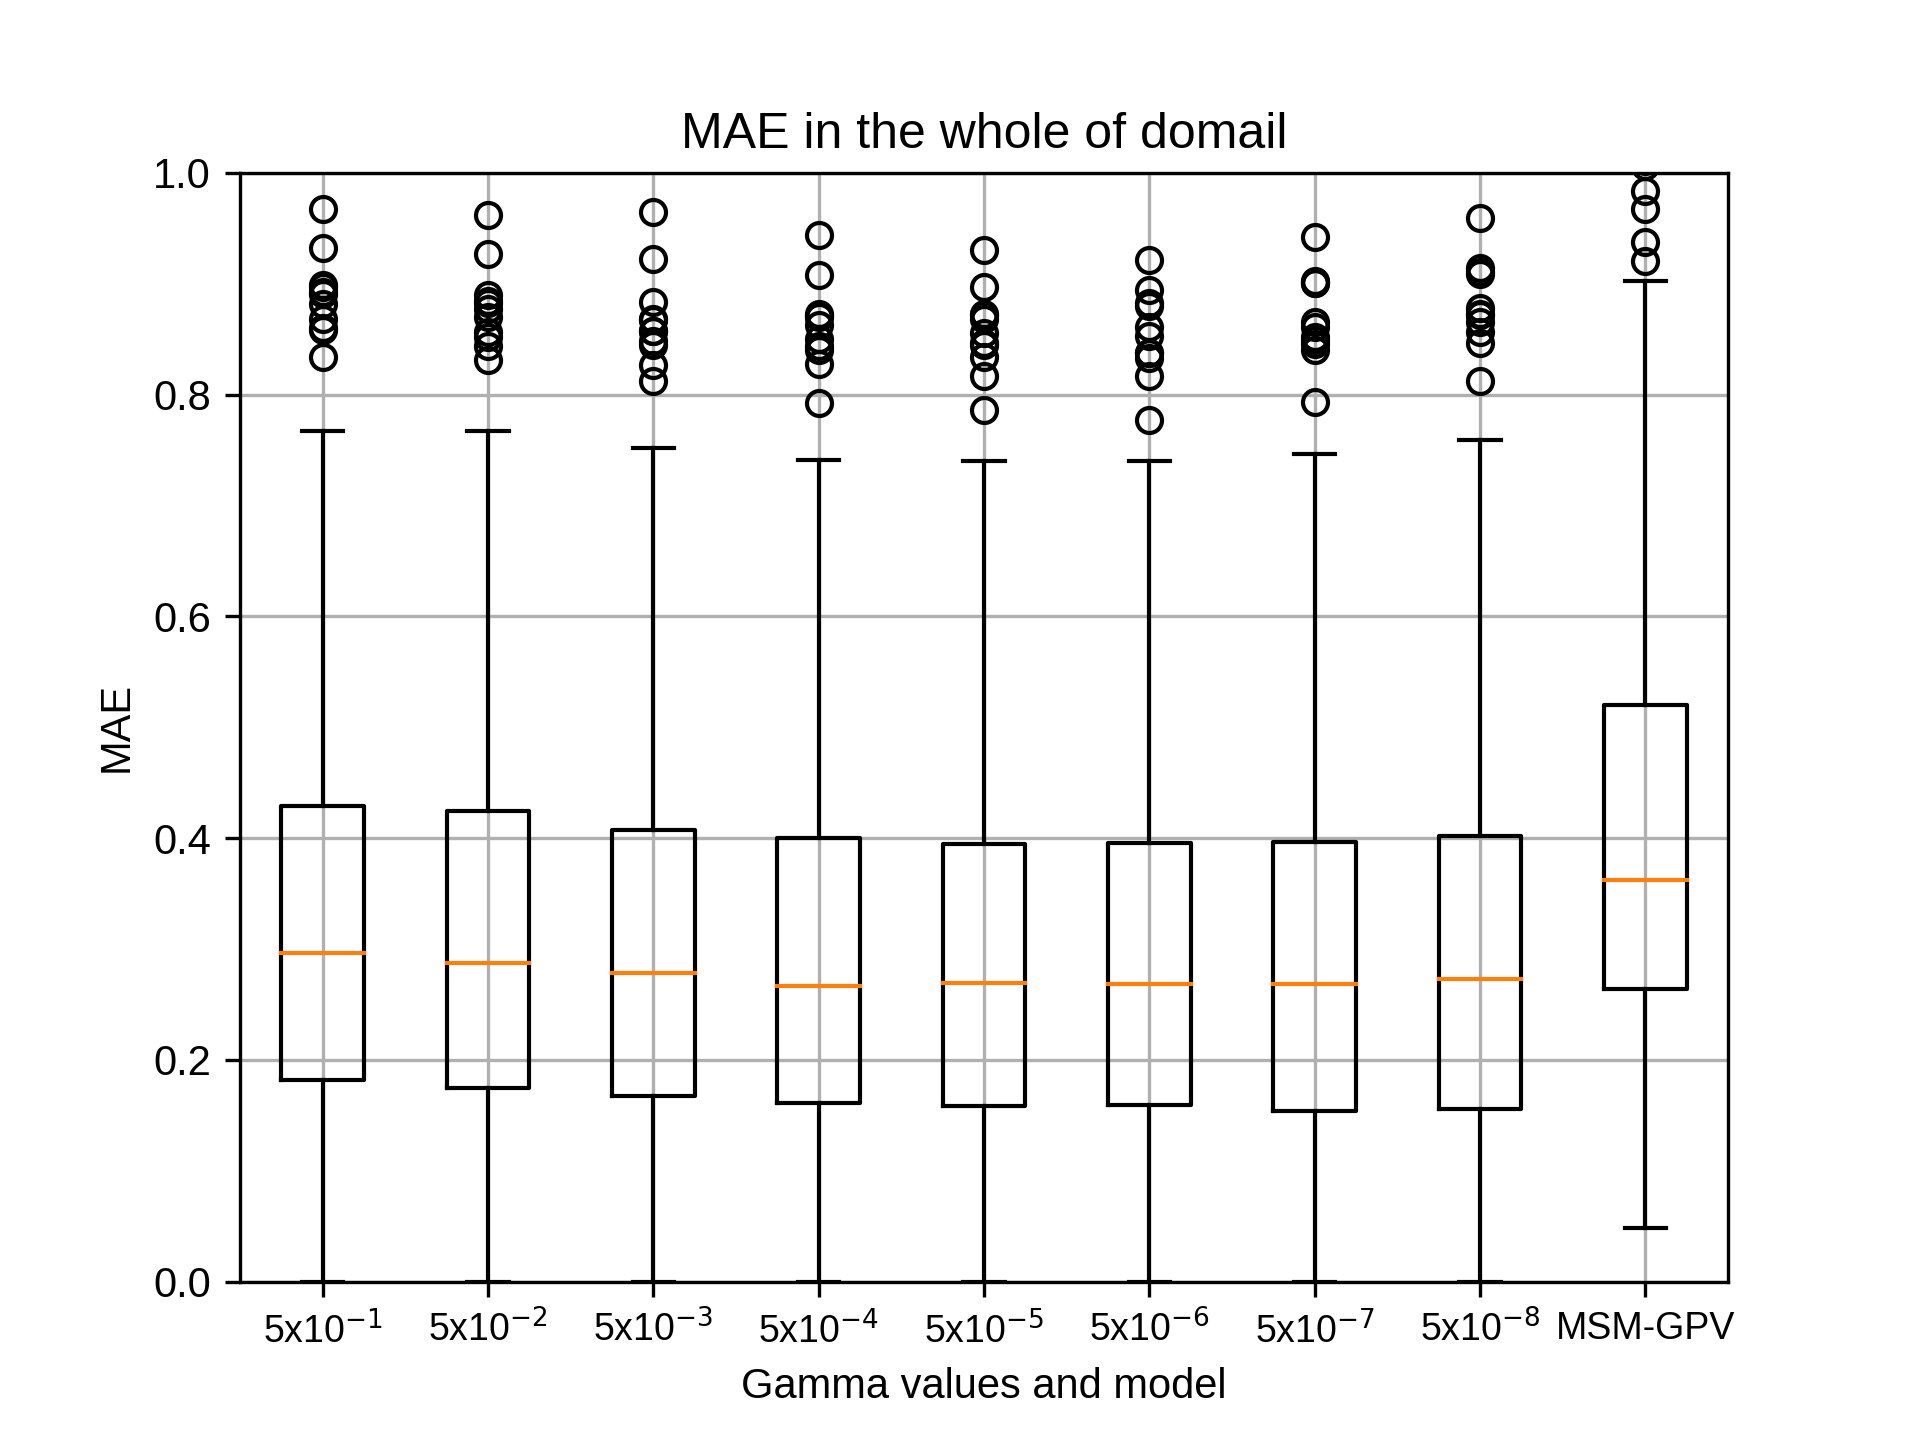
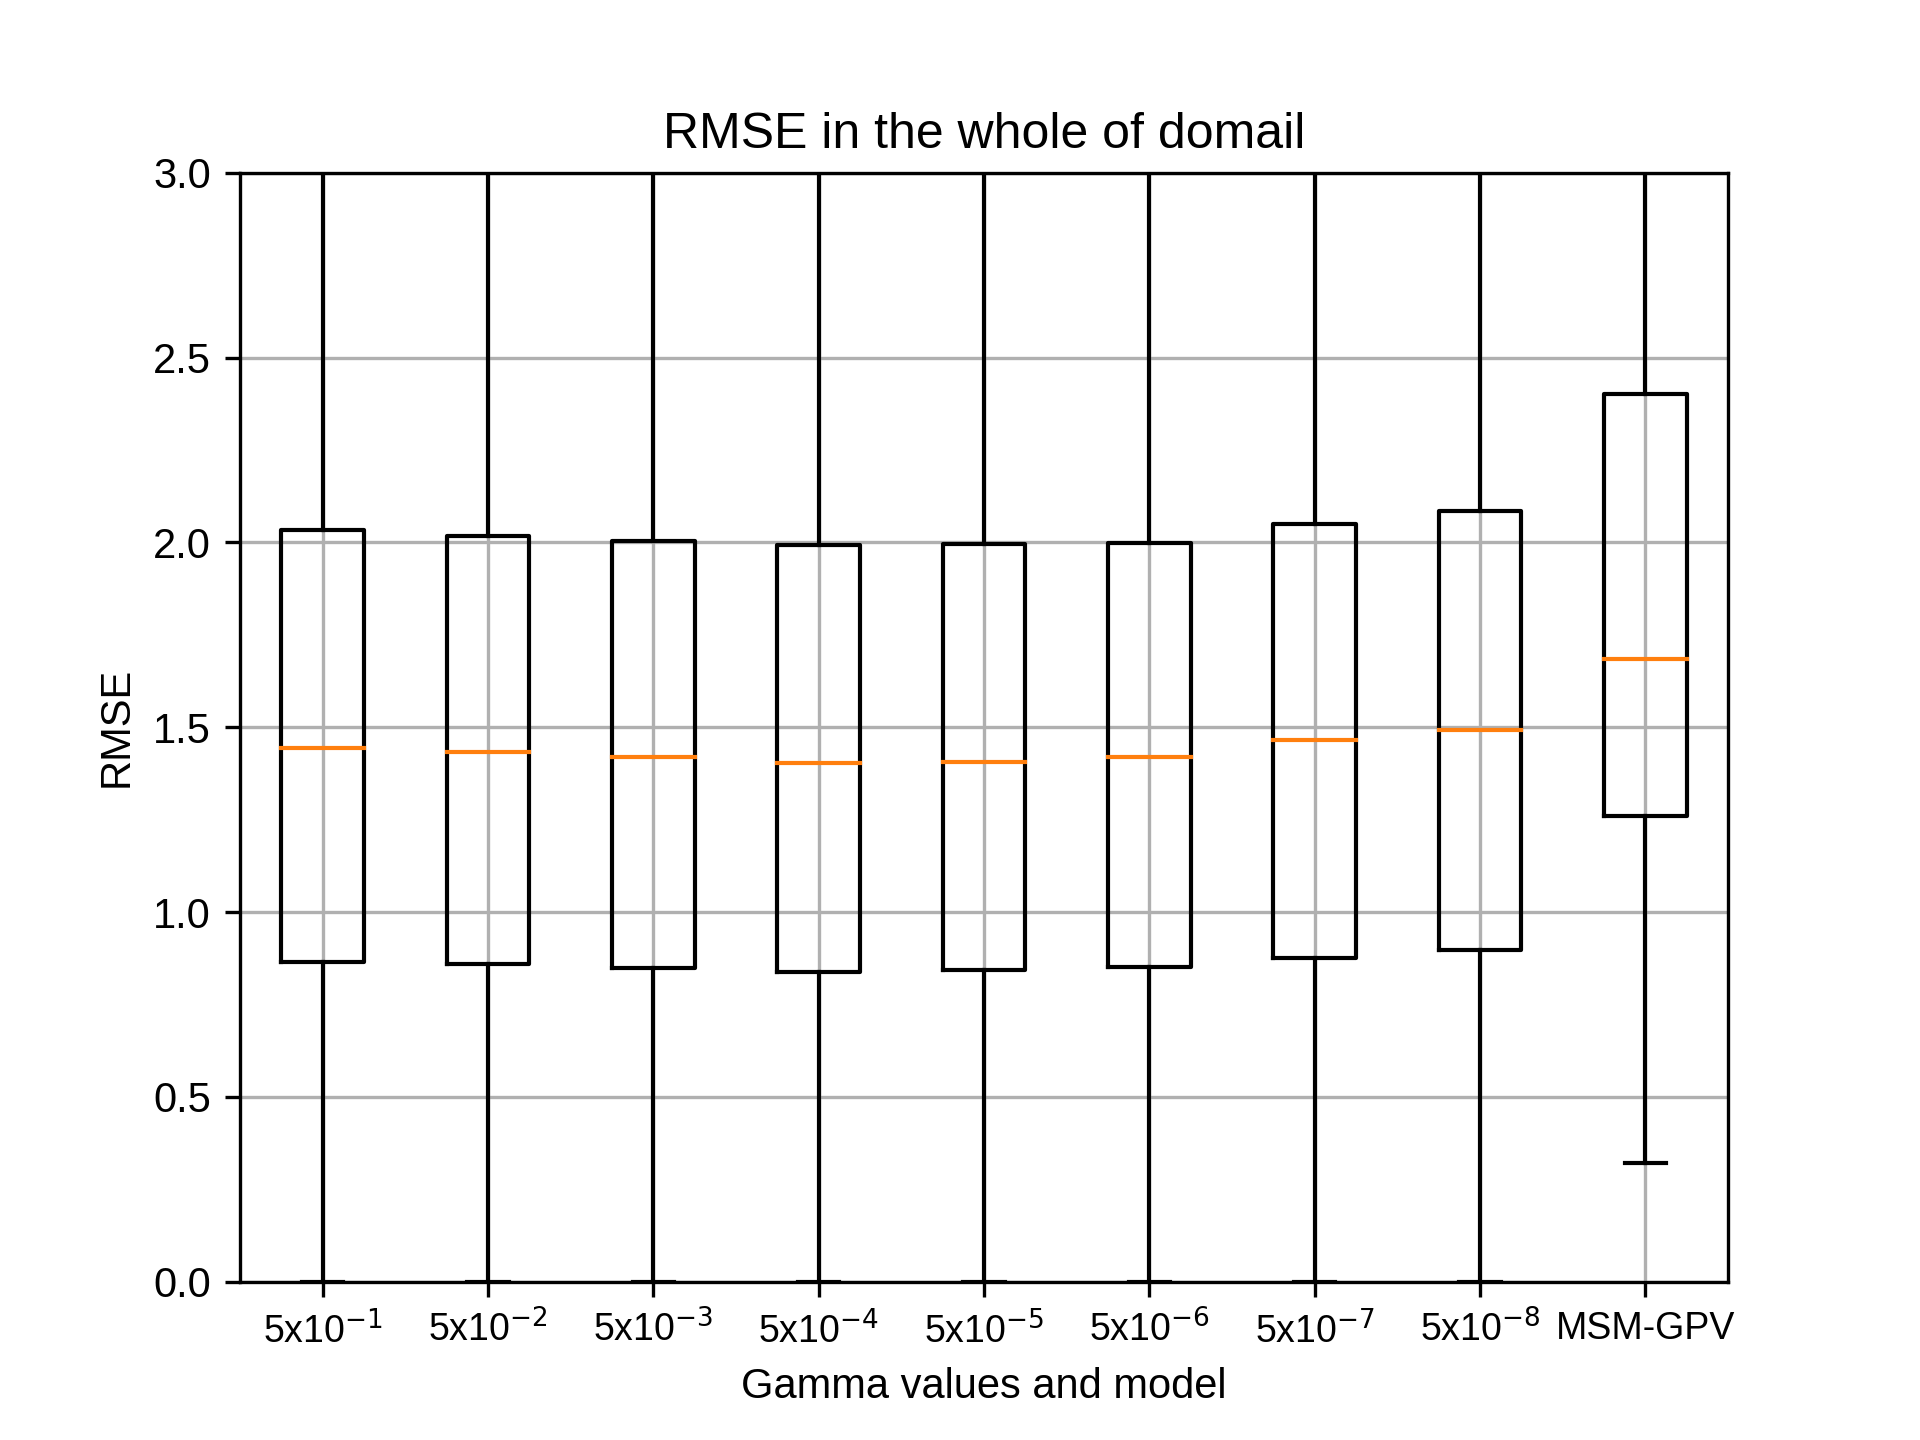
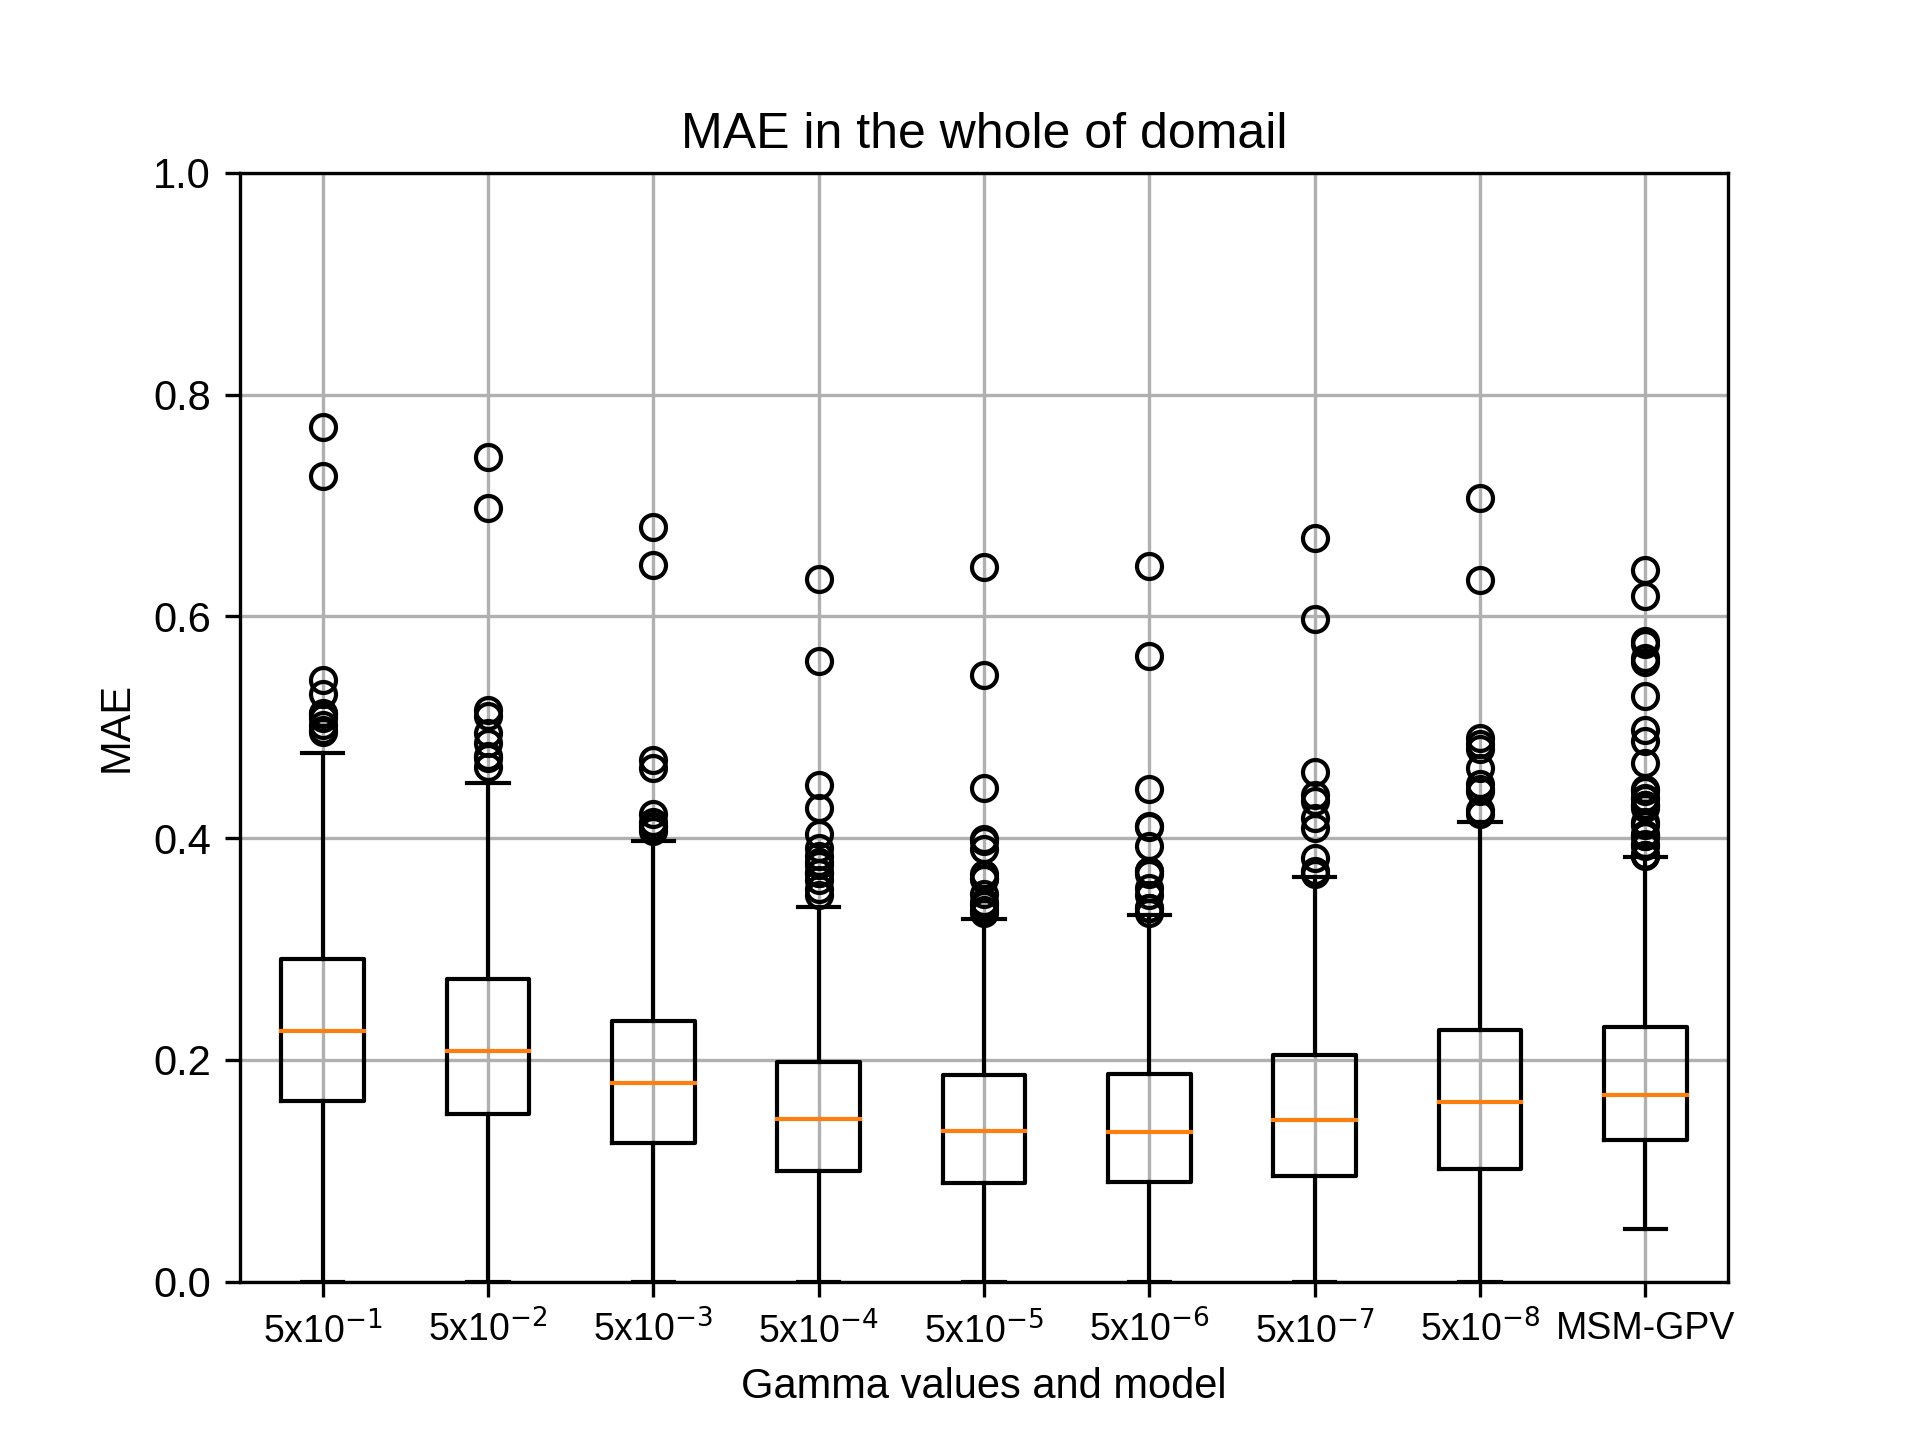
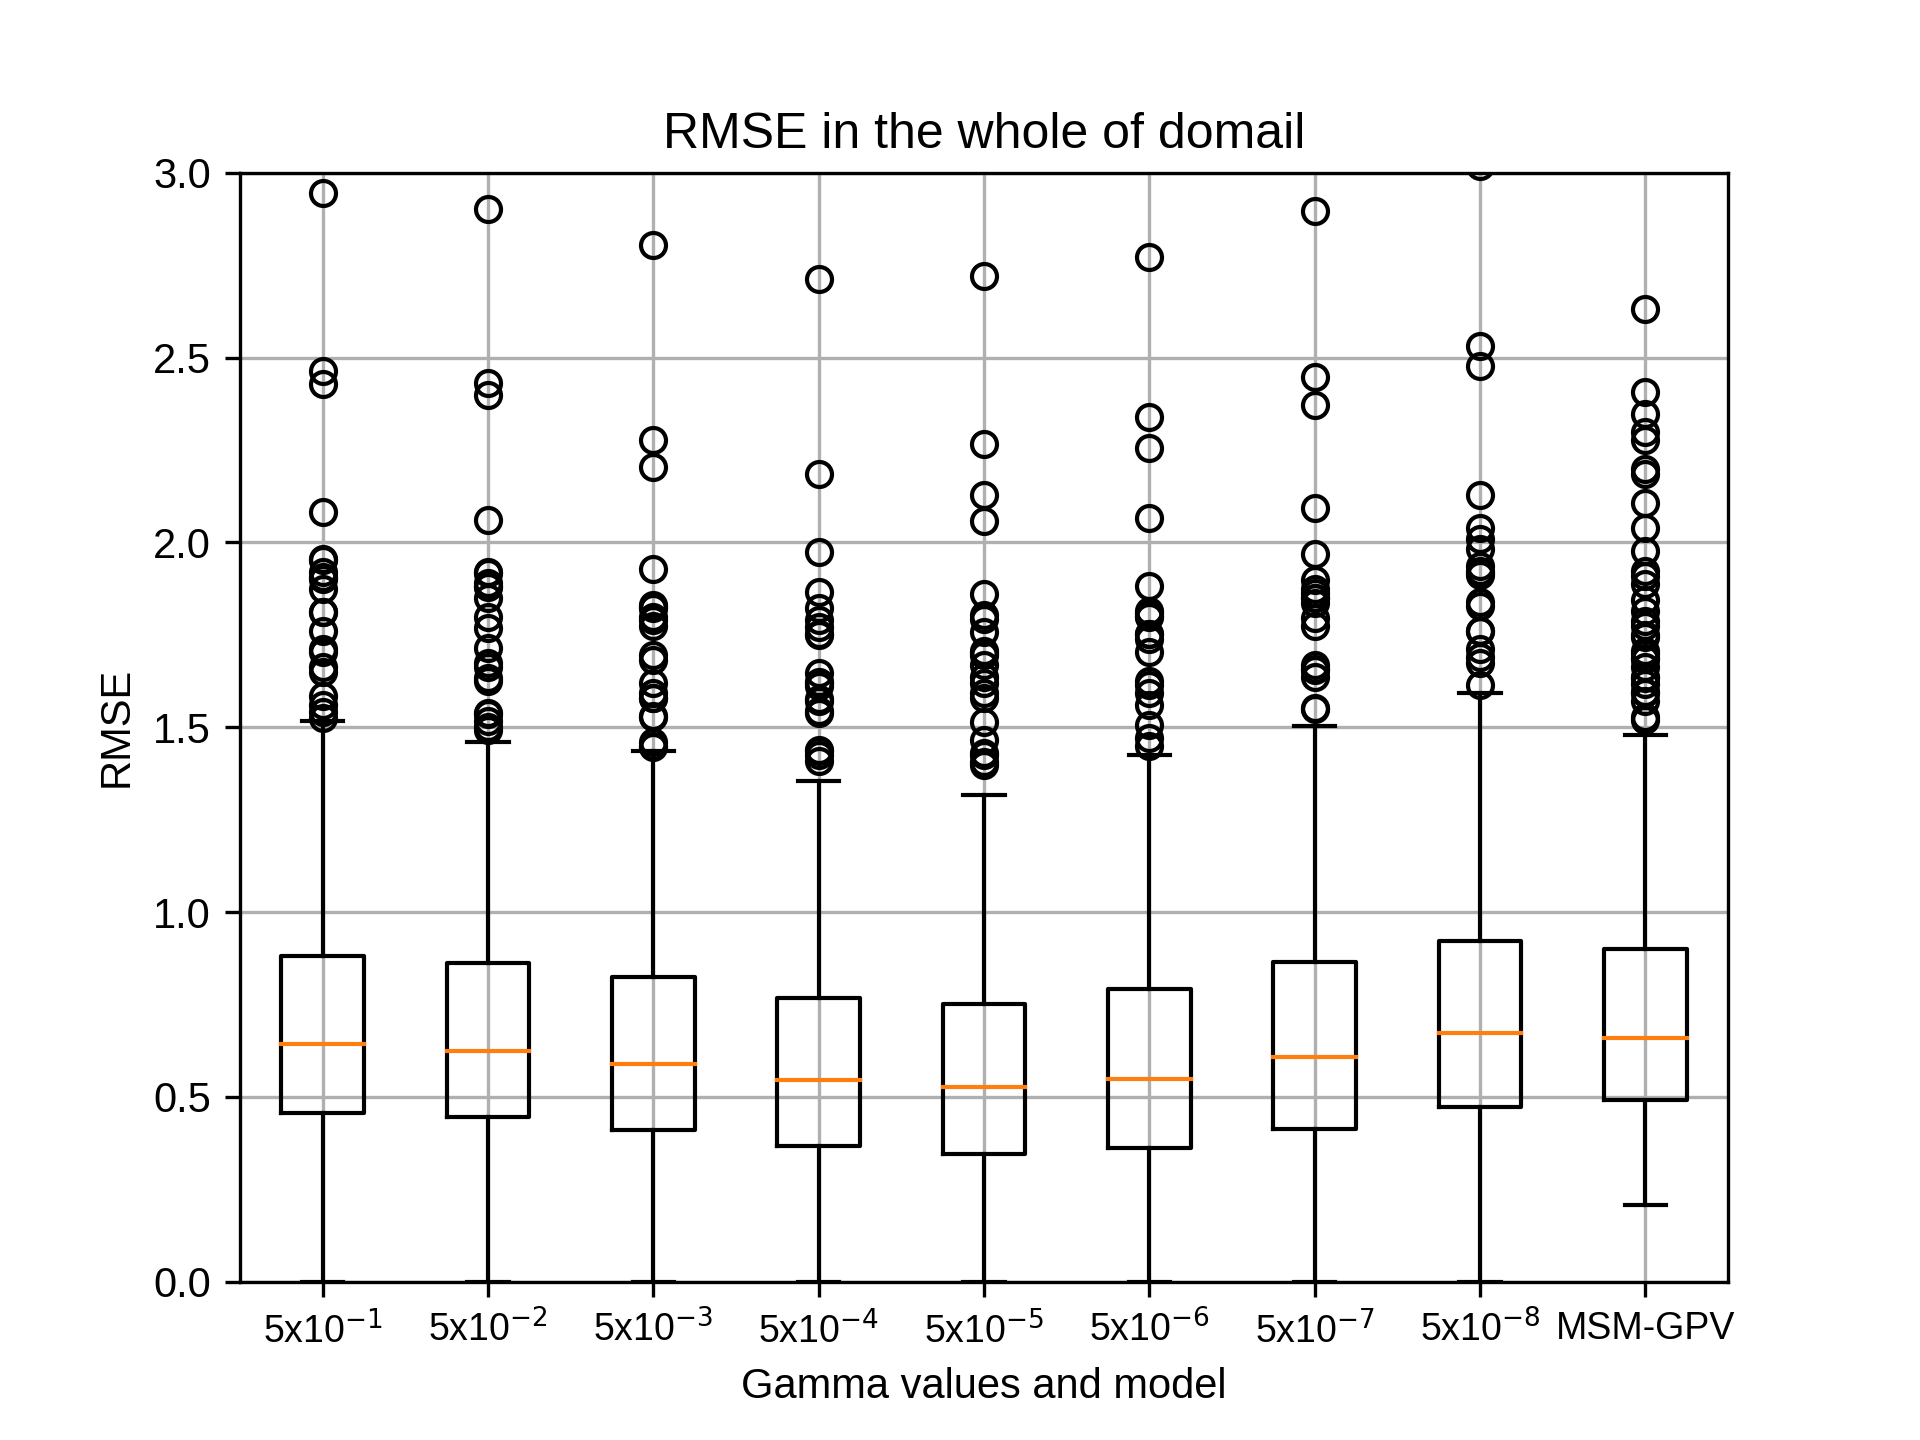
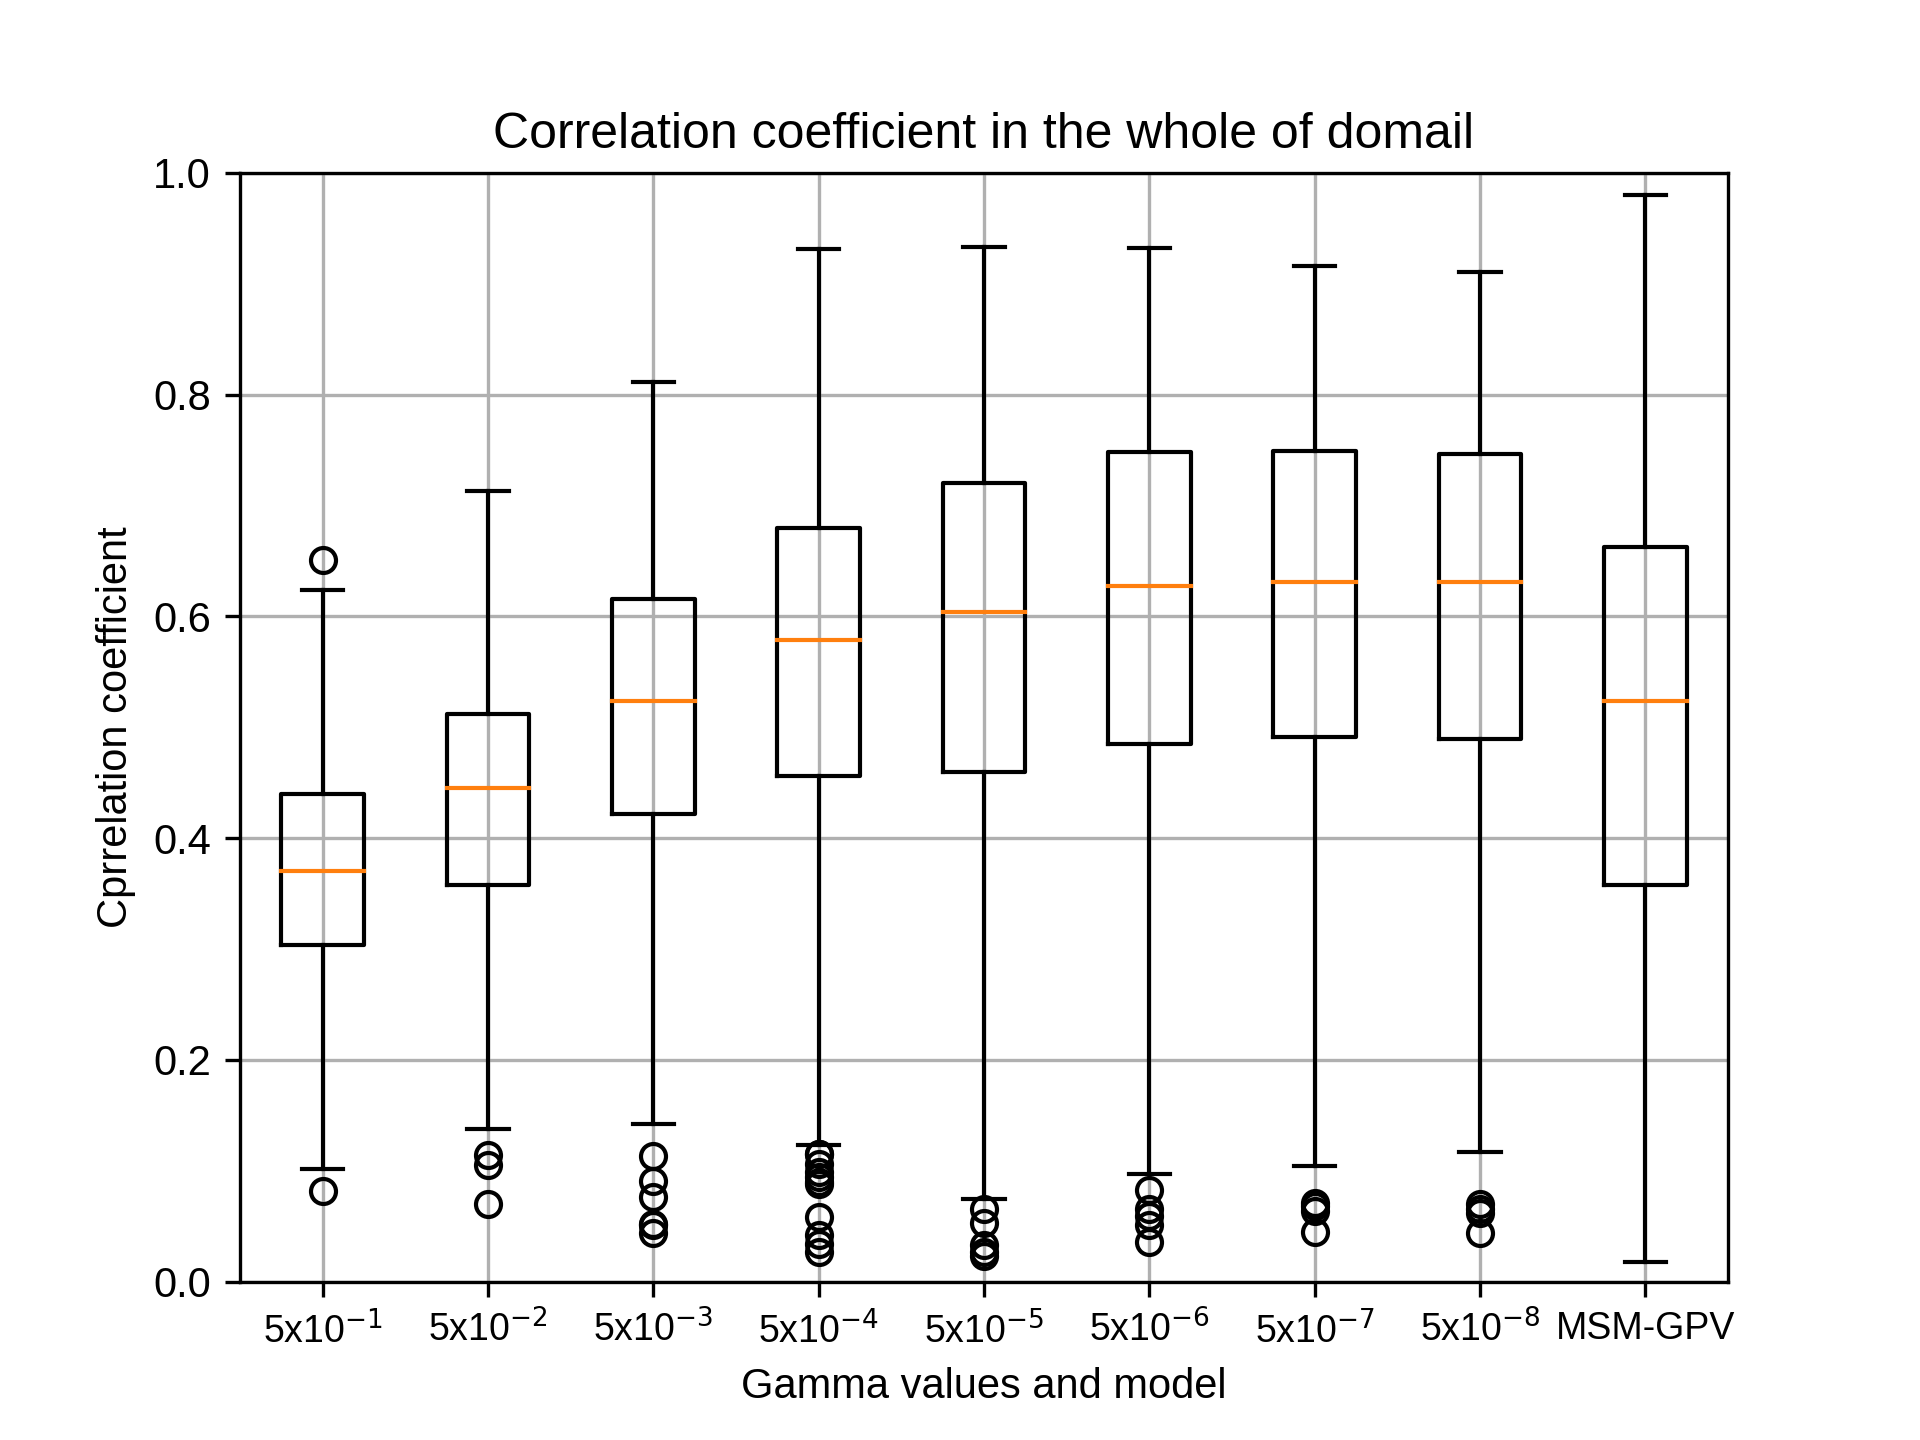
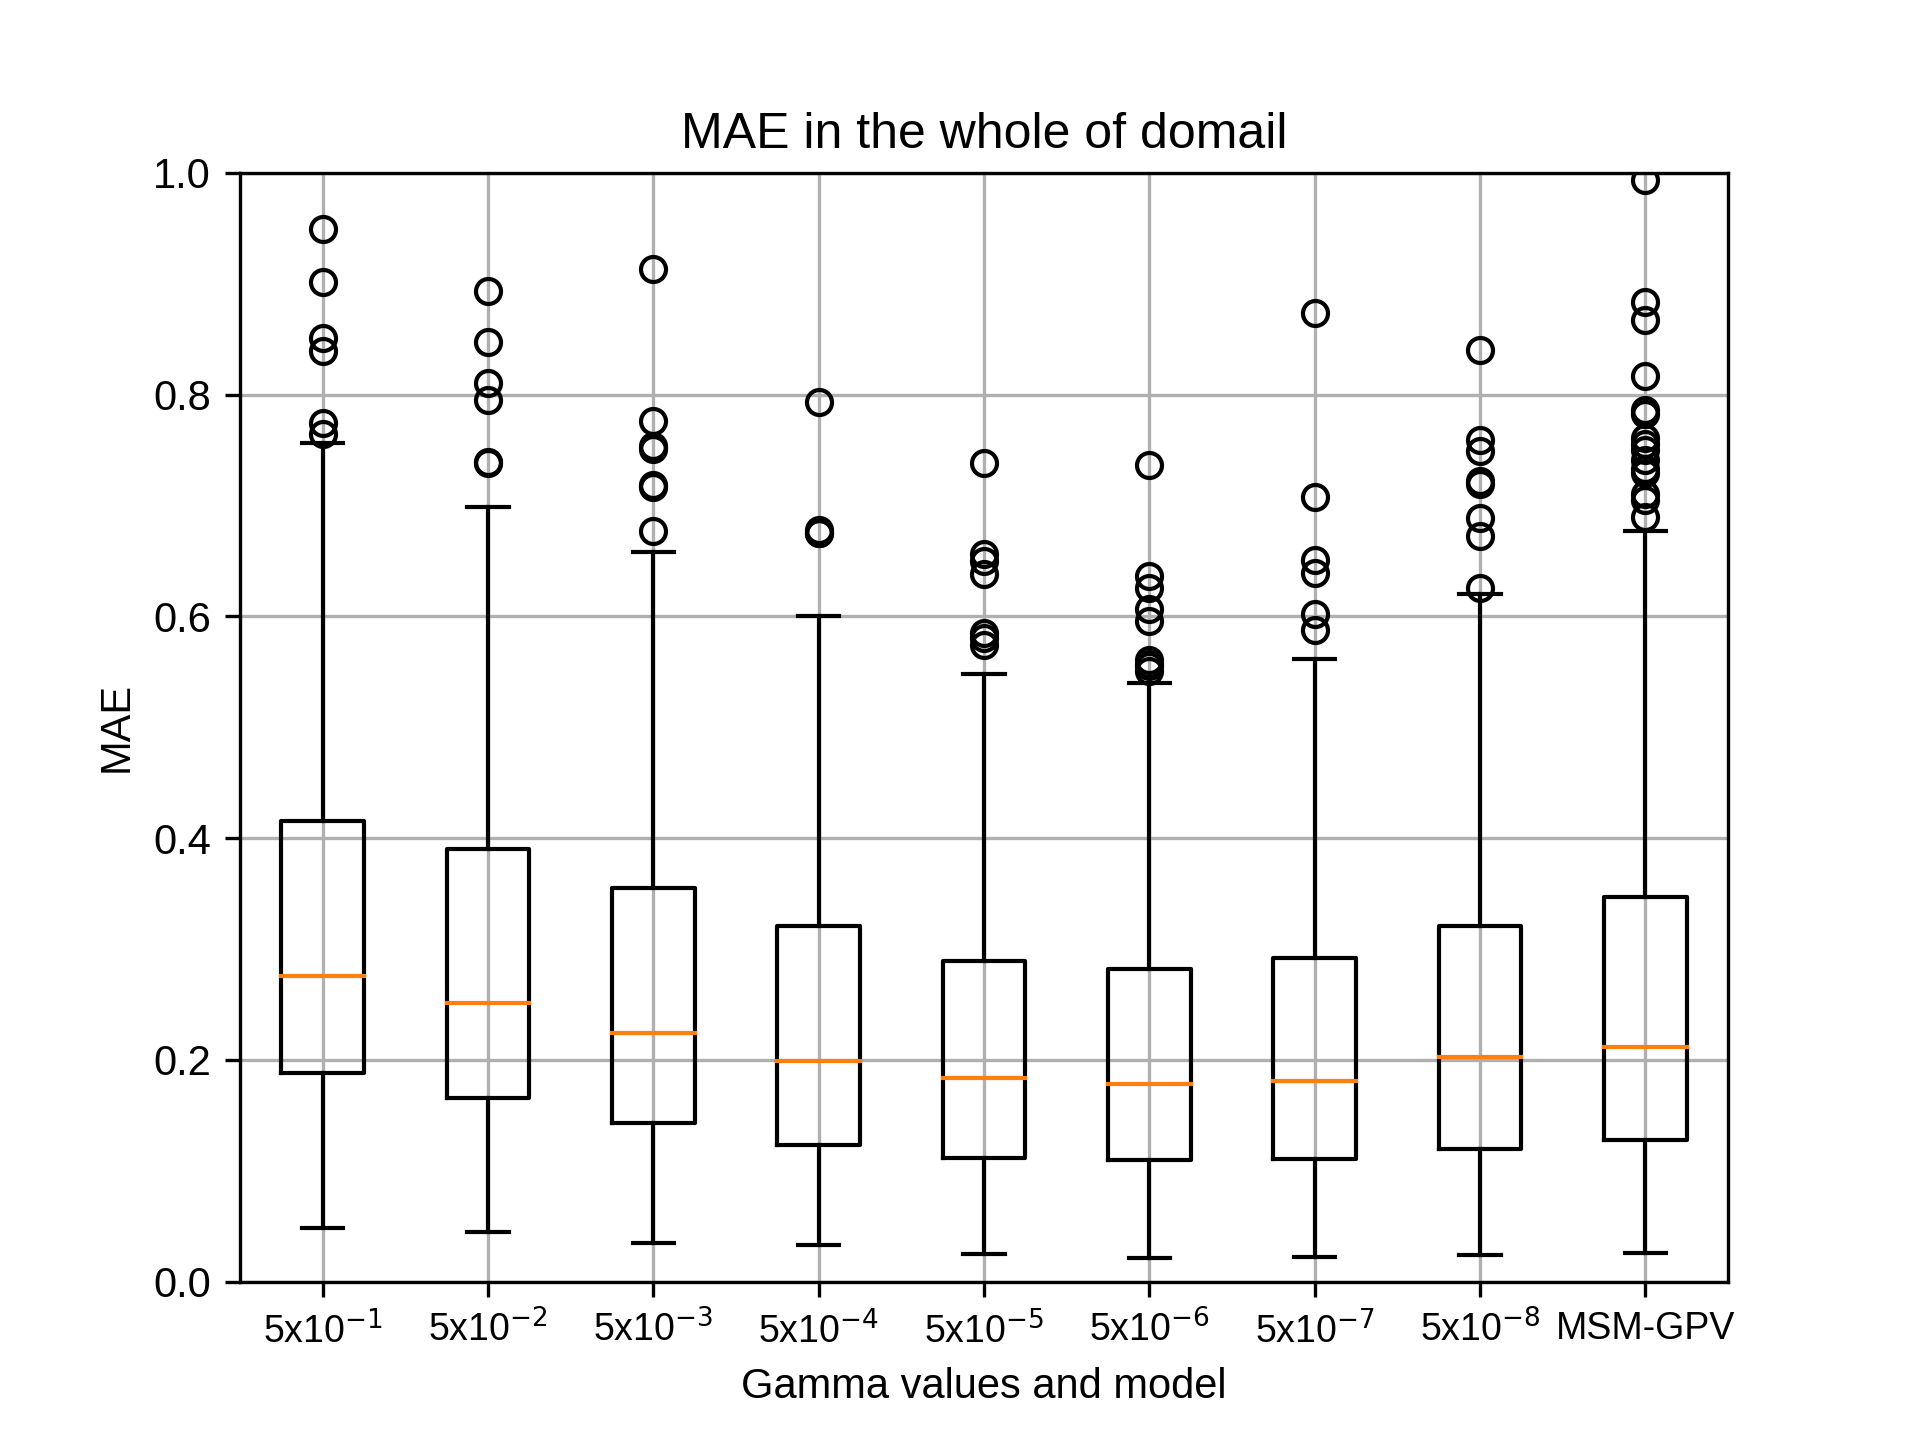
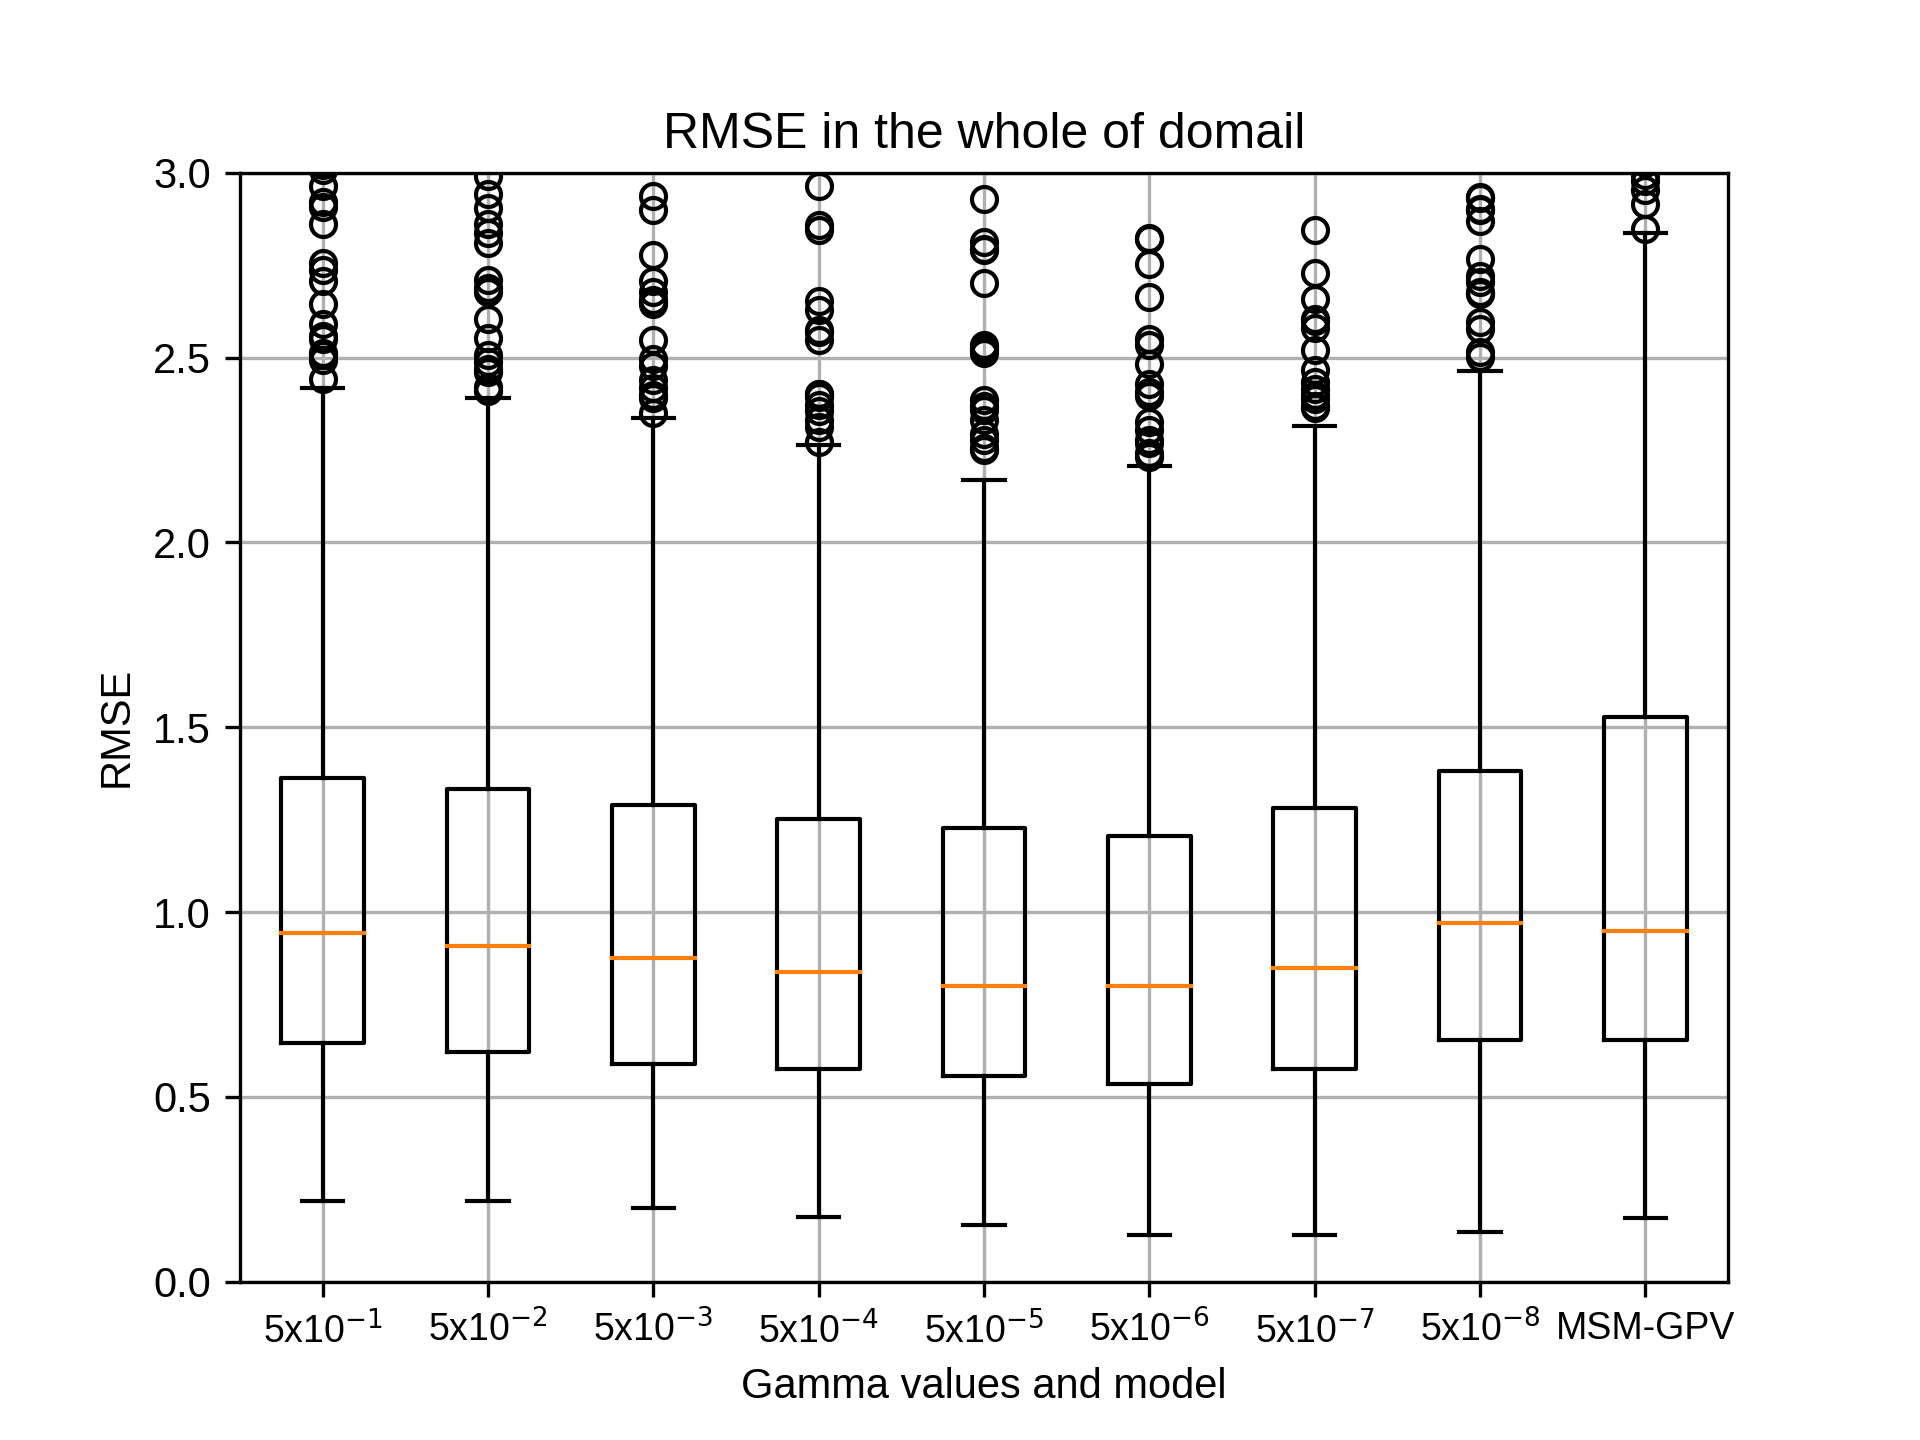
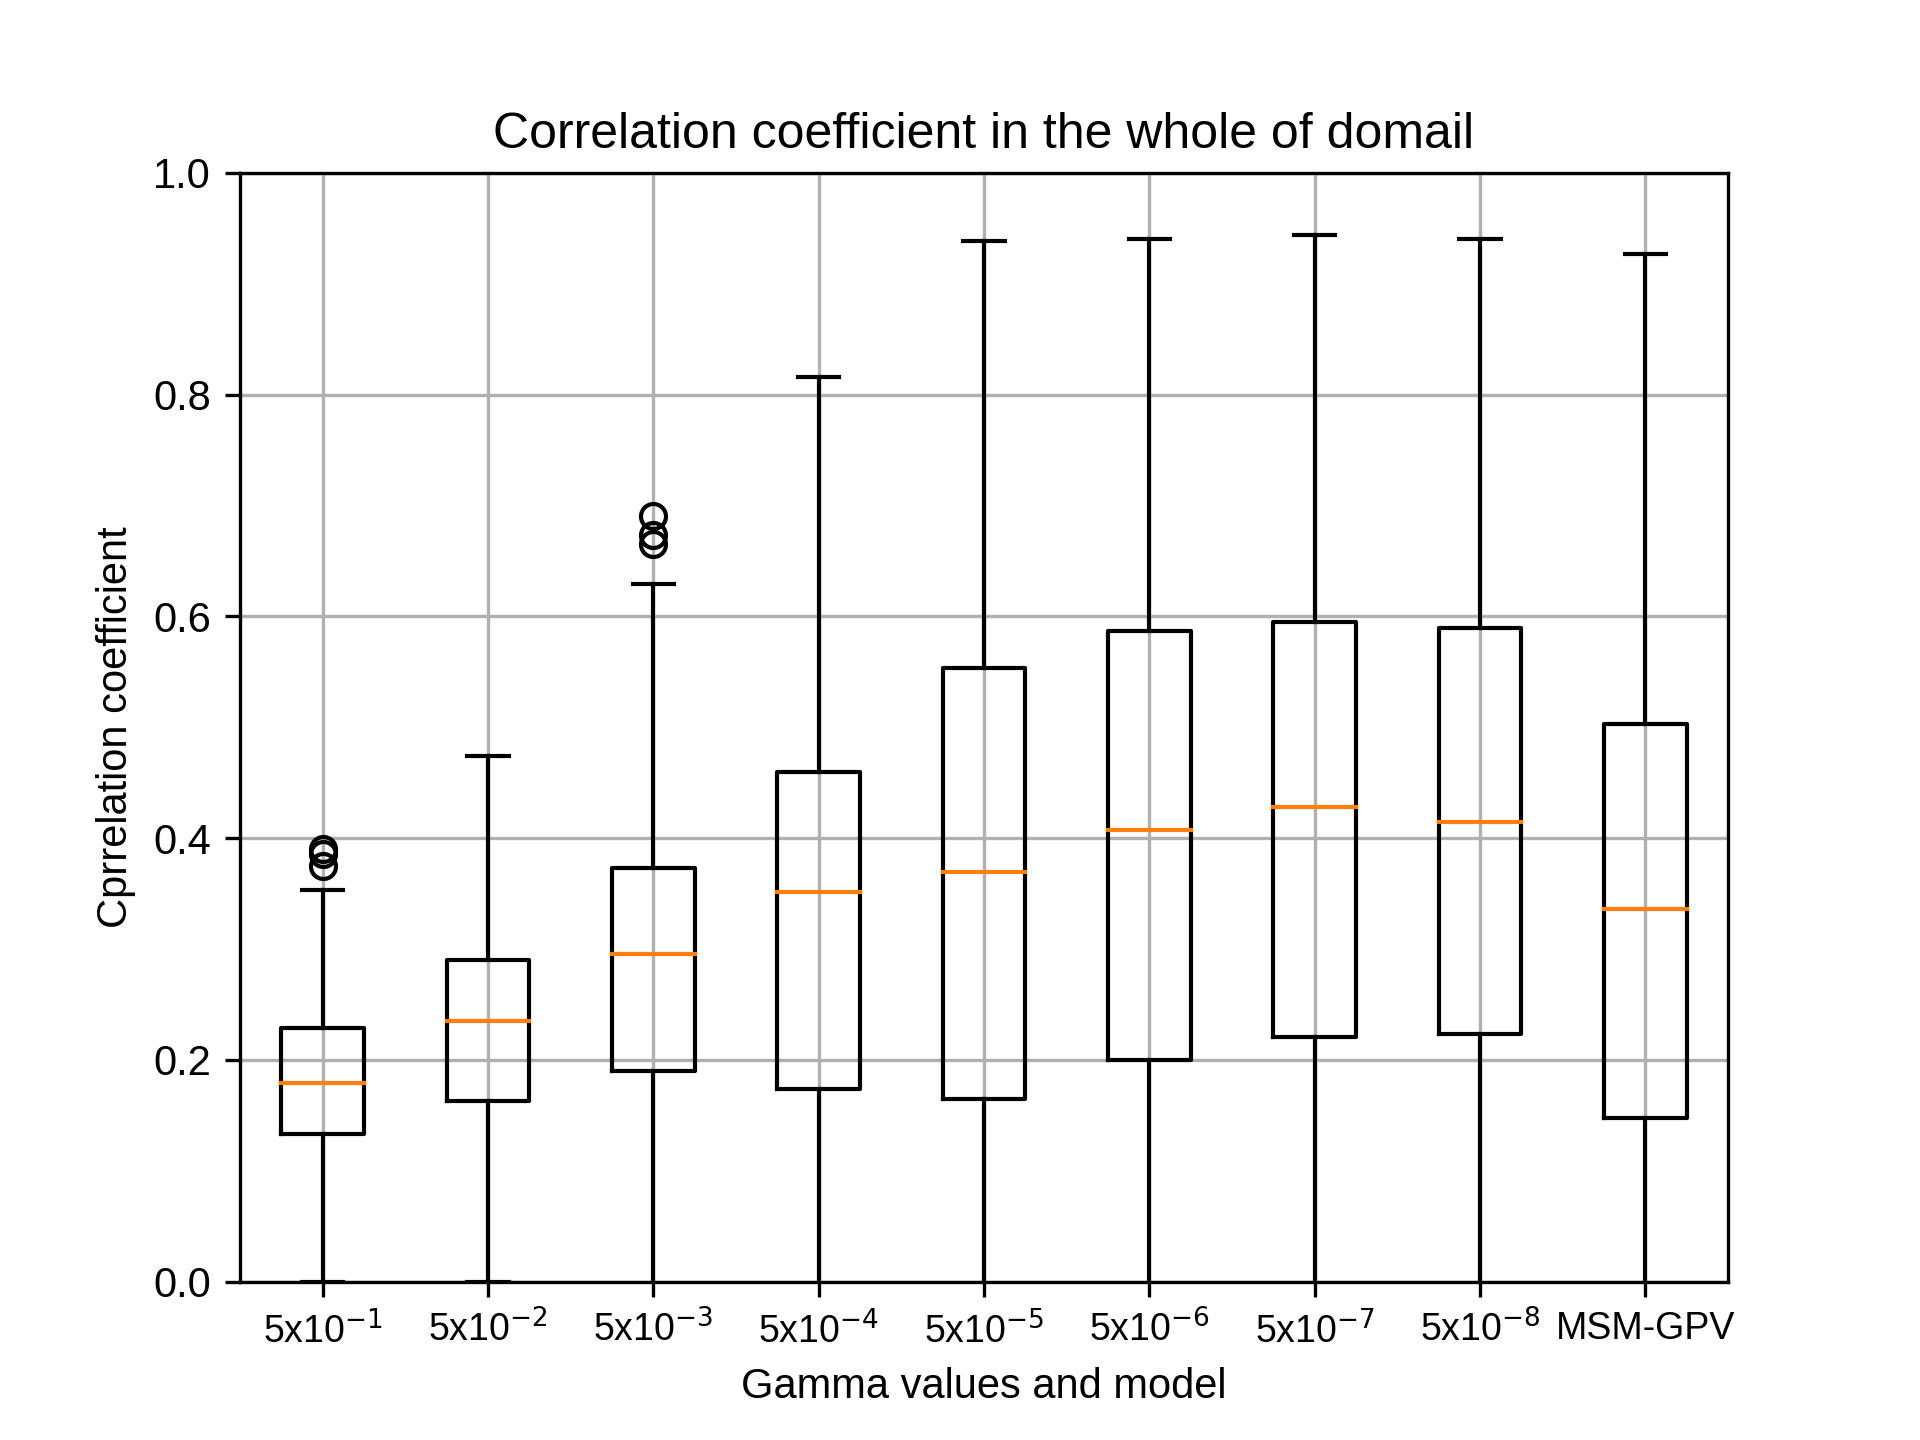
siteC,siteEにつきましてガンマの違いによる結果が出ましたのでお伝えいたします。
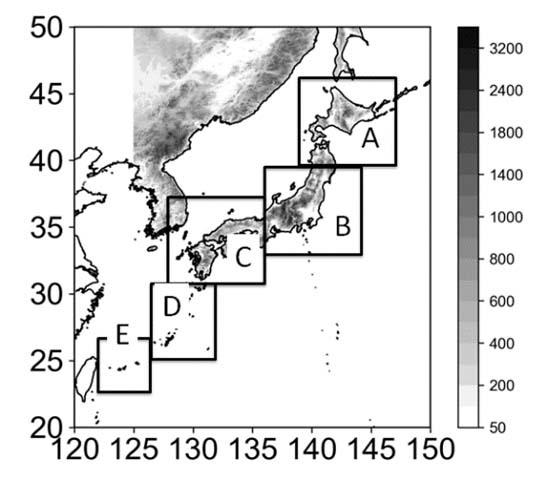
あわせて領域図も添付します。
siteCのパラメータは以下のとおりです。
allyears='2007 2008 2009 2010 2011 2012 2013 2014 2015 2016 2017 2018'
testyears='2007 2008 2009 2010 2011 2012 2013 2014 2015 2016 2017 2018'
months=${mon} #07
## Grids
xnums='20 30 40 50 60 70 80'
ynums='20 30 40 50 60 70 80'
nums='441'
rg2='10'
## Hyper-parameter (Gamma)
gm='0.5 0.05 0.005 0.0005 0.00005 0.000005 0.0000005 0.00000005'
## Hyper-parameter (Cost)
c2='10'
## Hyper-parameter (Epsilon)
ep='0.001'
また、siteEのパラメータは以下のとおりです。
allyears='2007 2008 2009 2010 2011 2012 2013 2014 2015 2016 2017 2018'
testyears='2007 2008 2009 2010 2011 2012 2013 2014 2015 2016 2017 2018'
months=${mon} #07
## Grids
xnums='20 30 40 50 60 70'
ynums='20 30 40 50 60 70'
nums='441'
rg2='10'
## Hyper-parameter (Gamma)
gm='0.5 0.05 0.005 0.0005 0.00005 0.000005 0.0000005 0.00000005'
## Hyper-parameter (Cost)
c2='10'
## Hyper-parameter (Epsilon)
ep='0.001'
なお、siteAについてはうまくpointに出力されず、siteC,siteDは相関係数がうまく出力されないエラーが発生しておりますので確認の上、修正いたします。
吉兼先生
siteC,siteEにつきましてガンマの違いによる結果が出ましたのでお伝えいたします。
あわせて領域図も添付します。
siteCのパラメータは以下のとおりです。
allyears='2007 2008 2009 2010 2011 2012 2013 2014 2015 2016 2017 2018'
testyears='2007 2008 2009 2010 2011 2012 2013 2014 2015 2016 2017 2018'
months=${mon} #07
## Grids
xnums='20 30 40 50 60 70 80'
ynums='20 30 40 50 60 70 80'
nums='441'
rg2='10'
## Hyper-parameter (Gamma)
gm='0.5 0.05 0.005 0.0005 0.00005 0.000005 0.0000005 0.00000005'
## Hyper-parameter (Cost)
c2='10'
## Hyper-parameter (Epsilon)
ep='0.001'
また、siteEのパラメータは以下のとおりです。
allyears='2007 2008 2009 2010 2011 2012 2013 2014 2015 2016 2017 2018'
testyears='2007 2008 2009 2010 2011 2012 2013 2014 2015 2016 2017 2018'
months=${mon} #07
## Grids
xnums='20 30 40 50 60 70'
ynums='20 30 40 50 60 70'
nums='441'
rg2='10'
## Hyper-parameter (Gamma)
gm='0.5 0.05 0.005 0.0005 0.00005 0.000005 0.0000005 0.00000005'
## Hyper-parameter (Cost)
c2='10'
## Hyper-parameter (Epsilon)
ep='0.001'
なお、siteAについてはうまくpointに出力されず、siteC,siteDは相関係数がうまく出力されないエラーが発生しておりますので確認の上、修正いたします。
takao-yMonday, September 7th, 2020 at 12:28:42 PM GMT+09:00
@kobayashi_yusuke
小林様。ありがとうございます。
図を見る限り、他の領域でも最適値はほとんど変わらないように思われます。相関係数が出力されないのは、データ欠損値の処理などで0割を起こしている可能性が高いと思います。もしフォートランをあまり得意とされていないのであれば、他の言語で変換していただいても構いません。もしpythonに慣れている場合は、pythonを使って変換された方が簡単かもしれません。
よろしくお願いいたします。
小林様。ありがとうございます。
図を見る限り、他の領域でも最適値はほとんど変わらないように思われます。相関係数が出力されないのは、データ欠損値の処理などで0割を起こしている可能性が高いと思います。もしフォートランをあまり得意とされていないのであれば、他の言語で変換していただいても構いません。もしpythonに慣れている場合は、pythonを使って変換された方が簡単かもしれません。
よろしくお願いいたします。
kobayashi_yusukeMonday, September 7th, 2020 at 1:14:51 PM GMT+09:00
@takao-y
吉兼先生 お返事ありがとうございます。
相関係数が出力されない点を調べたところ、吉兼先生がおっしゃるとおり欠損値処理の問題のようで、欠損値を除外してグラフ出力の部分だけ動かしましたらグラフが出ました。そのため、欠損値除外するコードを入れたうえで現在siteBとsiteDでプログラム全体を動かしております。
フォートランは社内の別の者が担当しており、その者が修正を行っております。フォートランからpythonへの変換には時間を要すると考えられるため、このまま社内の者がフォートランの修正を行いたいと考えております。
以上、よろしくお願いいたします。
吉兼先生 お返事ありがとうございます。
相関係数が出力されない点を調べたところ、吉兼先生がおっしゃるとおり欠損値処理の問題のようで、欠損値を除外してグラフ出力の部分だけ動かしましたらグラフが出ました。そのため、欠損値除外するコードを入れたうえで現在siteBとsiteDでプログラム全体を動かしております。
フォートランは社内の別の者が担当しており、その者が修正を行っております。フォートランからpythonへの変換には時間を要すると考えられるため、このまま社内の者がフォートランの修正を行いたいと考えております。
以上、よろしくお願いいたします。
kobayashi_yusukeMonday, September 7th, 2020 at 8:44:47 PM GMT+09:00


@takao-y
吉兼先生
siteD(南西諸島)につきましてガンマの違いによる結果が出ましたのでお伝えいたします。
エラーを修正し、グラフが出るようにいたしました。ご確認ください。
siteAは計算中、siteBは途中でエラーがでましたので修正いたします。
よろしくお願いいたします。
siteDのパラメータは以下のとおりです。
allyears='2007 2008 2009 2010 2011 2012 2013 2014 2015 2016 2017 2018'
testyears='2007 2008 2009 2010 2011 2012 2013 2014 2015 2016 2017 2018'
months=${mon} #07
## Grids
xnums='20 30 40 50 60 70 80'
ynums='20 30 40 50 60 70'
nums='441'
rg2='10'
##
## Hyper-parameter (Gamma)
gm='0.5 0.05 0.005 0.0005 0.00005 0.000005 0.0000005 0.00000005'
## Hyper-parameter (Cost)
c2='10'
## Hyper-parameter (Epsilon)
ep='0.001'
kobayashi_yusukeTuesday, September 8th, 2020 at 1:17:03 PM GMT+09:00


@takao-y
吉兼先生
siteA(北海道)につきましてガンマの違いによる結果が出ましたのでお伝えいたします。
エラーを修正し、グラフが出るようにいたしました。ご確認ください。
残っているsiteBは途中でエラーが出ておりますので修正いたします。
siteAのパラメータは以下のとおりです。3桁に修正しております。
以上、よろしくお願いいたします。
allyears='2007 2008 2009 2010 2011 2012 2013 2014 2015 2016 2017 2018'
testyears='2007 2008 2009 2010 2011 2012 2013 2014 2015 2016 2017 2018'
#testyears='2015'
months=${mon} #07
## Grids
xnums='020 030 040 050 060 070 080'
ynums='020 035 050 065 080 095 110'
nums='441'
rg2='10'
##
## Hyper-parameter (Gamma)
gm='0.5 0.05 0.005 0.0005 0.00005 0.000005 0.0000005 0.00000005'
## Hyper-parameter (Cost)
c2='10'
## Hyper-parameter (Epsilon)
ep='0.001'
takao-yWednesday, September 9th, 2020 at 10:18:59 AM GMT+09:00
@kobayashi_yusuke
小林様。ありがとうございます。siteBについて、エラーメッセージを添付していただけますでしょうか。
小林様。ありがとうございます。siteBについて、エラーメッセージを添付していただけますでしょうか。
kobayashi_yusukeWednesday, September 9th, 2020 at 10:24:42 AM GMT+09:00
@takao-y
吉兼先生
siteBにつきましてもグラフを出力することができました。後ほどお伝えいたします。
吉兼先生
siteBにつきましてもグラフを出力することができました。後ほどお伝えいたします。
kobayashi_yusukeWednesday, September 9th, 2020 at 10:30:58 AM GMT+09:00

@takao-y
吉兼先生
siteB(東日本)につきましてガンマの違いによる結果が出ましたのでお伝えいたします。
エラーを修正し、グラフが出るようにいたしました。ご確認ください。
これでsiteA~siteEすべて出力できるようになりました。
ご確認いただいてsiteA~siteEそれぞれでのガンマのパラメータを確定させ、次のコストやエプシロンのパラメータのご指示をいただけると幸いです。
なお、コメントアウトされているコストとエプシロンのパラメータは以下のとおりです。
## Hyper-parameter (Cost)
#c2='50 40 30 20 10 8 6 4 2 1'
## Hyper-parameter (Epsilon)
#ep='1.0 0.1 0.01 0.001 0.0001 0.00001'
また、今回作成したグラフのsiteBのパラメータは以下のとおりです。
以上、よろしくお願いいたします。
allyears='2007 2008 2009 2010 2011 2012 2013 2014 2015 2016 2017 2018'
testyears='2007 2008 2009 2010 2011 2012 2013 2014 2015 2016 2017 2018'
months=${mon}
## Grids
xnums='020 030 040 050 060 070 080'
ynums='020 035 050 065 080 095 110'
nums='441'
rg2='10'
##
## Hyper-parameter (Gamma)
gm='0.5 0.05 0.005 0.0005 0.00005 0.000005 0.0000005 0.00000005'
## Hyper-parameter (Cost)
c2='10'
## Hyper-parameter (Epsilon)
ep='0.001'
takao-yWednesday, September 9th, 2020 at 10:35:05 AM GMT+09:00
@kobayashi_yusuke
小林様。ありがとうございます。早速で申し訳ないのですが、次は7月についてお願いできますでしょうか。
小林様。ありがとうございます。早速で申し訳ないのですが、次は7月についてお願いできますでしょうか。
kobayashi_yusukeWednesday, September 9th, 2020 at 10:37:04 AM GMT+09:00
@takao-y
吉兼先生
お返事ありがとうございます。今回の計算対象はsiteA~Eまですべて7月で行っております。グラフをご確認いただき、ご意見をいただけると幸いです。
吉兼先生
お返事ありがとうございます。今回の計算対象はsiteA~Eまですべて7月で行っております。グラフをご確認いただき、ご意見をいただけると幸いです。
takao-yWednesday, September 9th, 2020 at 10:40:34 AM GMT+09:00
@kobayashi_yusuke
小林様。ありがとうございます。すみません。よく確認していませんでした。それでは、1月をお願いできますでしょうか。その後で、4月,10月も同様に実施していただけますでしょうか。
小林様。ありがとうございます。すみません。よく確認していませんでした。それでは、1月をお願いできますでしょうか。その後で、4月,10月も同様に実施していただけますでしょうか。
kobayashi_yusukeWednesday, September 9th, 2020 at 1:13:38 PM GMT+09:00
@takao-y
吉兼先生
承知しました。
ガンマにつきまして1月を行い、その後4月、10月も同様に行います。
結果が出ましたら改めてご連絡いたします。よろしくお願いします。
吉兼先生
承知しました。
ガンマにつきまして1月を行い、その後4月、10月も同様に行います。
結果が出ましたら改めてご連絡いたします。よろしくお願いします。
takao-yWednesday, September 9th, 2020 at 4:25:05 PM GMT+09:00
@kobayashi_yusuke
小林様。すみません。勘違いしていました。今はガンマだけだったのですね。それでは、CとEpsilonについても同様にお願いできますでしょうか。まずは7月ですね。
小林様。すみません。勘違いしていました。今はガンマだけだったのですね。それでは、CとEpsilonについても同様にお願いできますでしょうか。まずは7月ですね。
kobayashi_yusukeWednesday, September 9th, 2020 at 5:23:05 PM GMT+09:00
@takao-y
吉兼先生
ご連絡ありがとうございます。
7月につきましてsiteAからsiteEのコストとエプシロンを出すようにいたします。
まず、コストを決めるにあたってガンマを固定する必要がございますが、ガンマの値はいくつにすればよろしいでしょうか。
これまでご提示しましたグラフをもとにsiteA・siteB・siteC・siteD・siteEそれぞれのガンマ値をご教授くださると大変ありがたく思います。
またコストにつきまして、以下でよろしいでしょうか。
## Hyper-parameter (Cost)
#c2='50 40 30 20 10 8 6 4 2 1'
コストのグラフを出力するにあたって、プログラムの改修が必要ですのでそちらに着手いたします。
以上、よろしくお願いいたします。
takao-yWednesday, September 9th, 2020 at 5:40:49 PM GMT+09:00
@kobayashi_yusuke
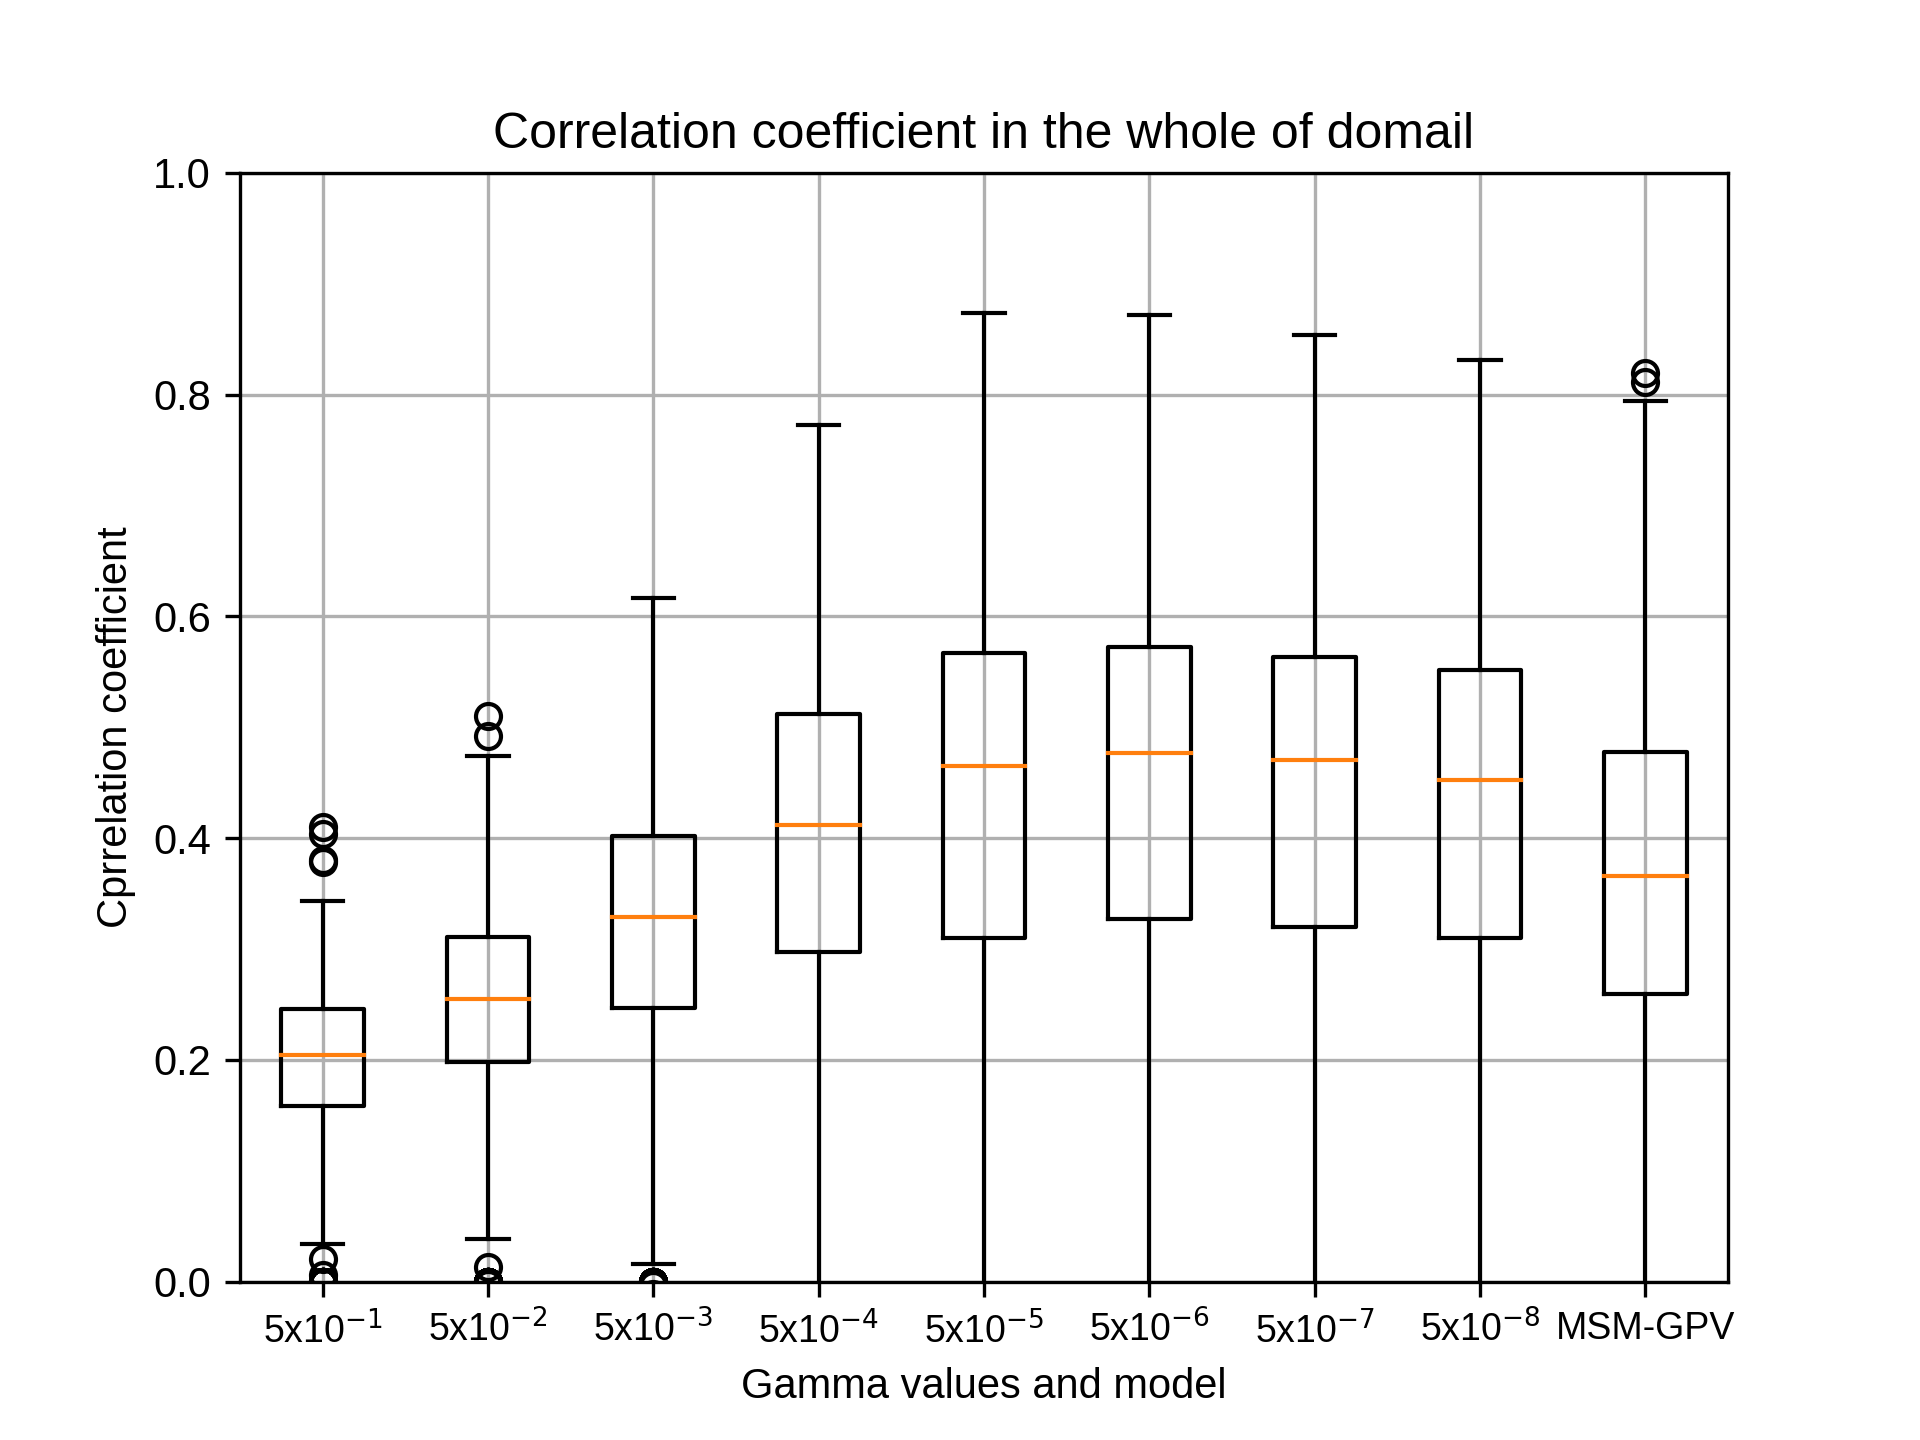
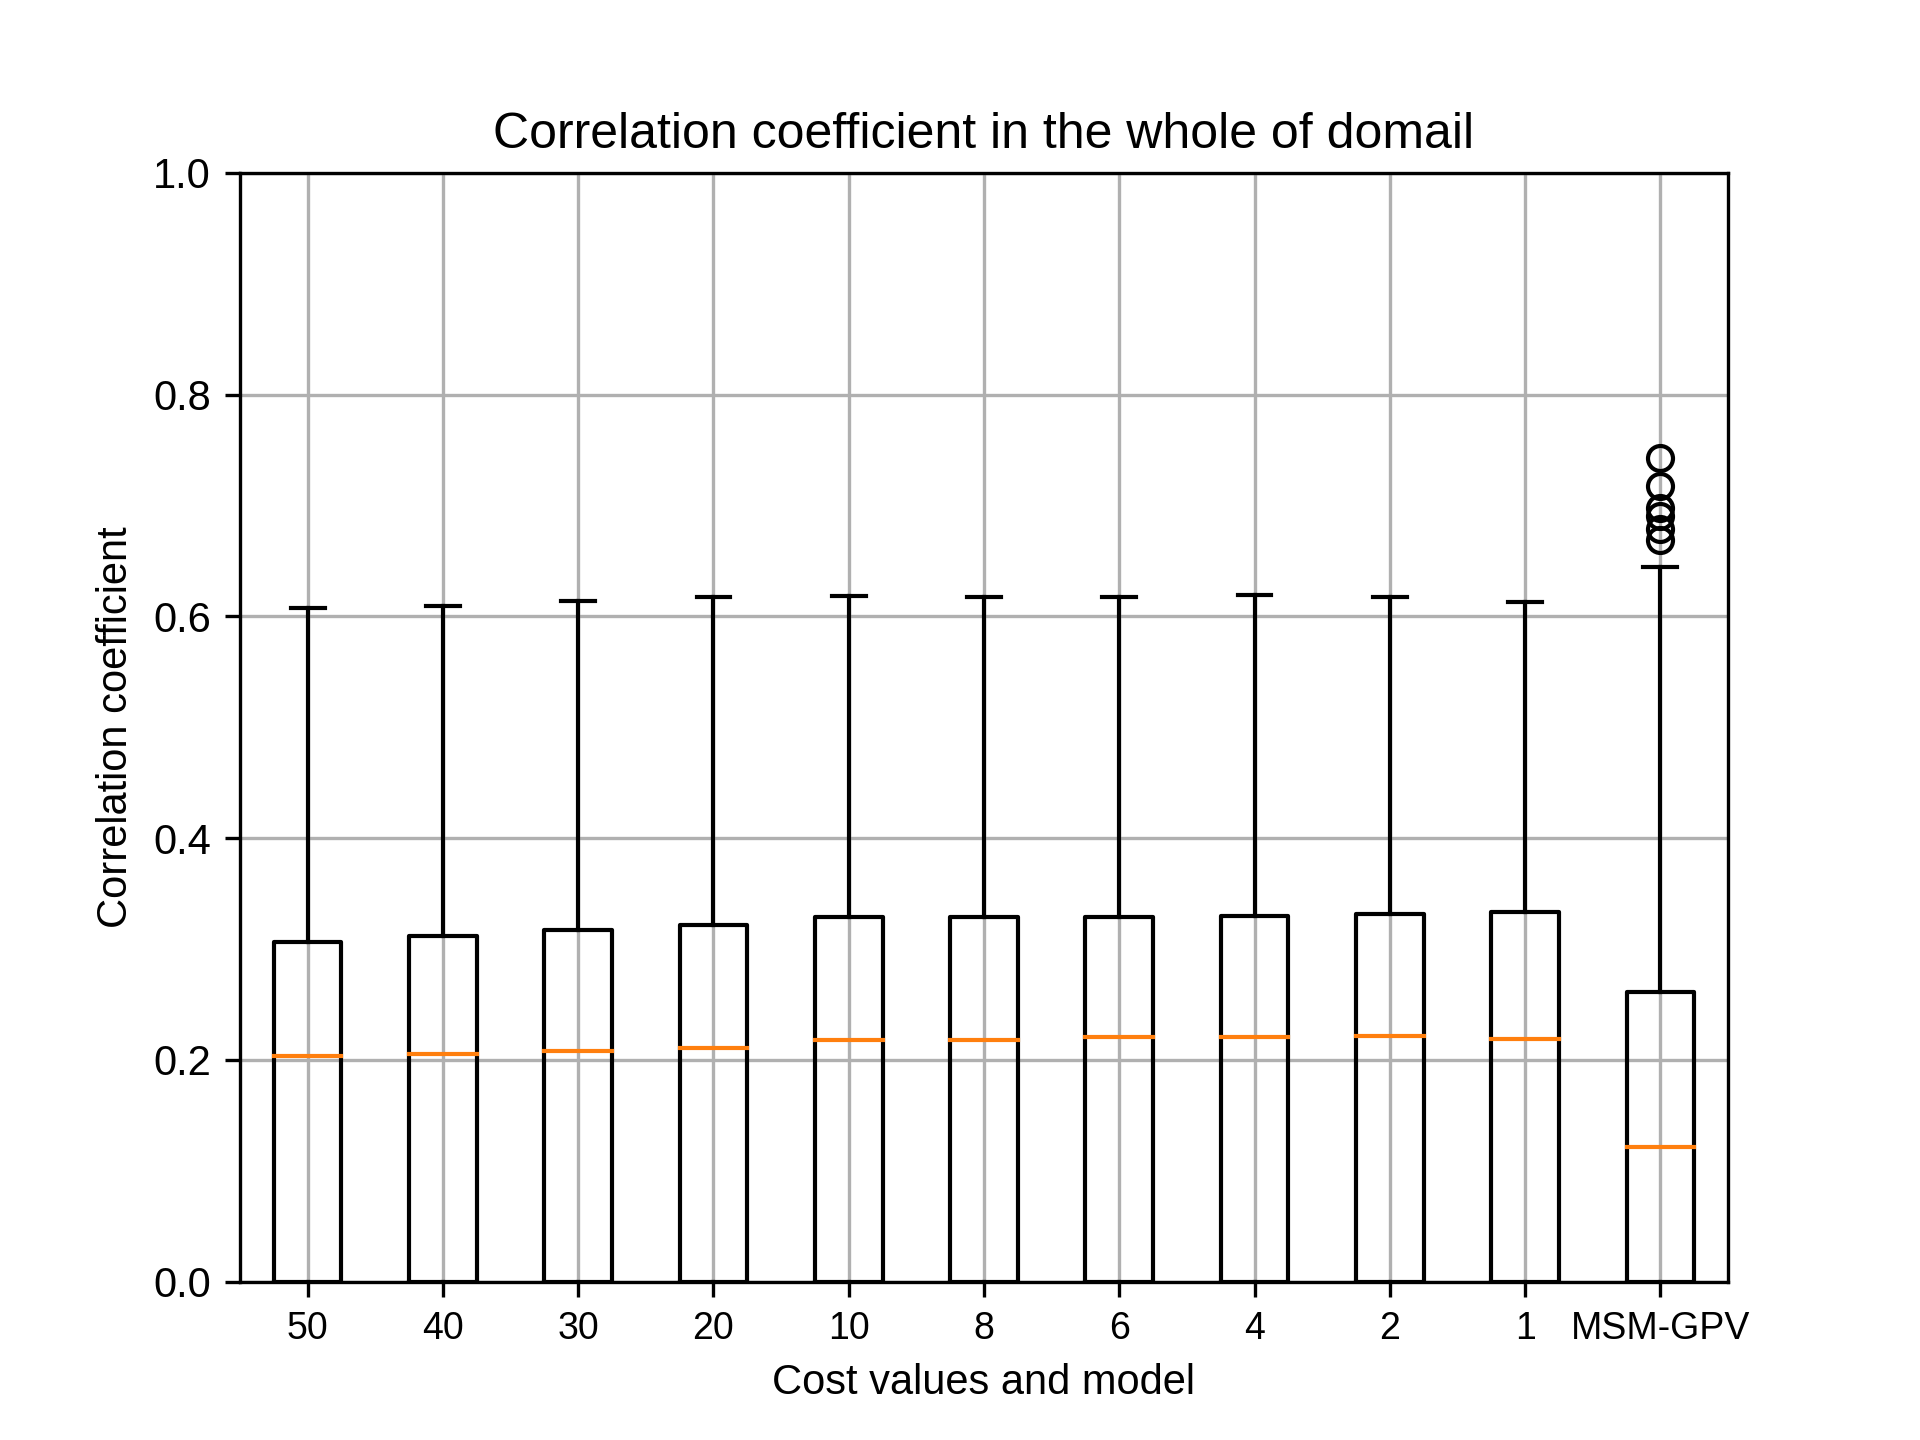
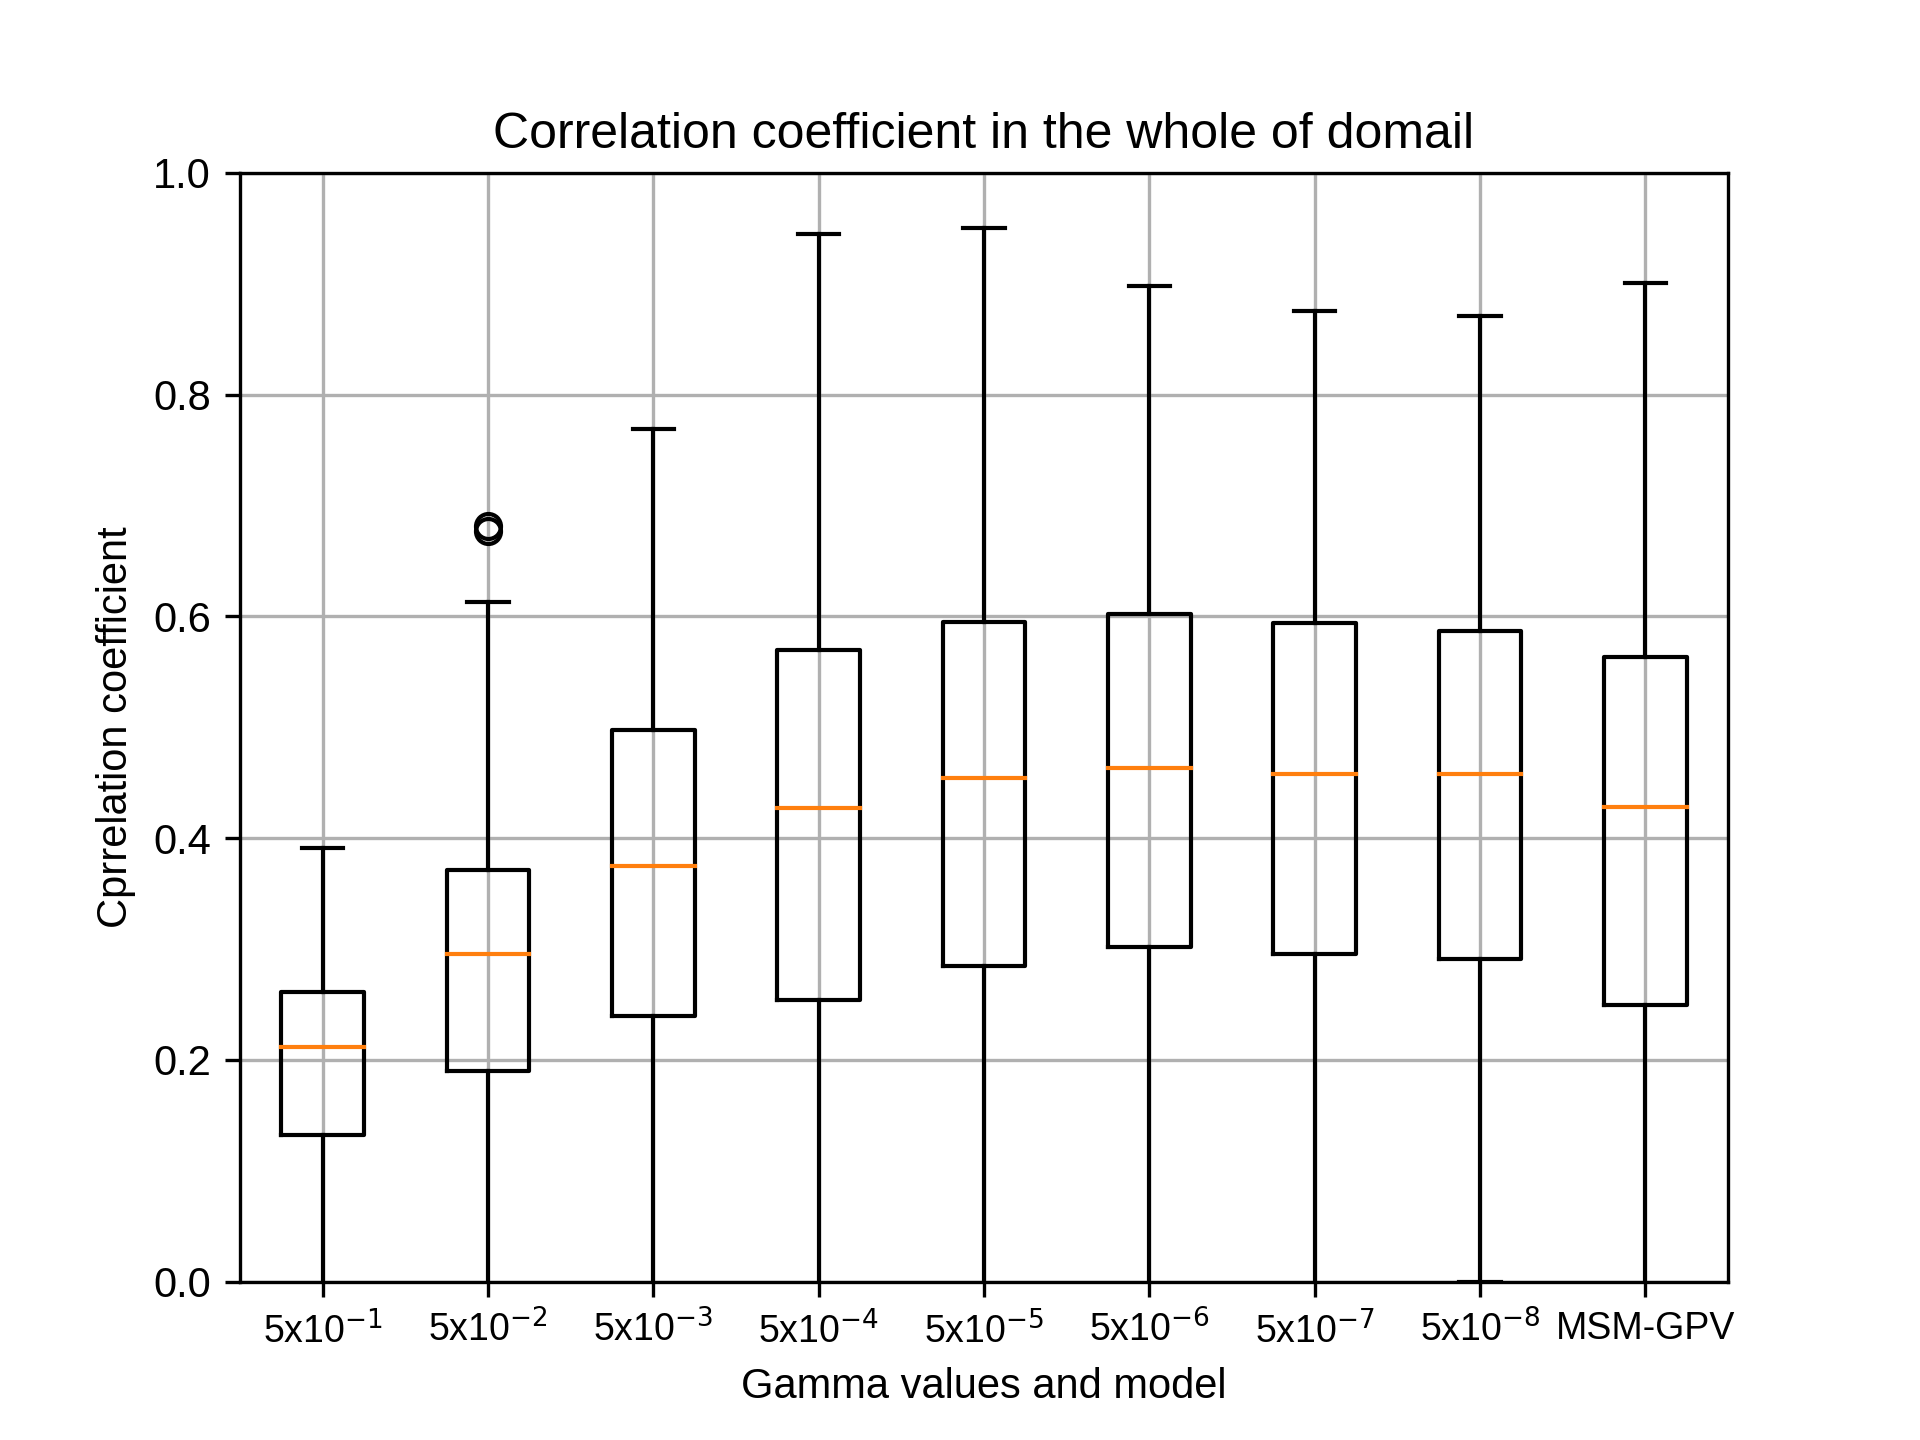
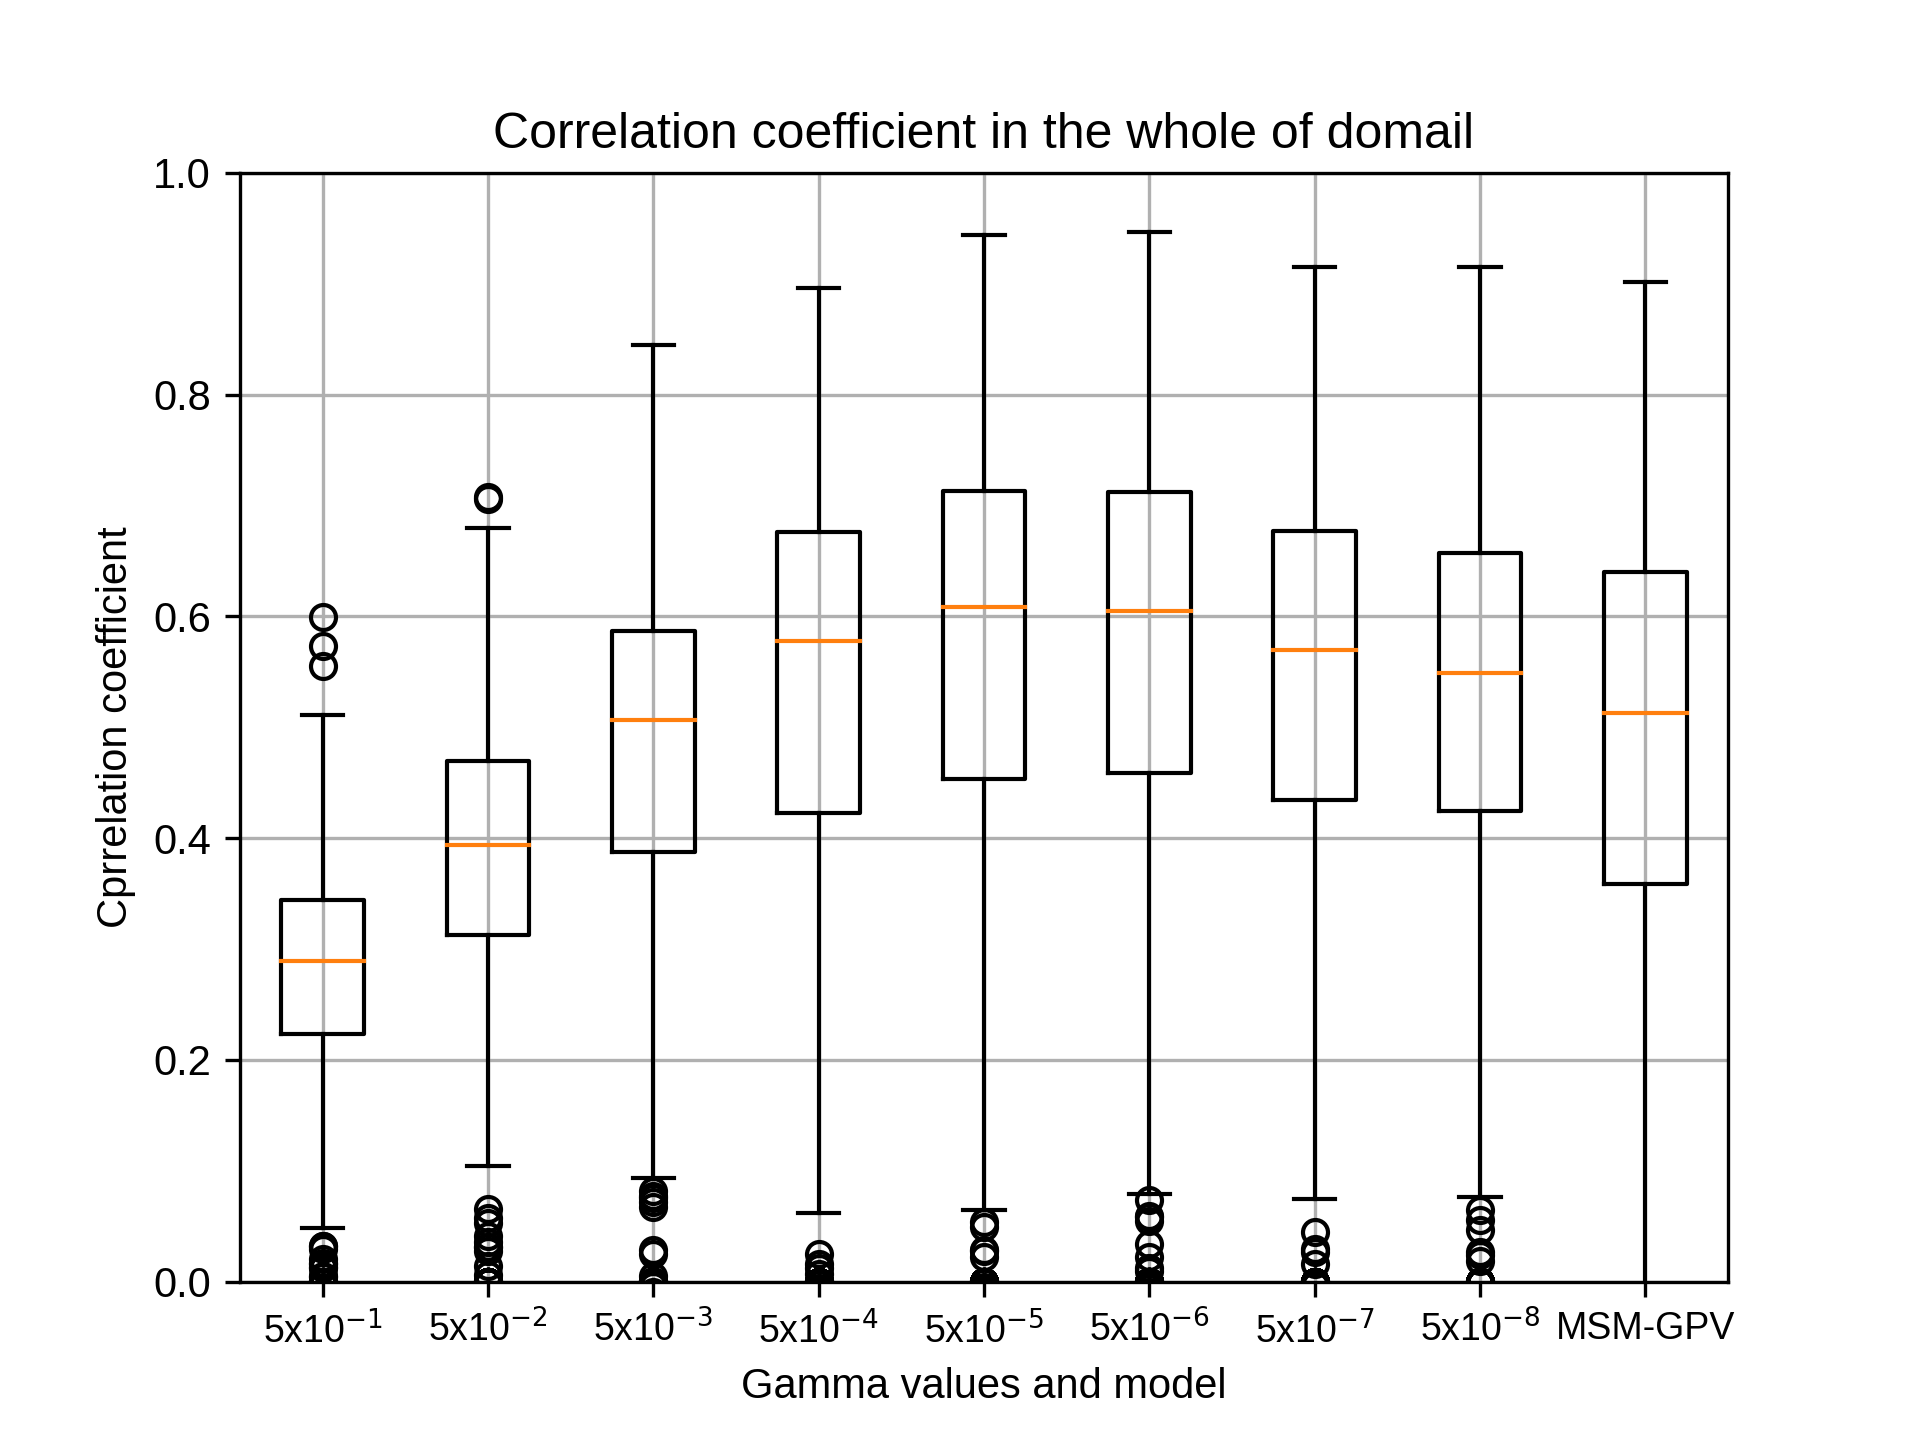
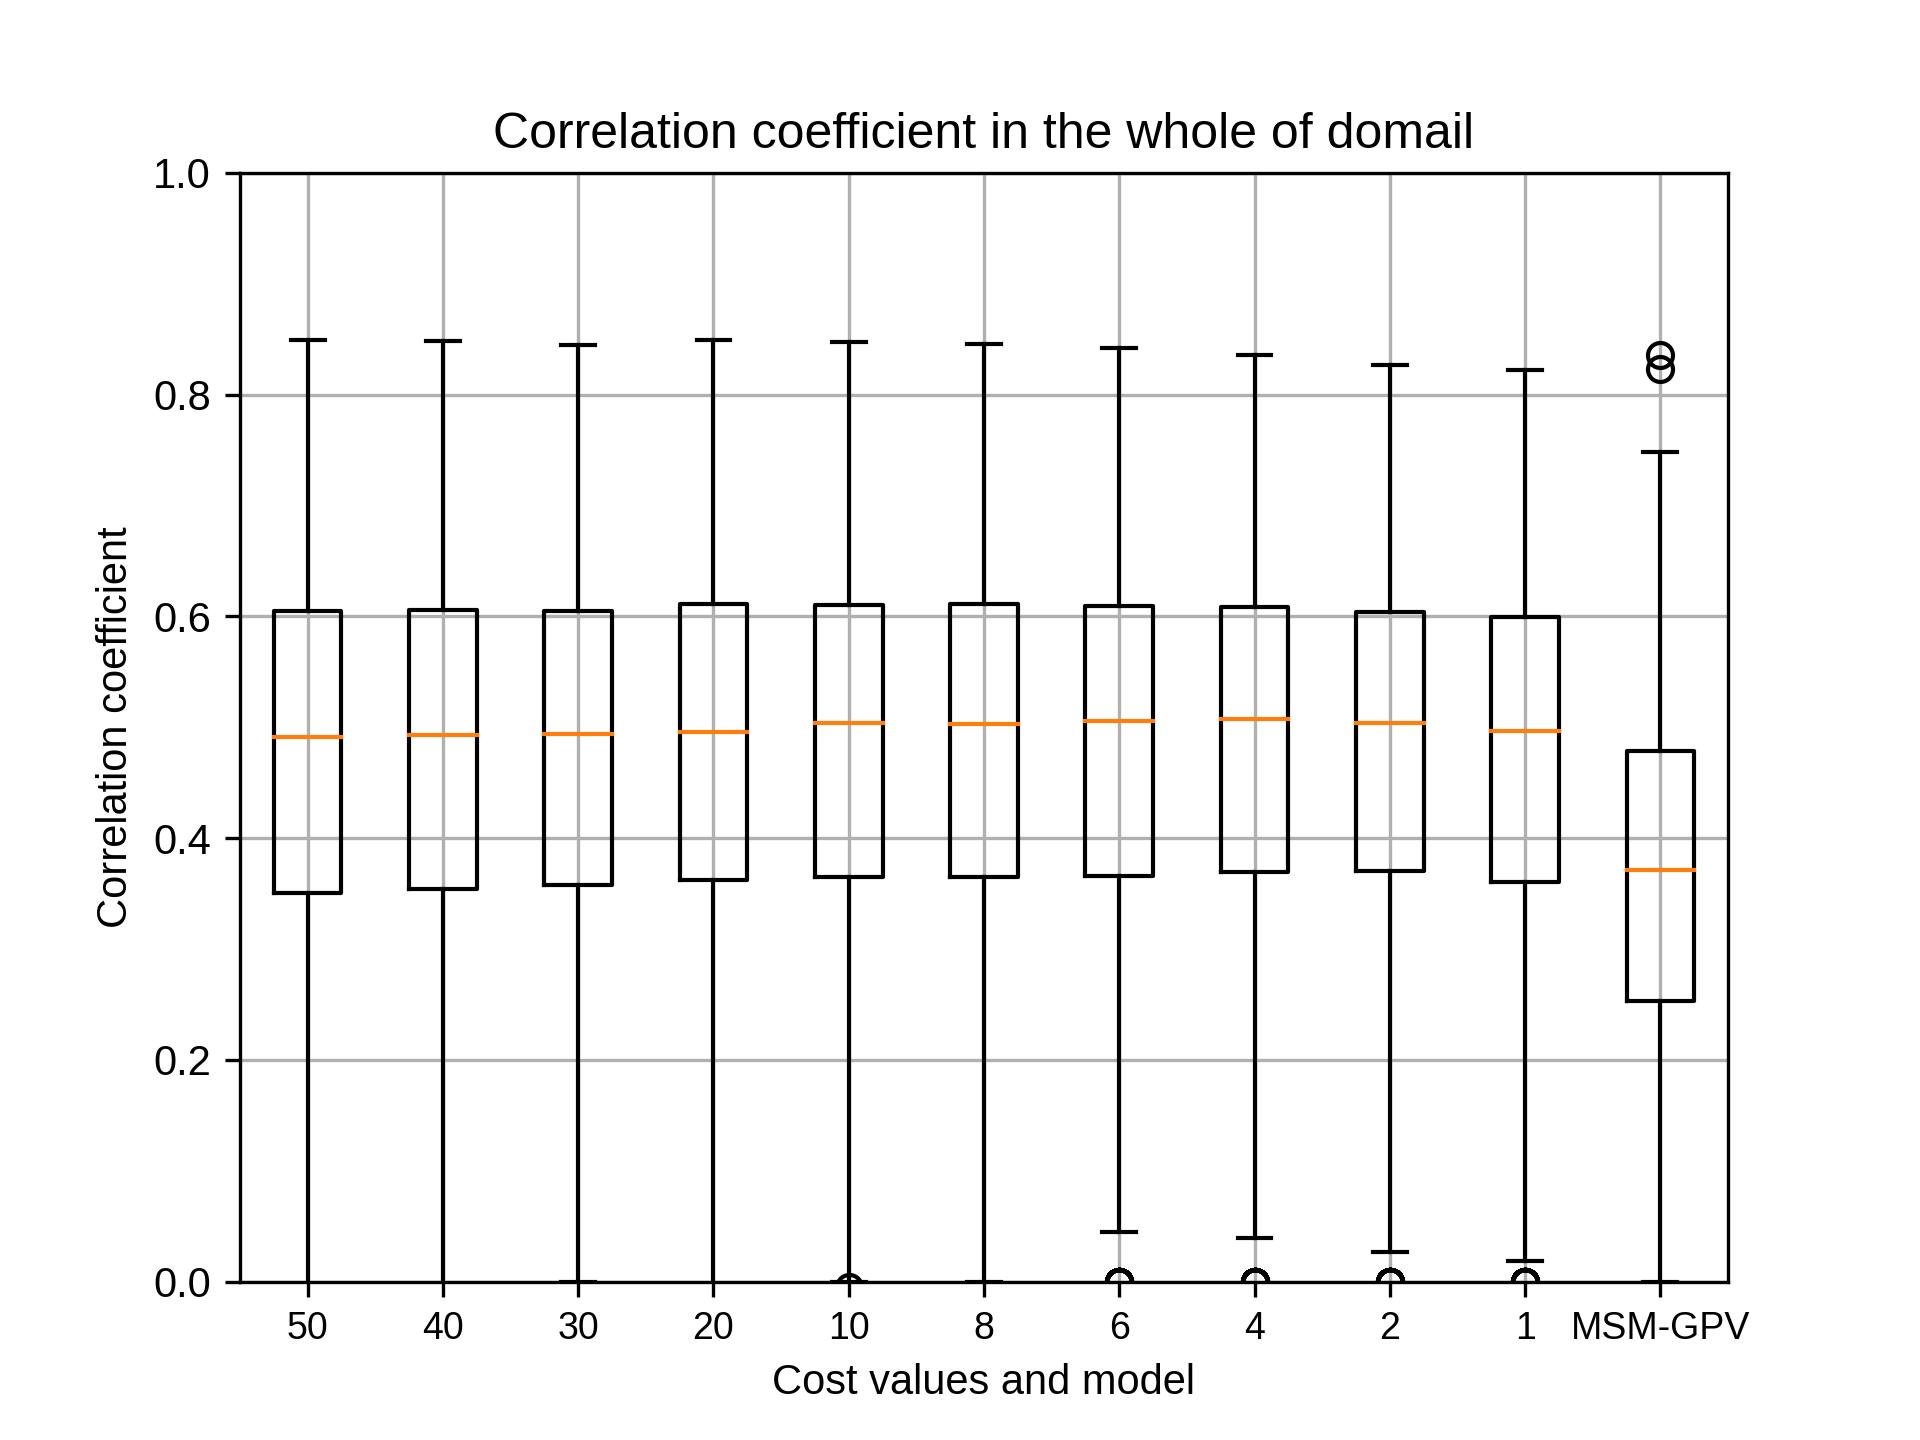
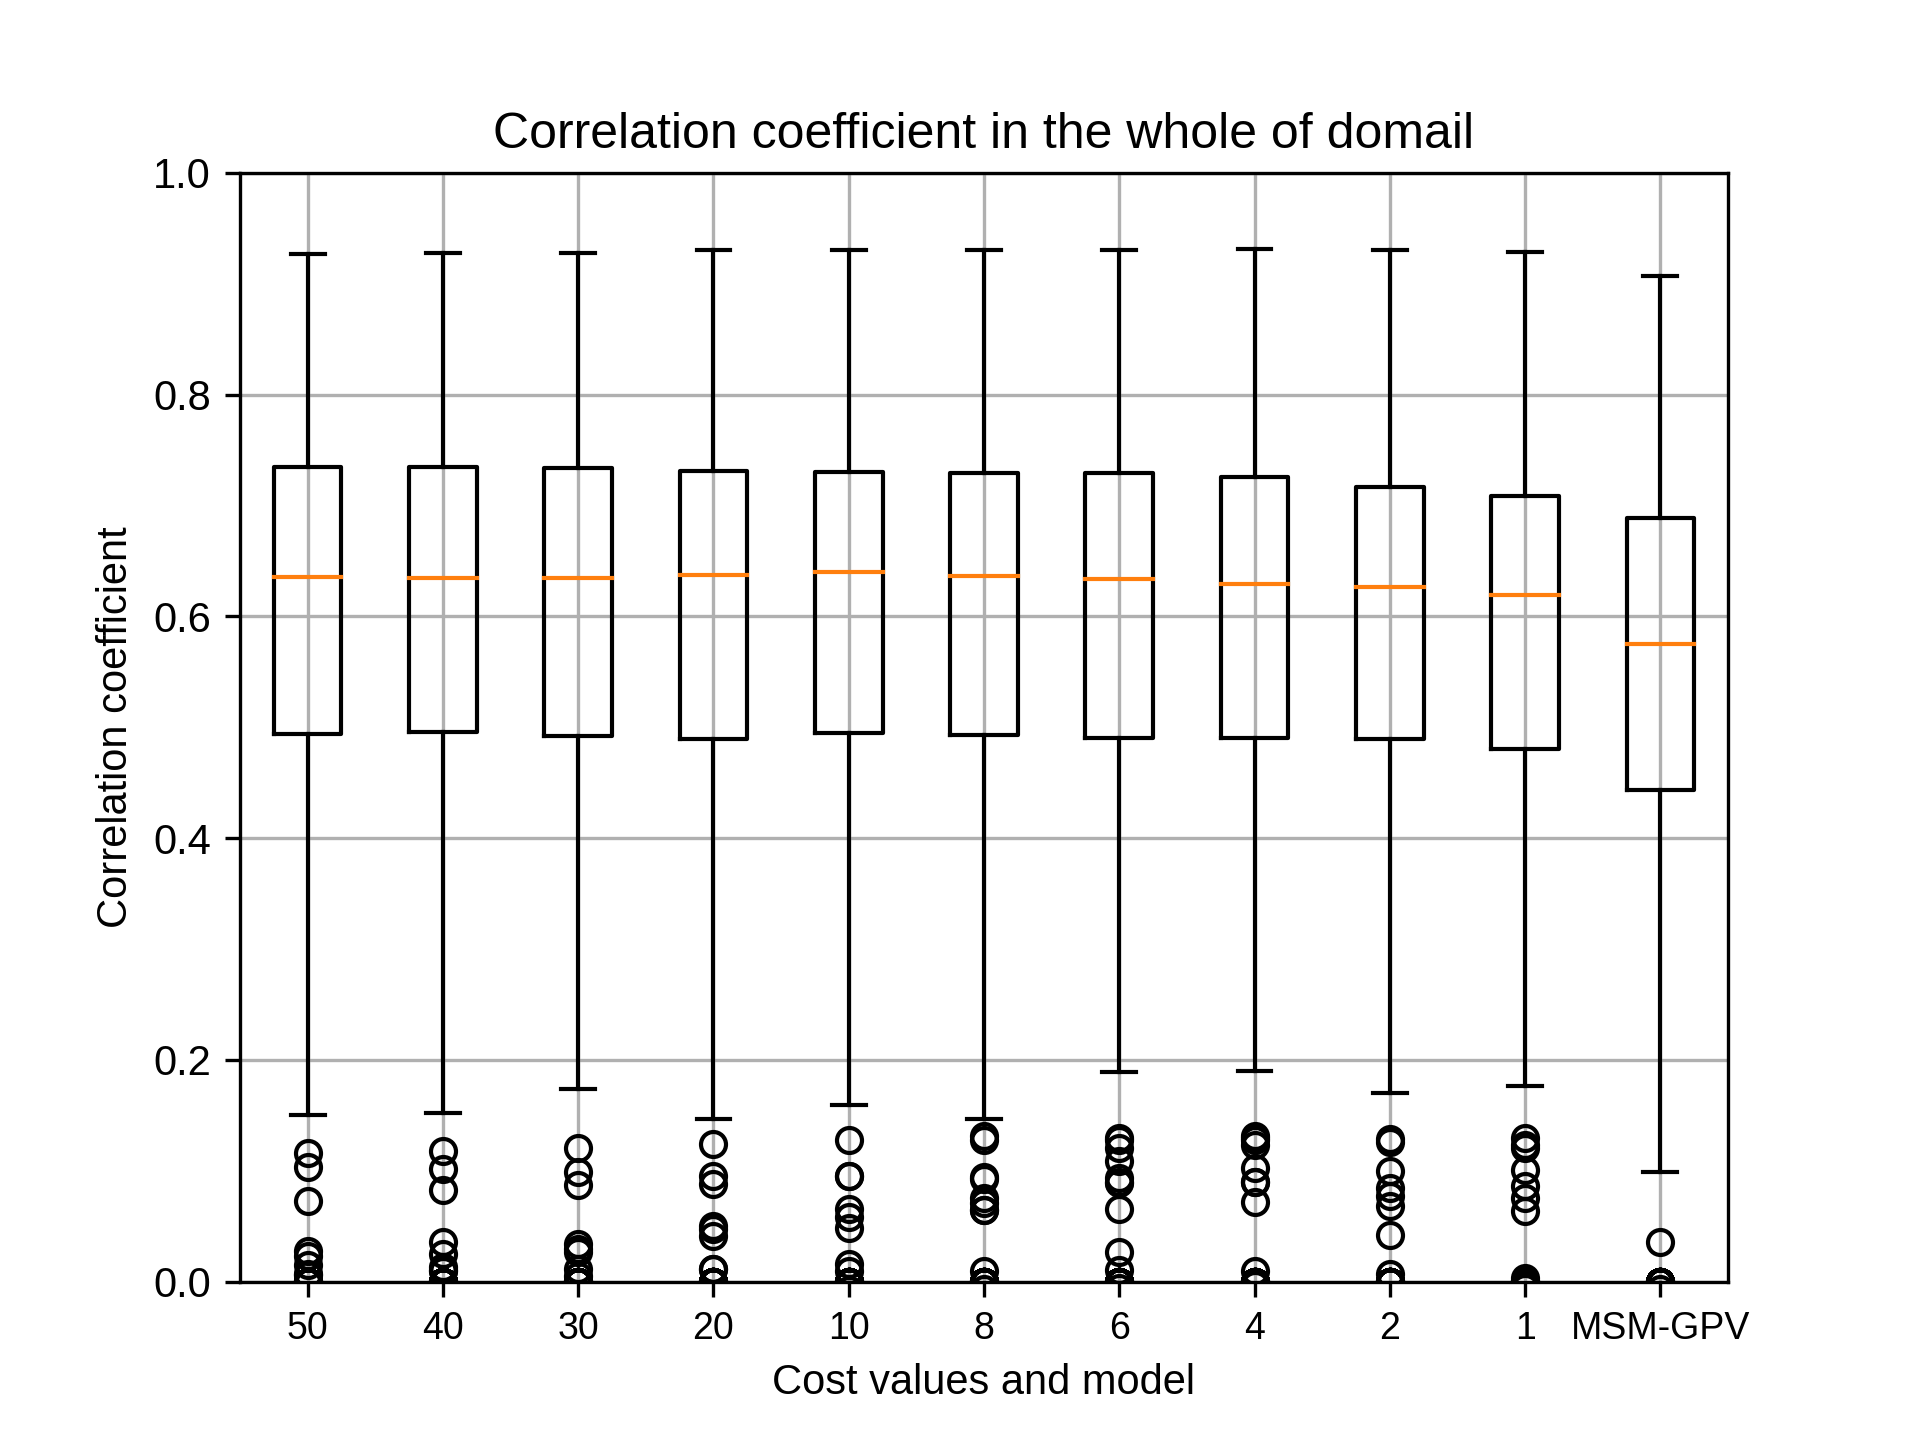
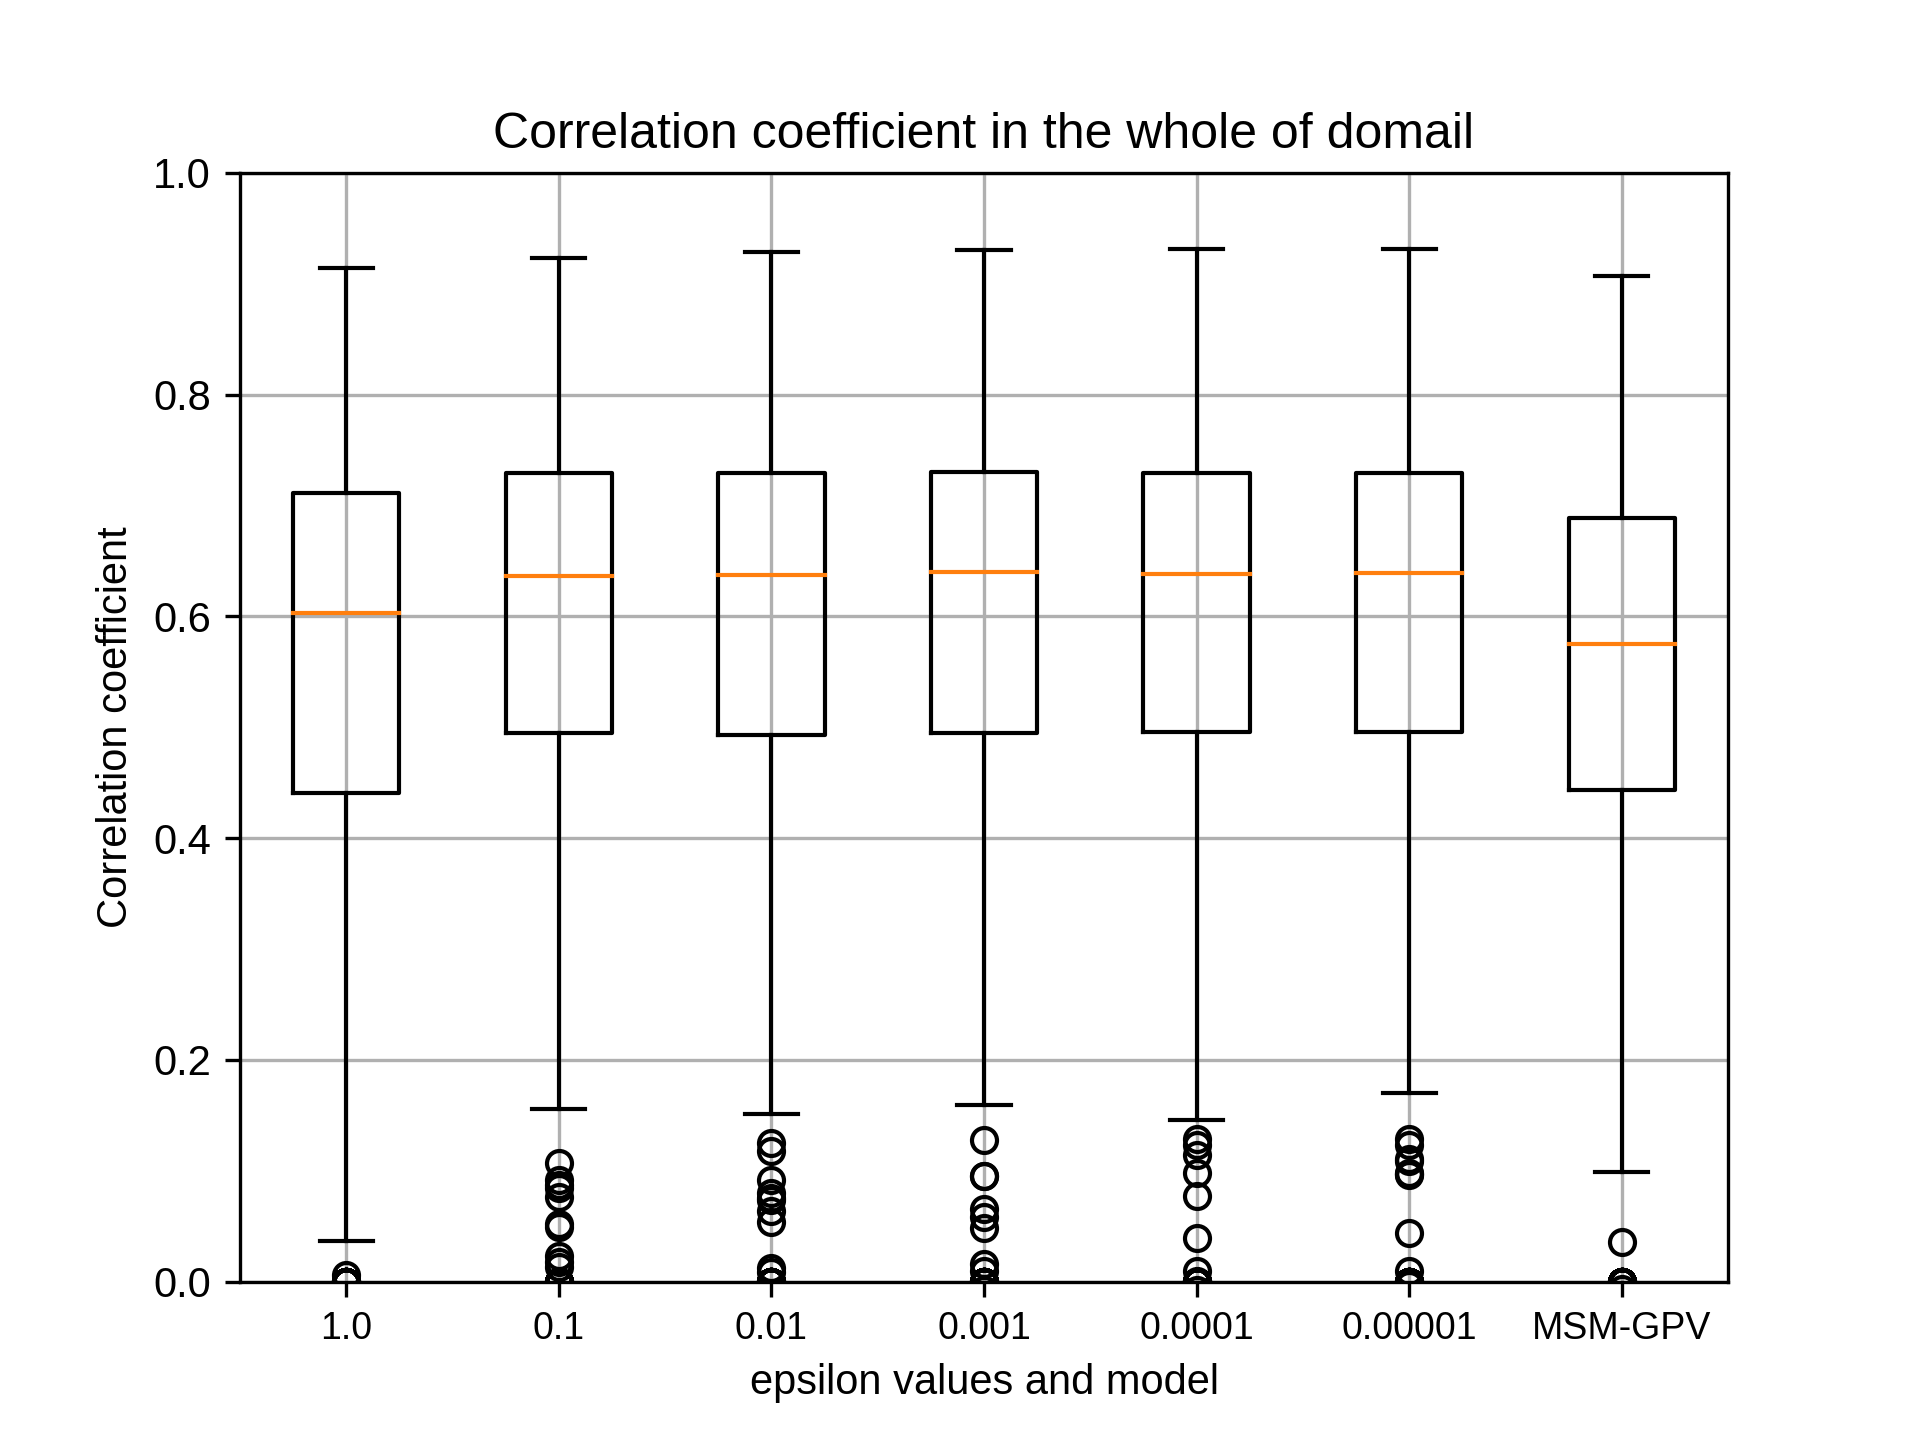
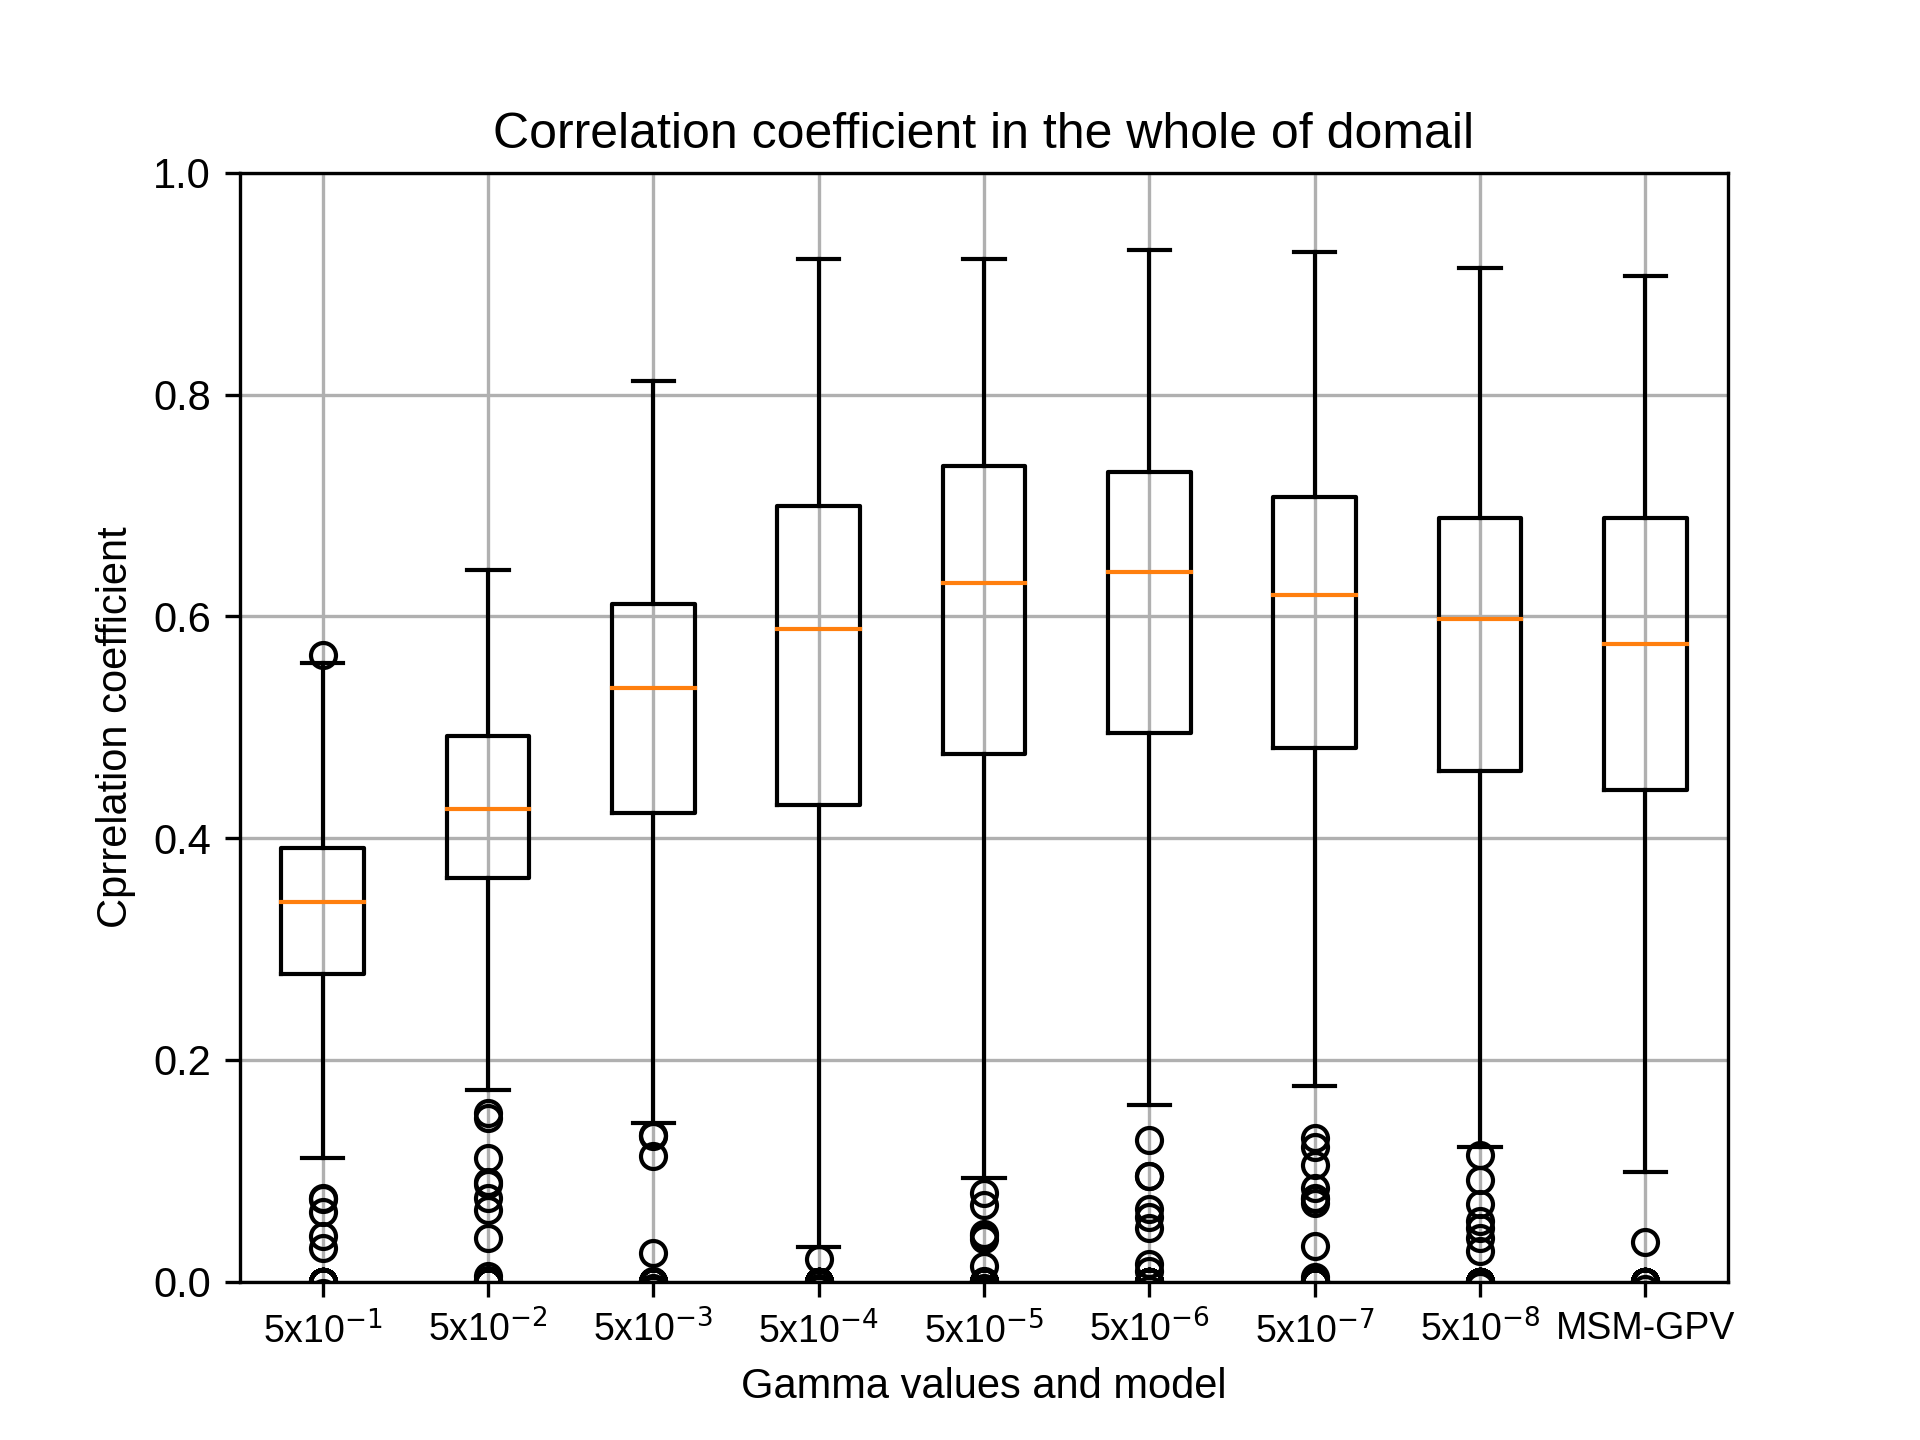
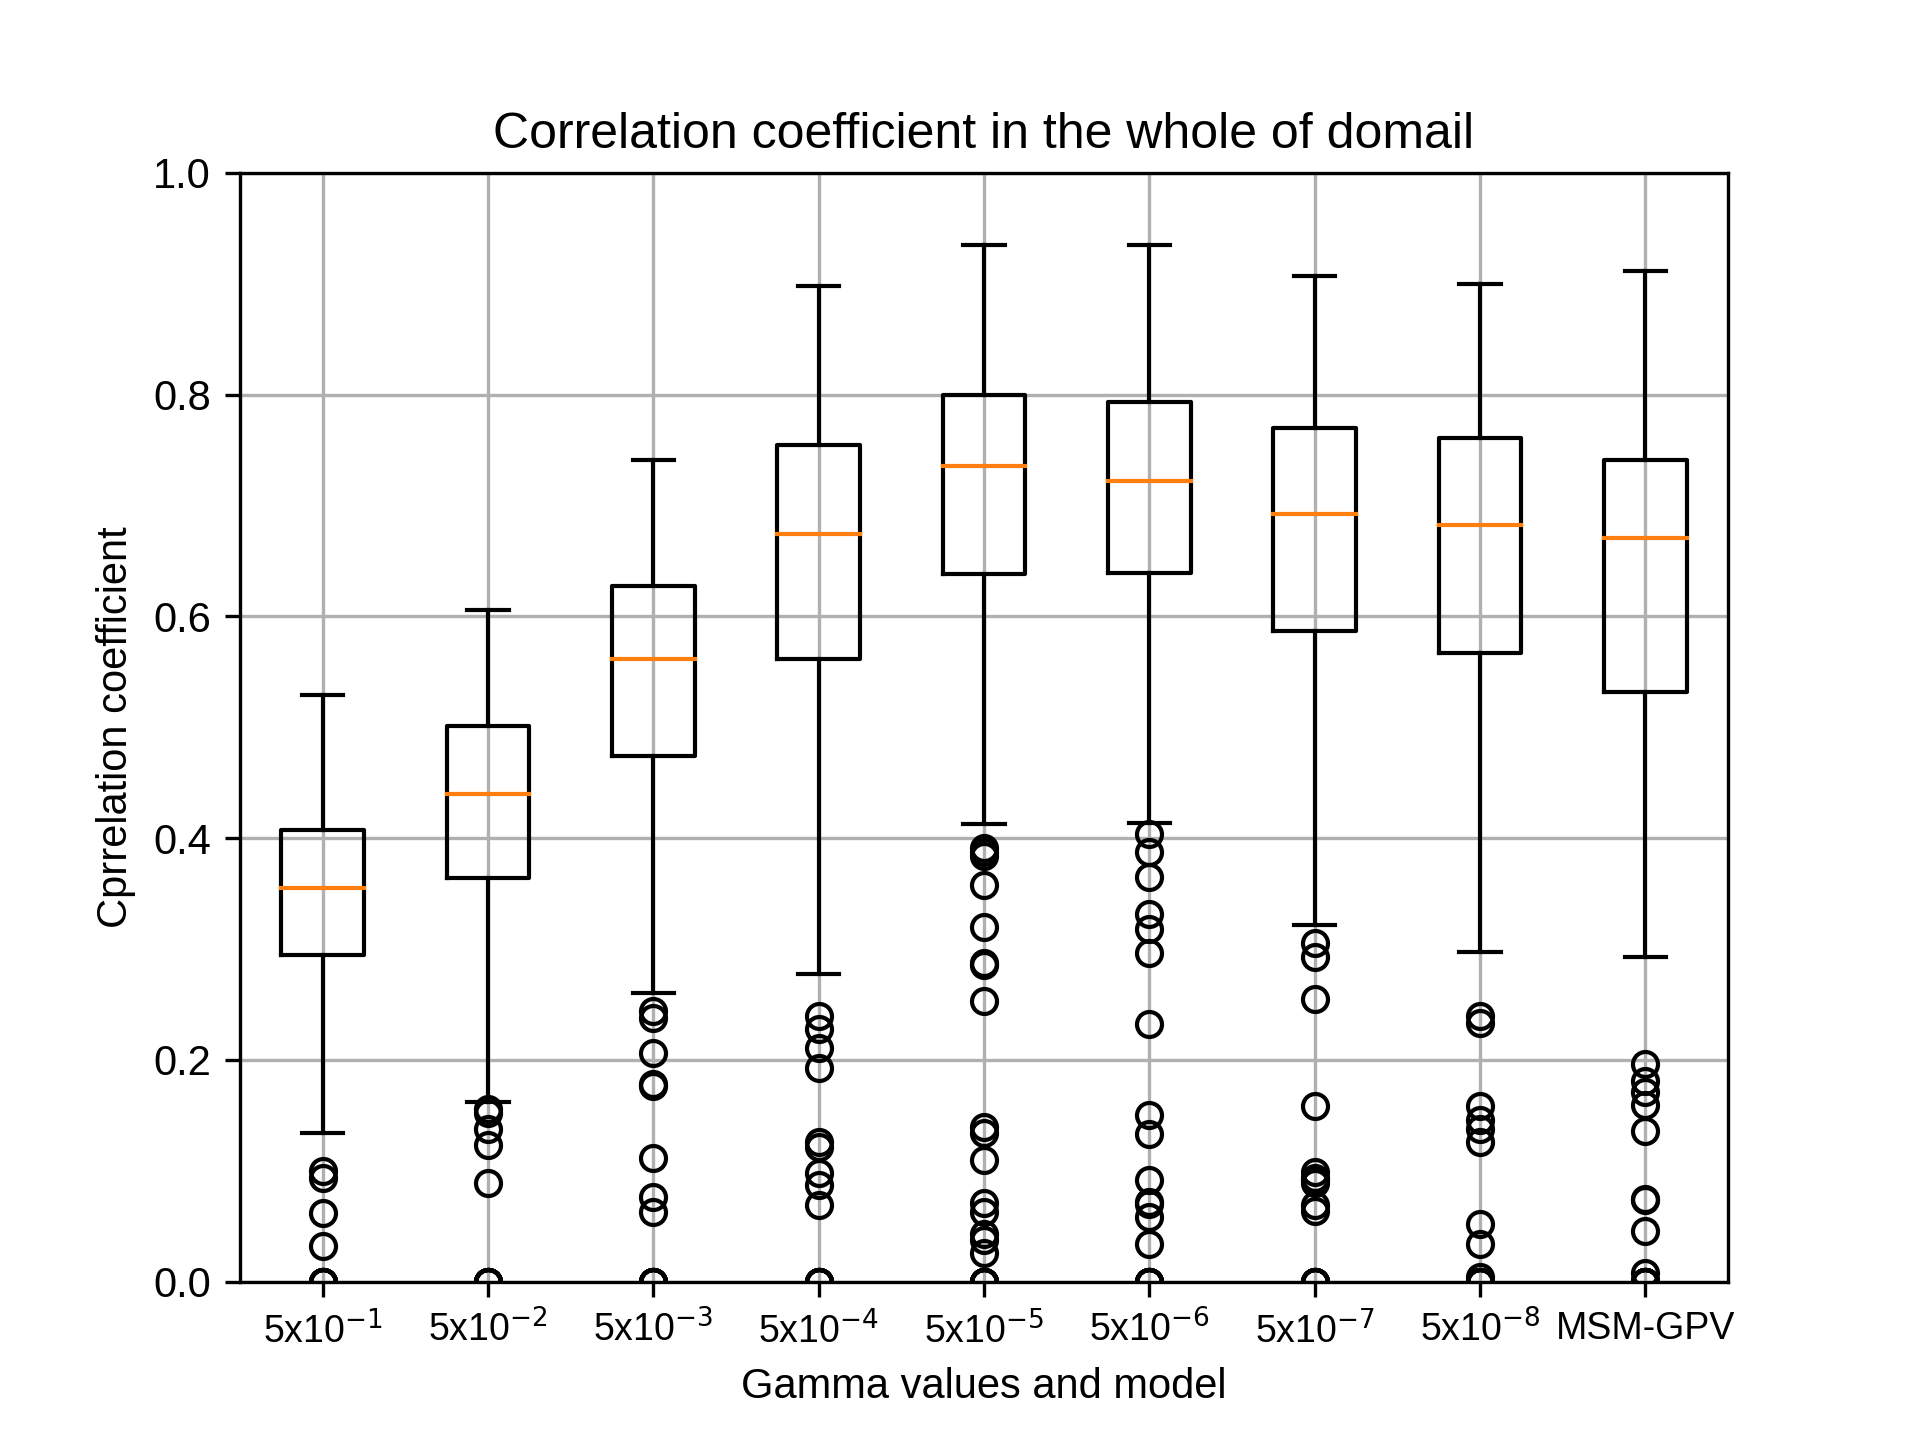
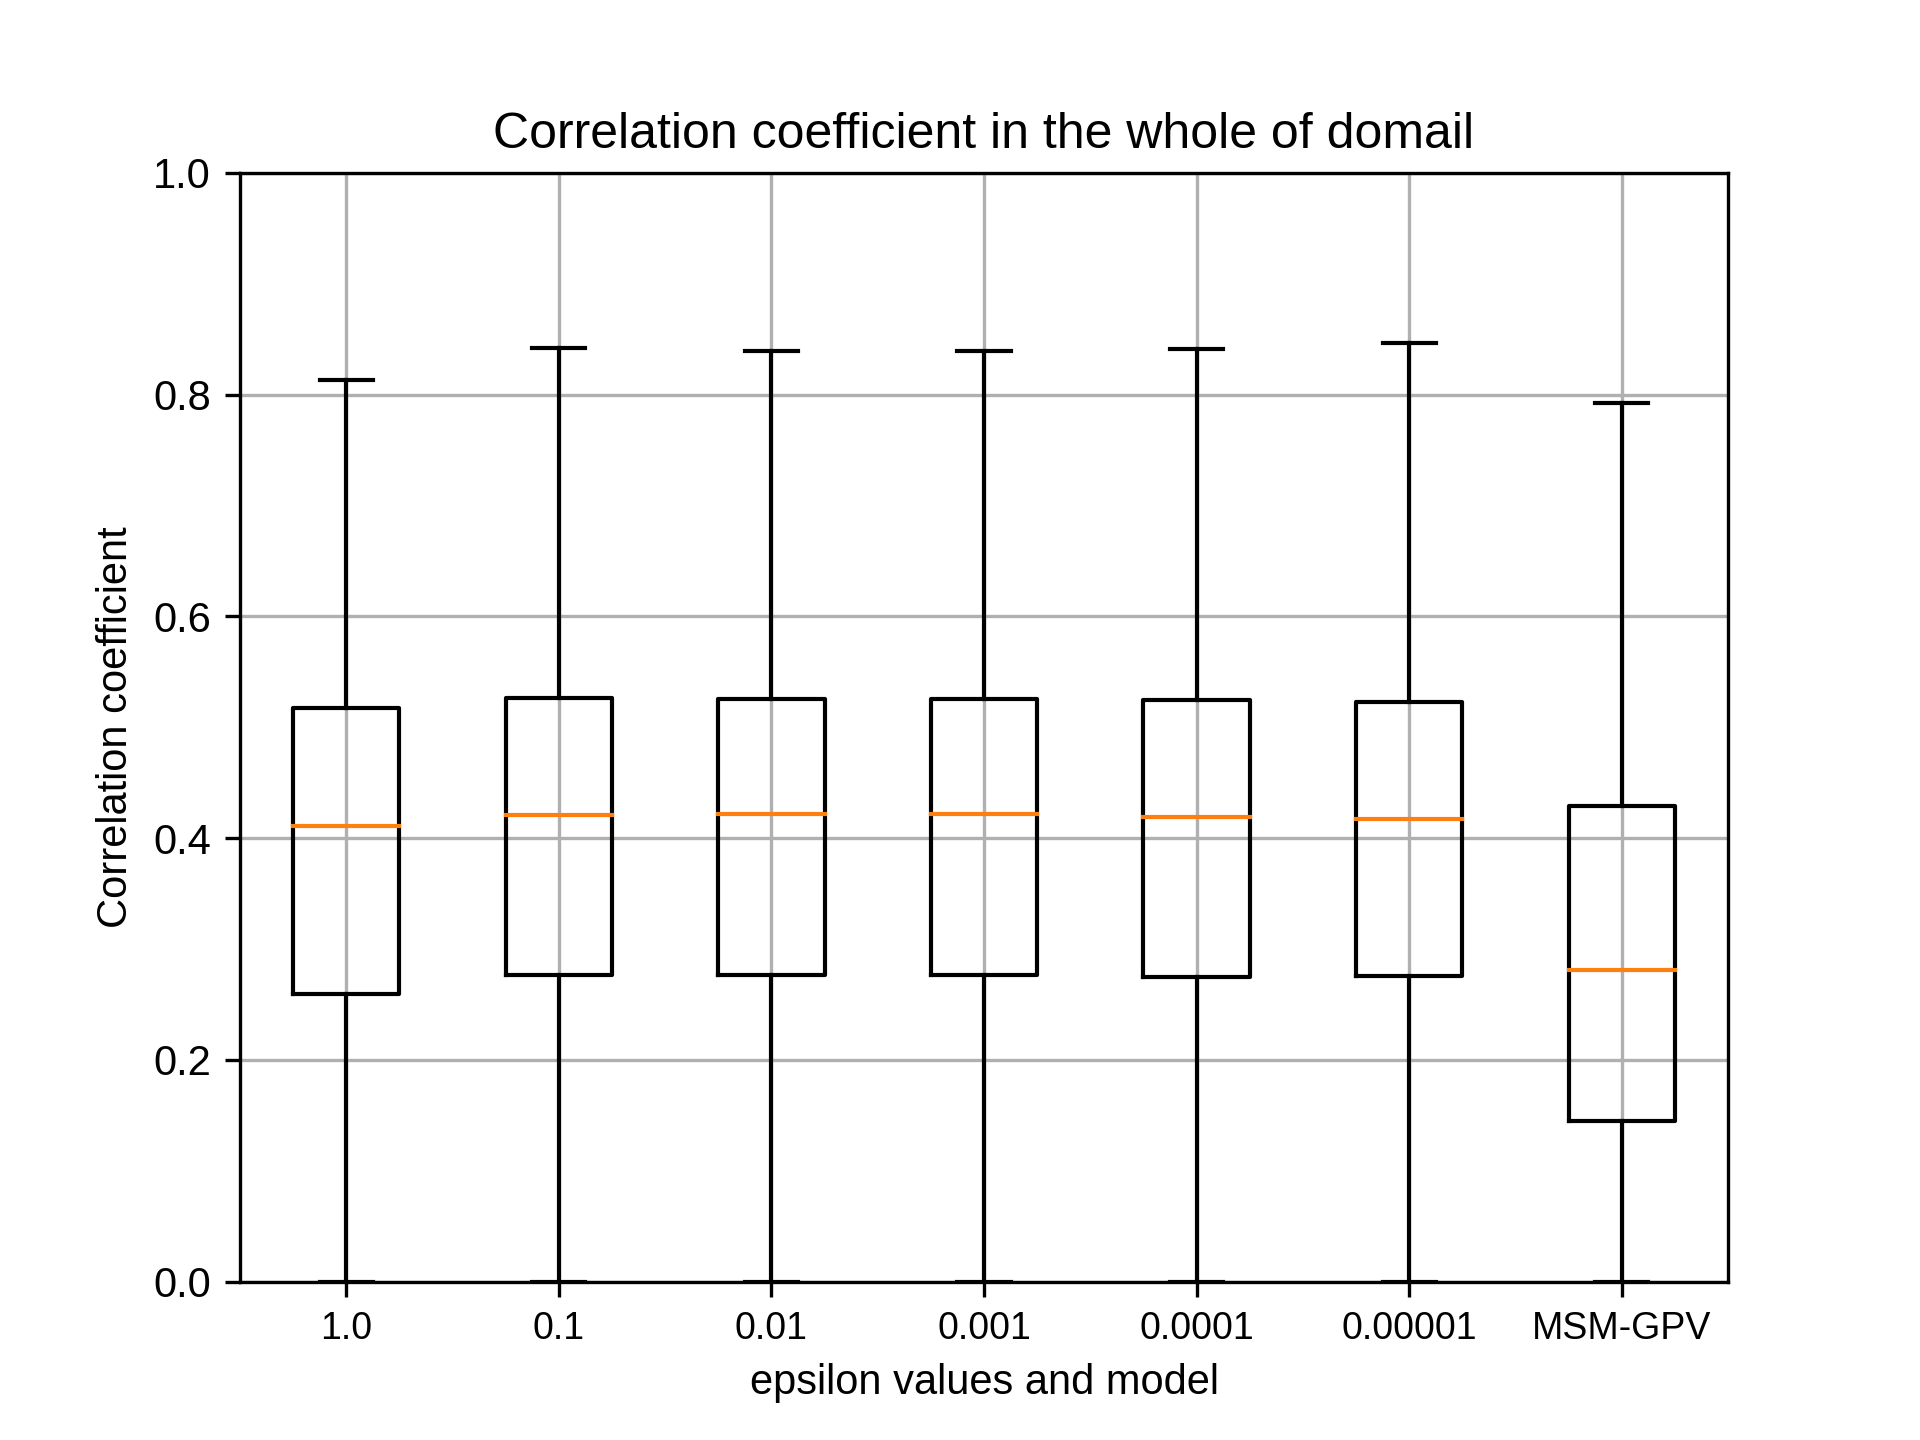
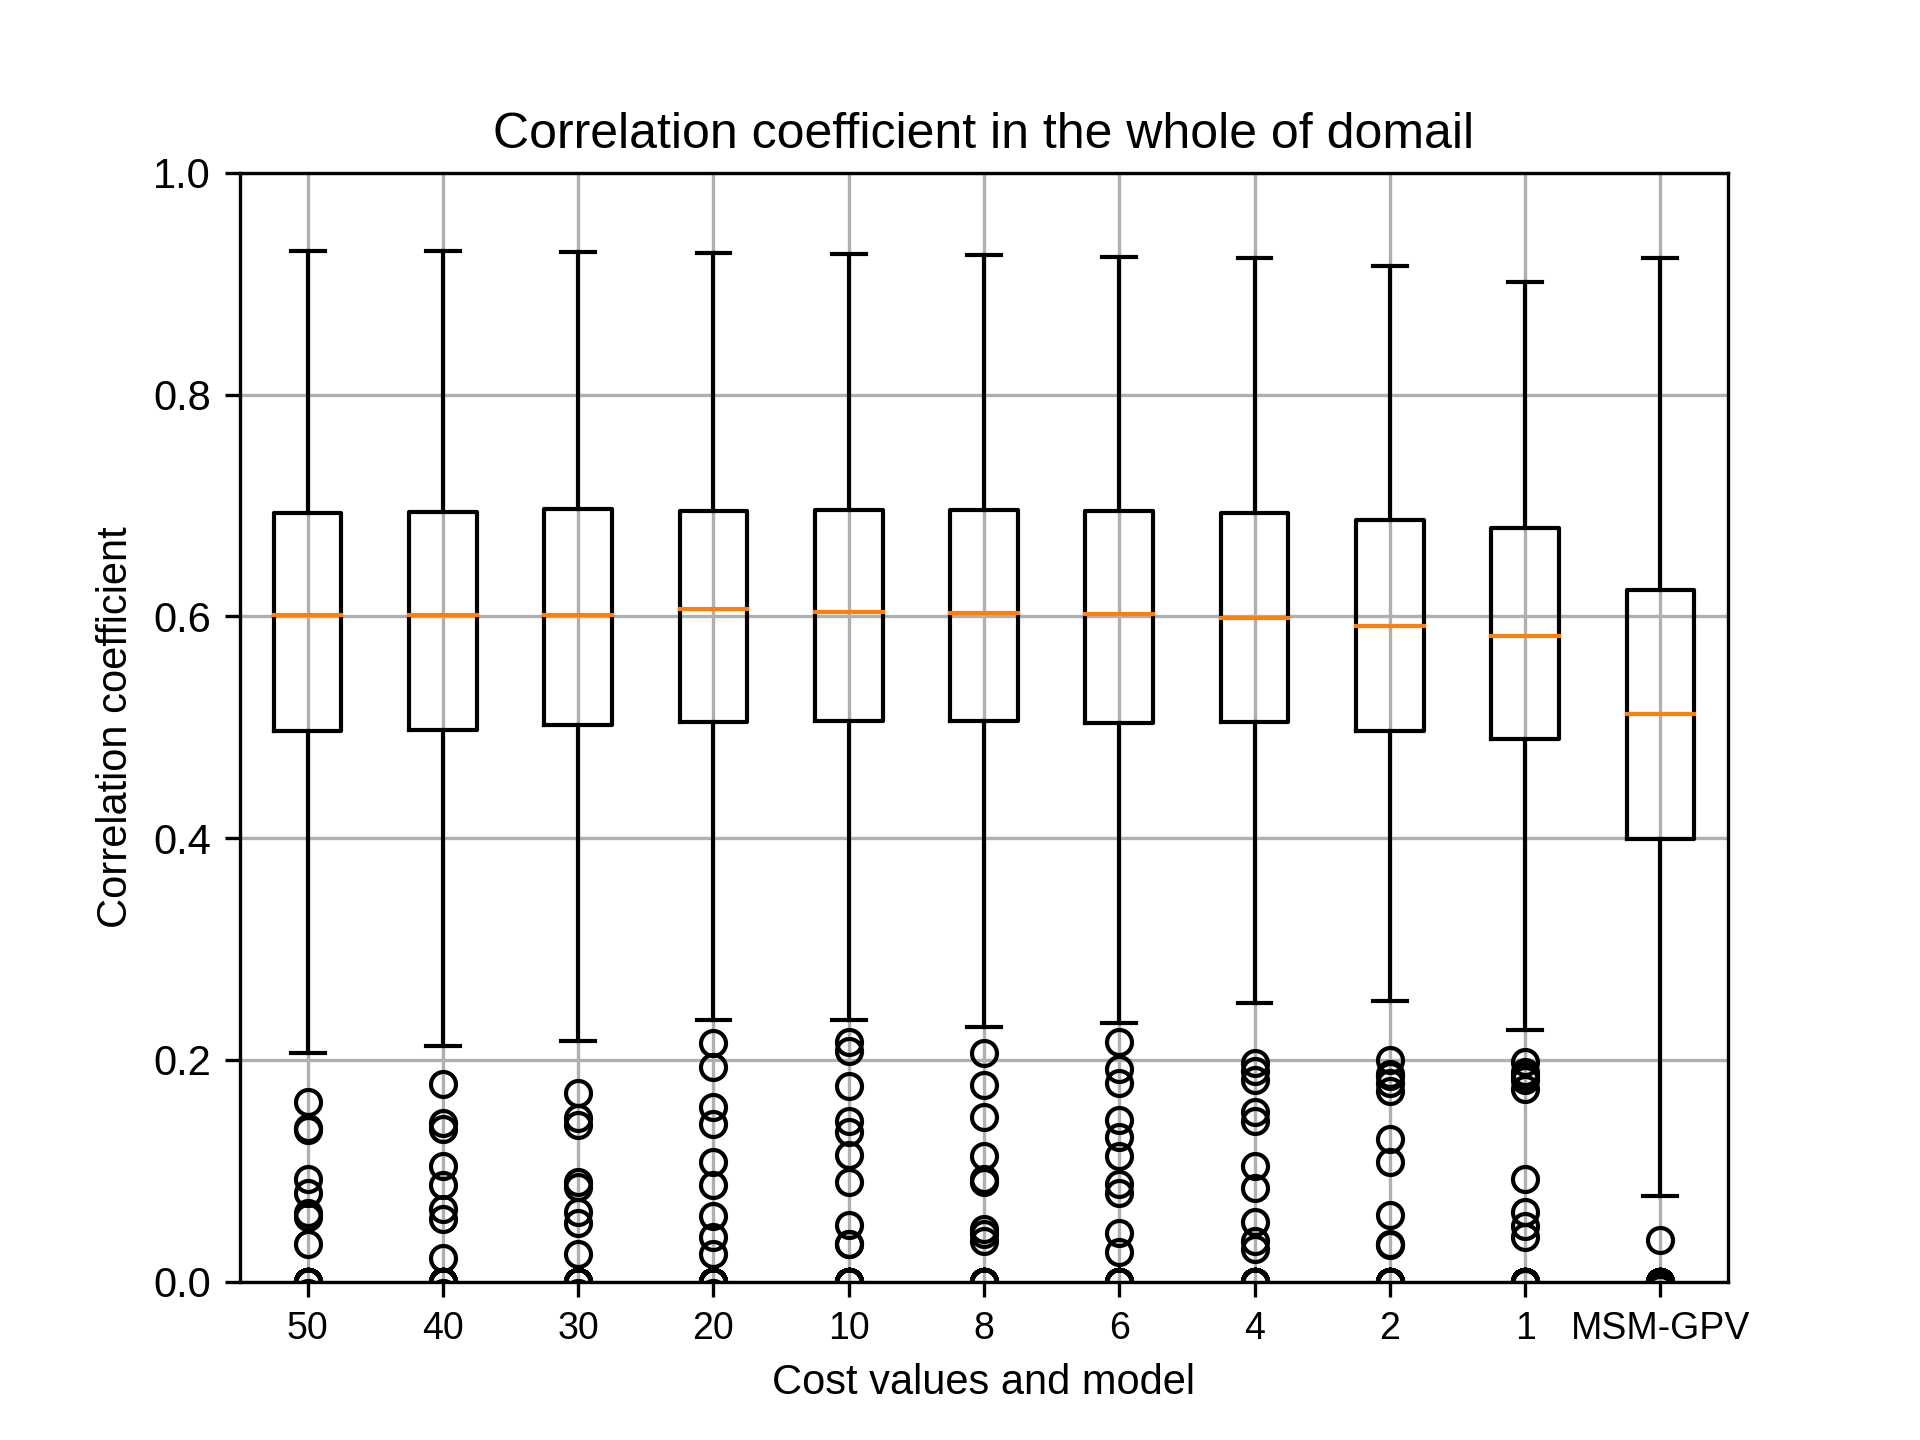
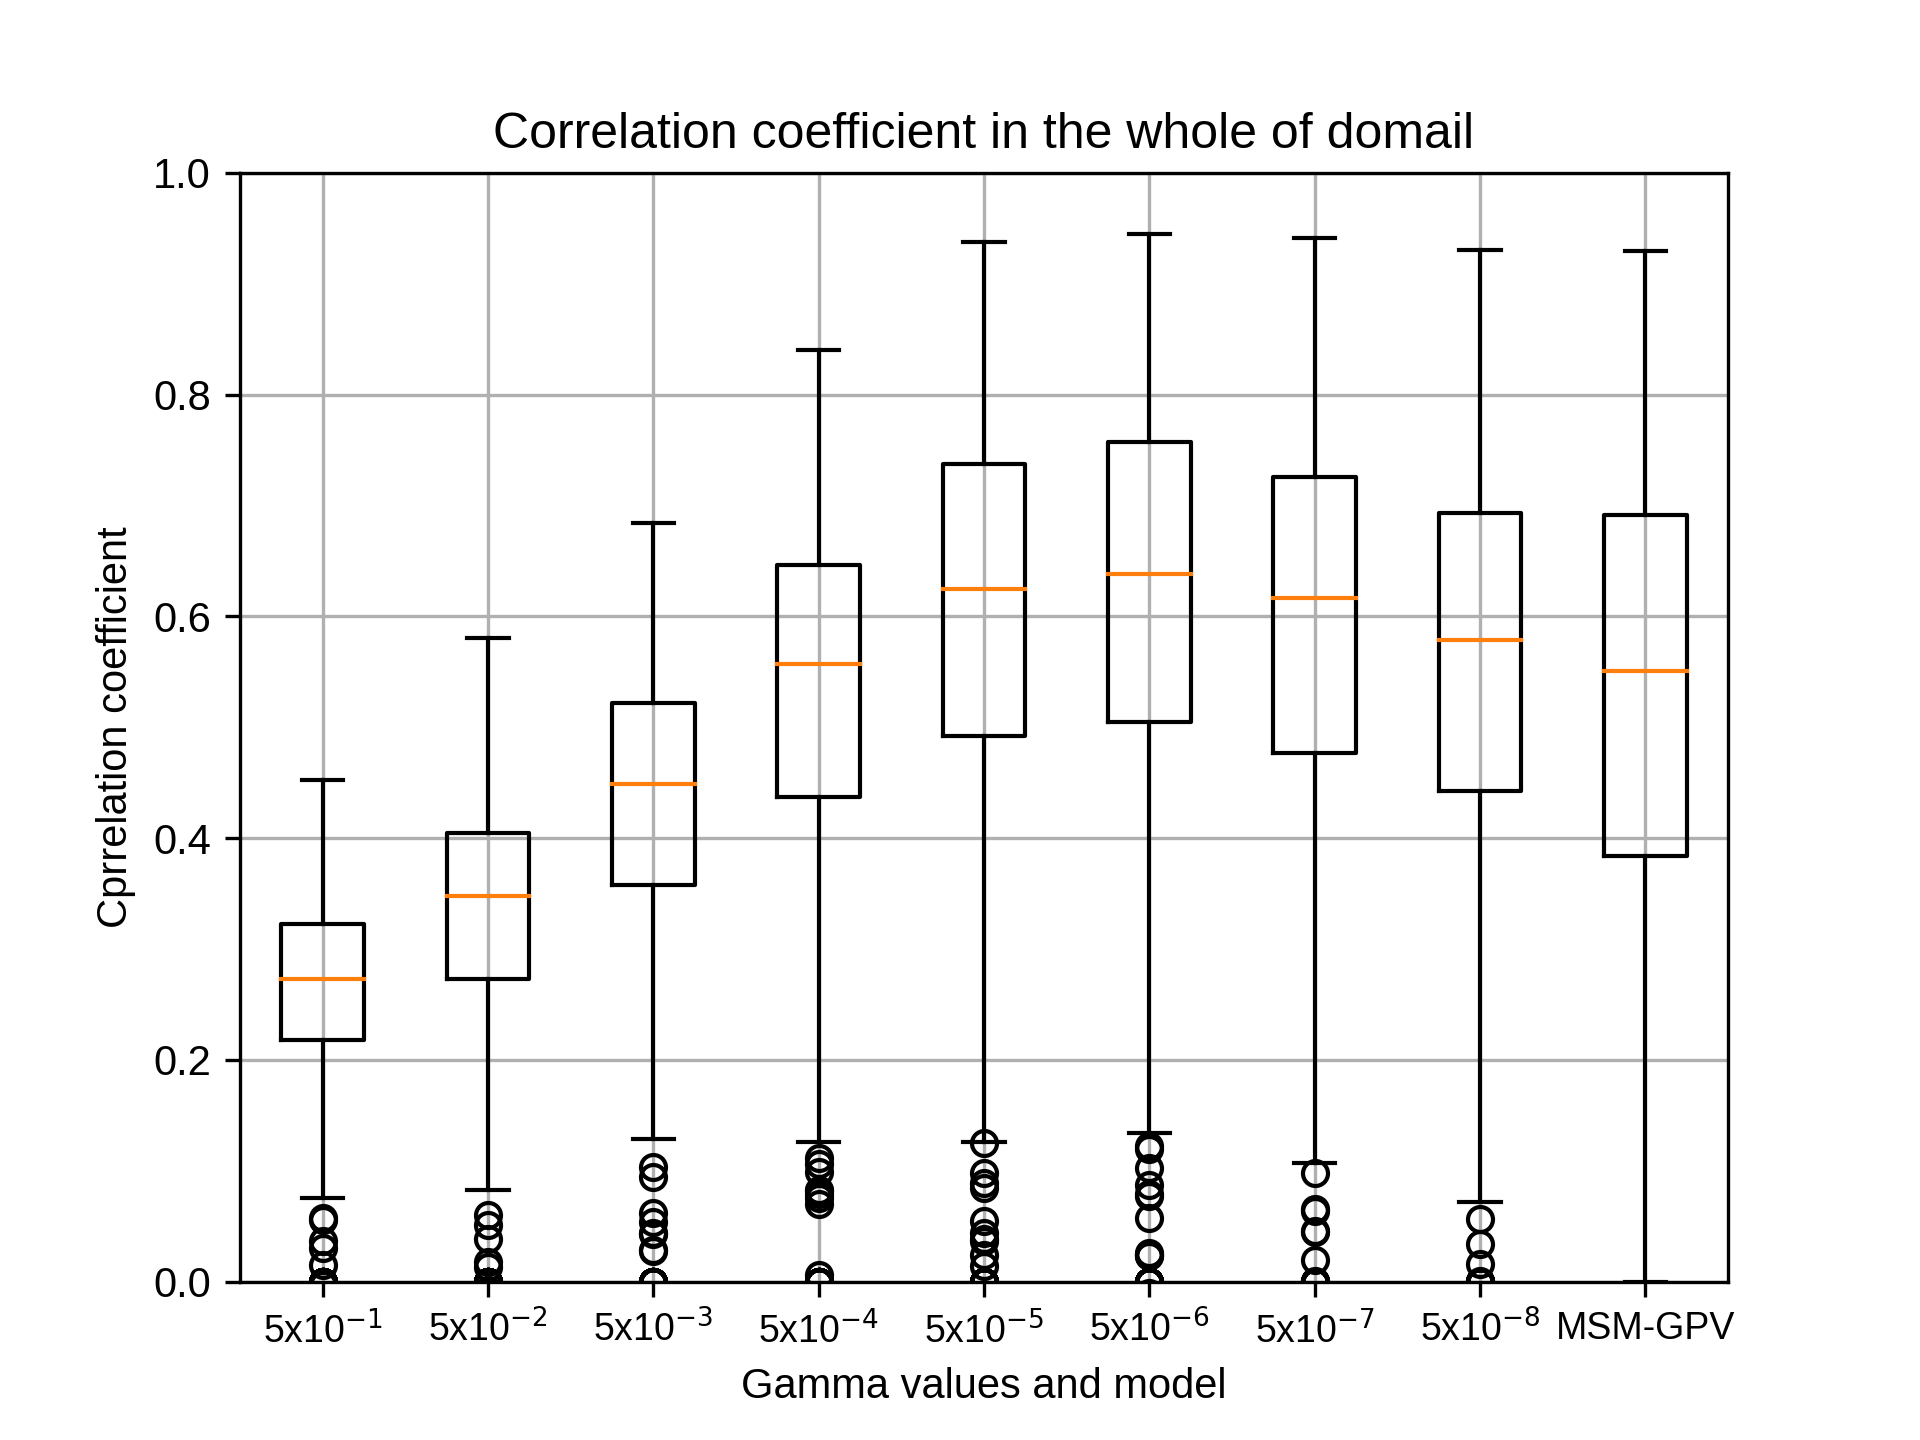
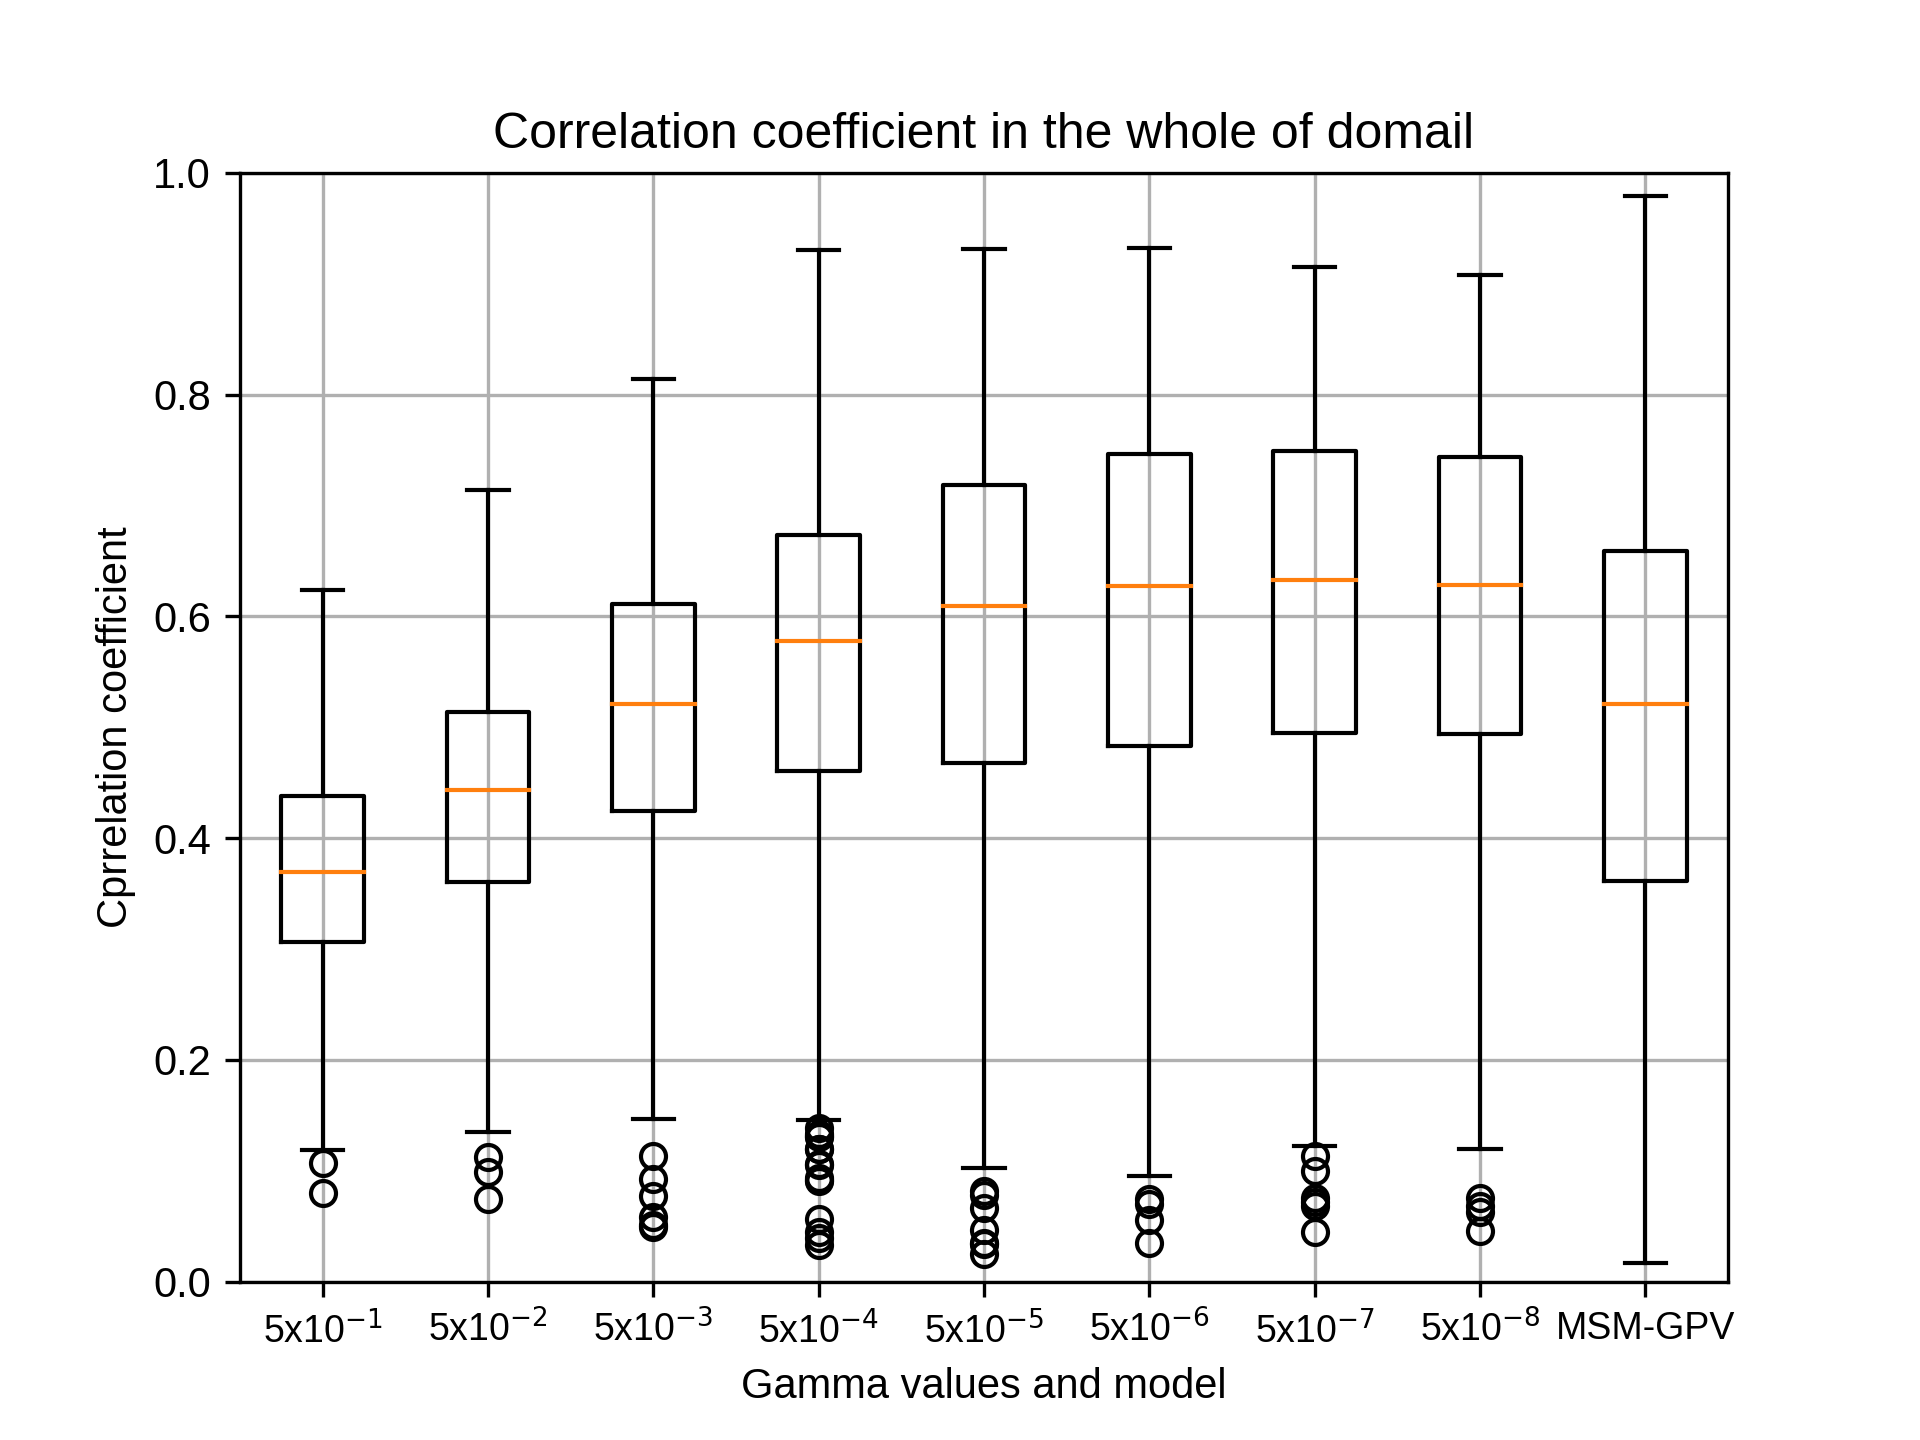
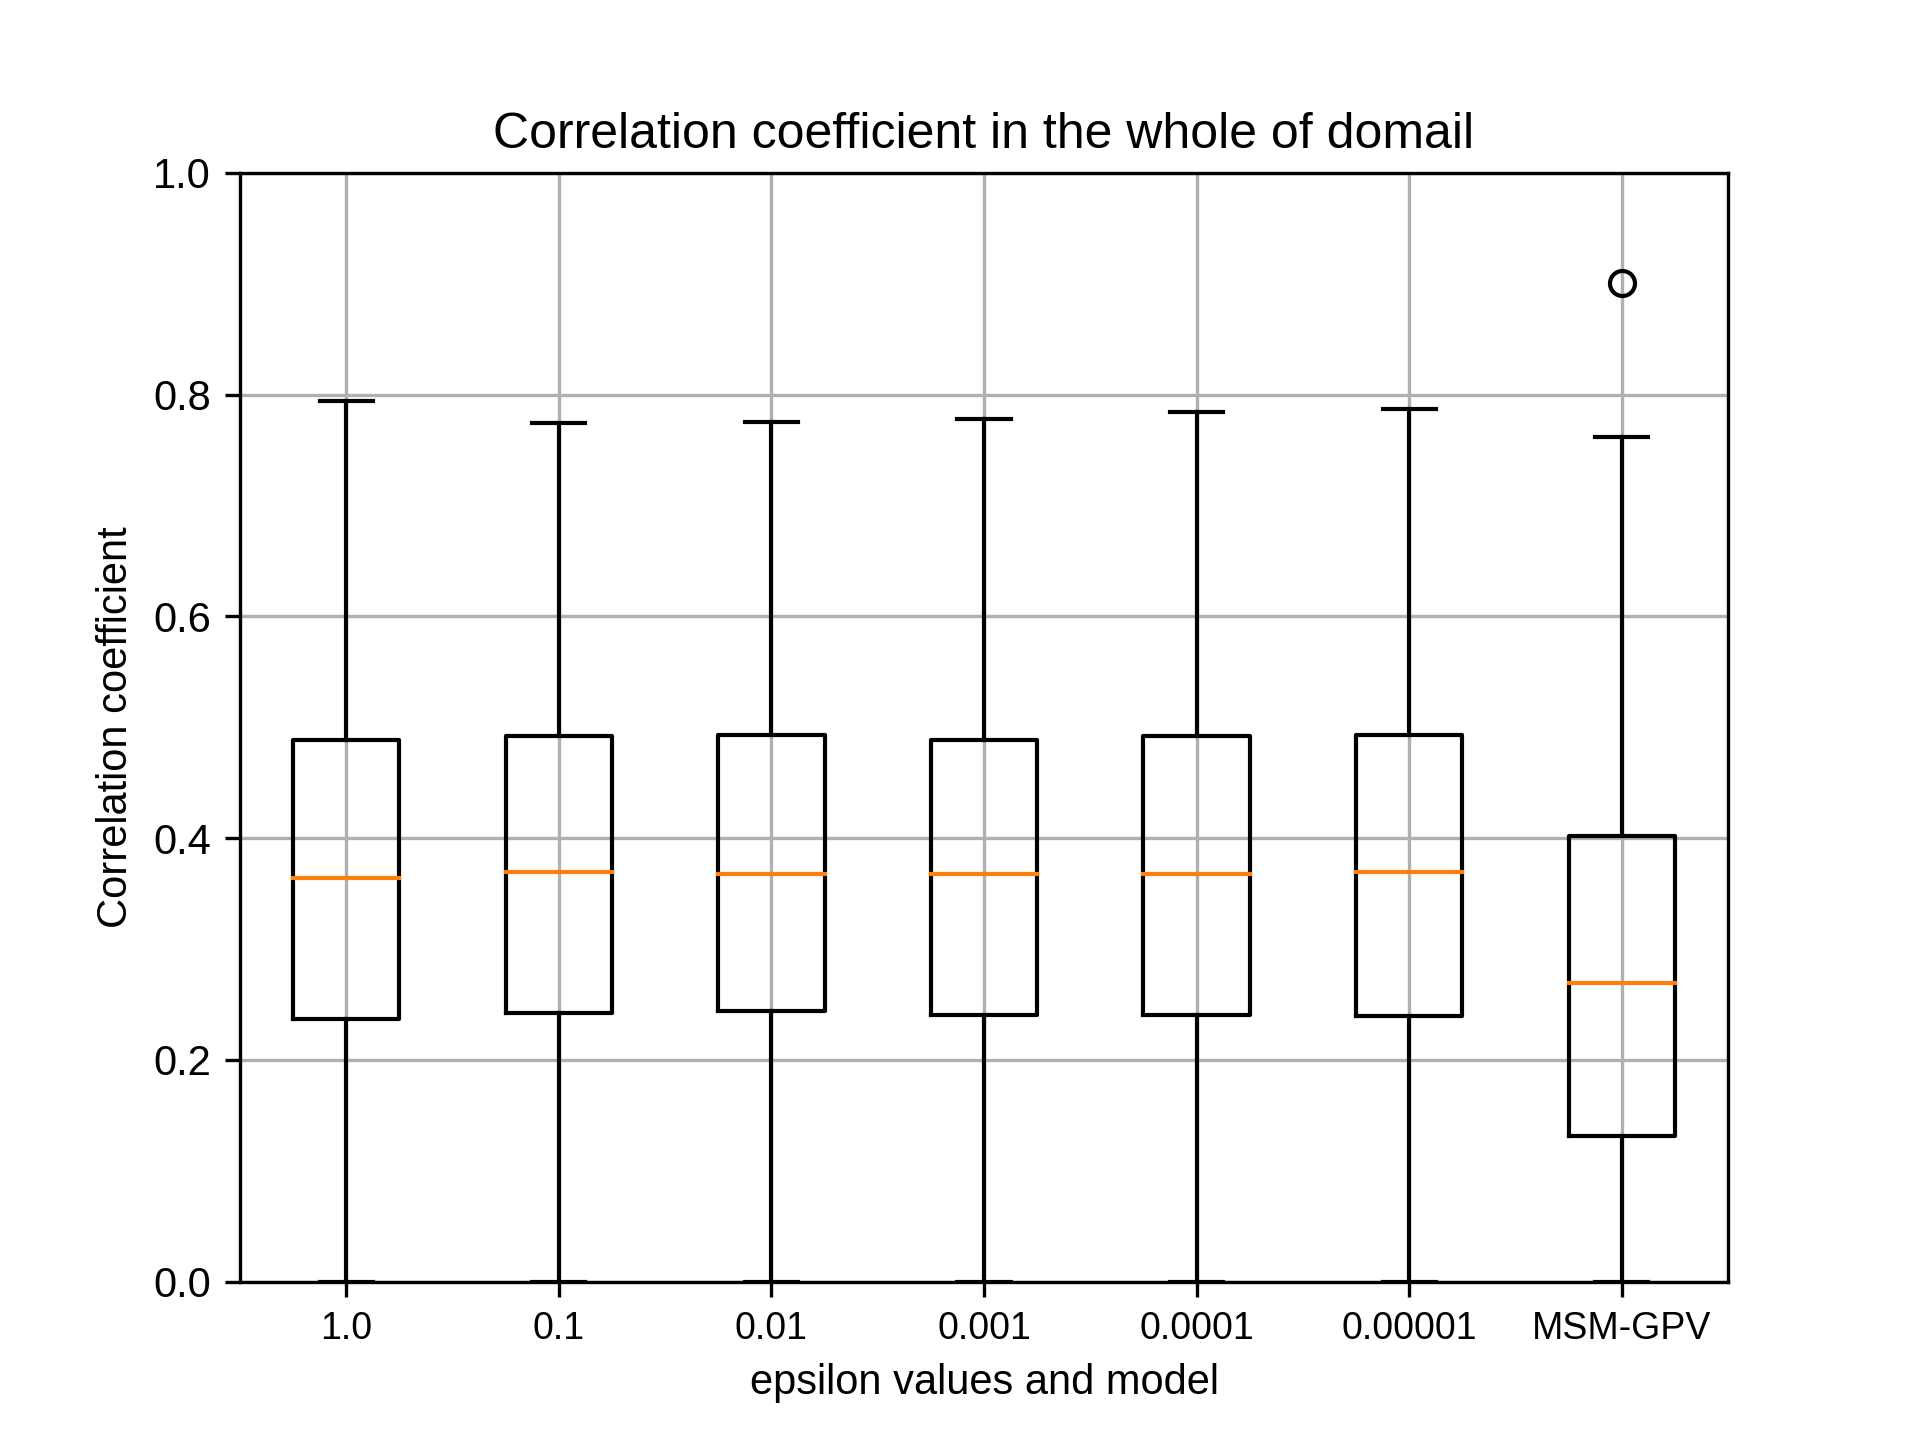
小林様。ありがとうございます。基本的には相関係数の中央値でみてもっともパフォーマンスの良い値を選択していただけますでしょうか。Cについてはとりあえずそれで問題ないと思います。Cが終了しましたら、同様にepsilonをお願いいたします。
小林様。ありがとうございます。基本的には相関係数の中央値でみてもっともパフォーマンスの良い値を選択していただけますでしょうか。Cについてはとりあえずそれで問題ないと思います。Cが終了しましたら、同様にepsilonをお願いいたします。
kobayashi_yusukeWednesday, September 9th, 2020 at 8:43:59 PM GMT+09:00
@takao-y
吉兼先生
承知いたしました。まずはコストのグラフ出力ができるようプログラム改修を行います。その後にsiteA~siteEまでガンマを相関係数の中央値で最大値として、7月を対象にグラフ出力をいたします。引き続きよろしくお願いいたします。
吉兼先生
承知いたしました。まずはコストのグラフ出力ができるようプログラム改修を行います。その後にsiteA~siteEまでガンマを相関係数の中央値で最大値として、7月を対象にグラフ出力をいたします。引き続きよろしくお願いいたします。
takao-yThursday, September 10th, 2020 at 11:05:35 AM GMT+09:00
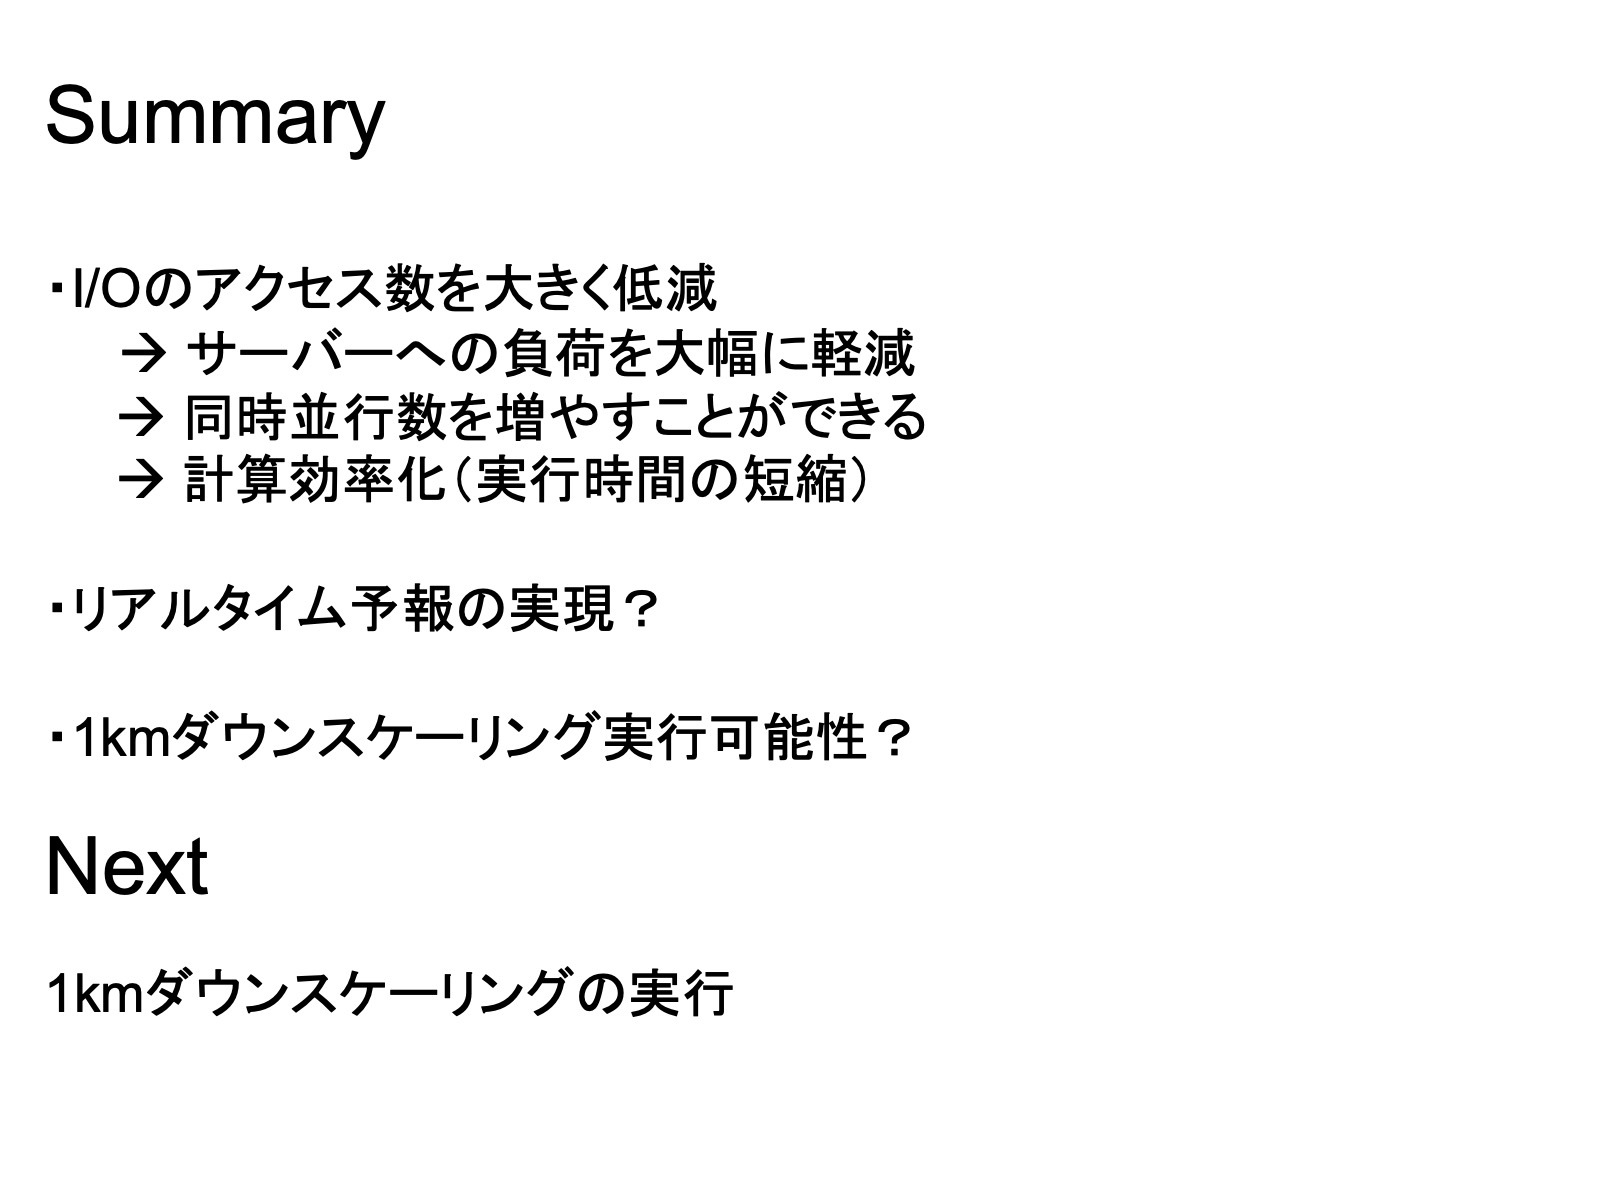
機械学習の入出力のバイナリ化ですが、経度方向で一括してバイナリ化することにより、I/Oへの負担を大幅に低減(1/経度方向のグリッド数)できました。これに伴い、識別器ファイルの生成も高速化し、今までの1/2以下の時間で終了できるようになりました。近日中に整備して皆様に使っていただけるようにいたします。
1kmへのダウンスケール実験もI/Oへの負荷をかけずに高速に処理できるようになると考えています。(当初は、全グリッドを一括で読み込むことを考えていたのですが、思った以上に行列計算にかなり時間がかかることから、データを小分けにして対処しています。計算効率的には小分けの範囲を少し拡大しても良いかもしれませんが、今後1kmダウンスケーリングを実施する際に処理する格子点数が多くなることを考慮すると、この方法が効率的かなと考えています。)
I/Oが大幅に軽減できたことにより、書き込み遅延などサーバーのトラブルのリスクが小さくなり、複数CPUによる並行処理も可能になると考えています。今は5つの領域に分けていますが、たとえば30領域に分けて並行処理をすることにより、全国1kmリアルタイムダウンスケーリングも現実的になると想定しています。
報告まで。
keiyoshi08Thursday, September 10th, 2020 at 11:06:22 AM GMT+09:00
すばらしいです!詳細ぜひ教えて下さい。
kobayashi_yusukeFriday, September 11th, 2020 at 6:04:33 PM GMT+09:00
@takao-y
吉兼先生
7月のsiteA~siteEのコストの結果が出ました。
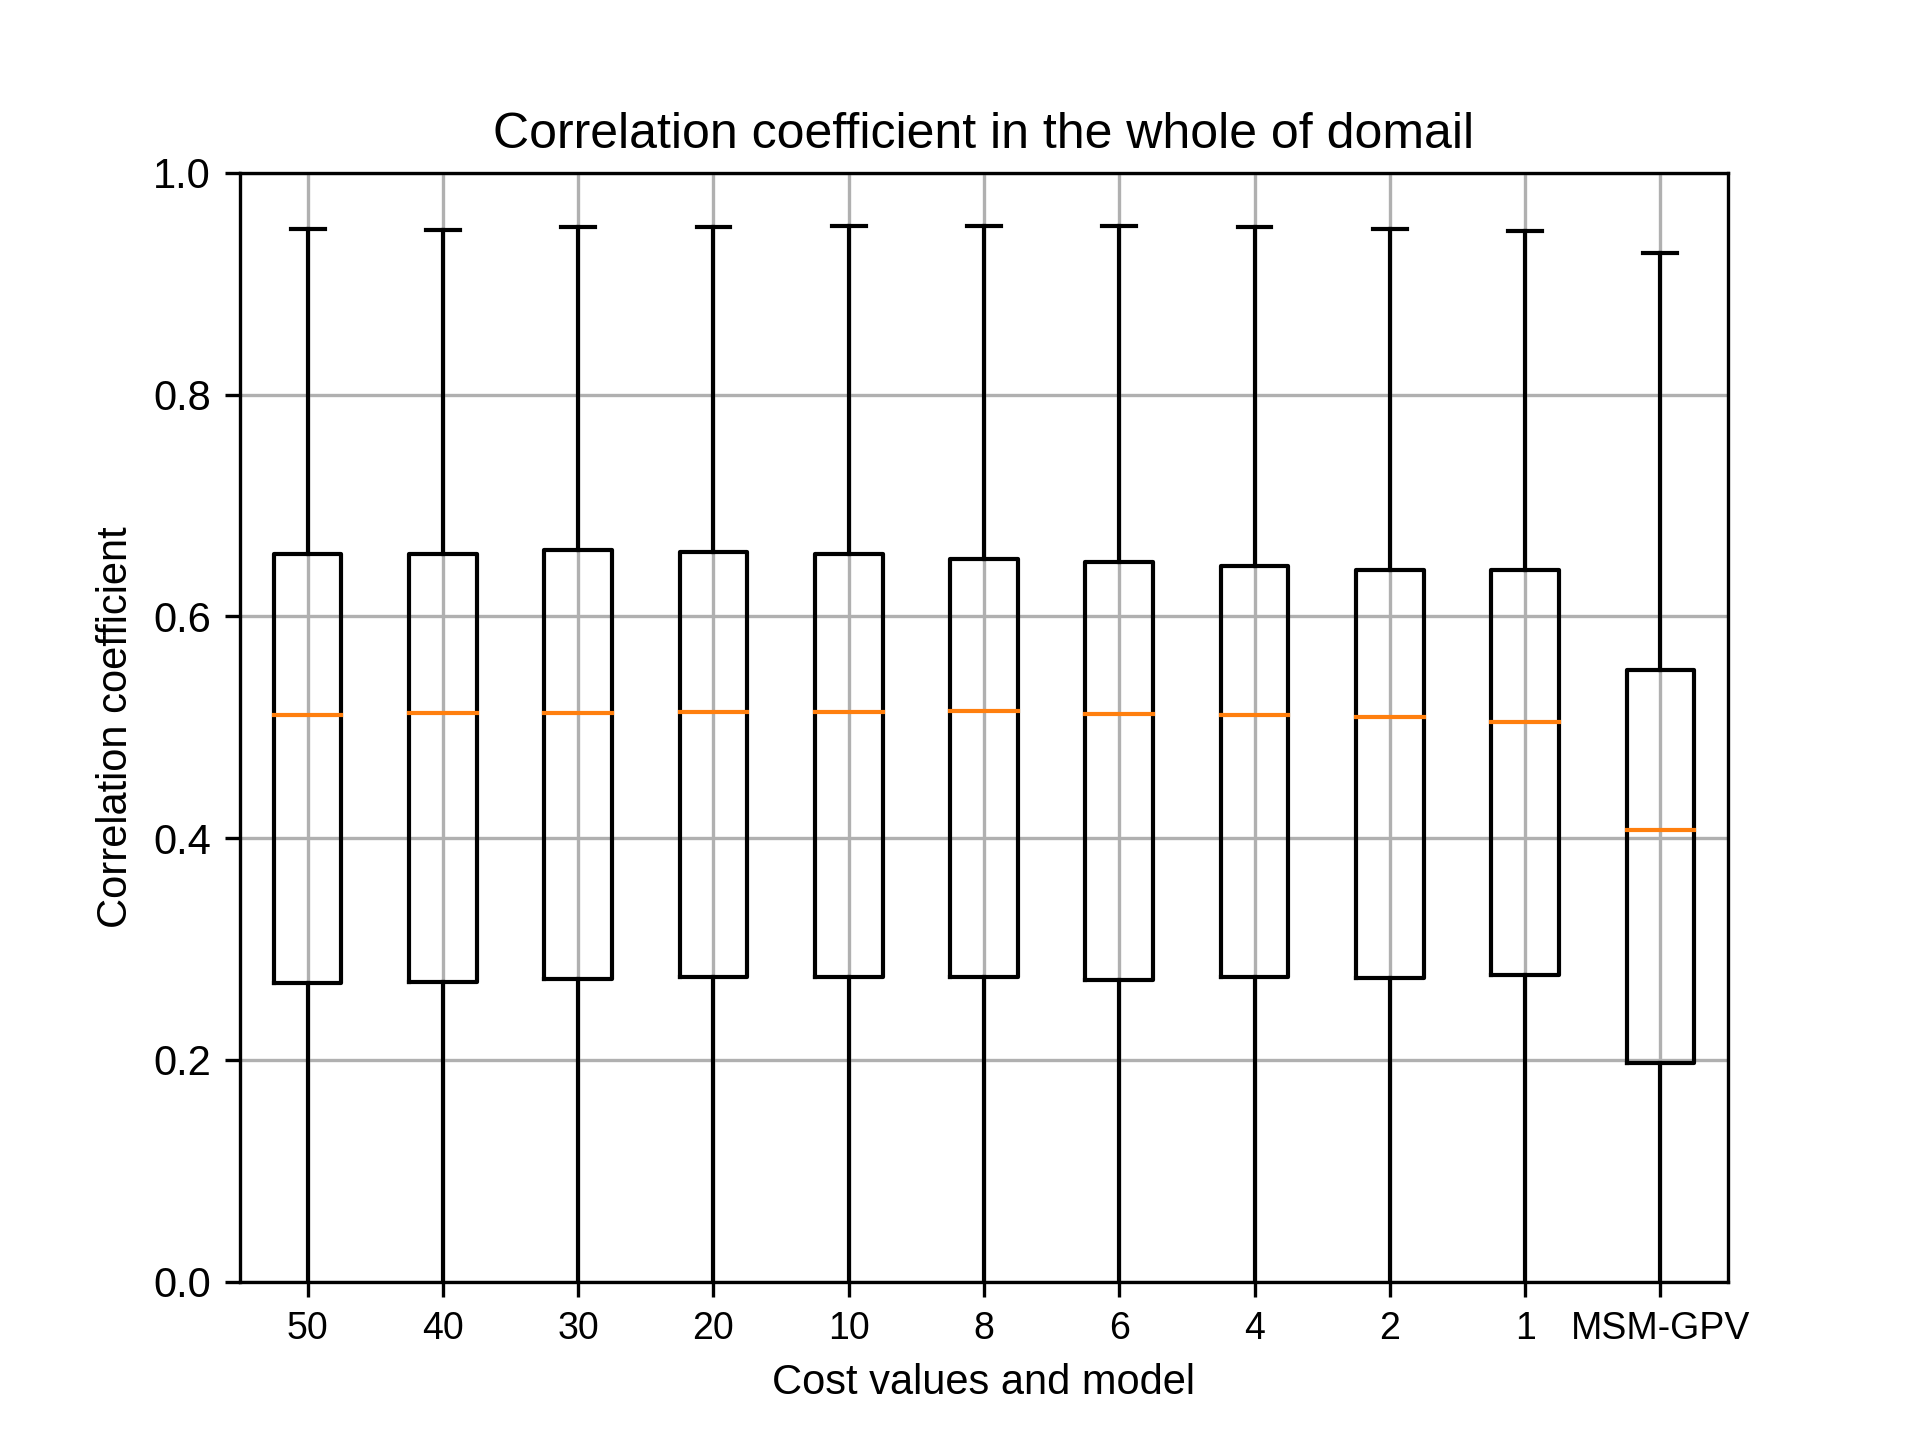
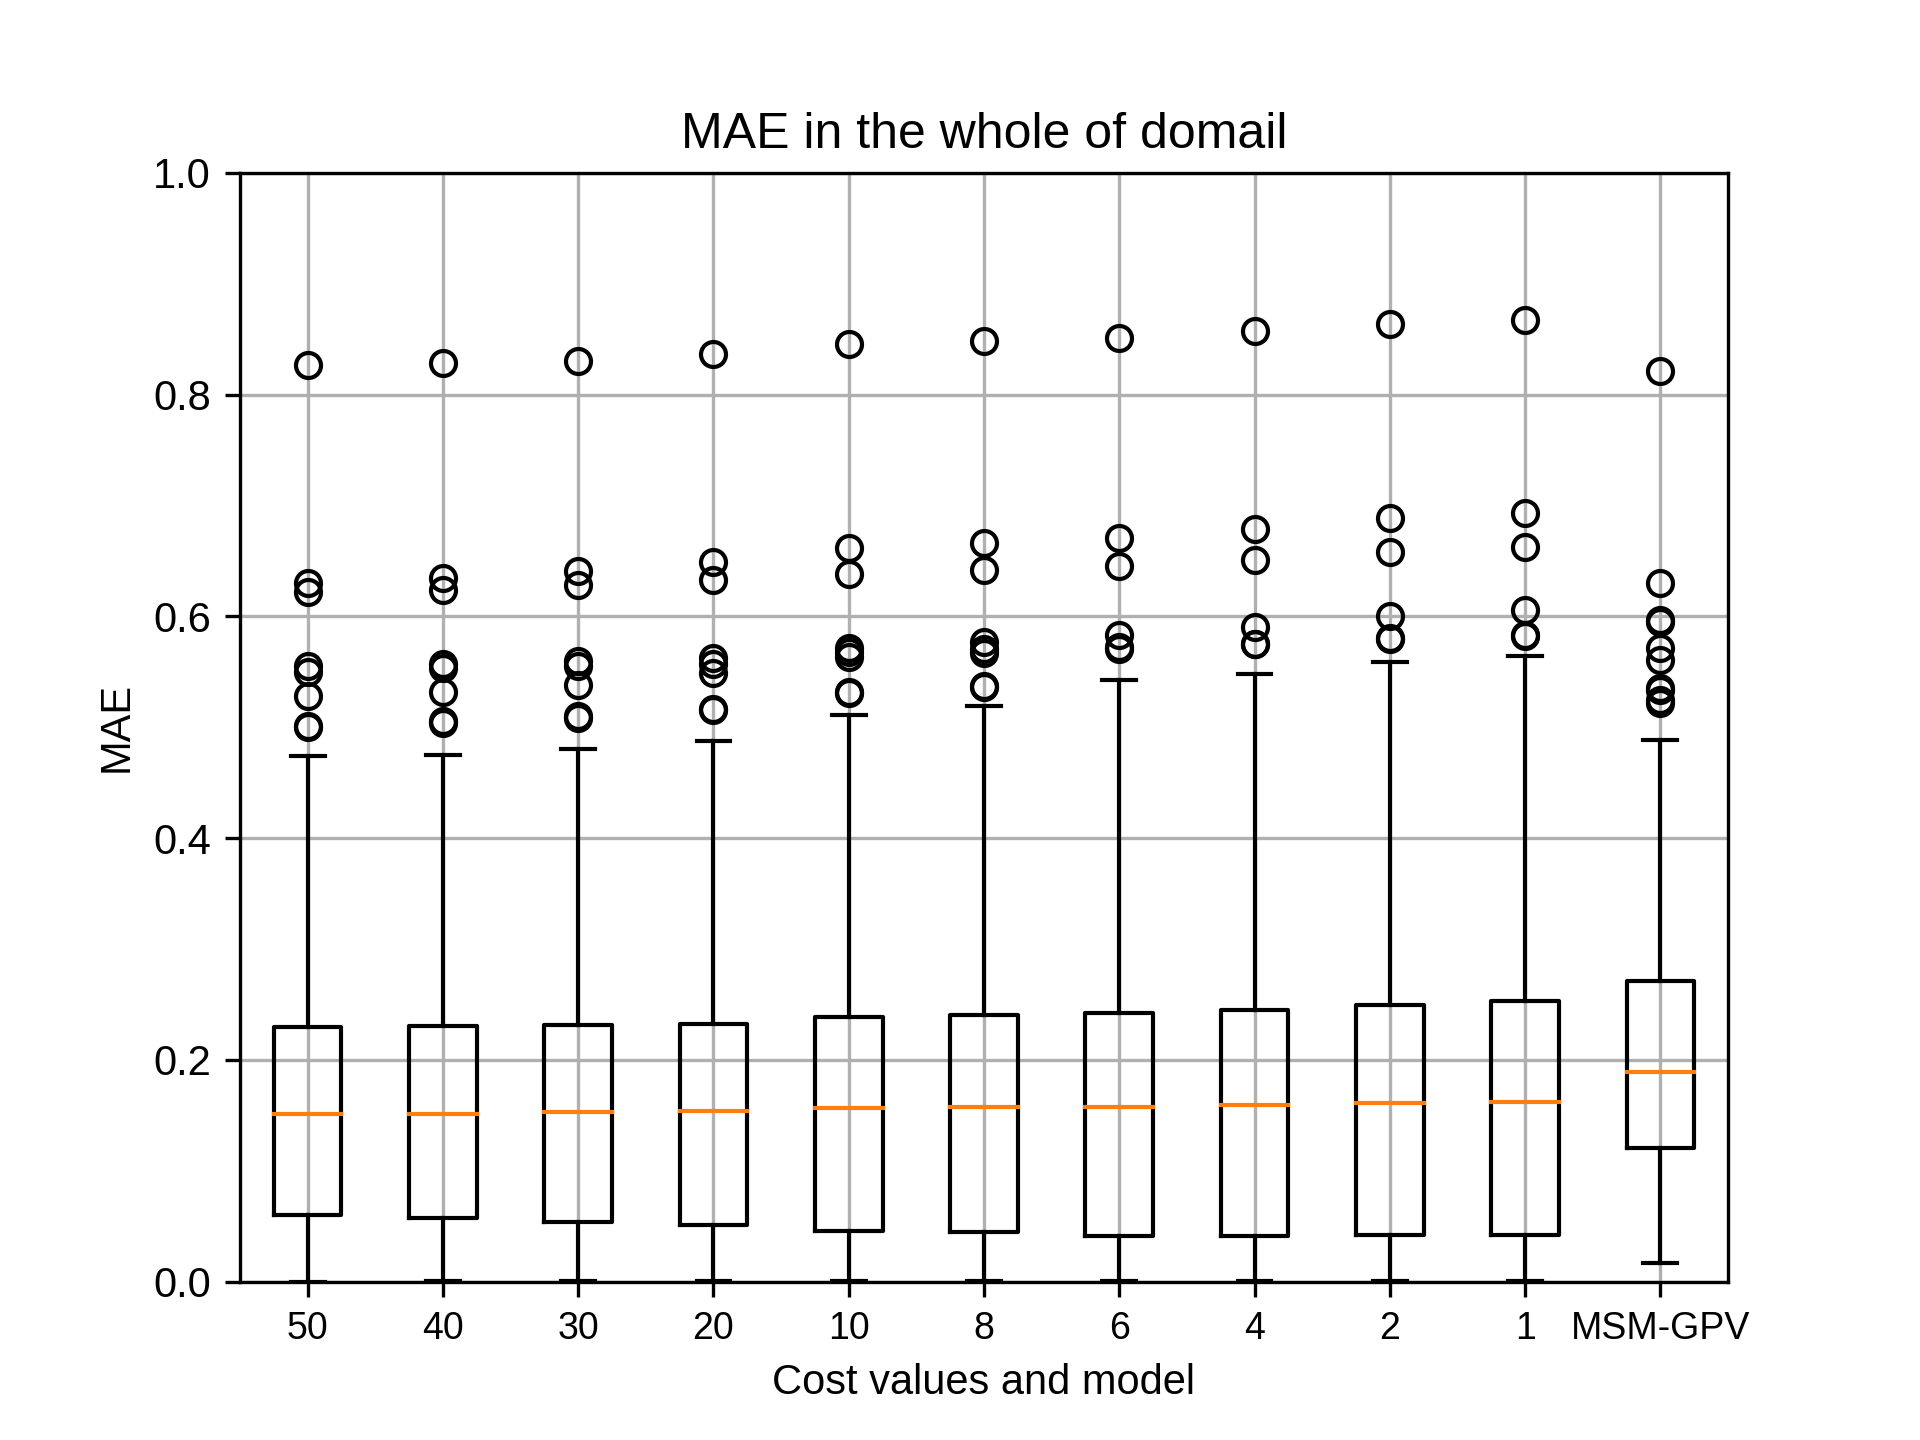
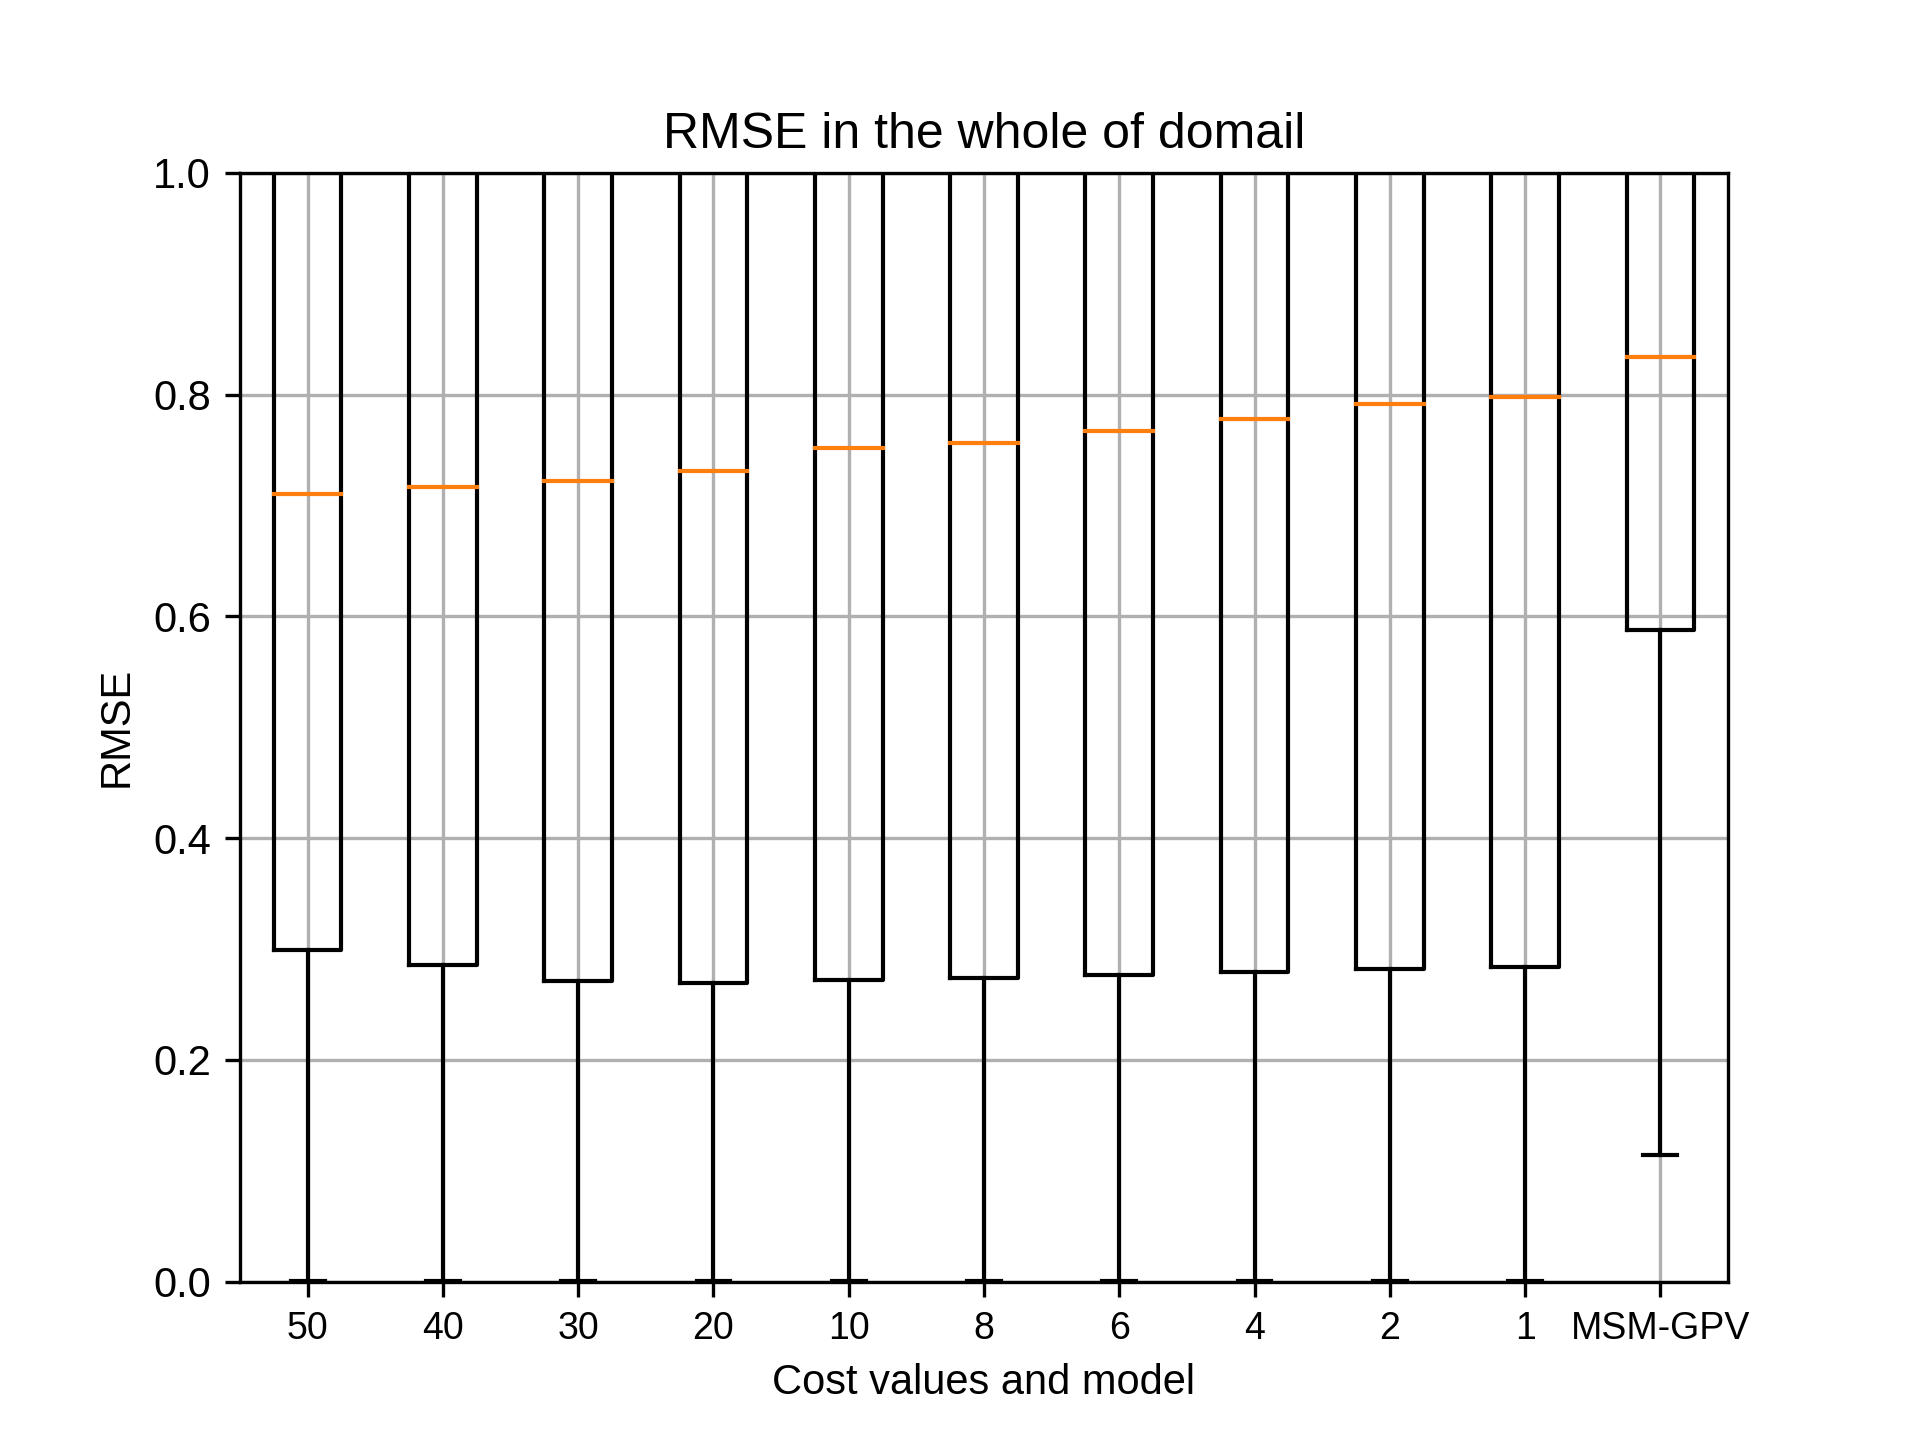
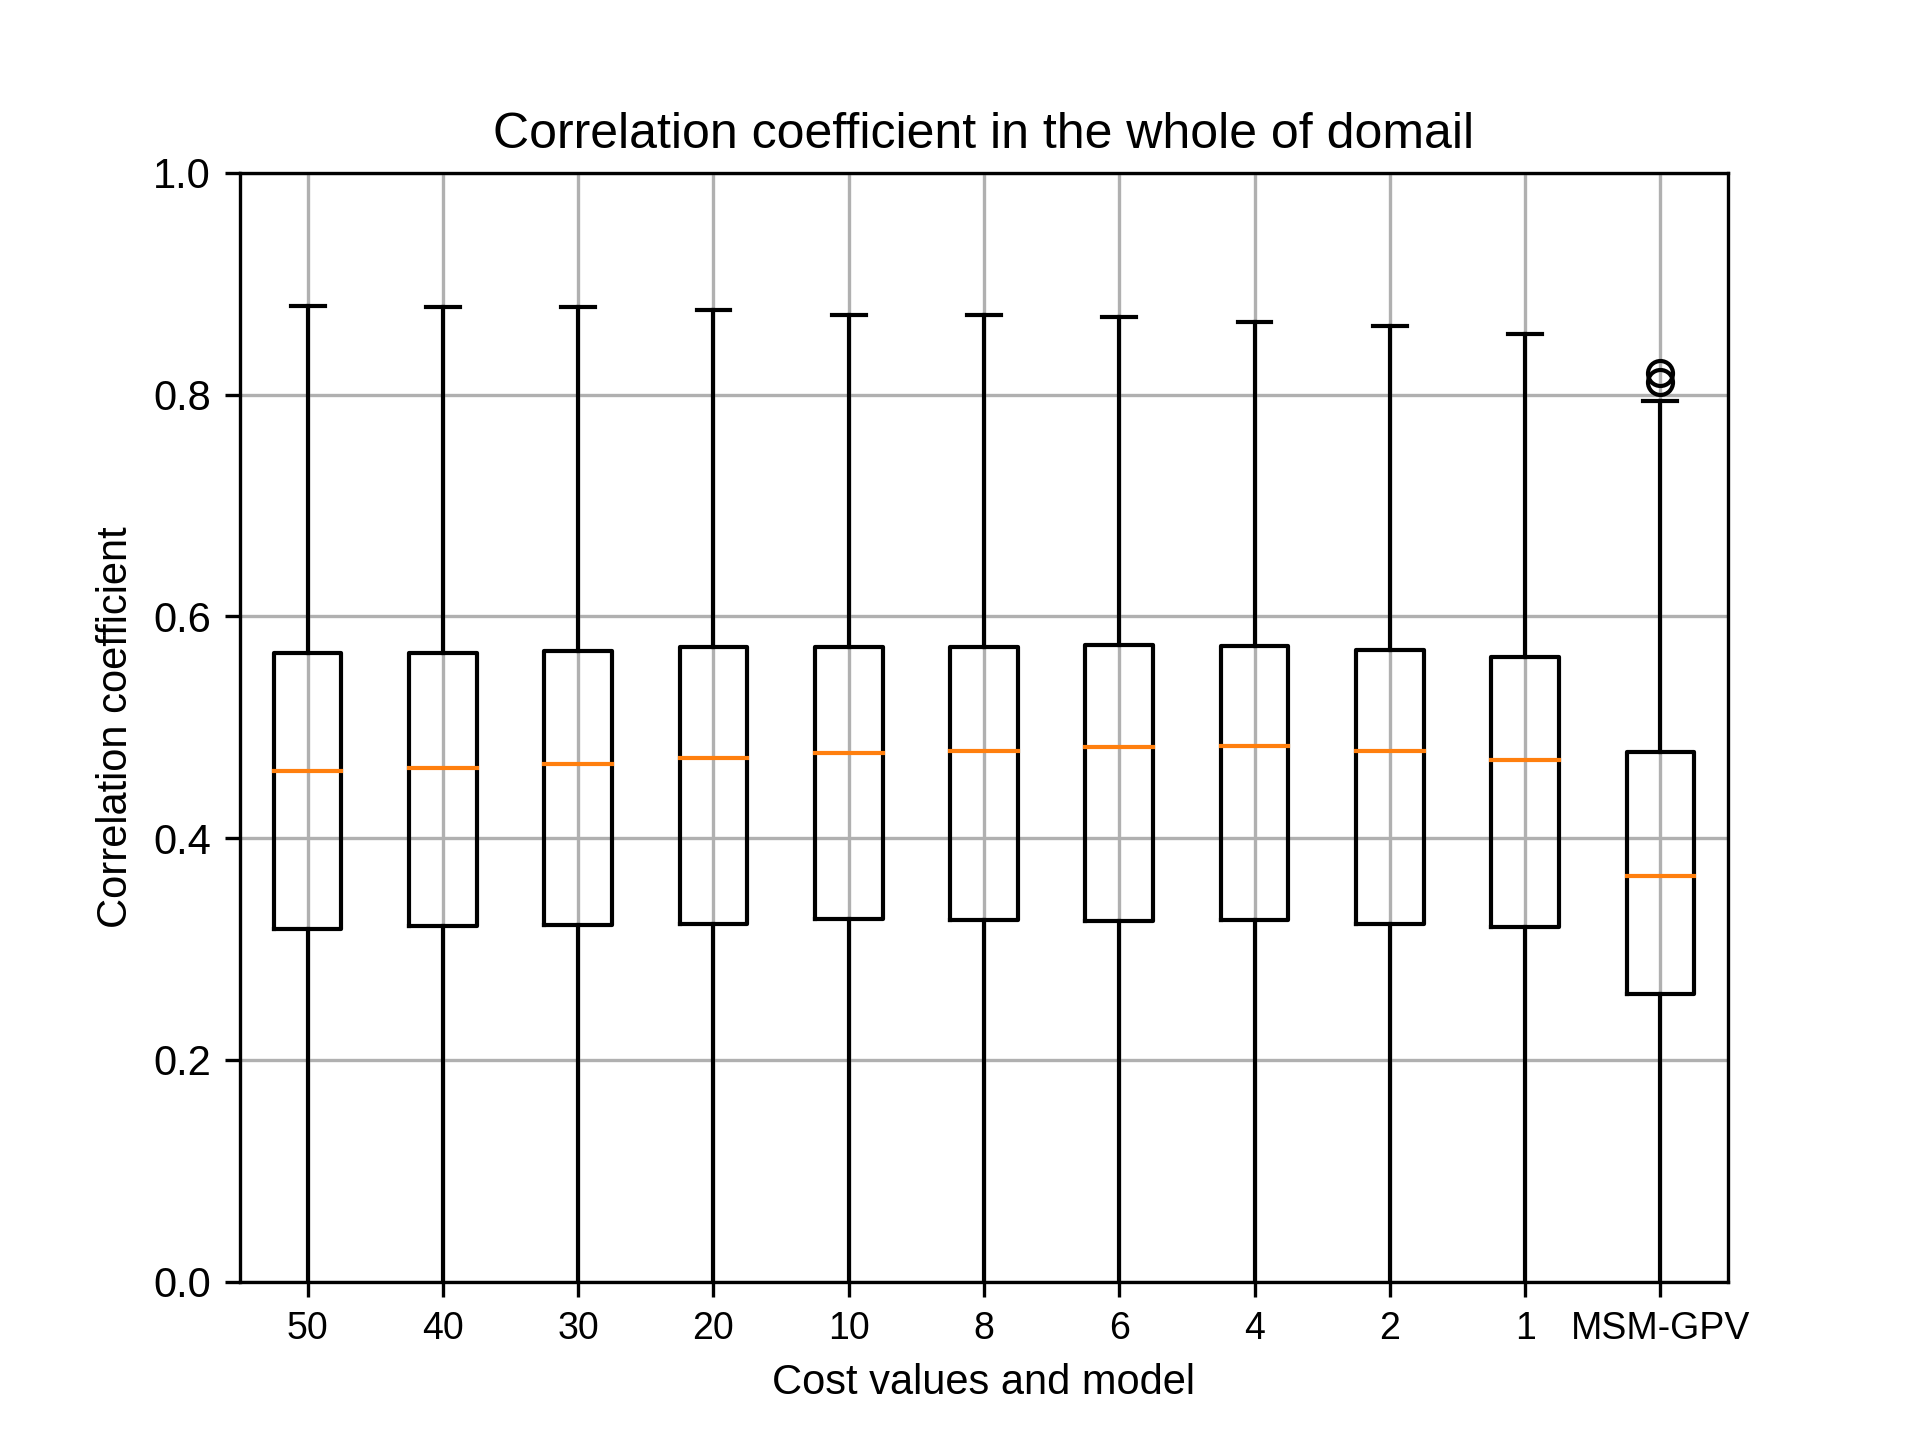
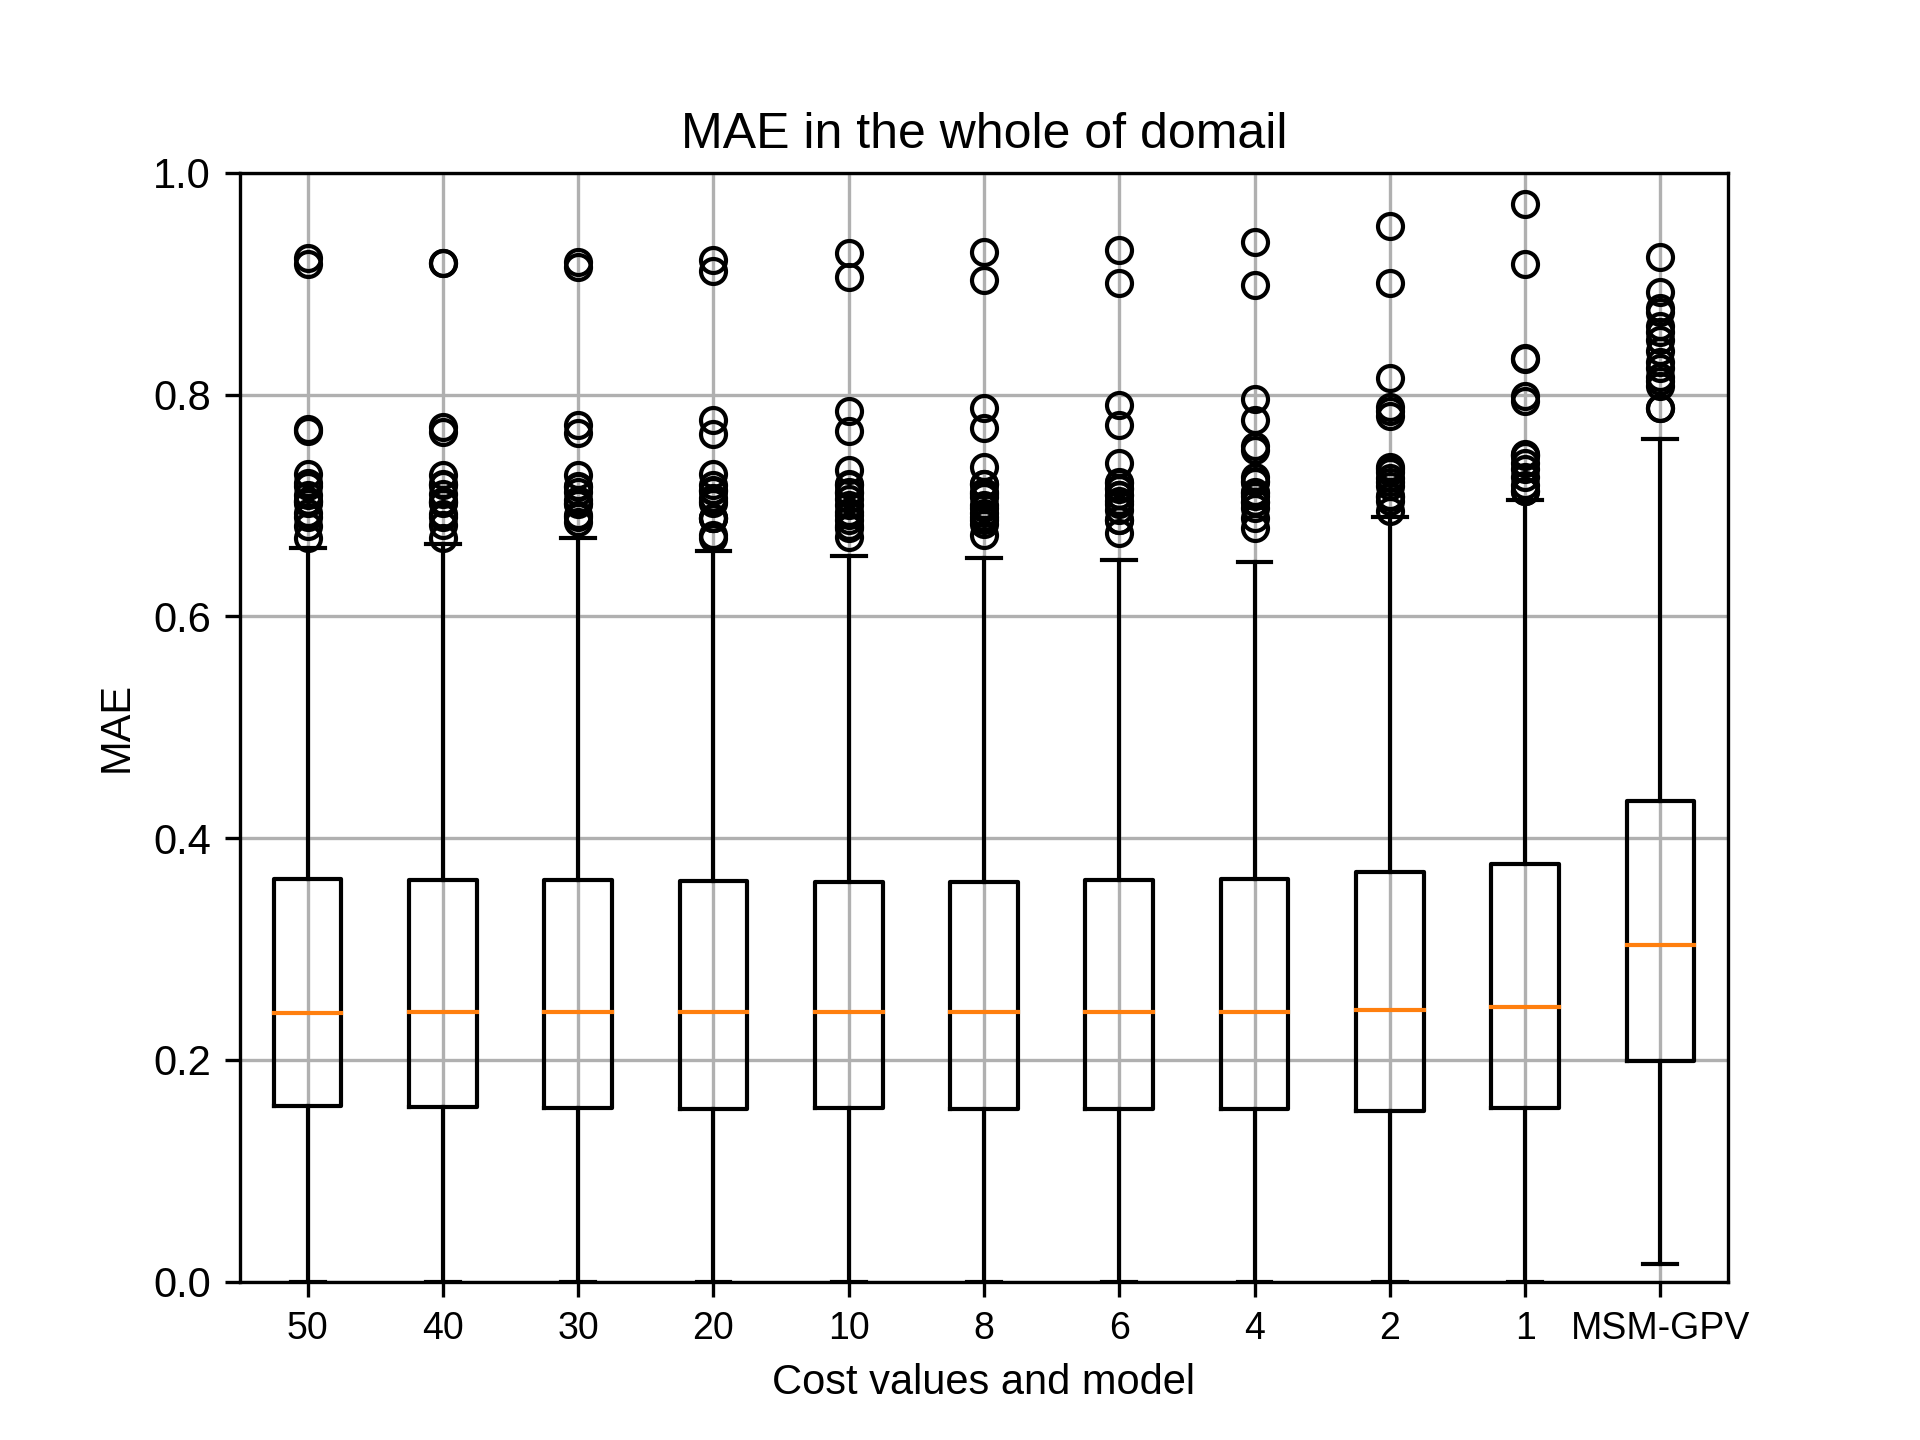
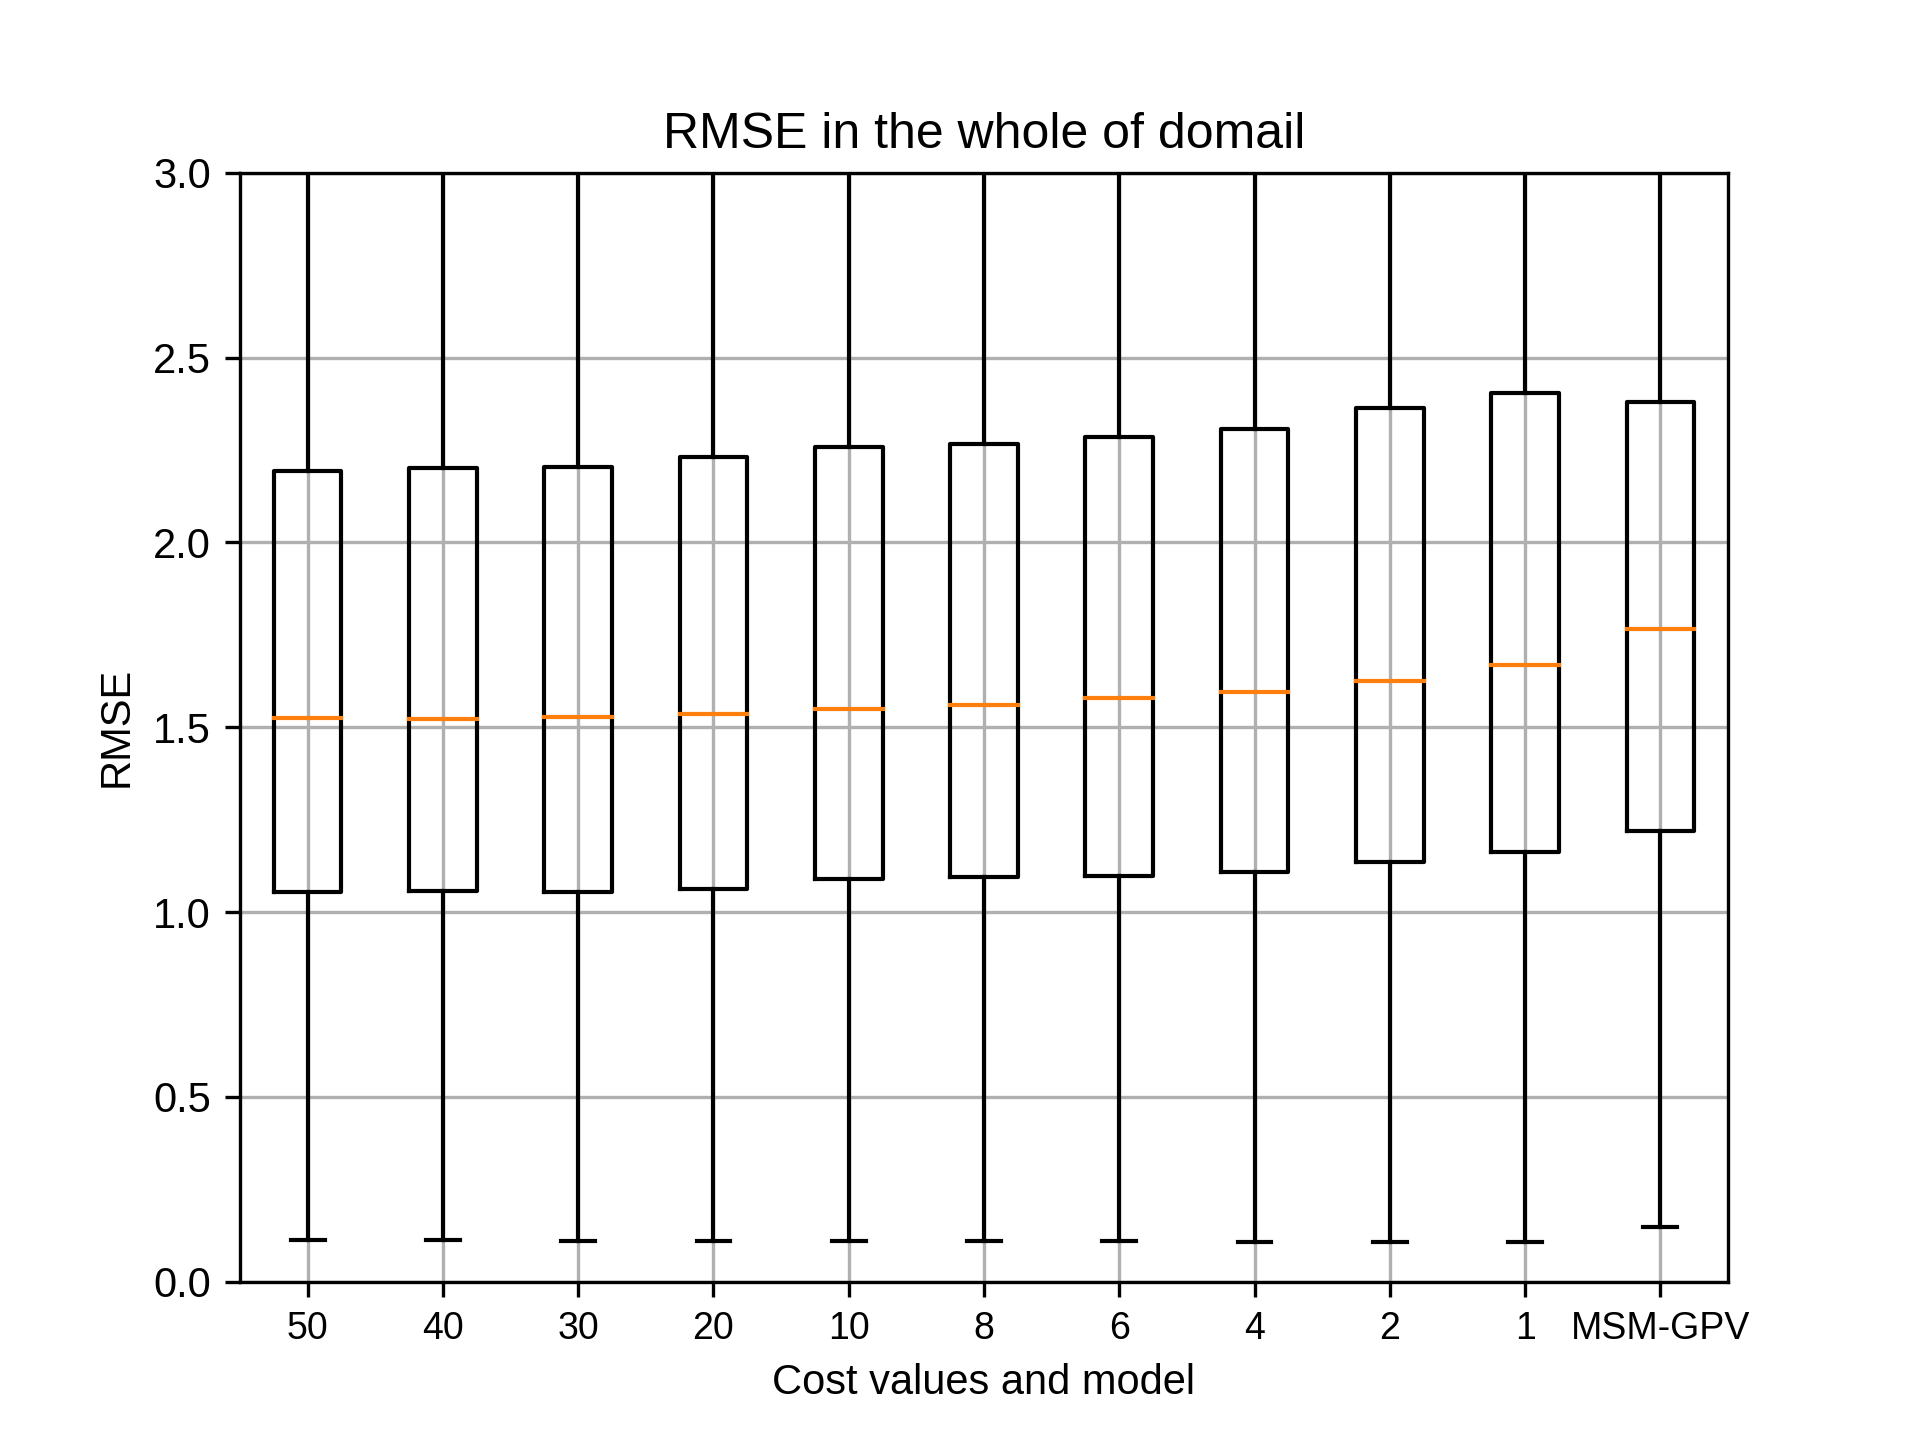
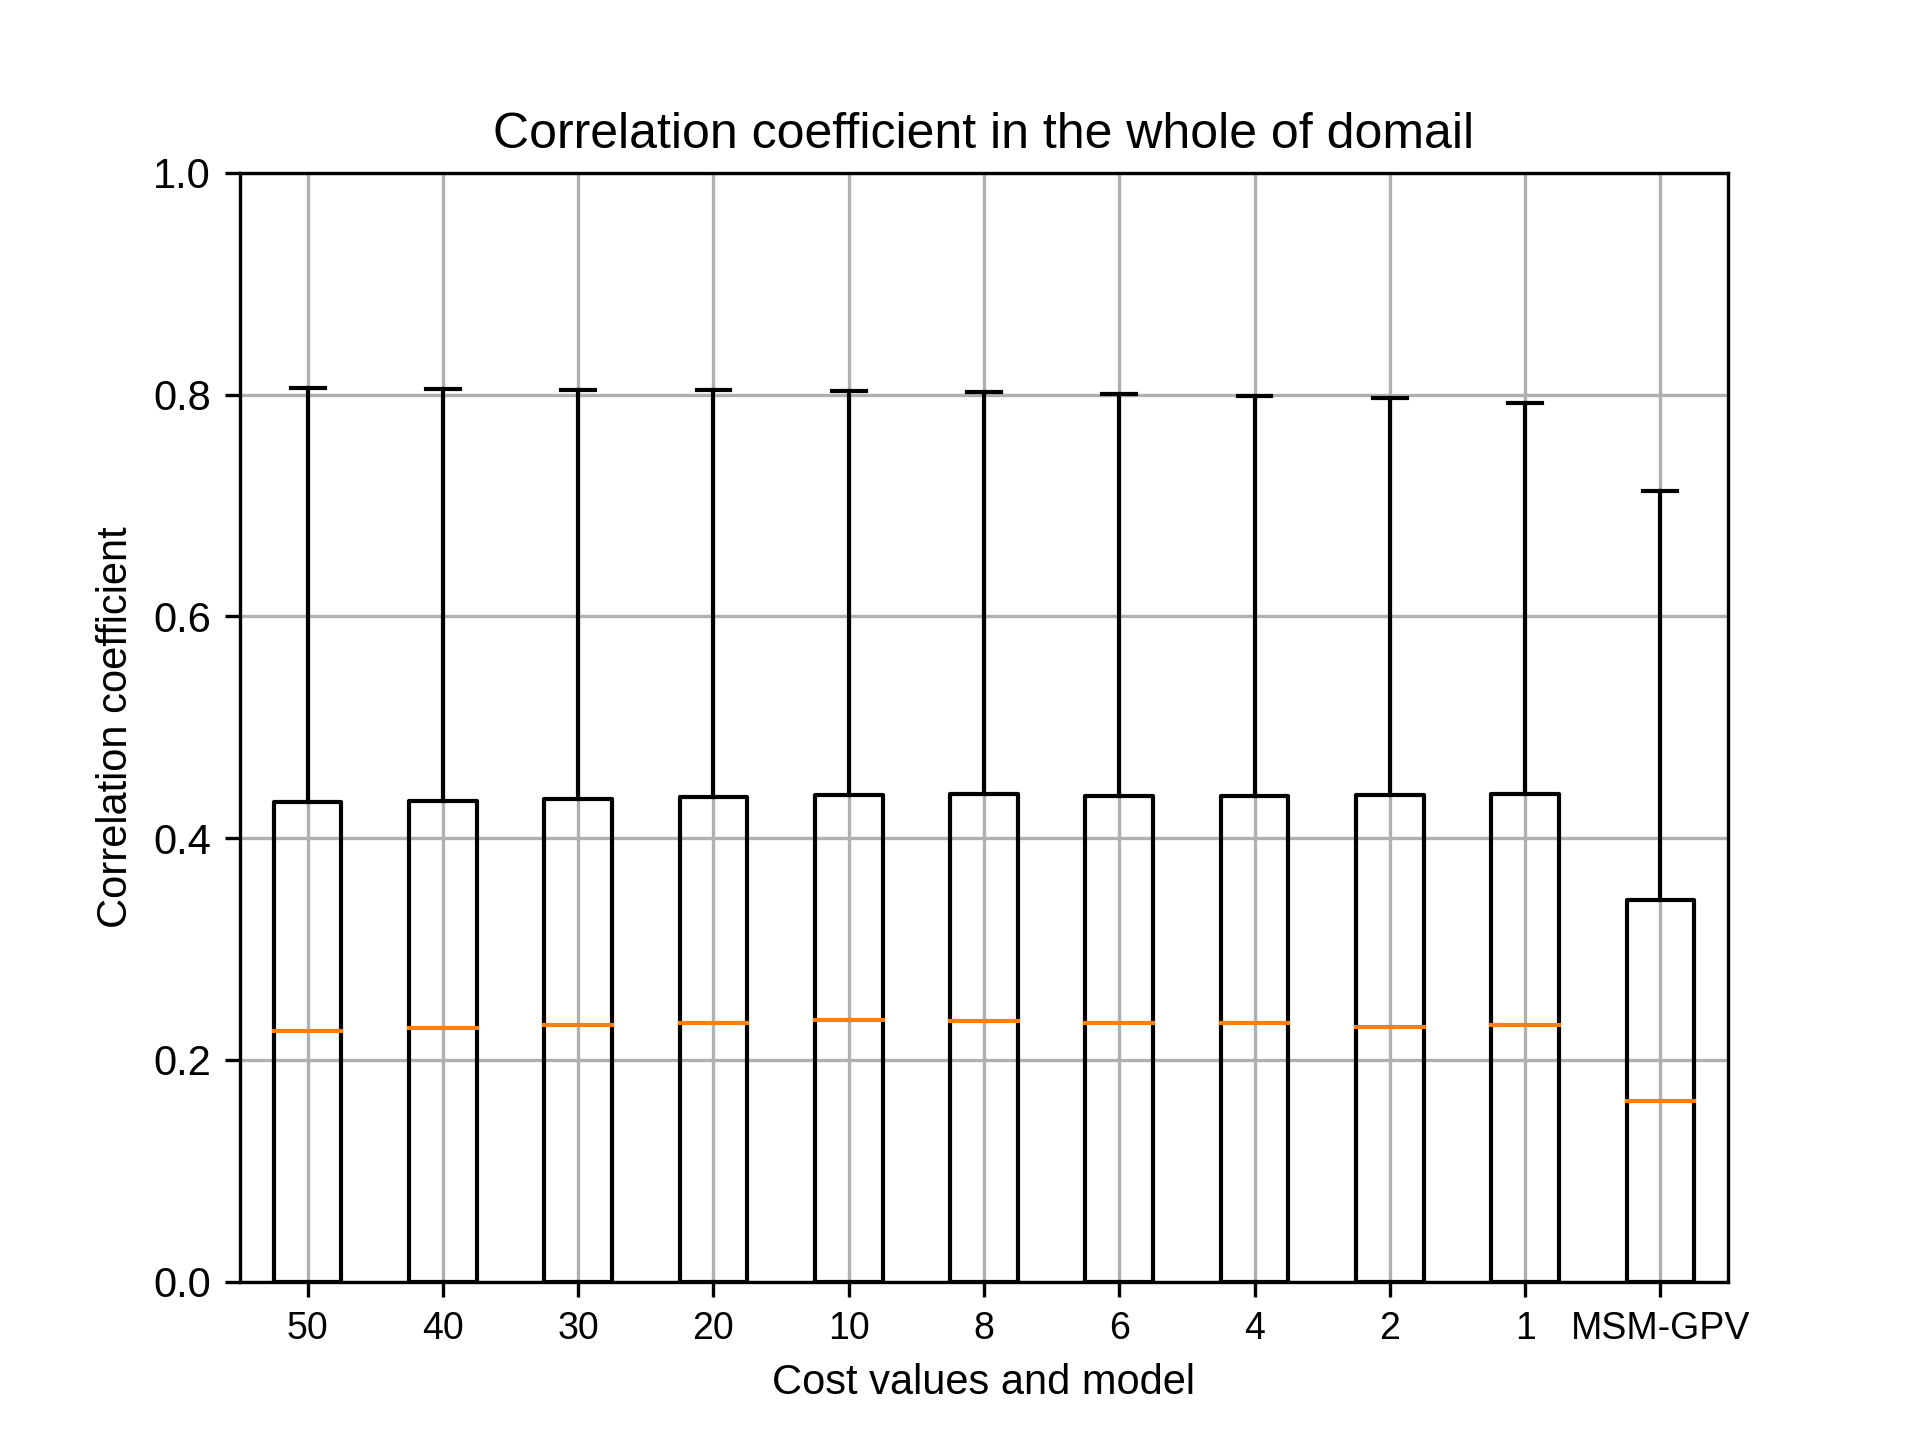
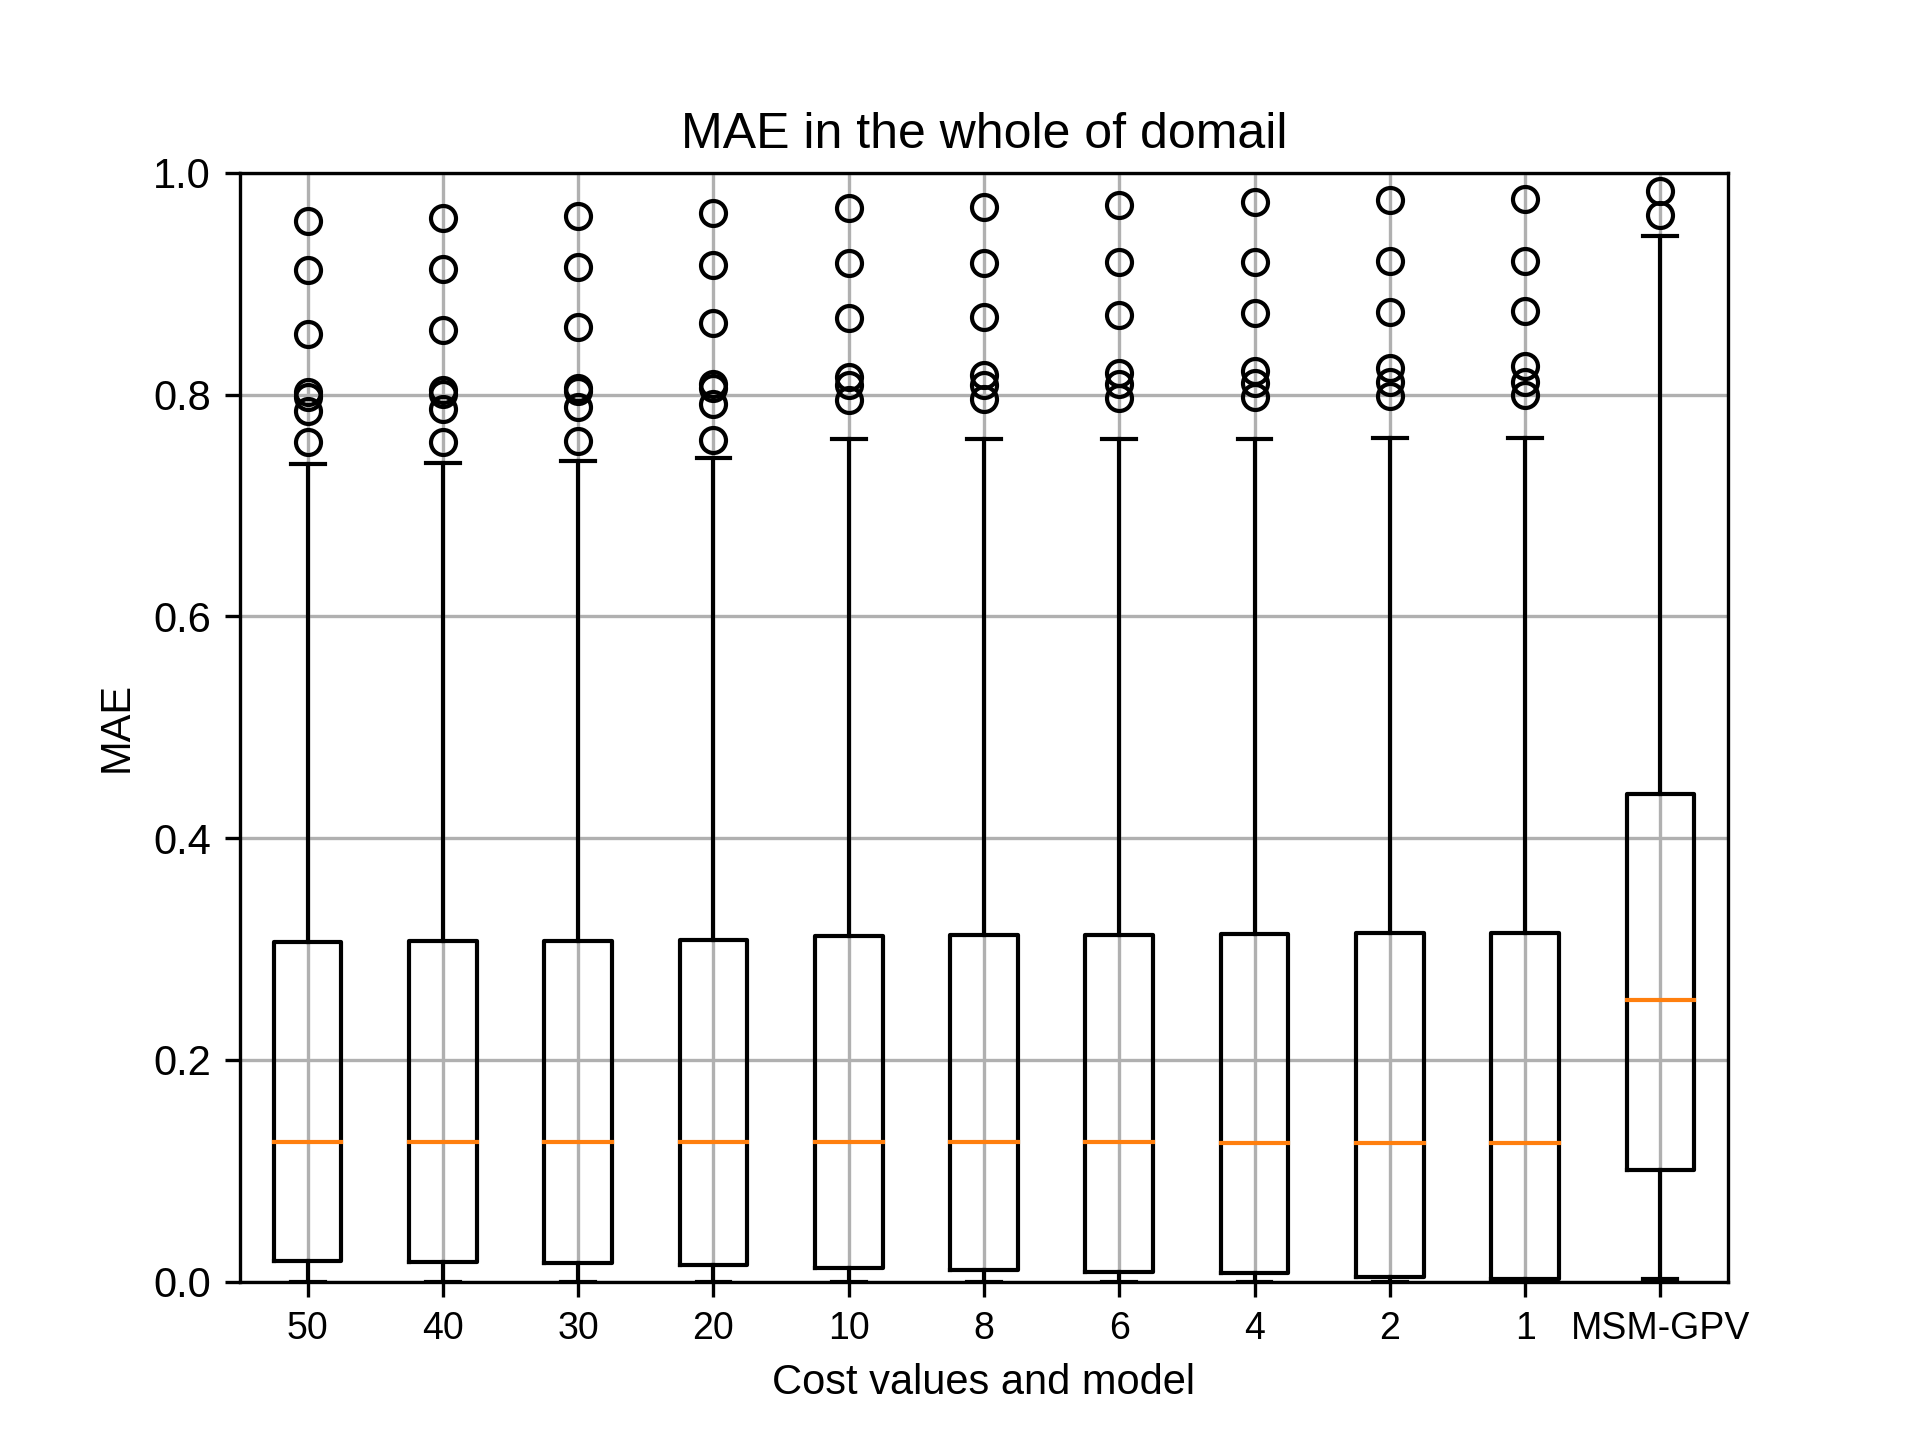
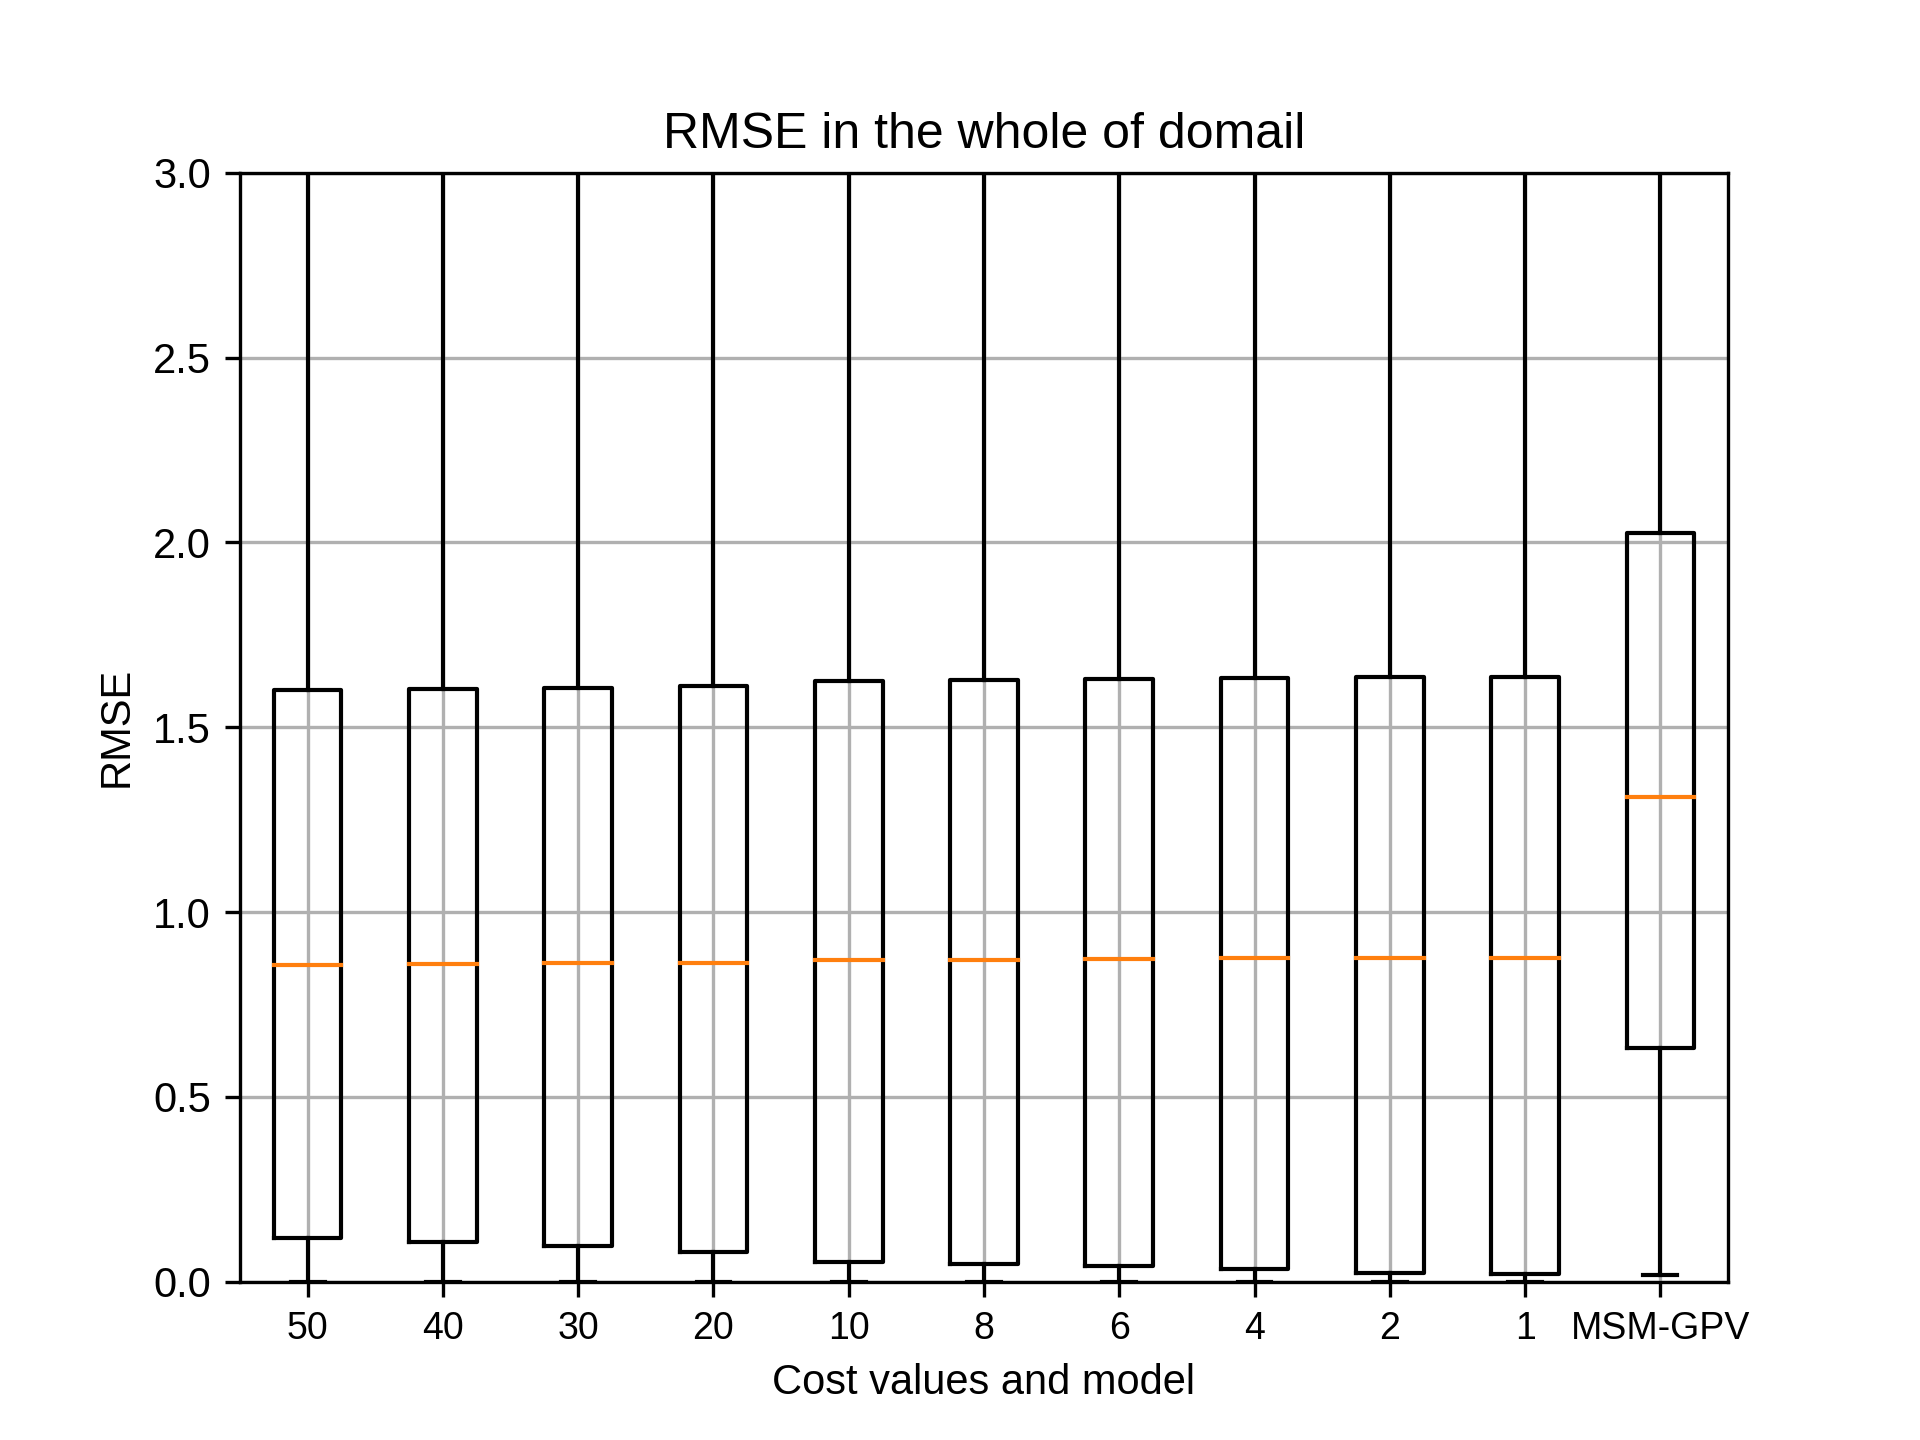
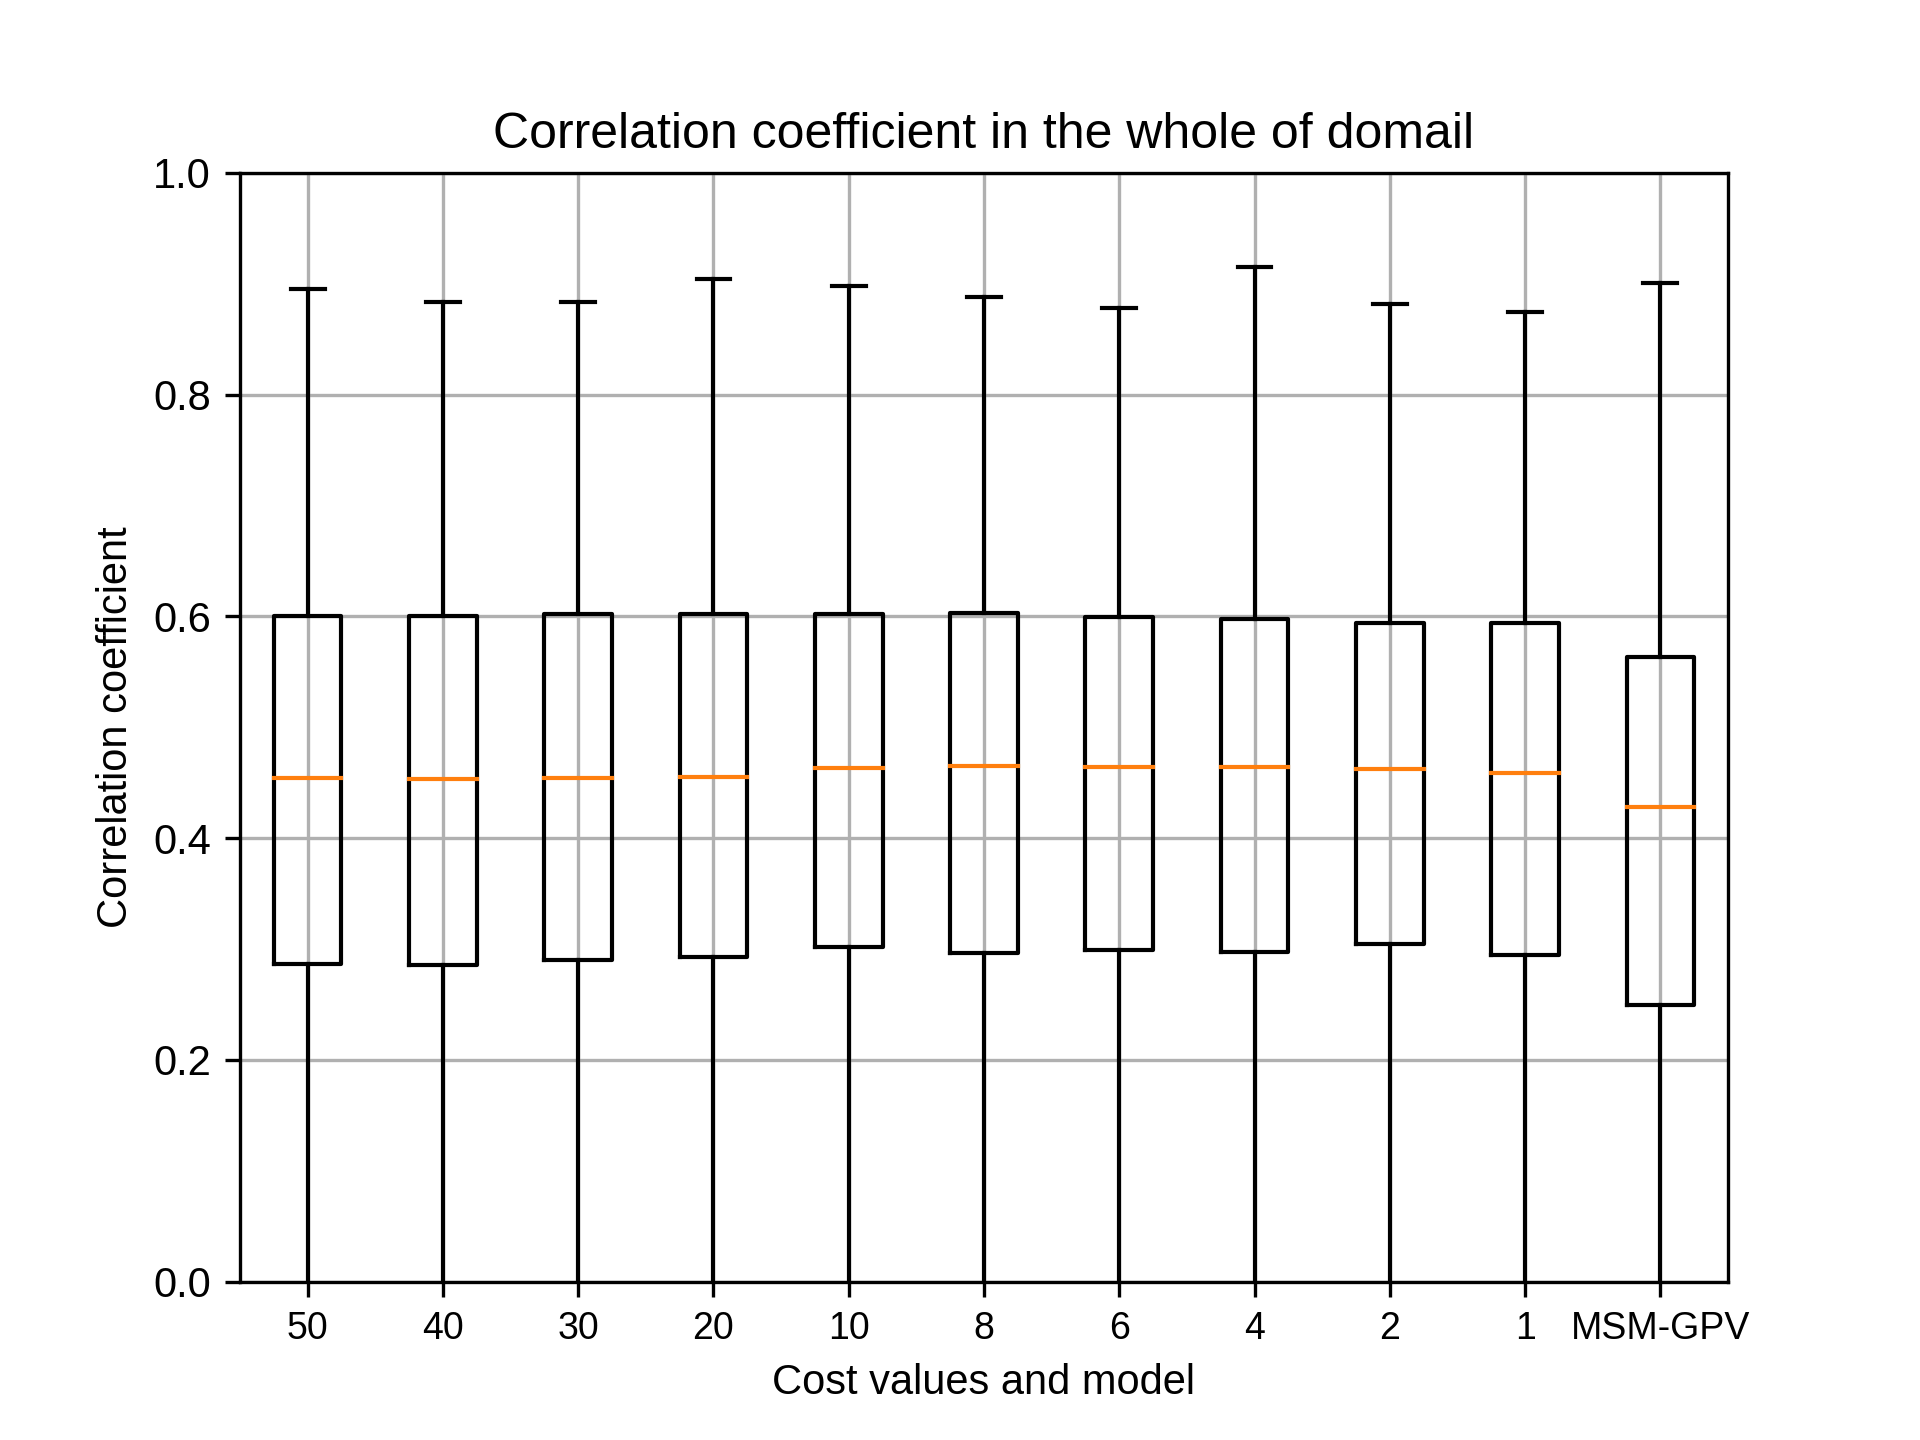
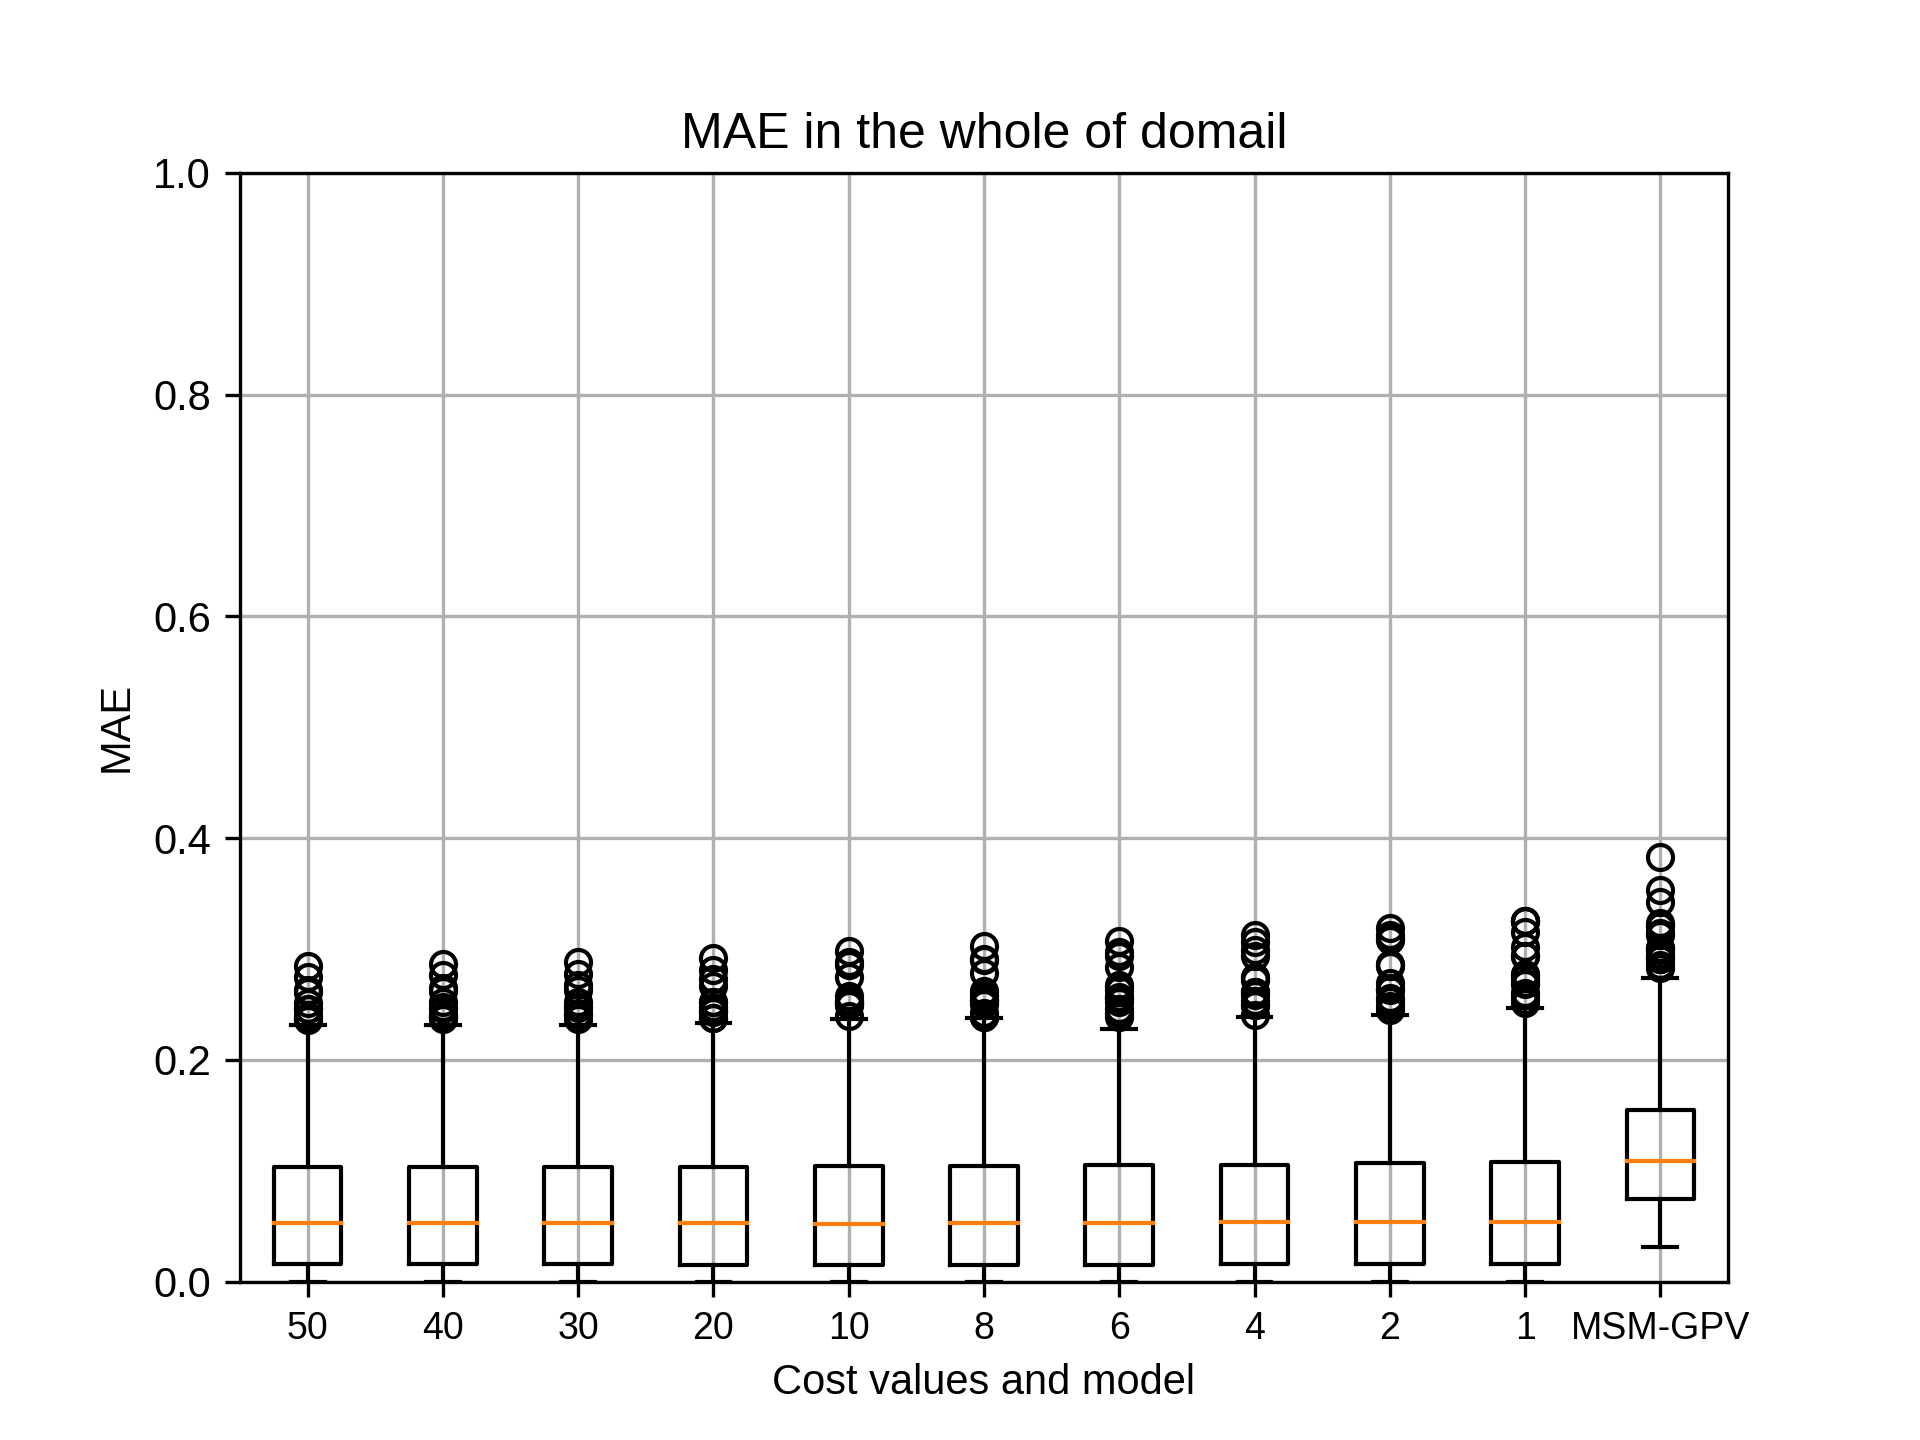
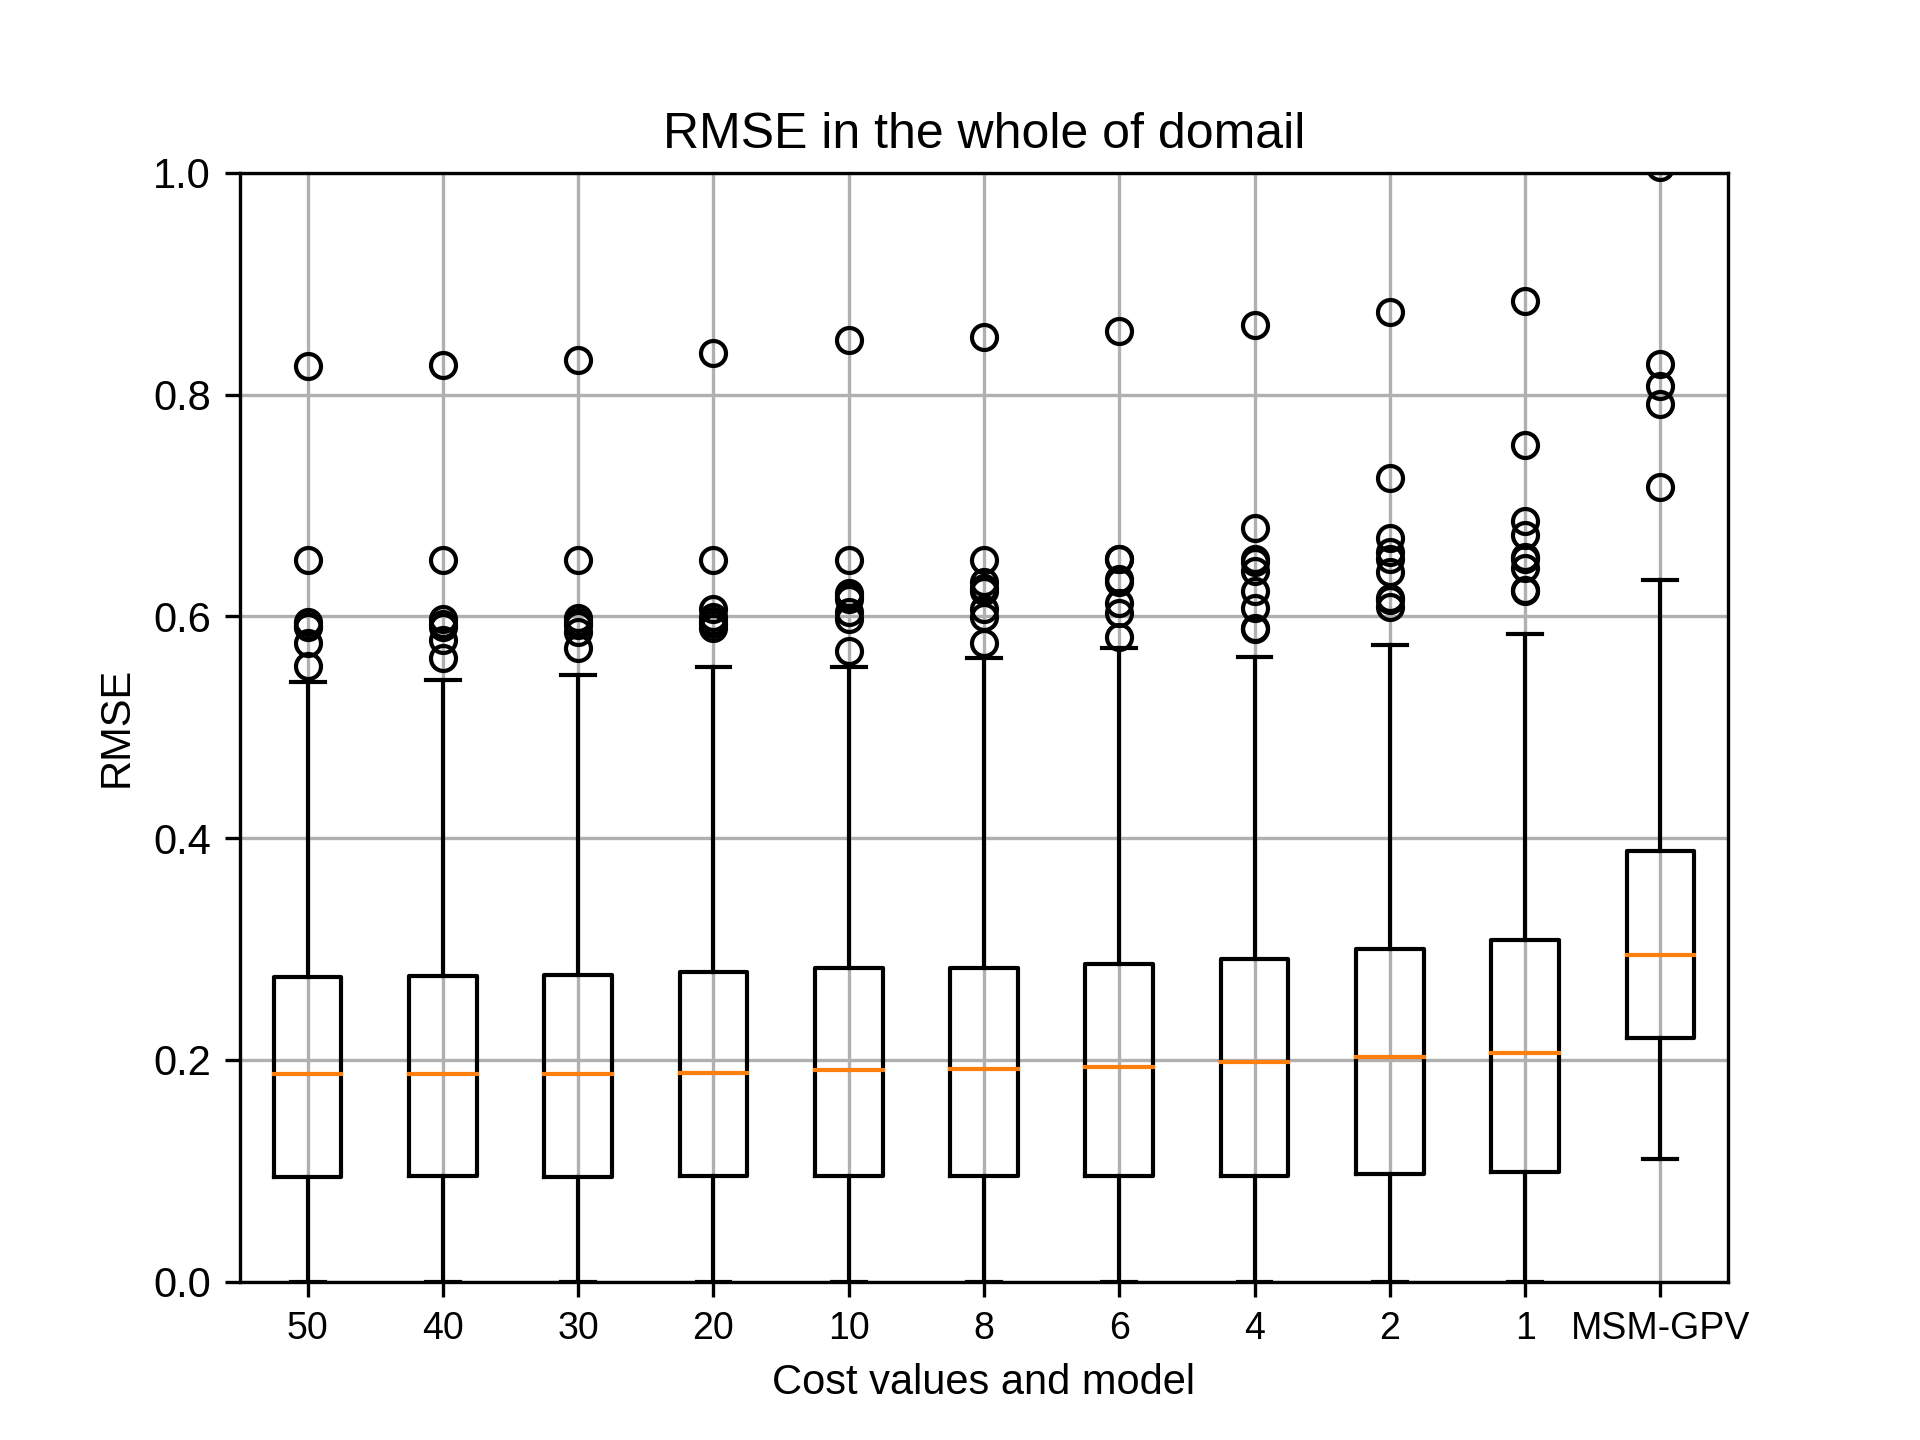
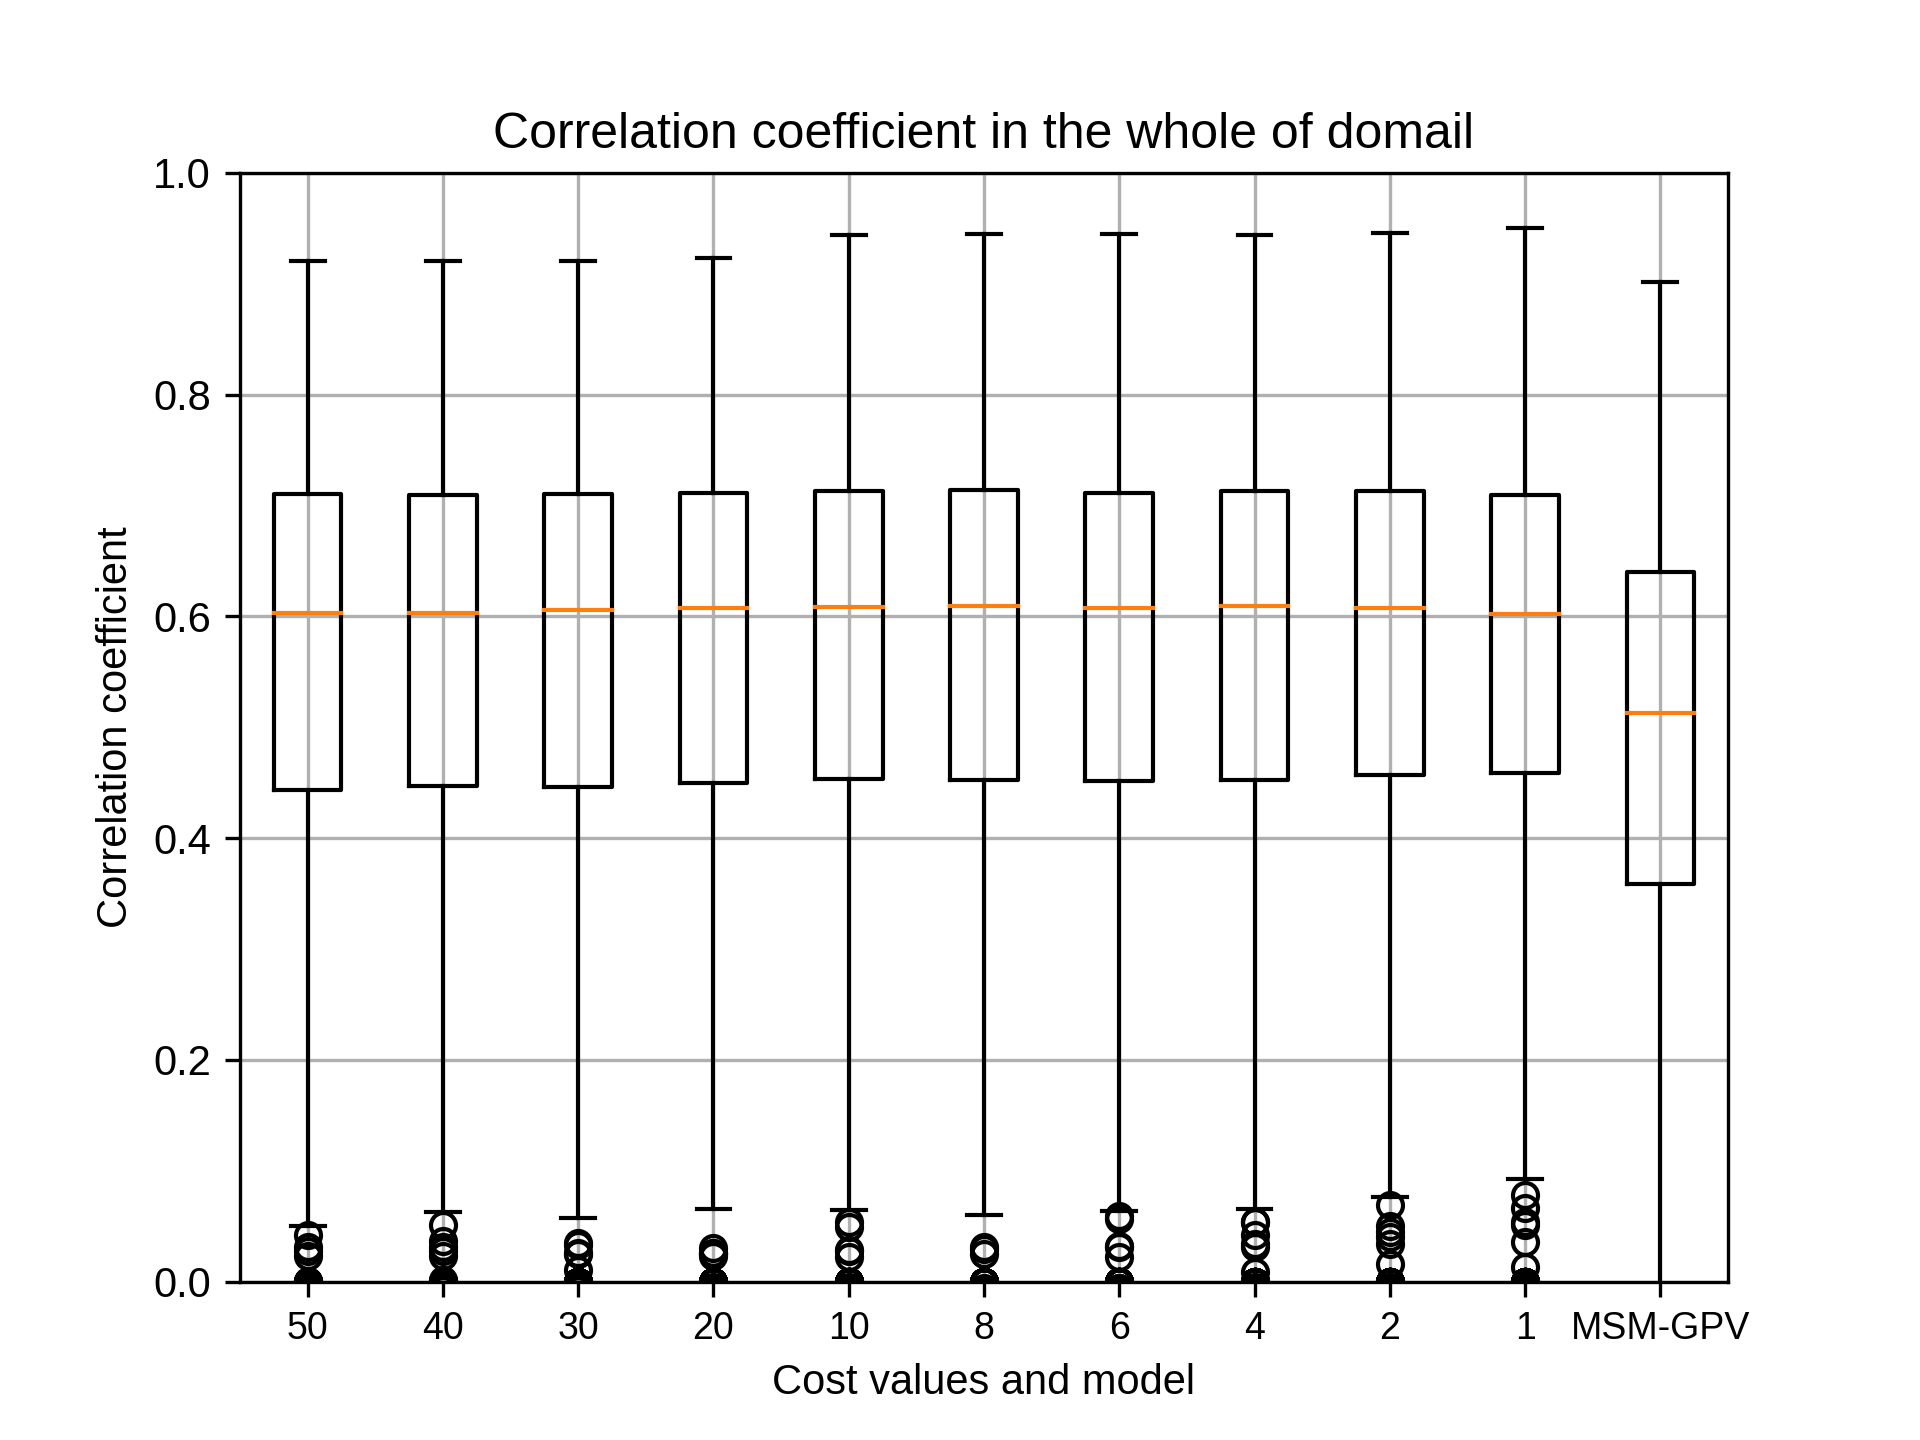
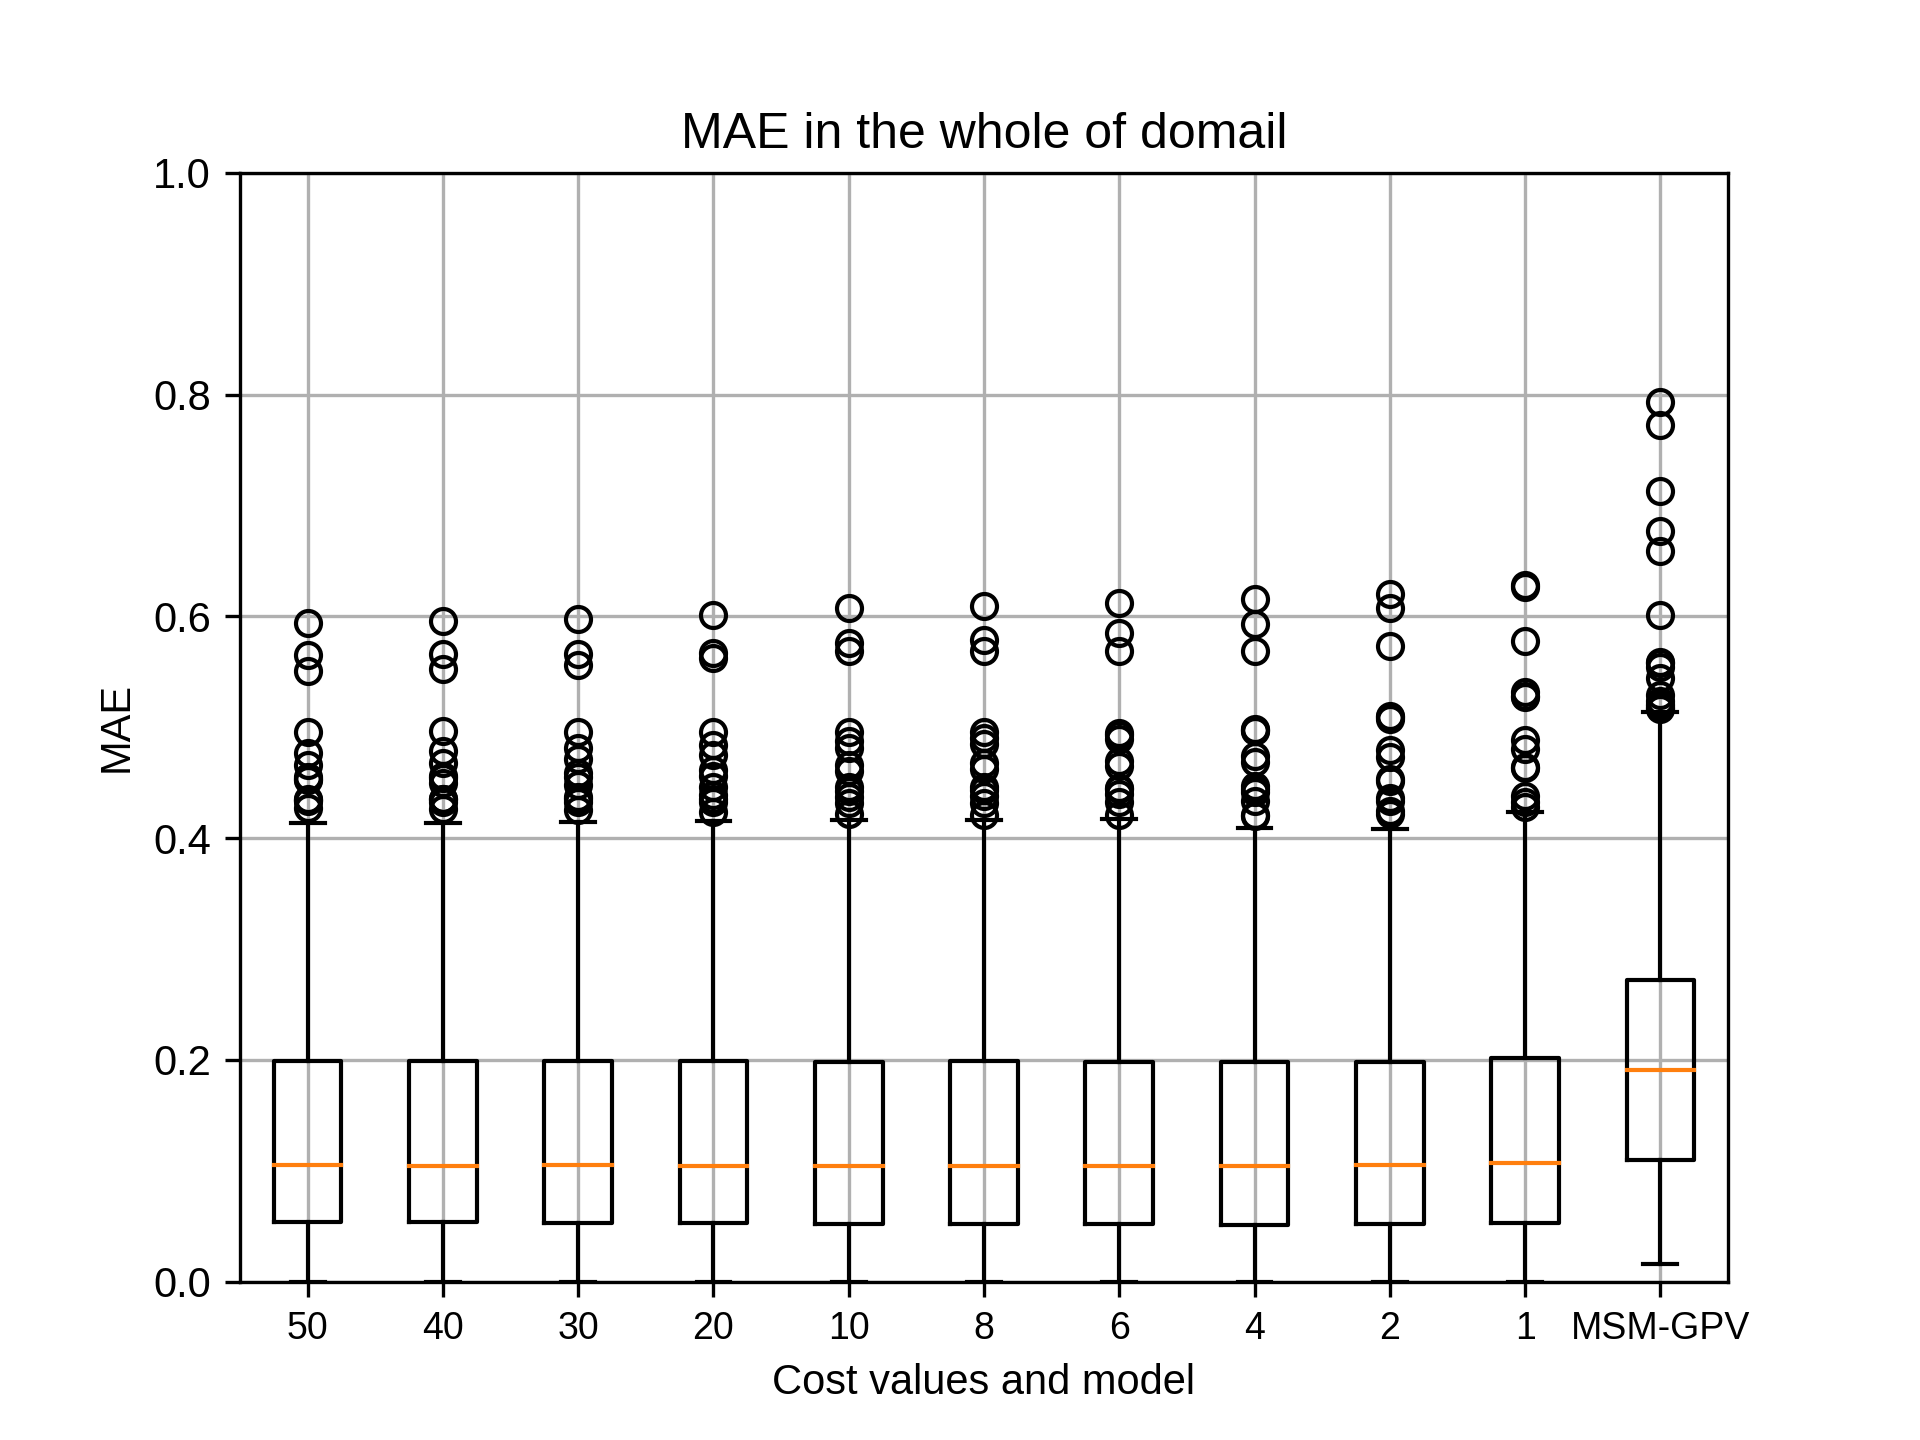
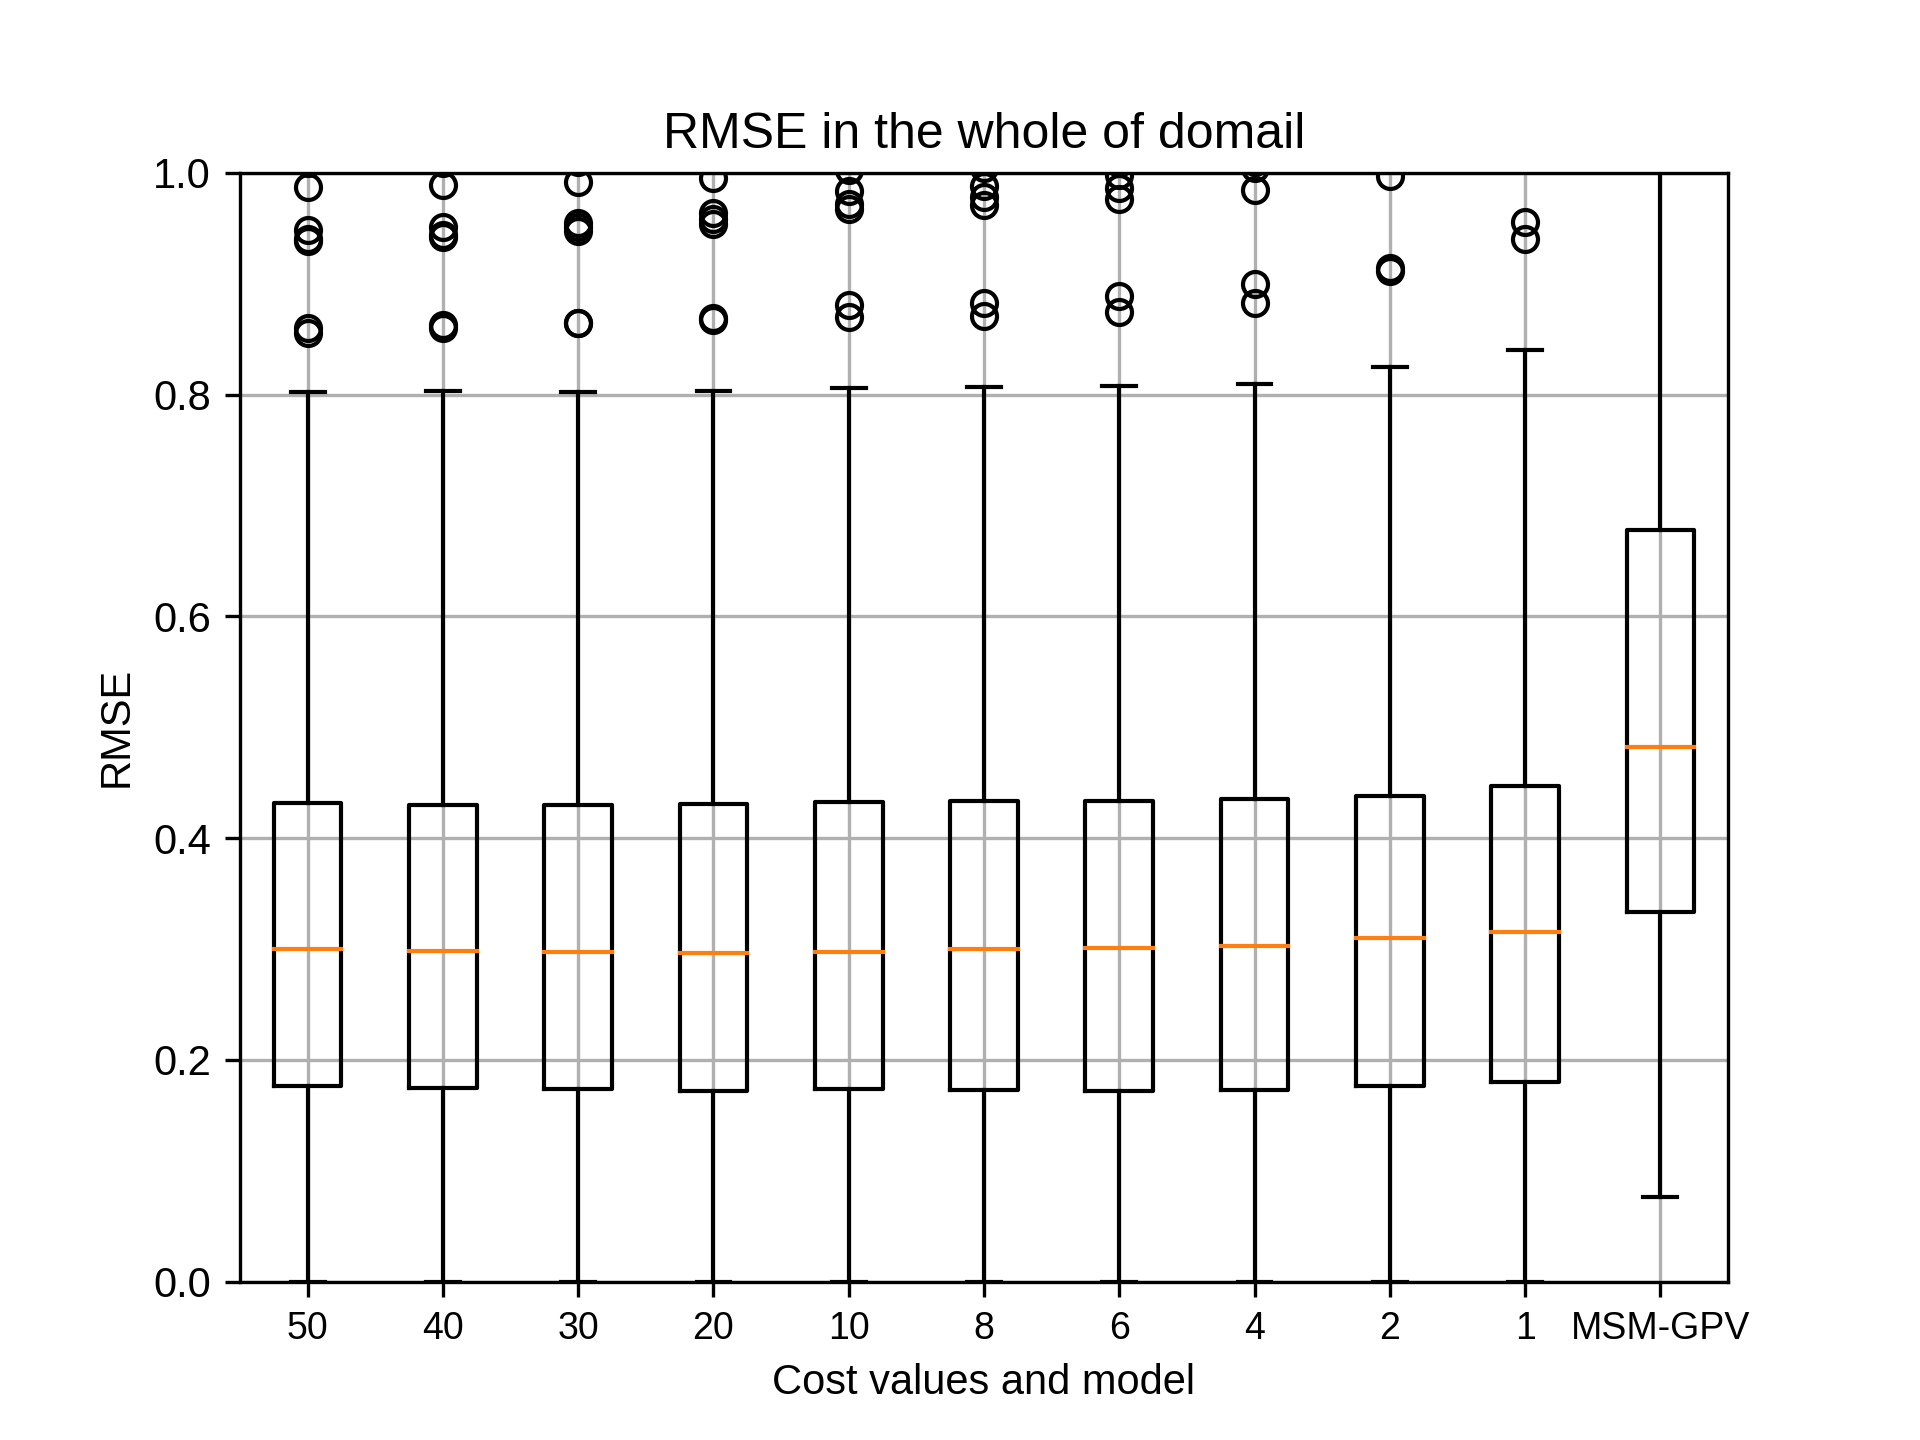
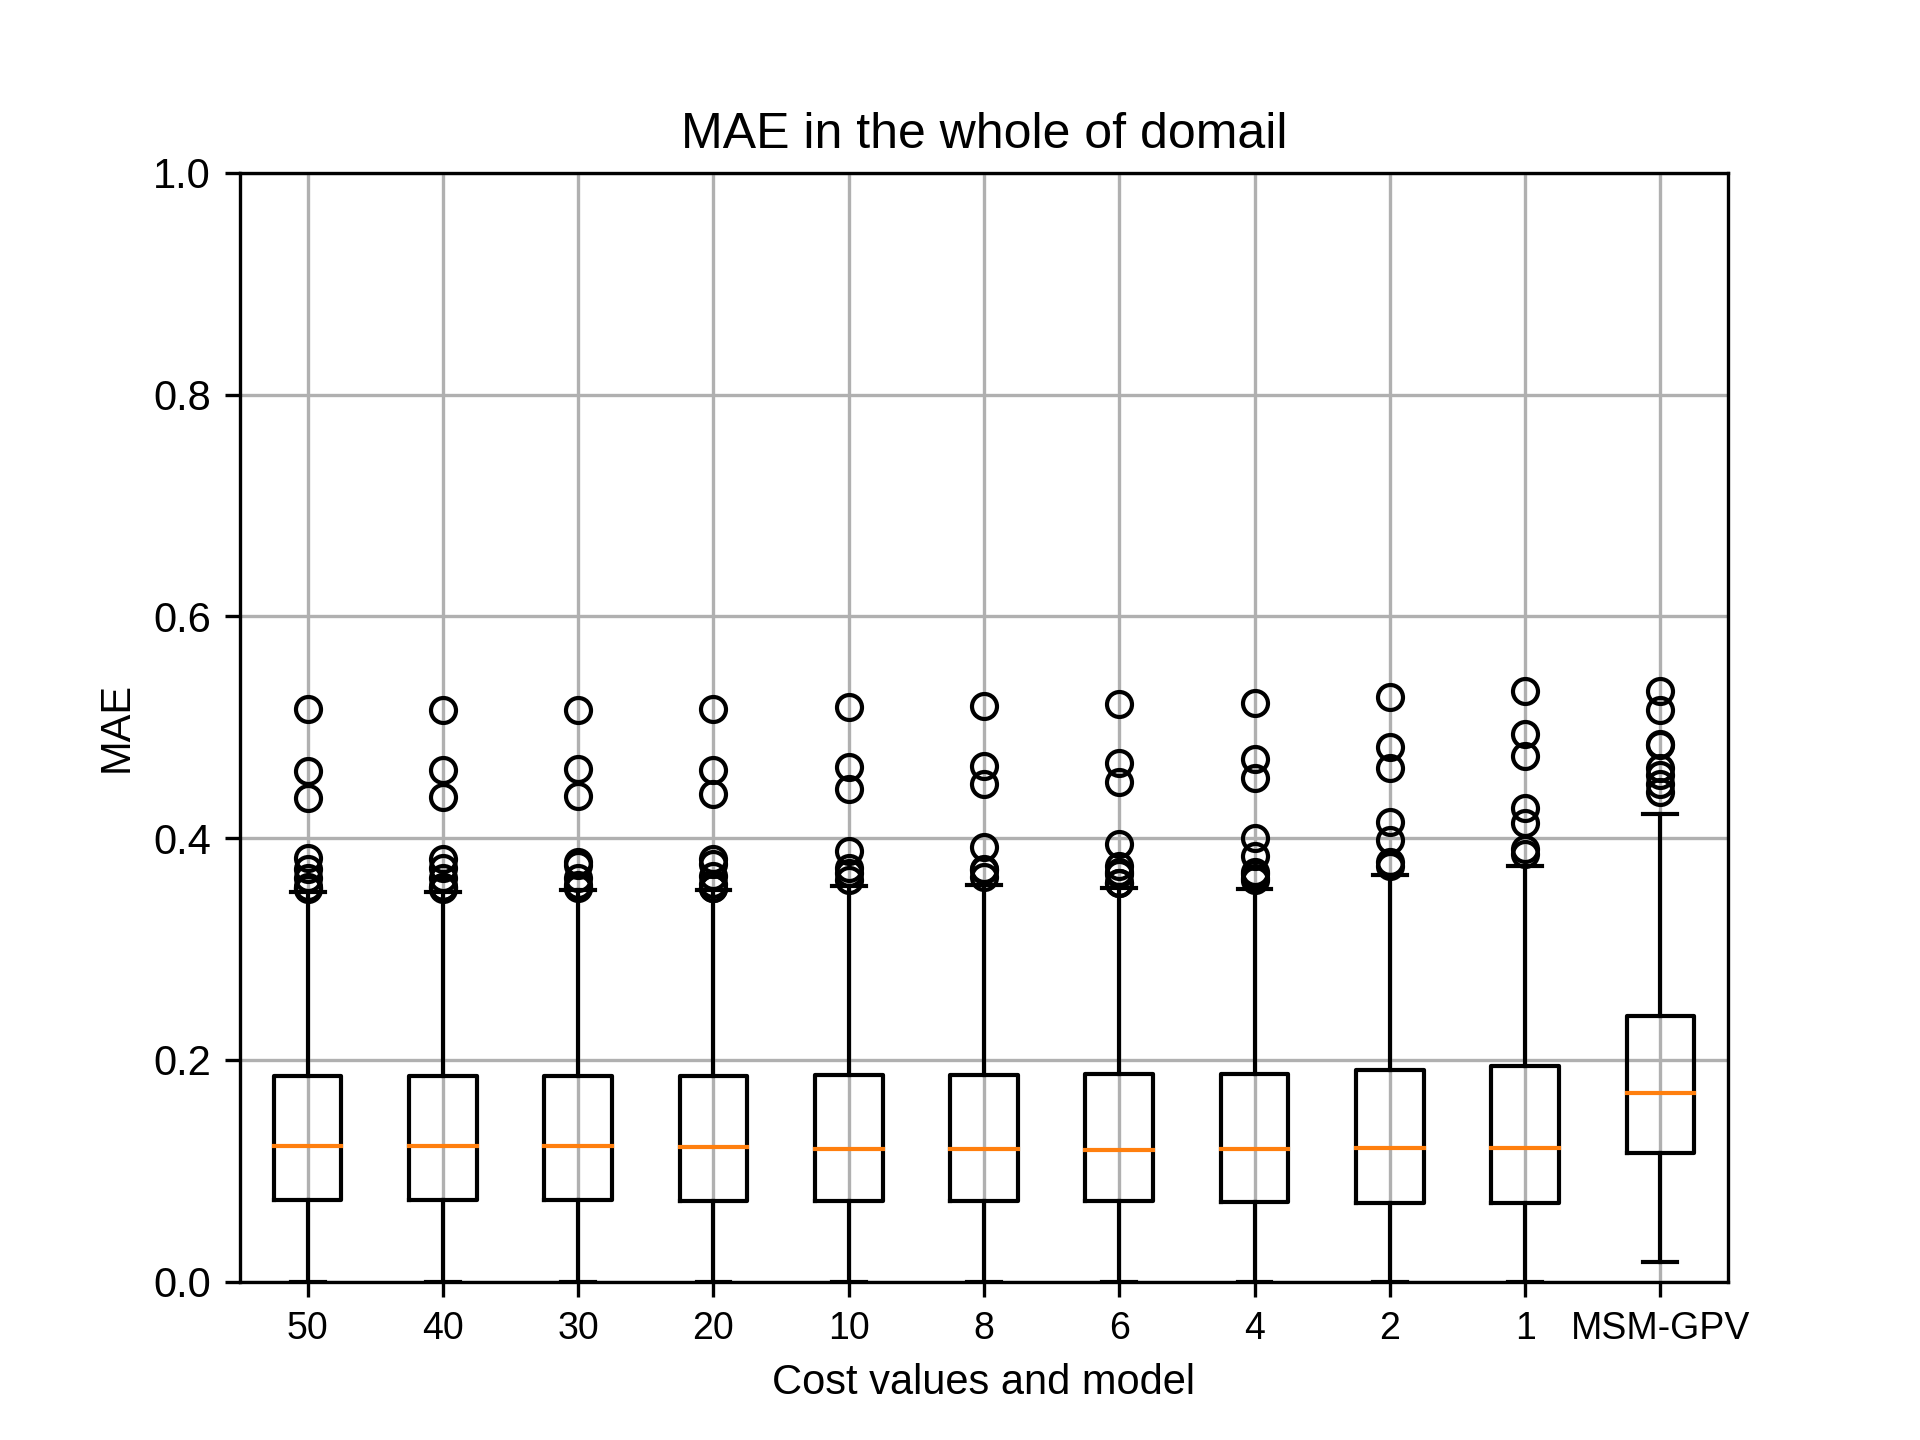
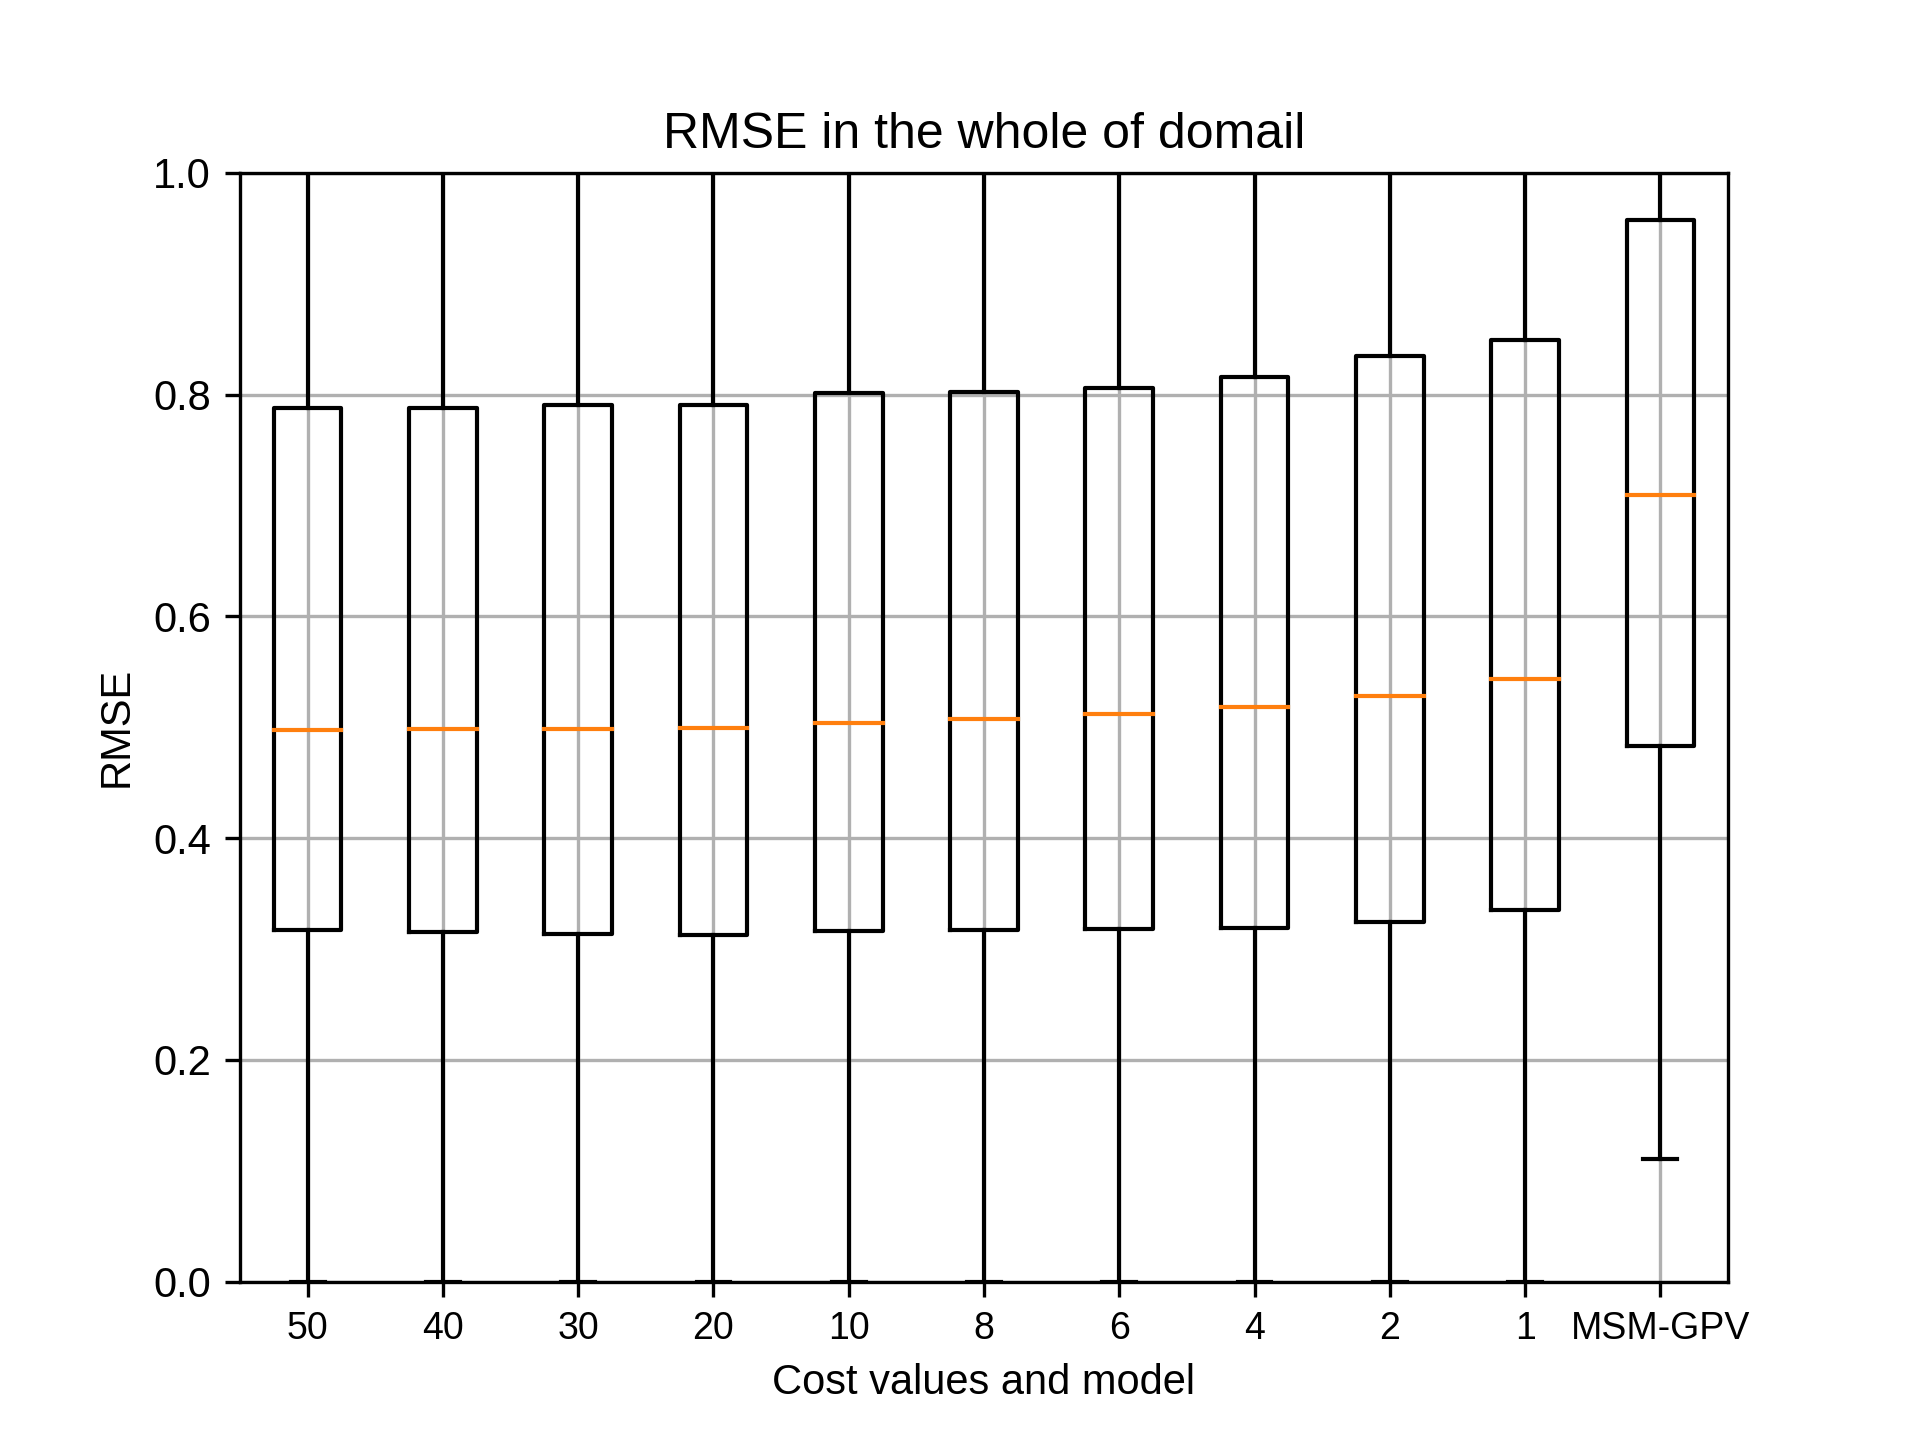
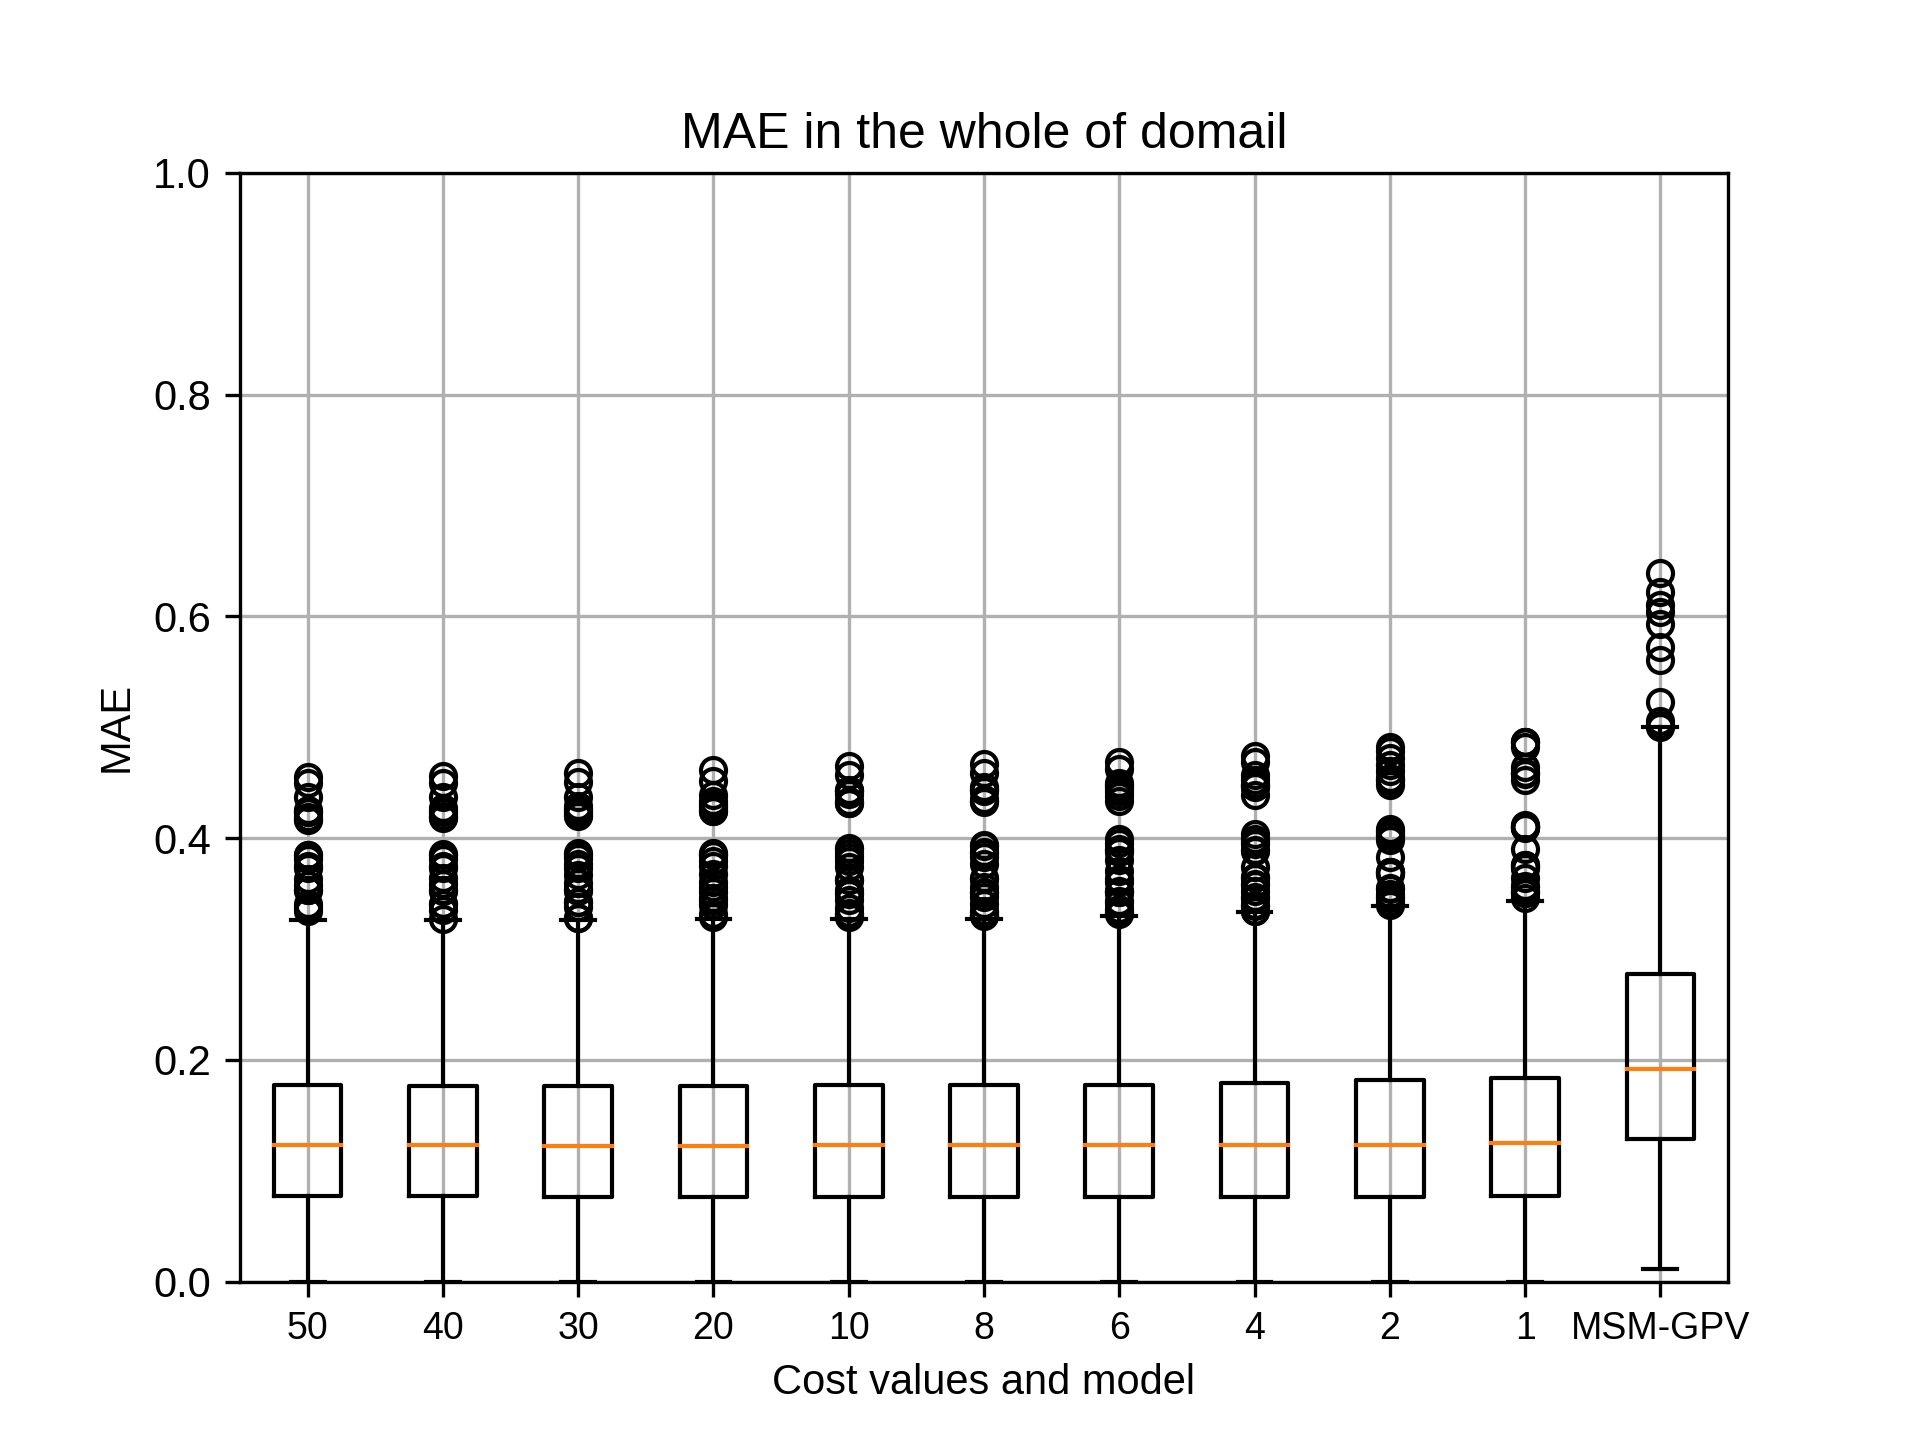
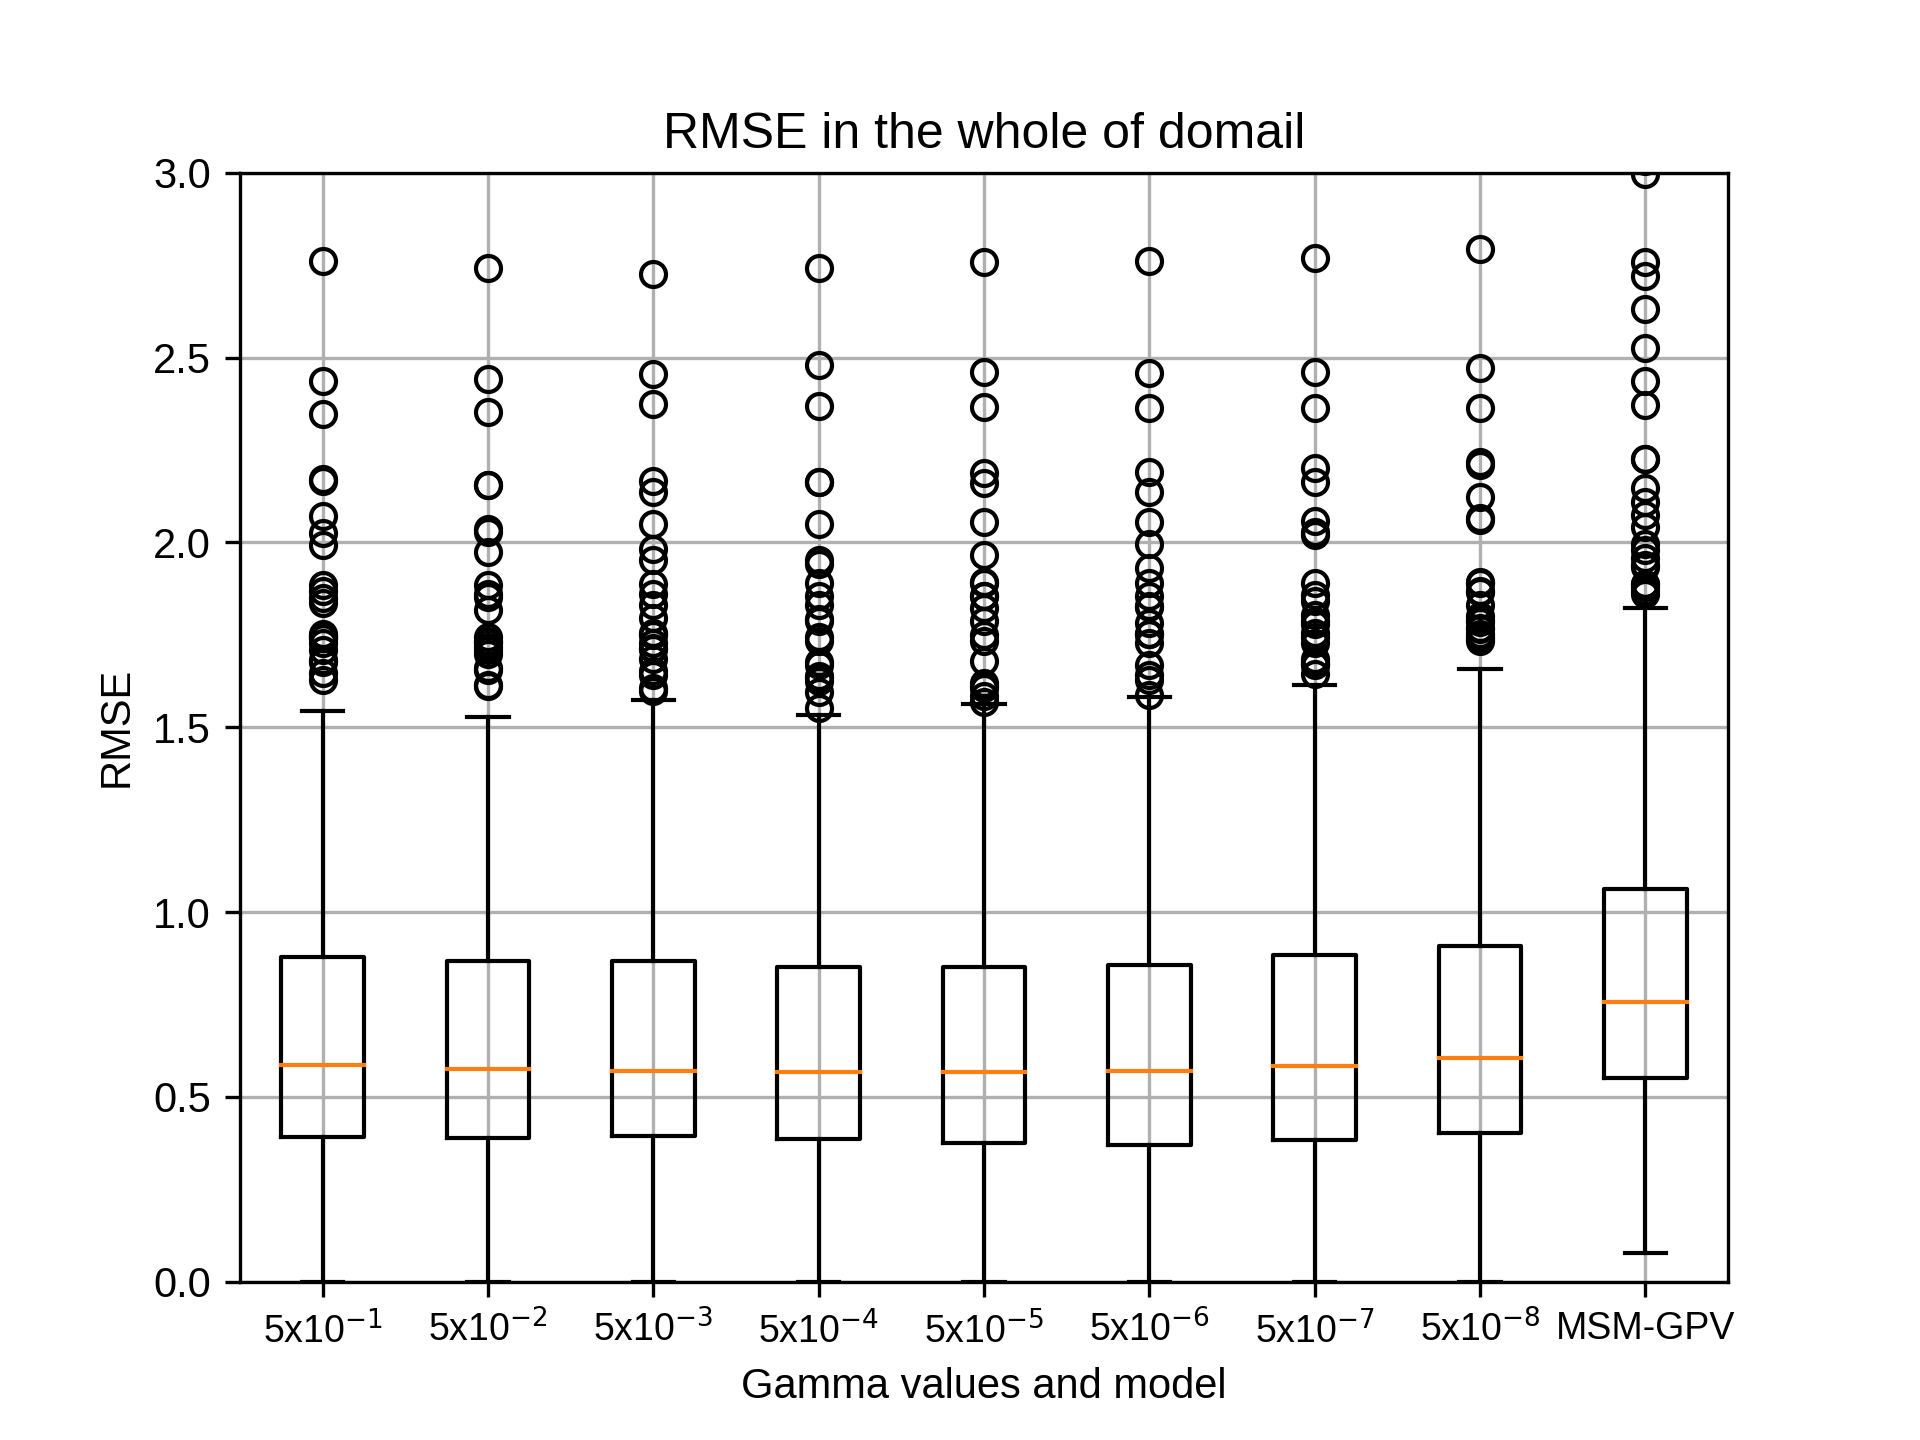
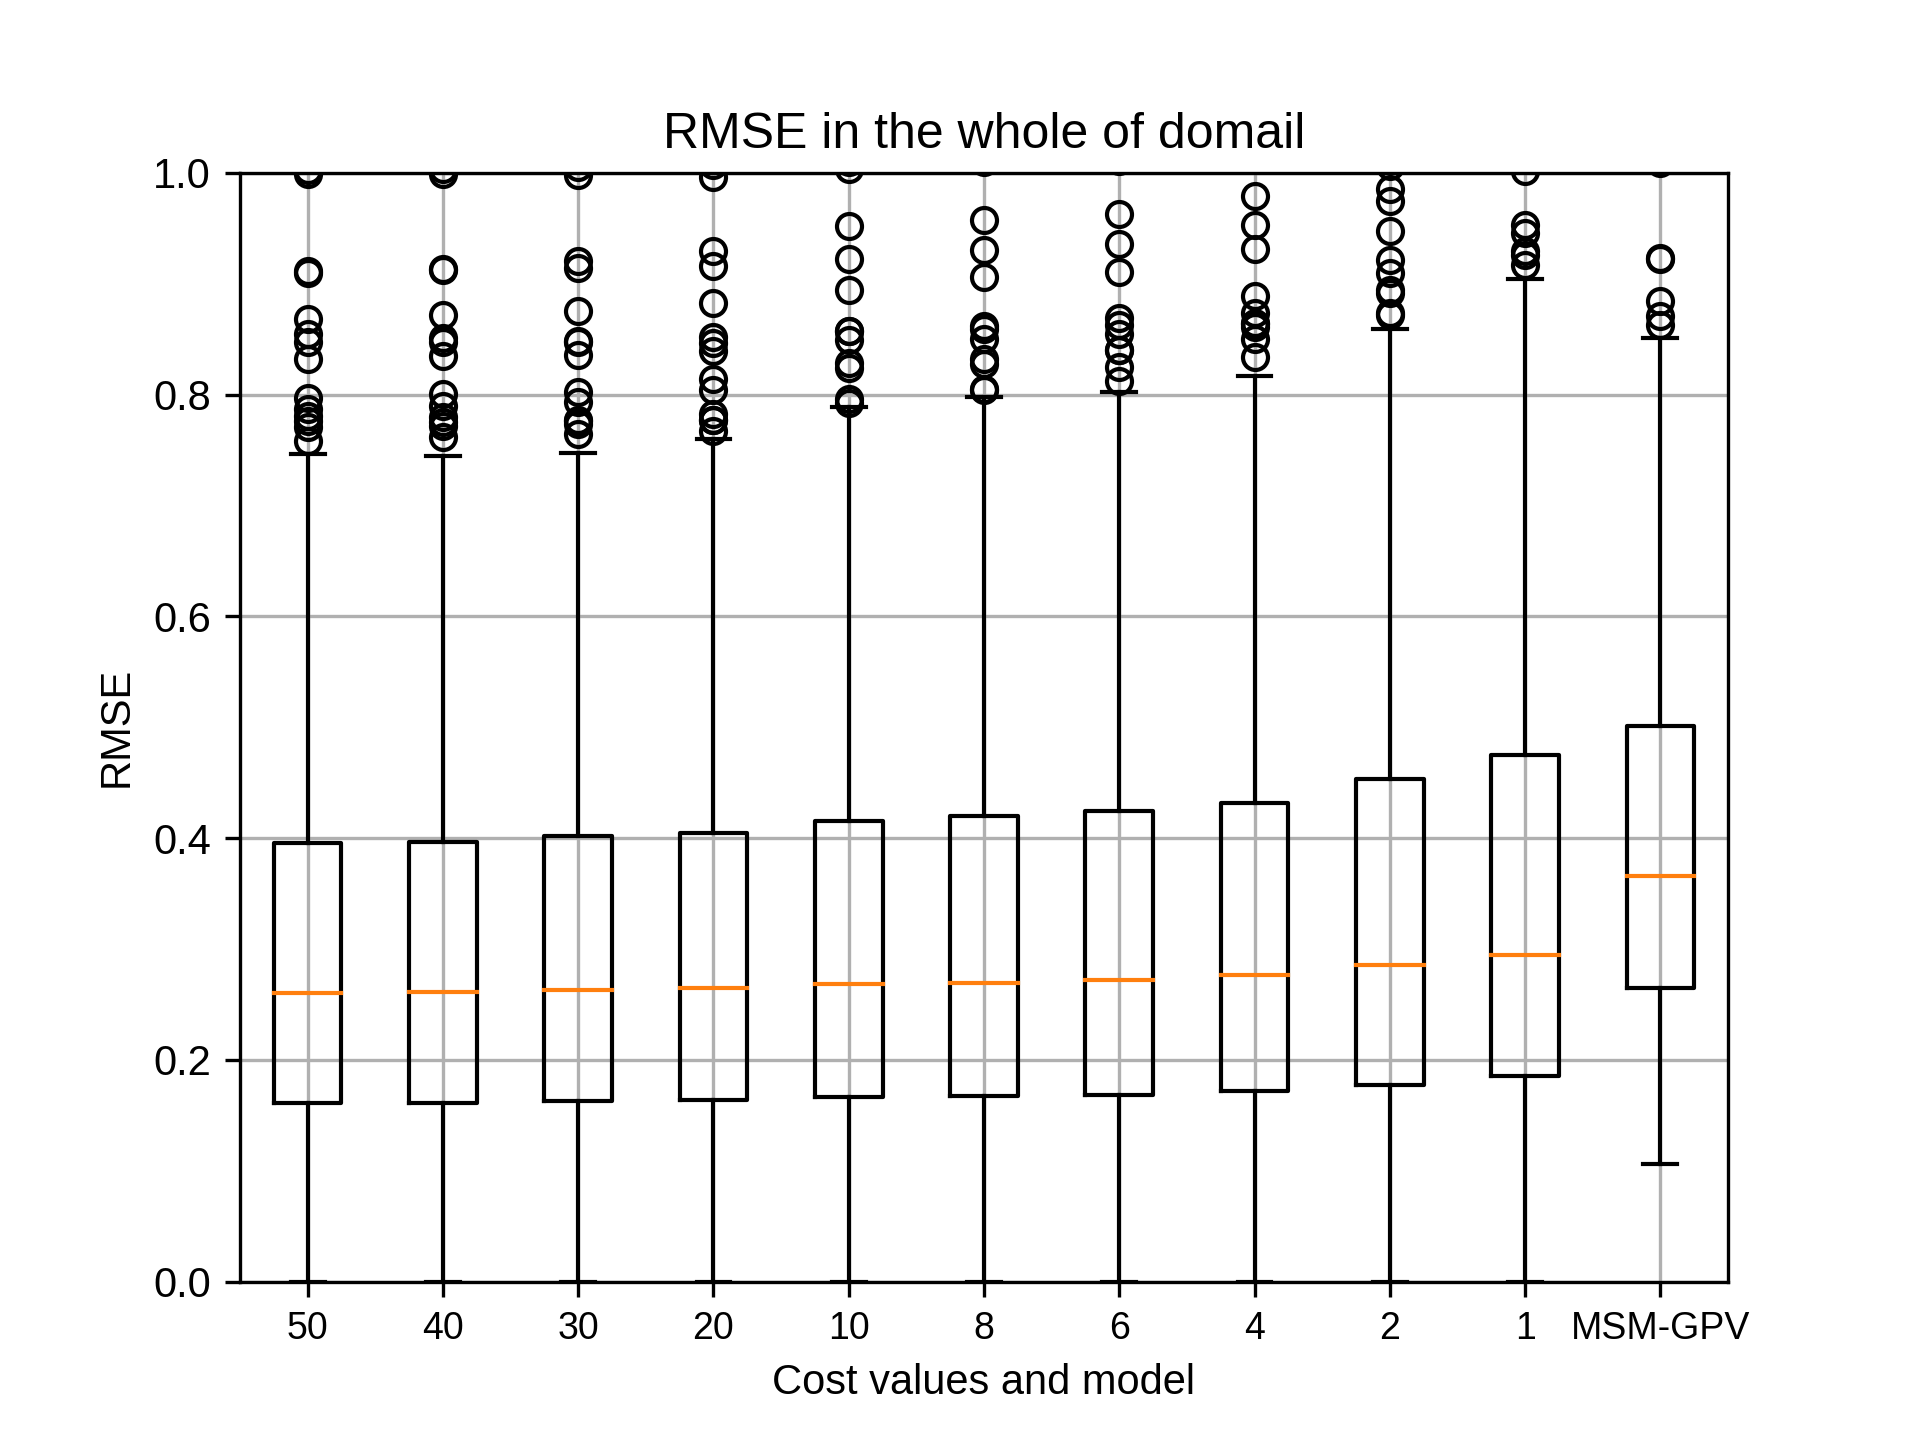
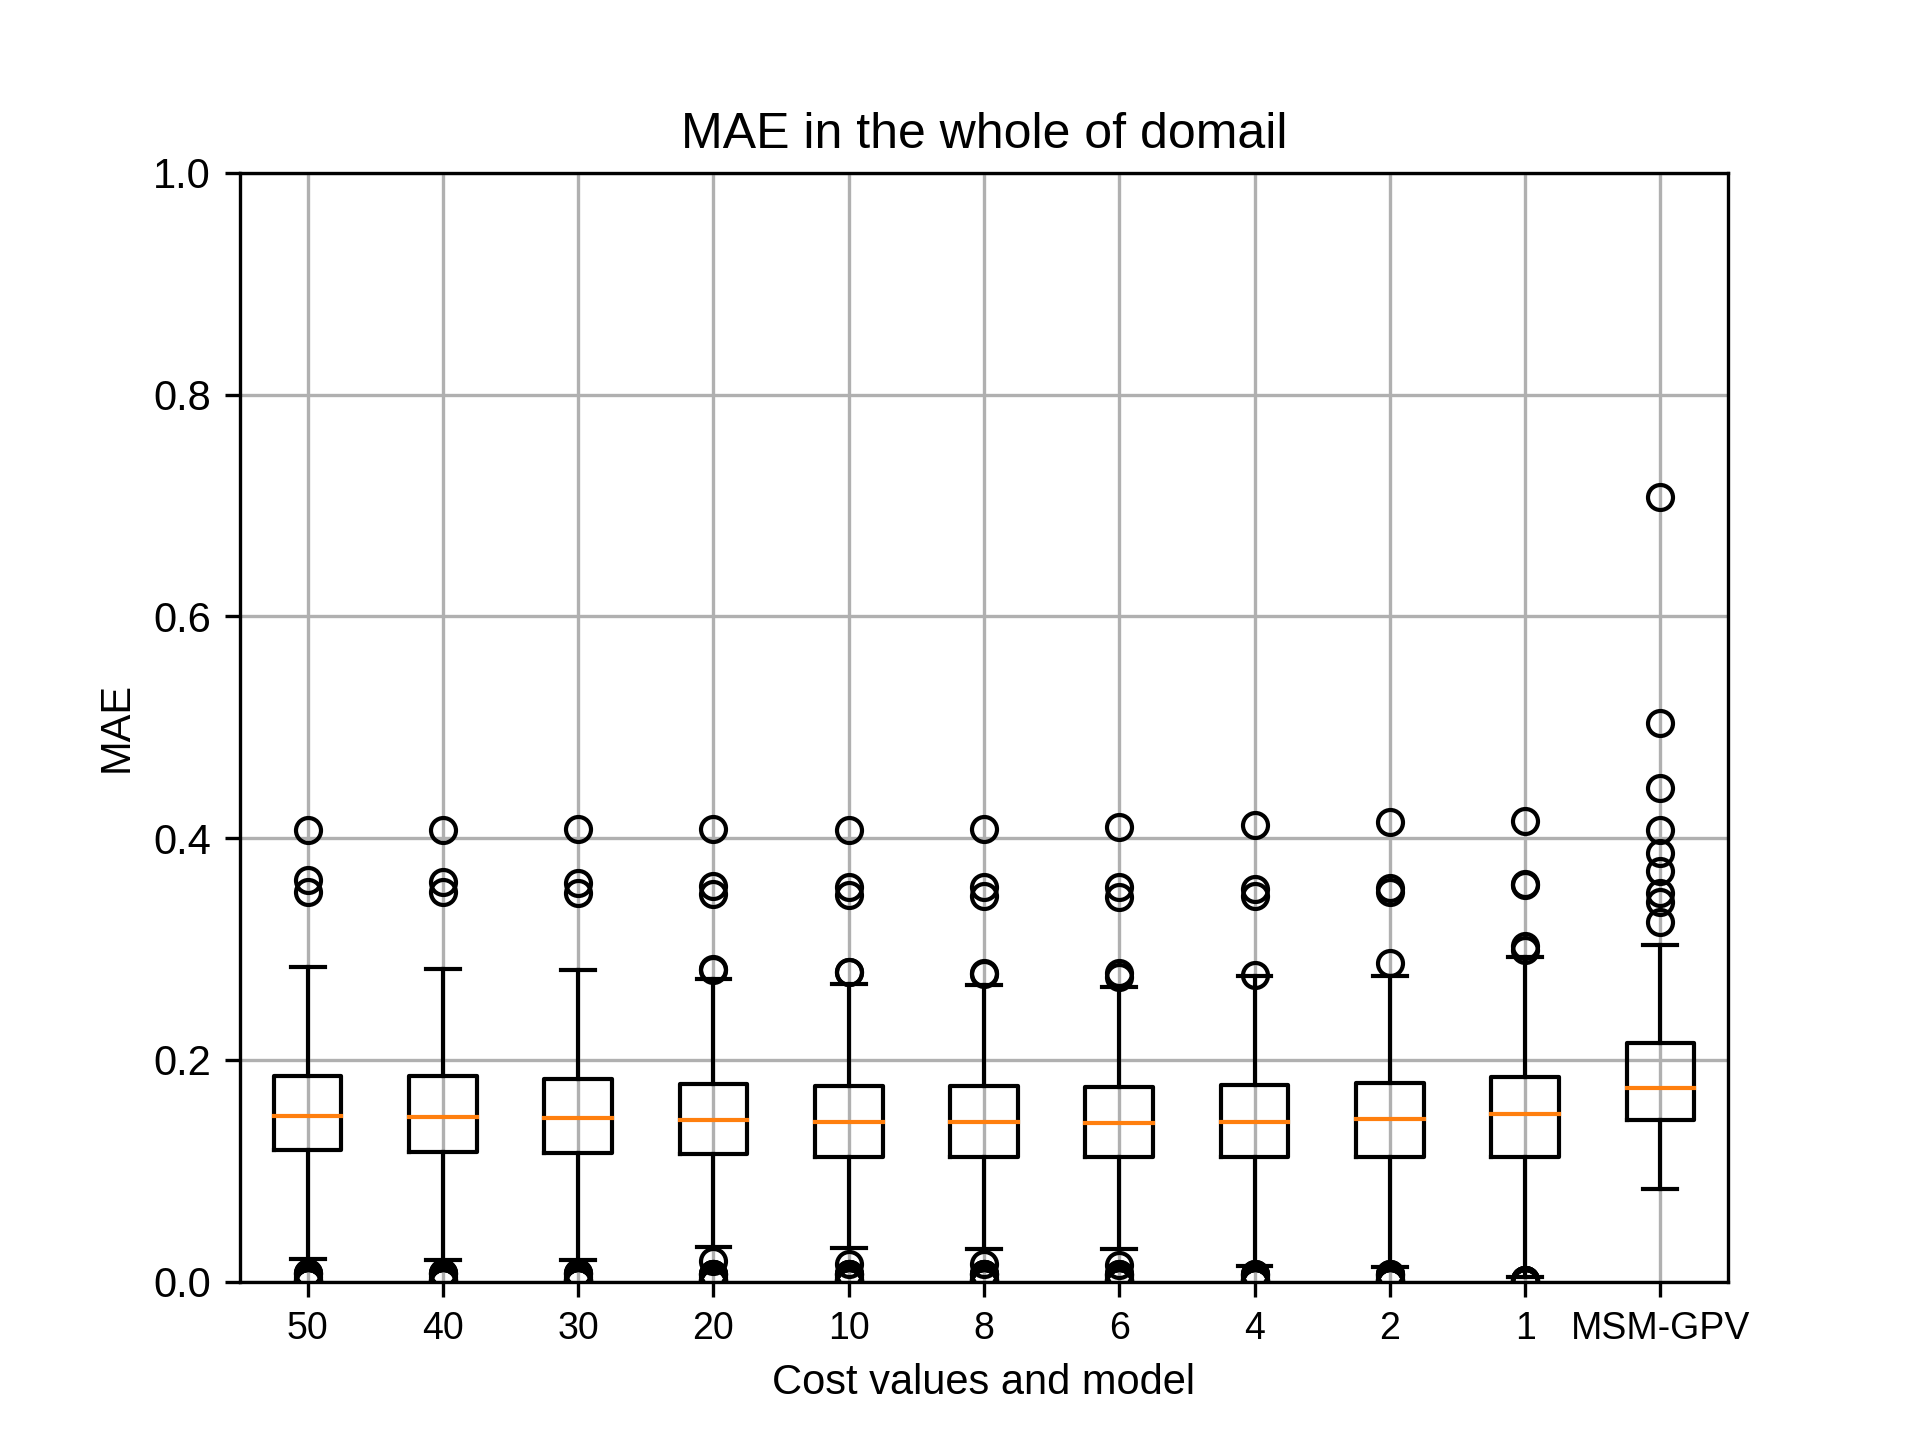
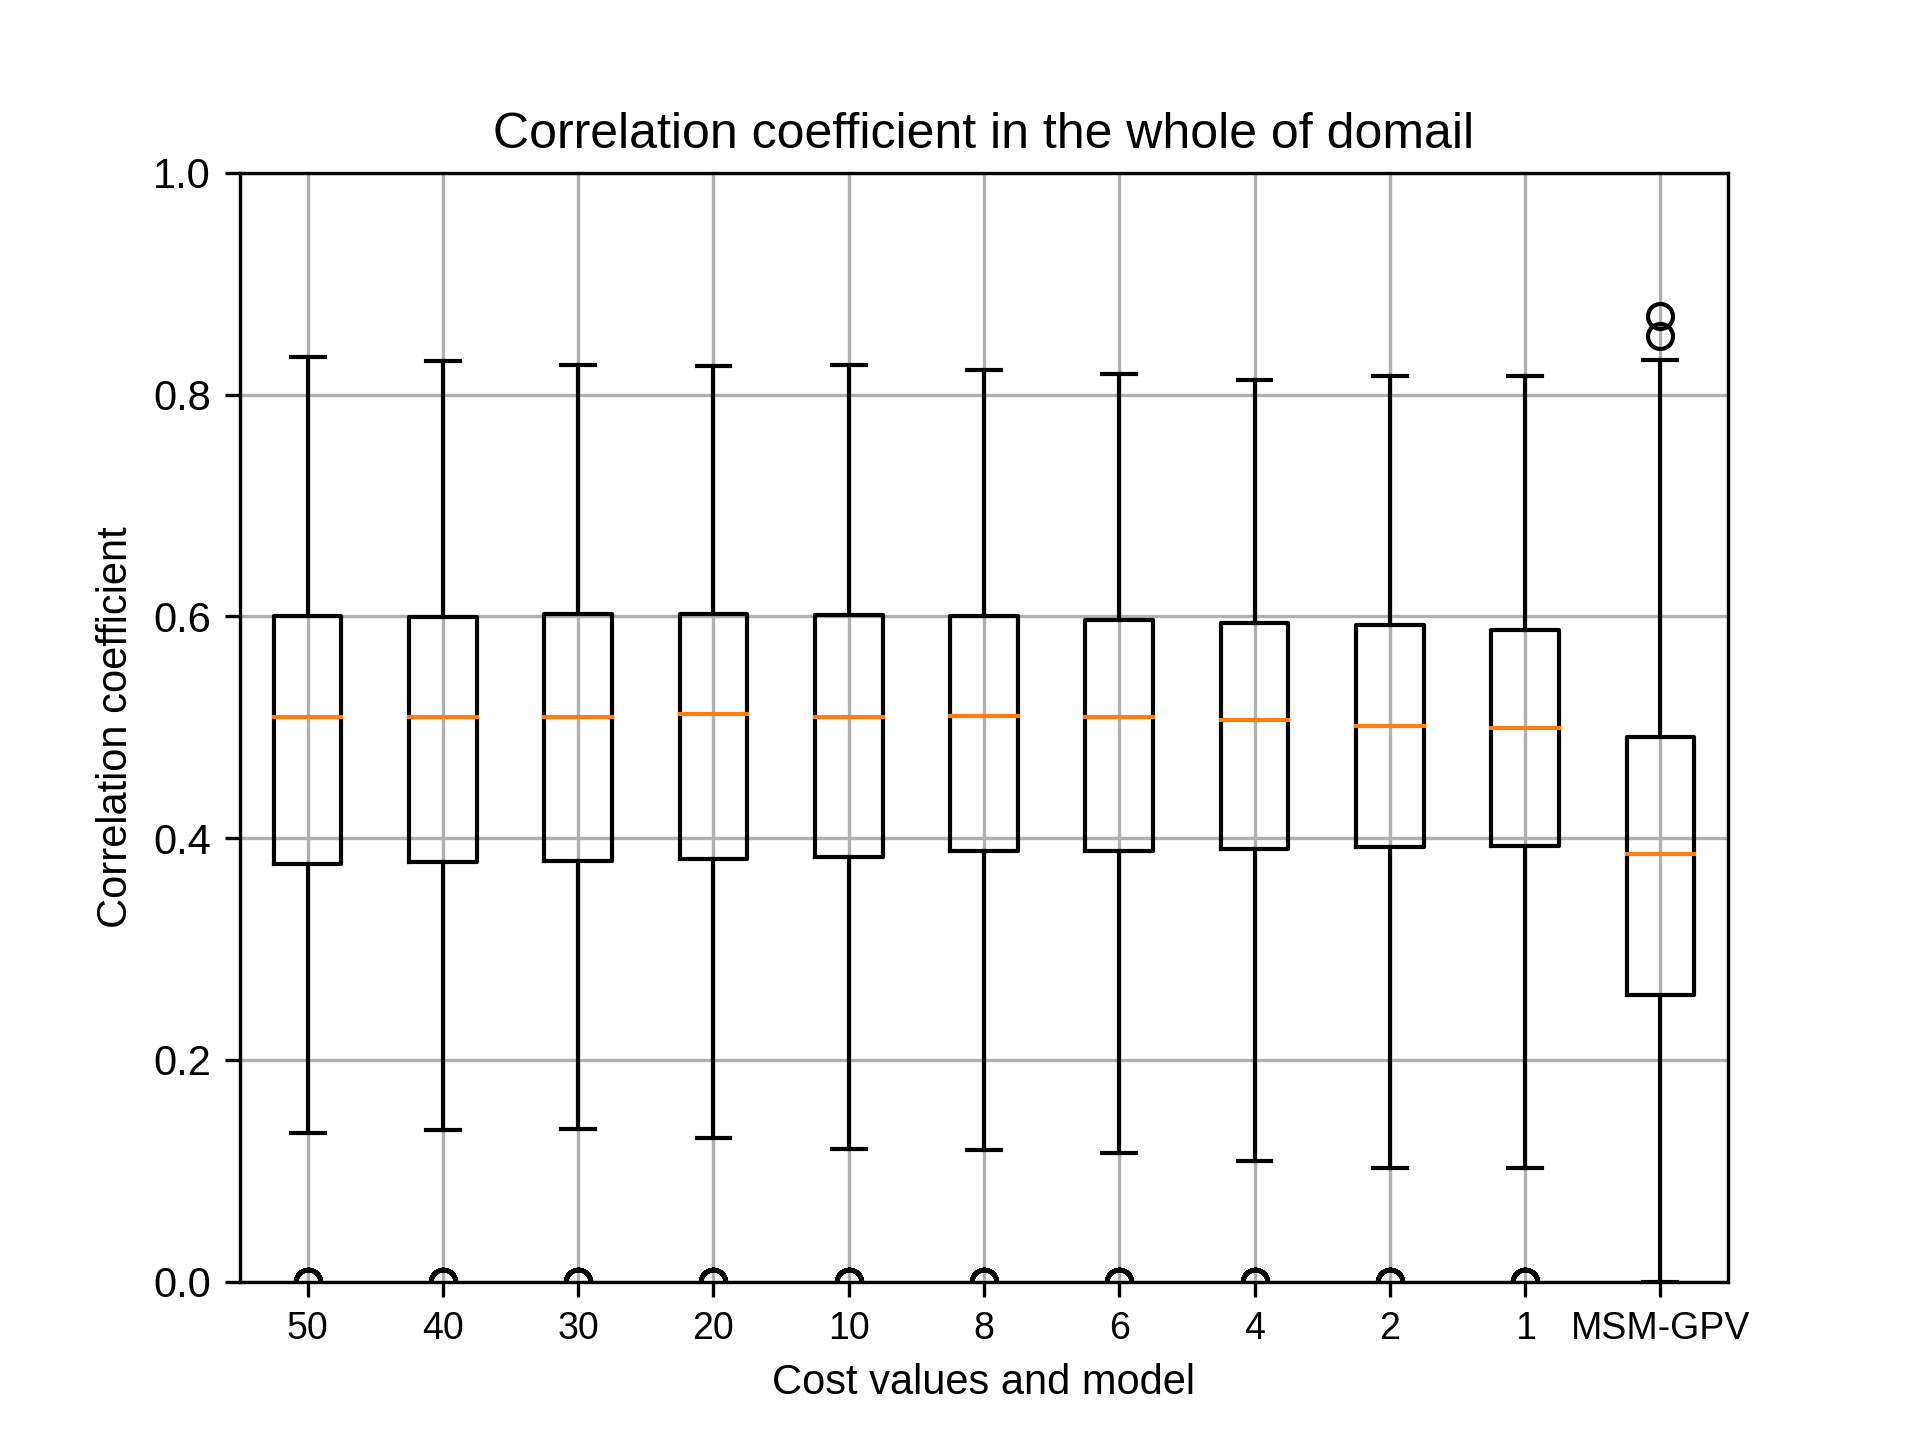
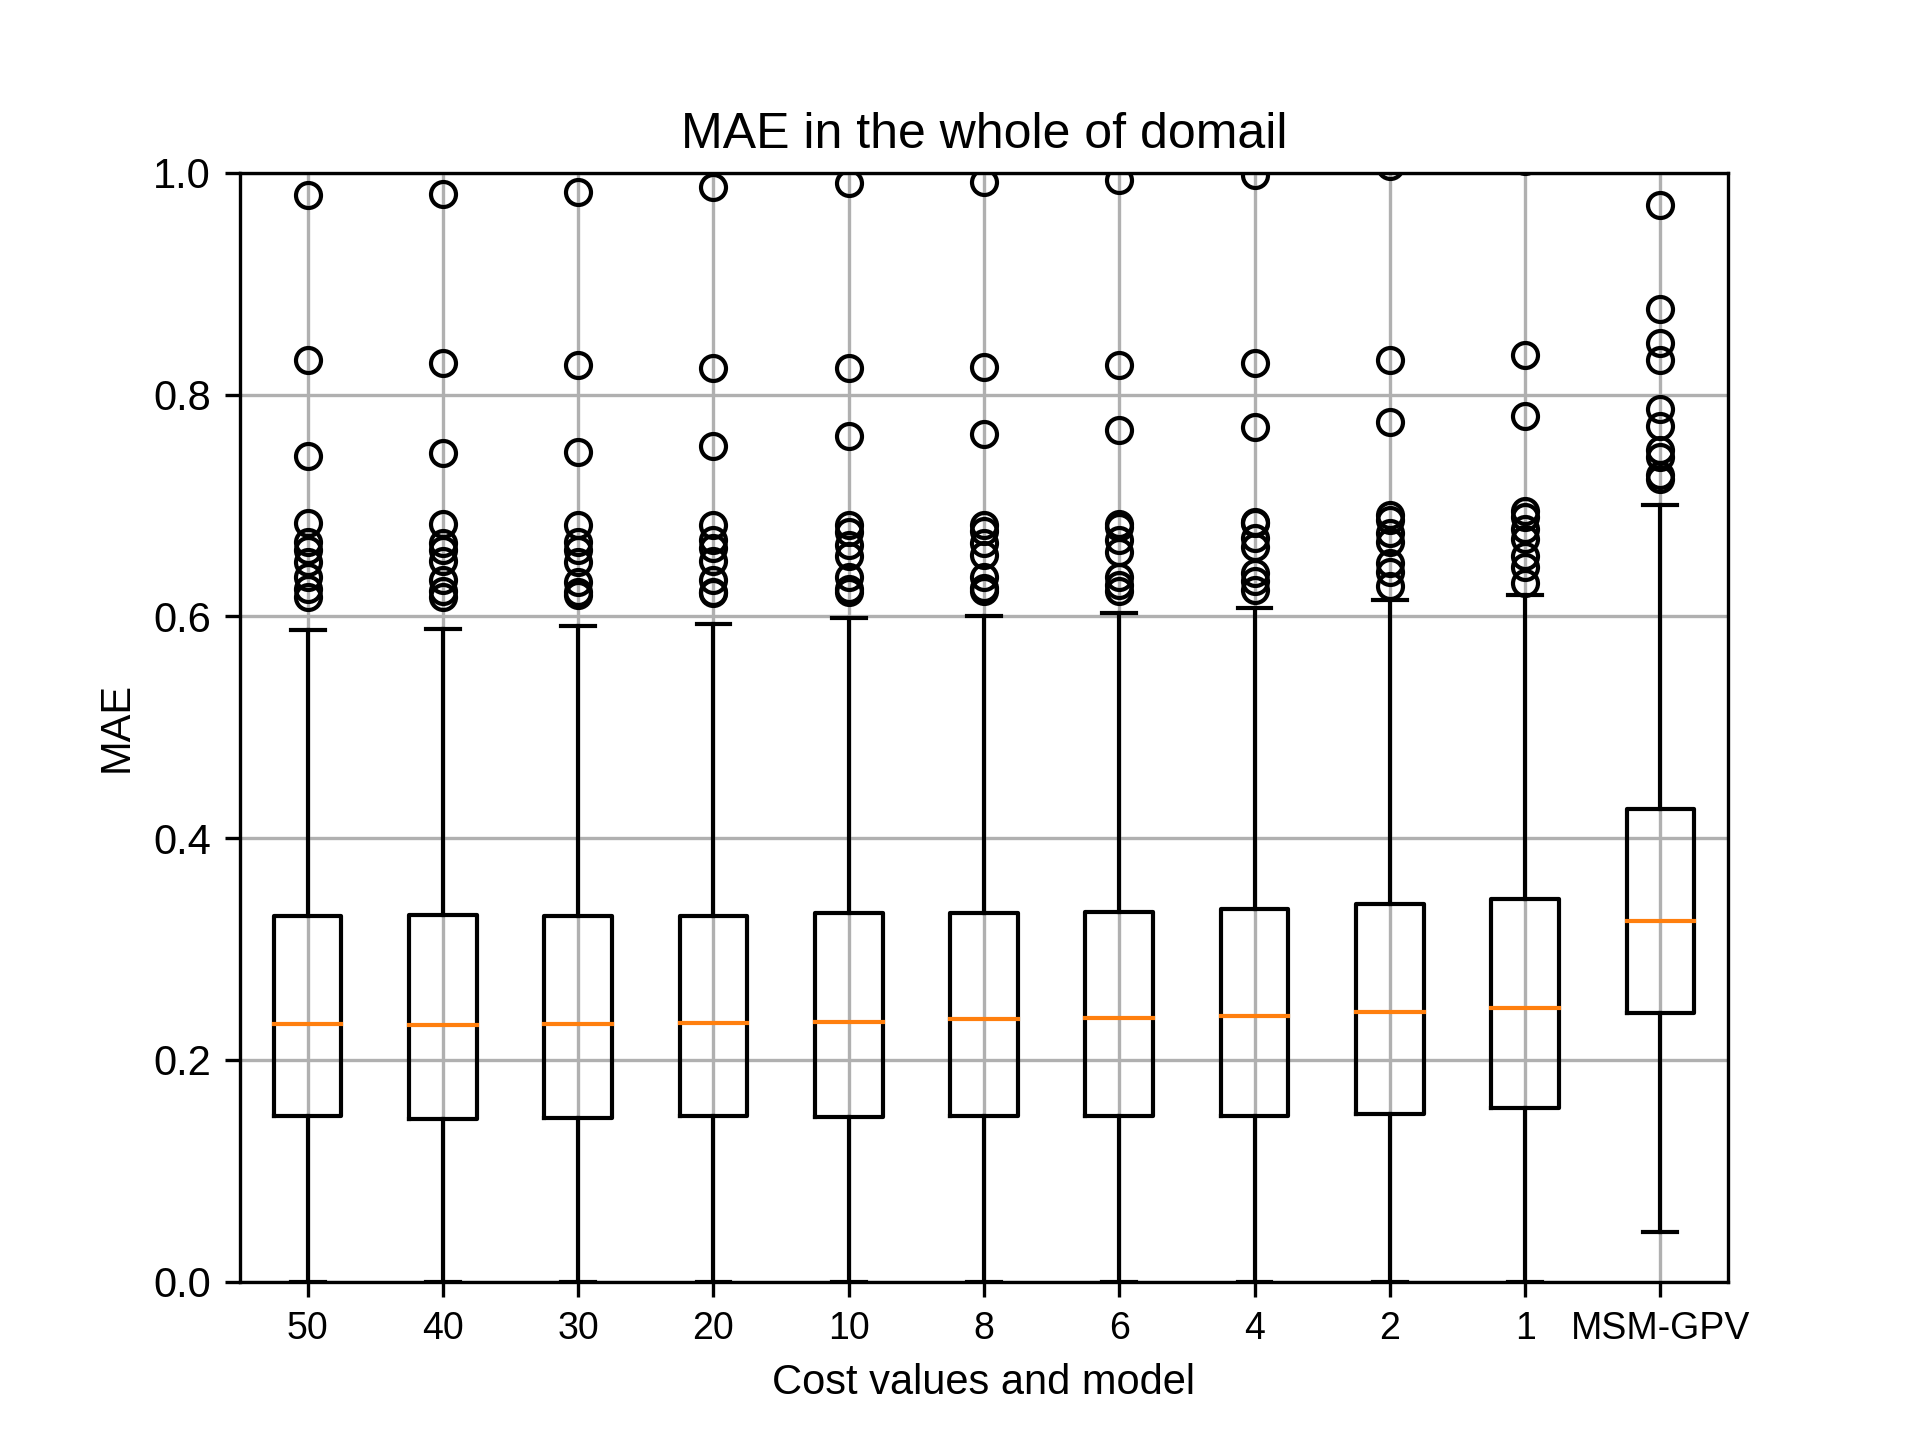
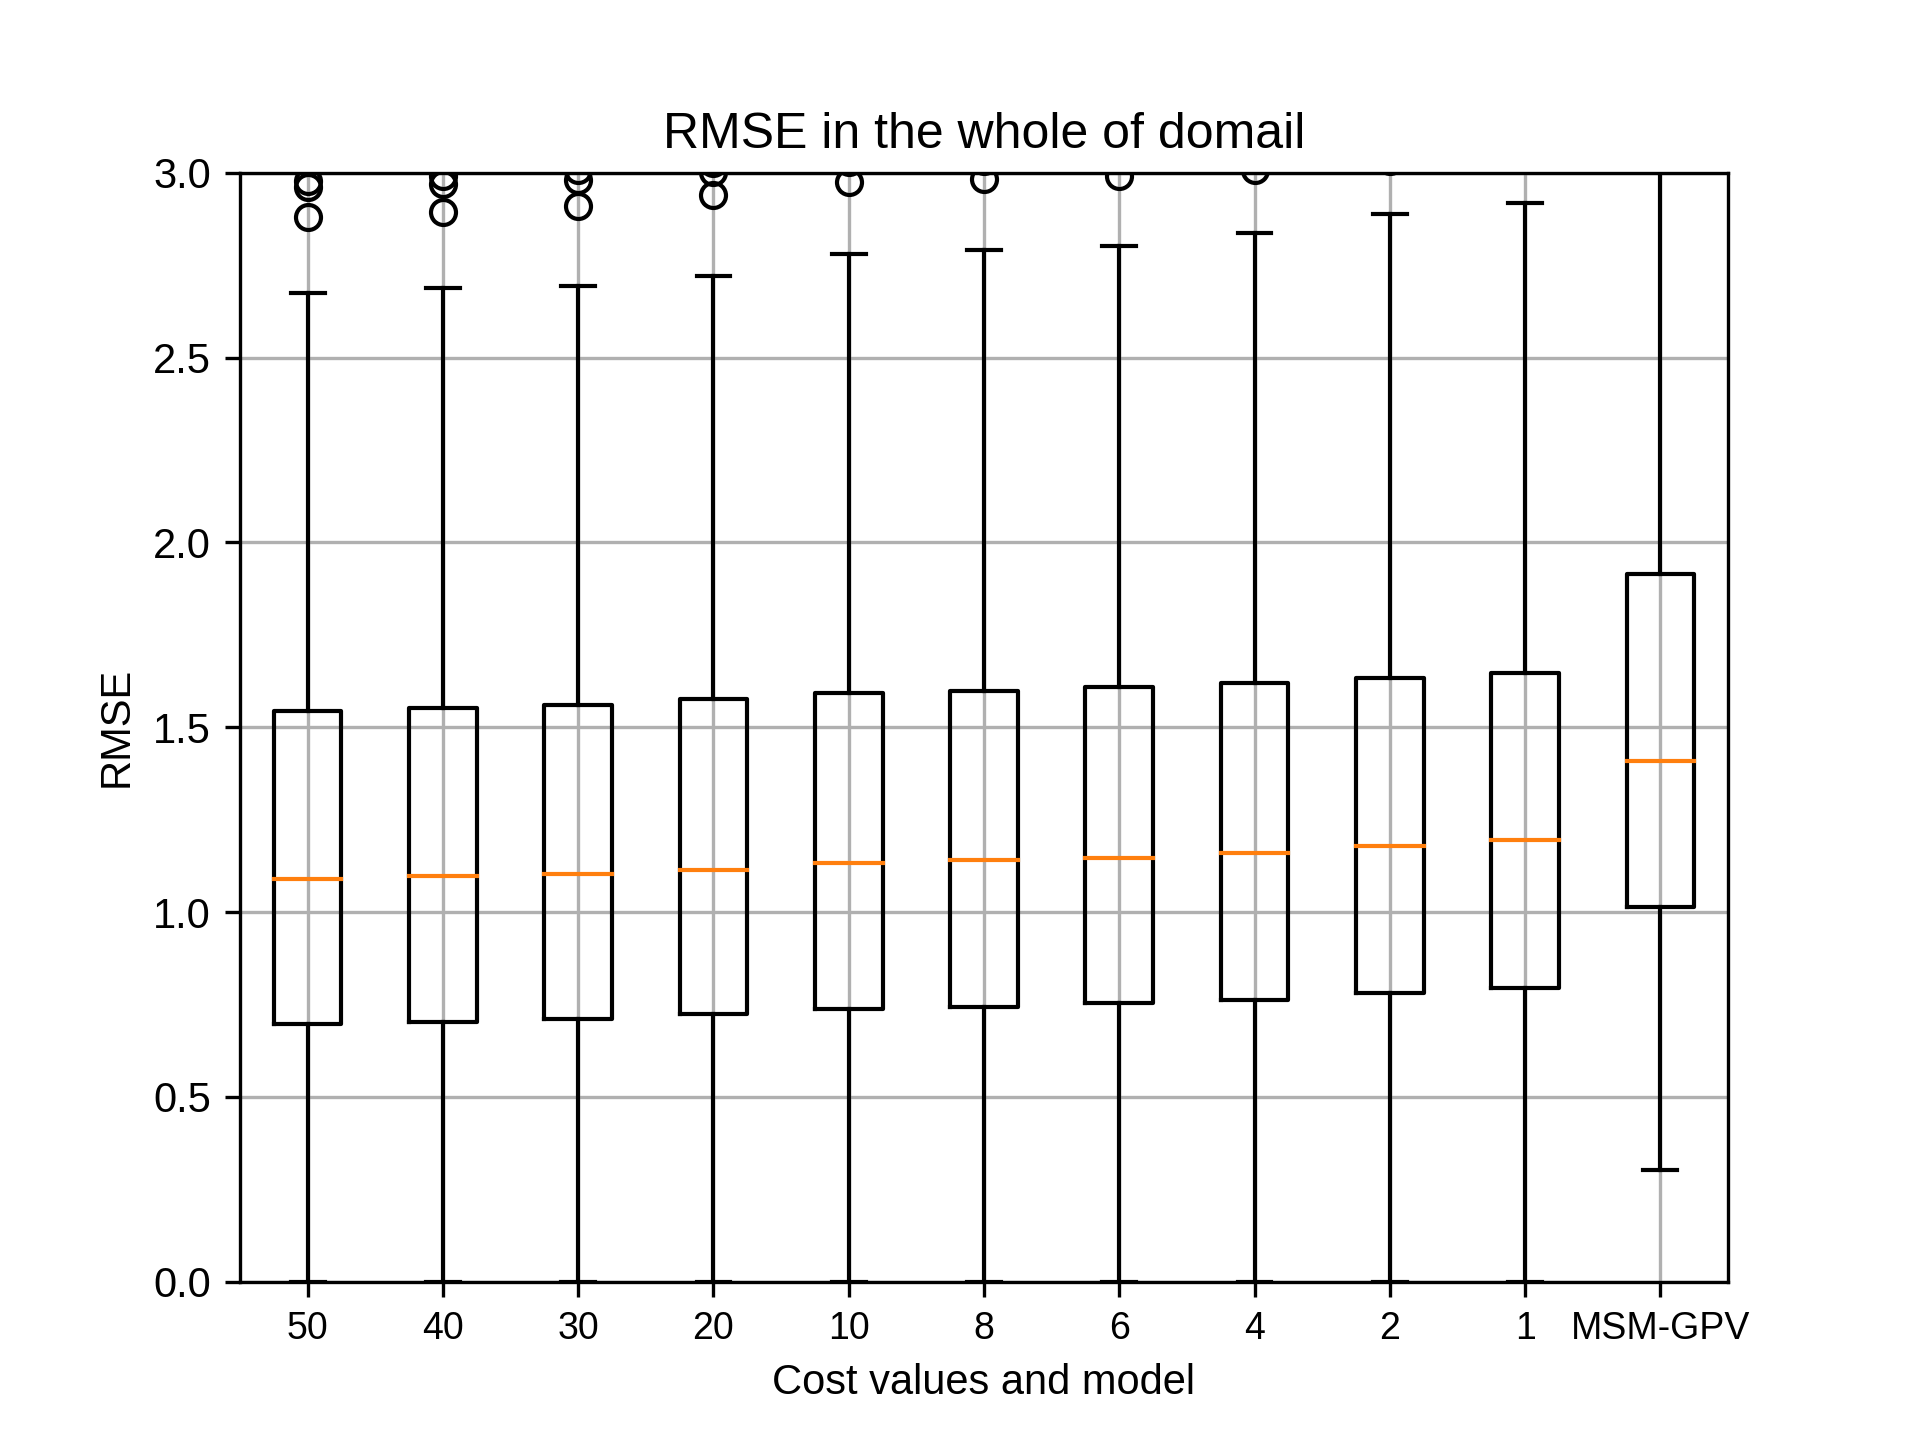
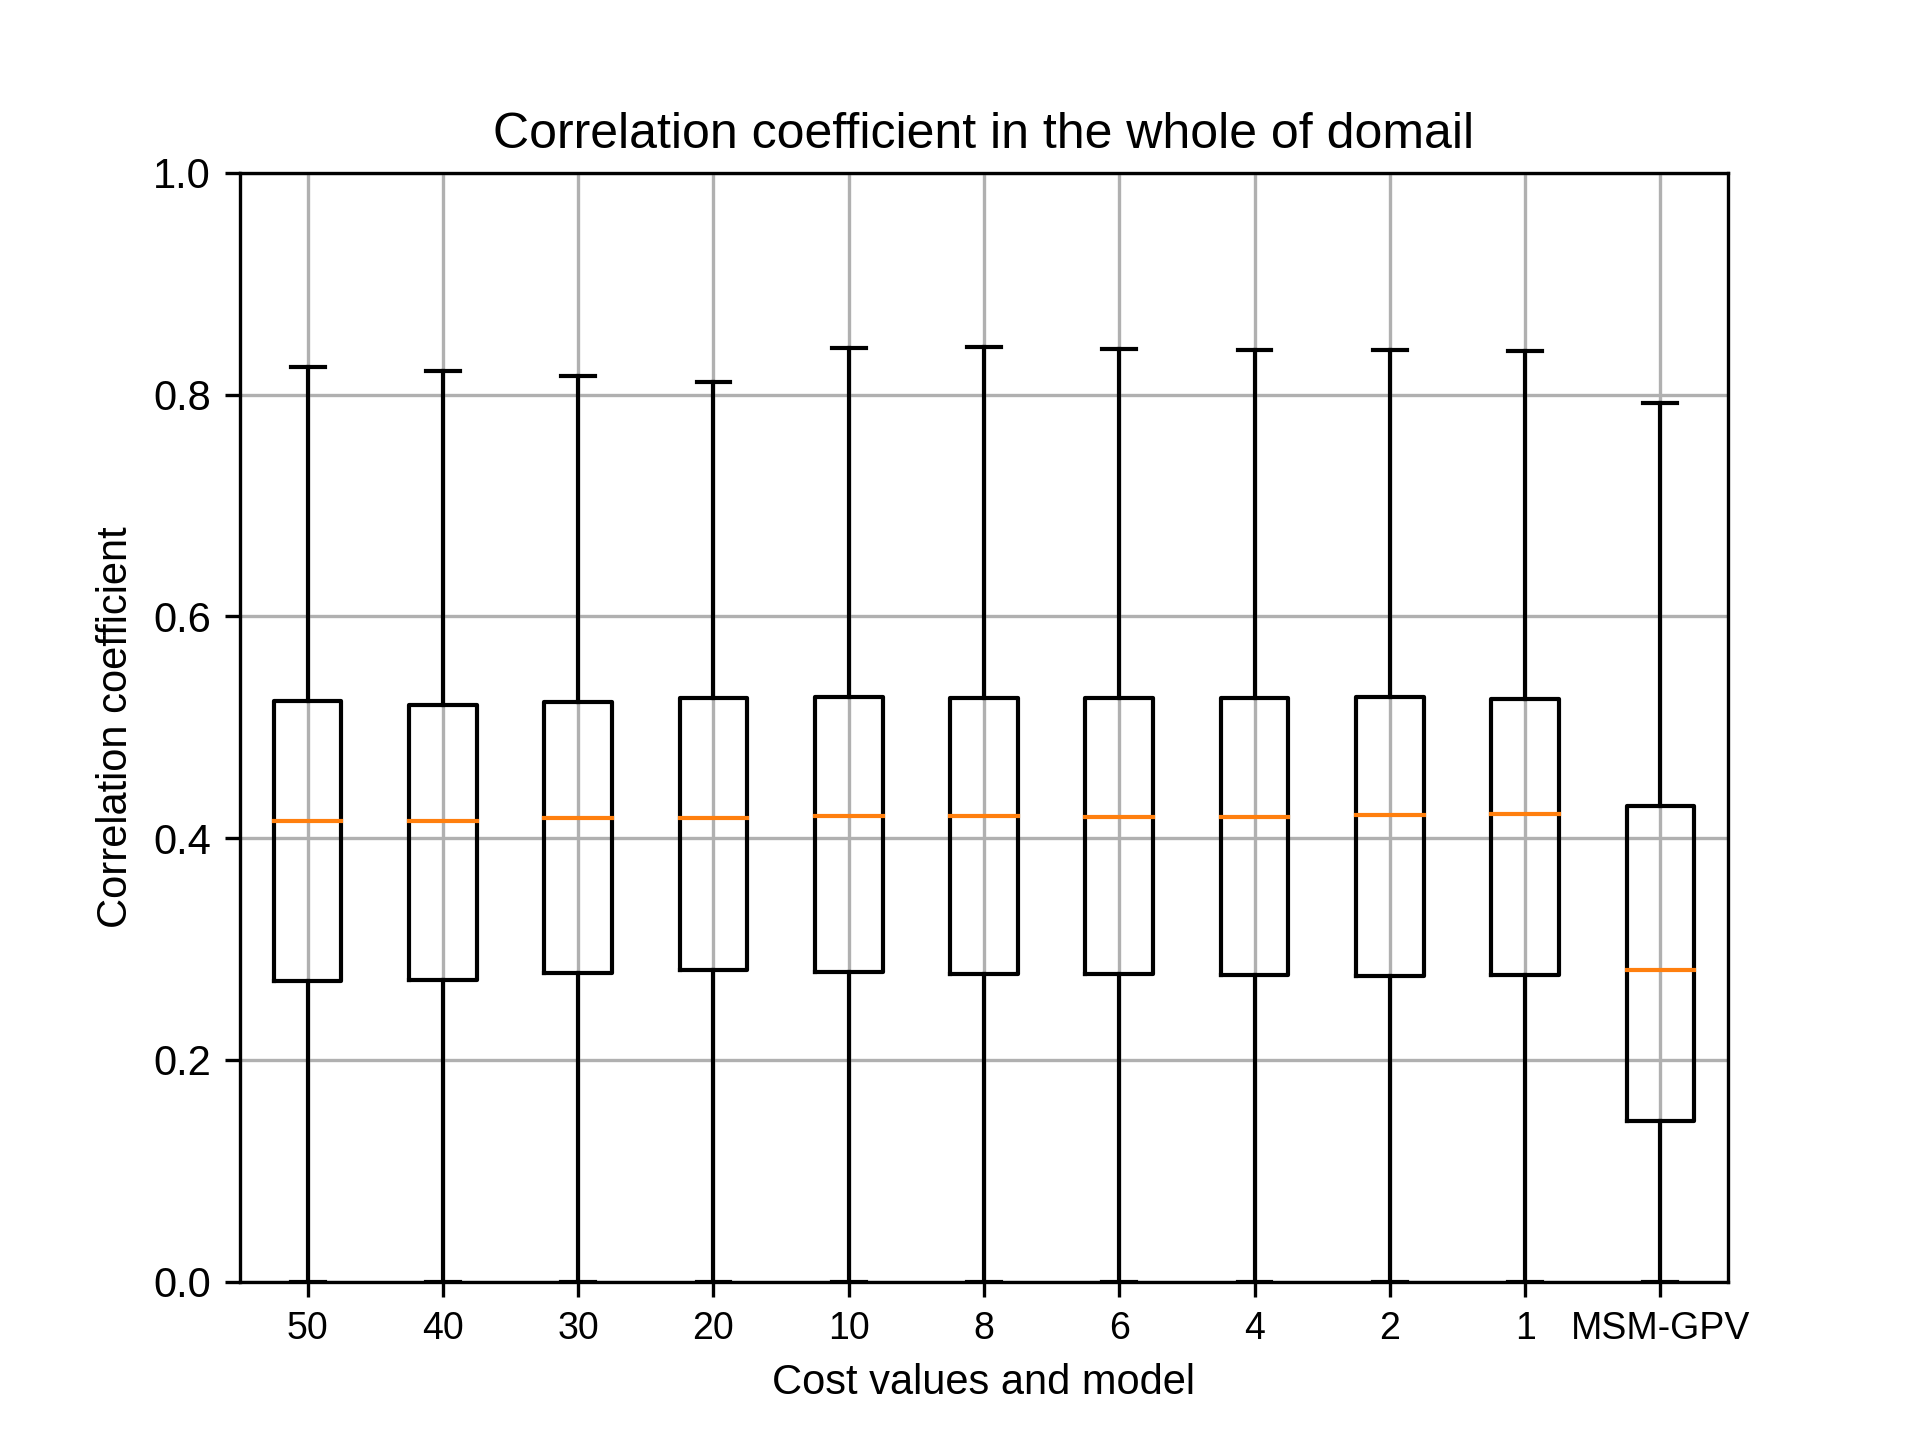
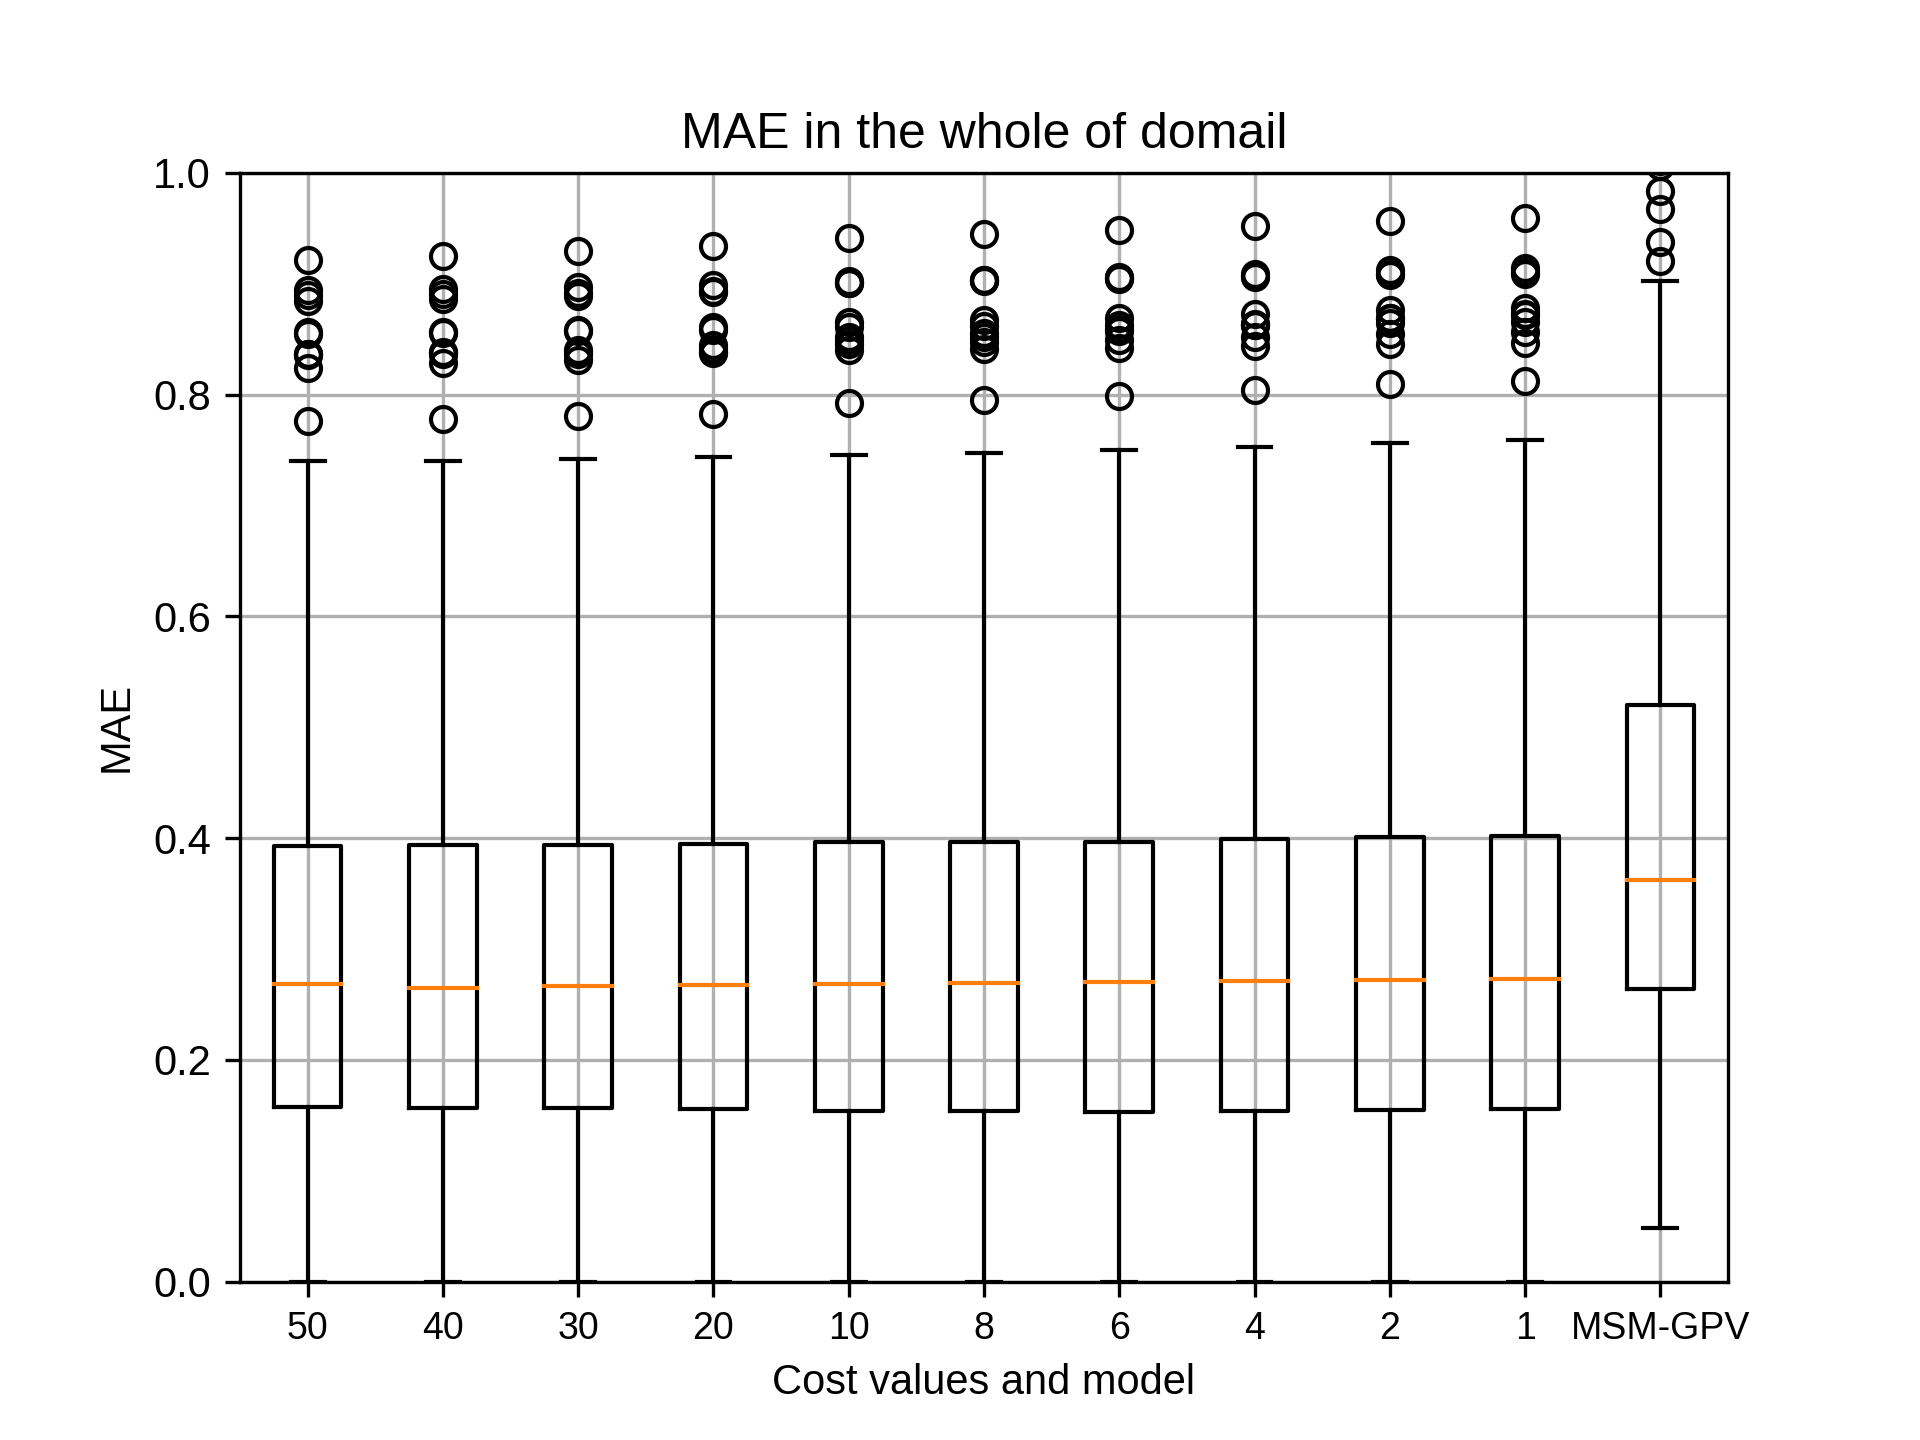
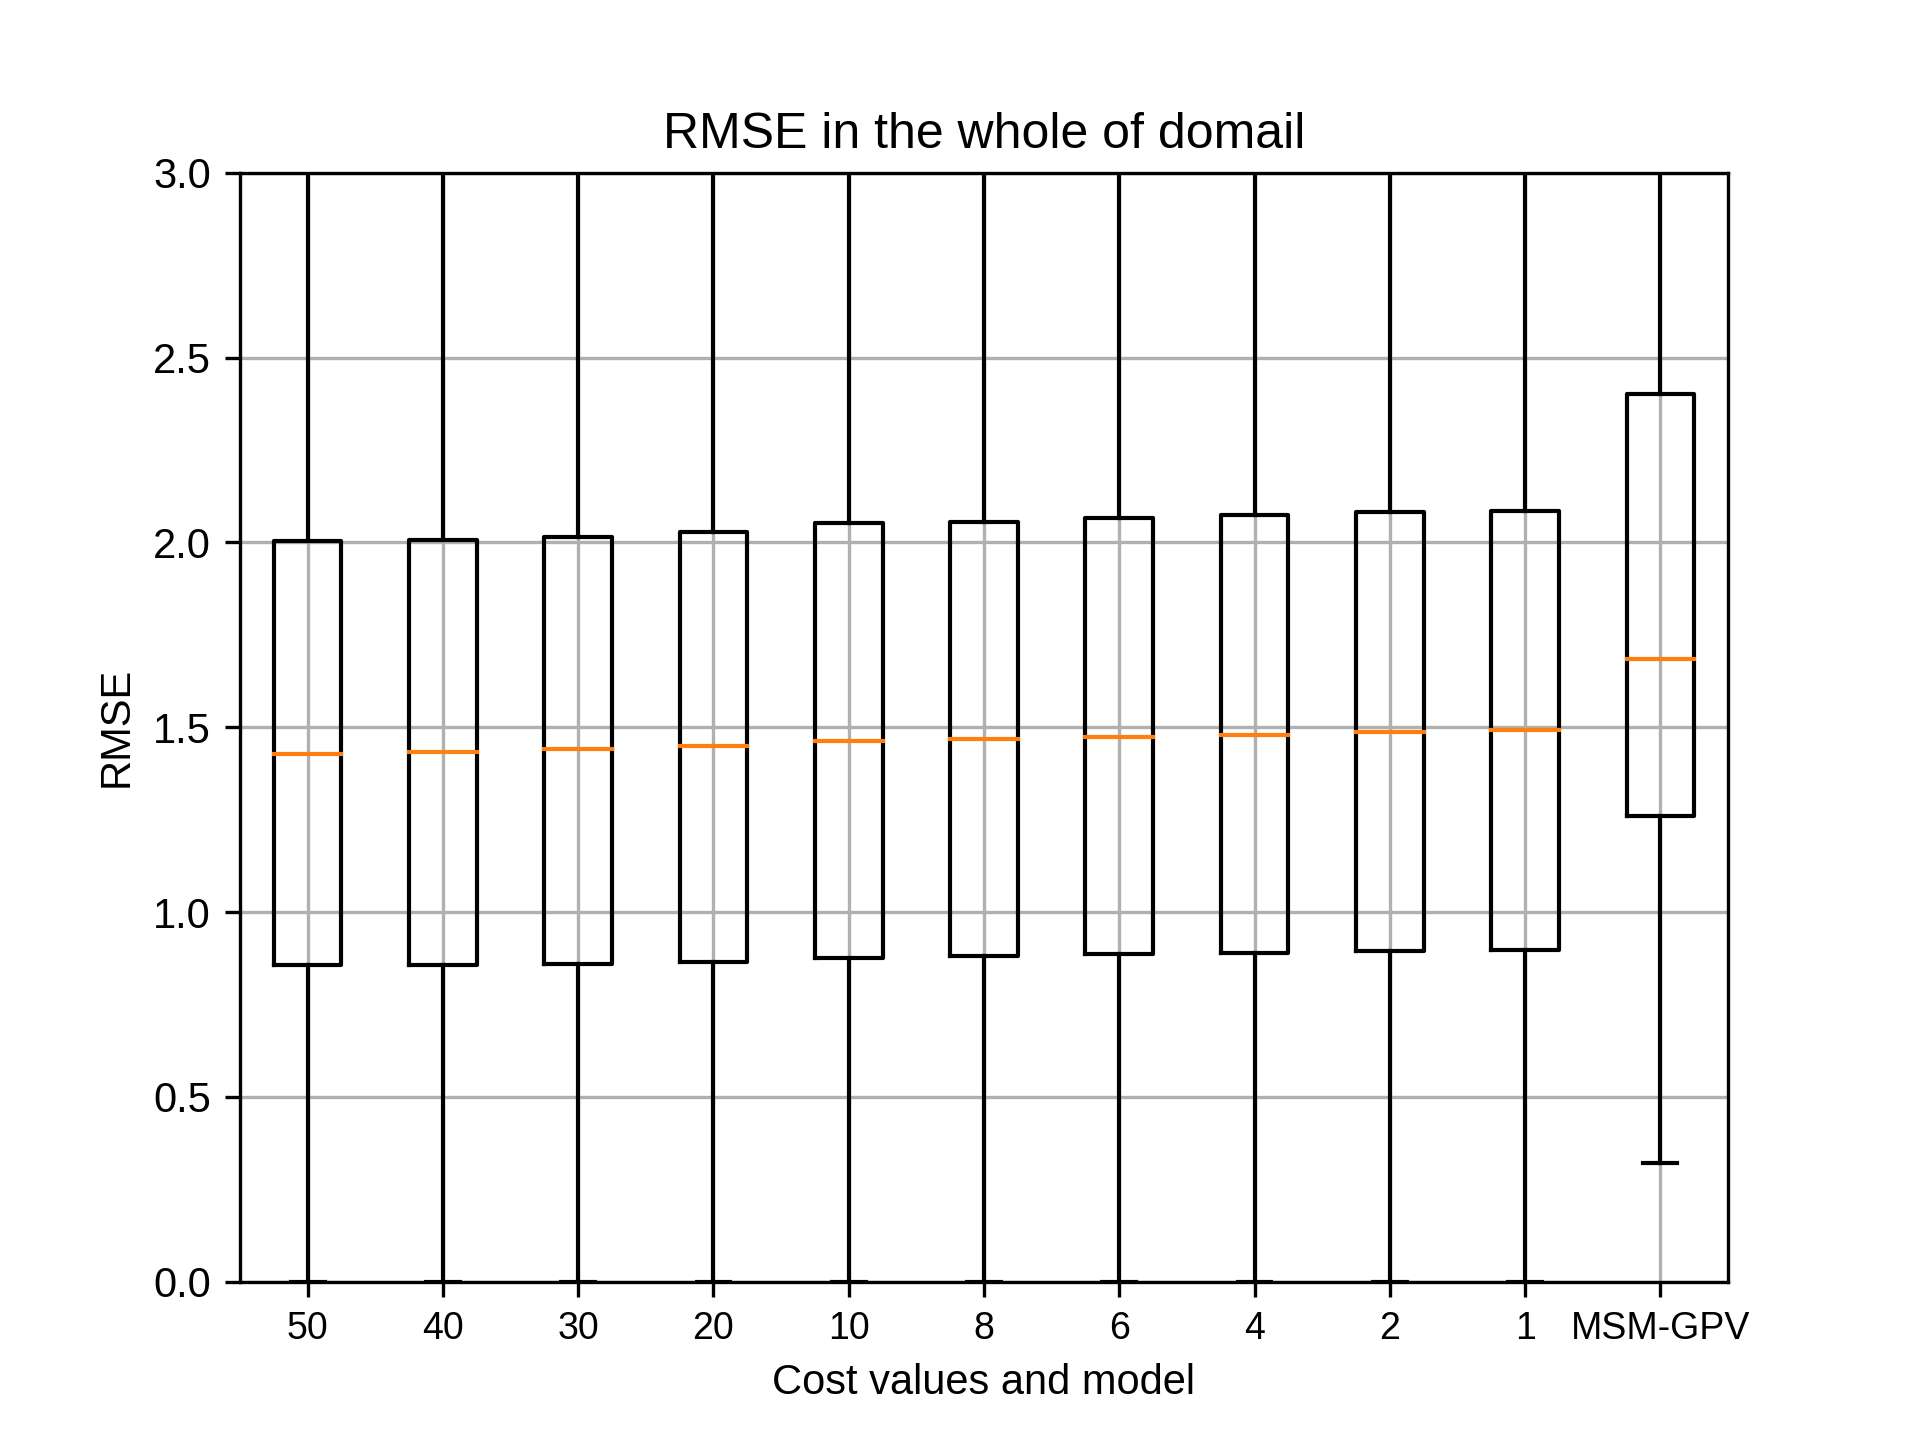
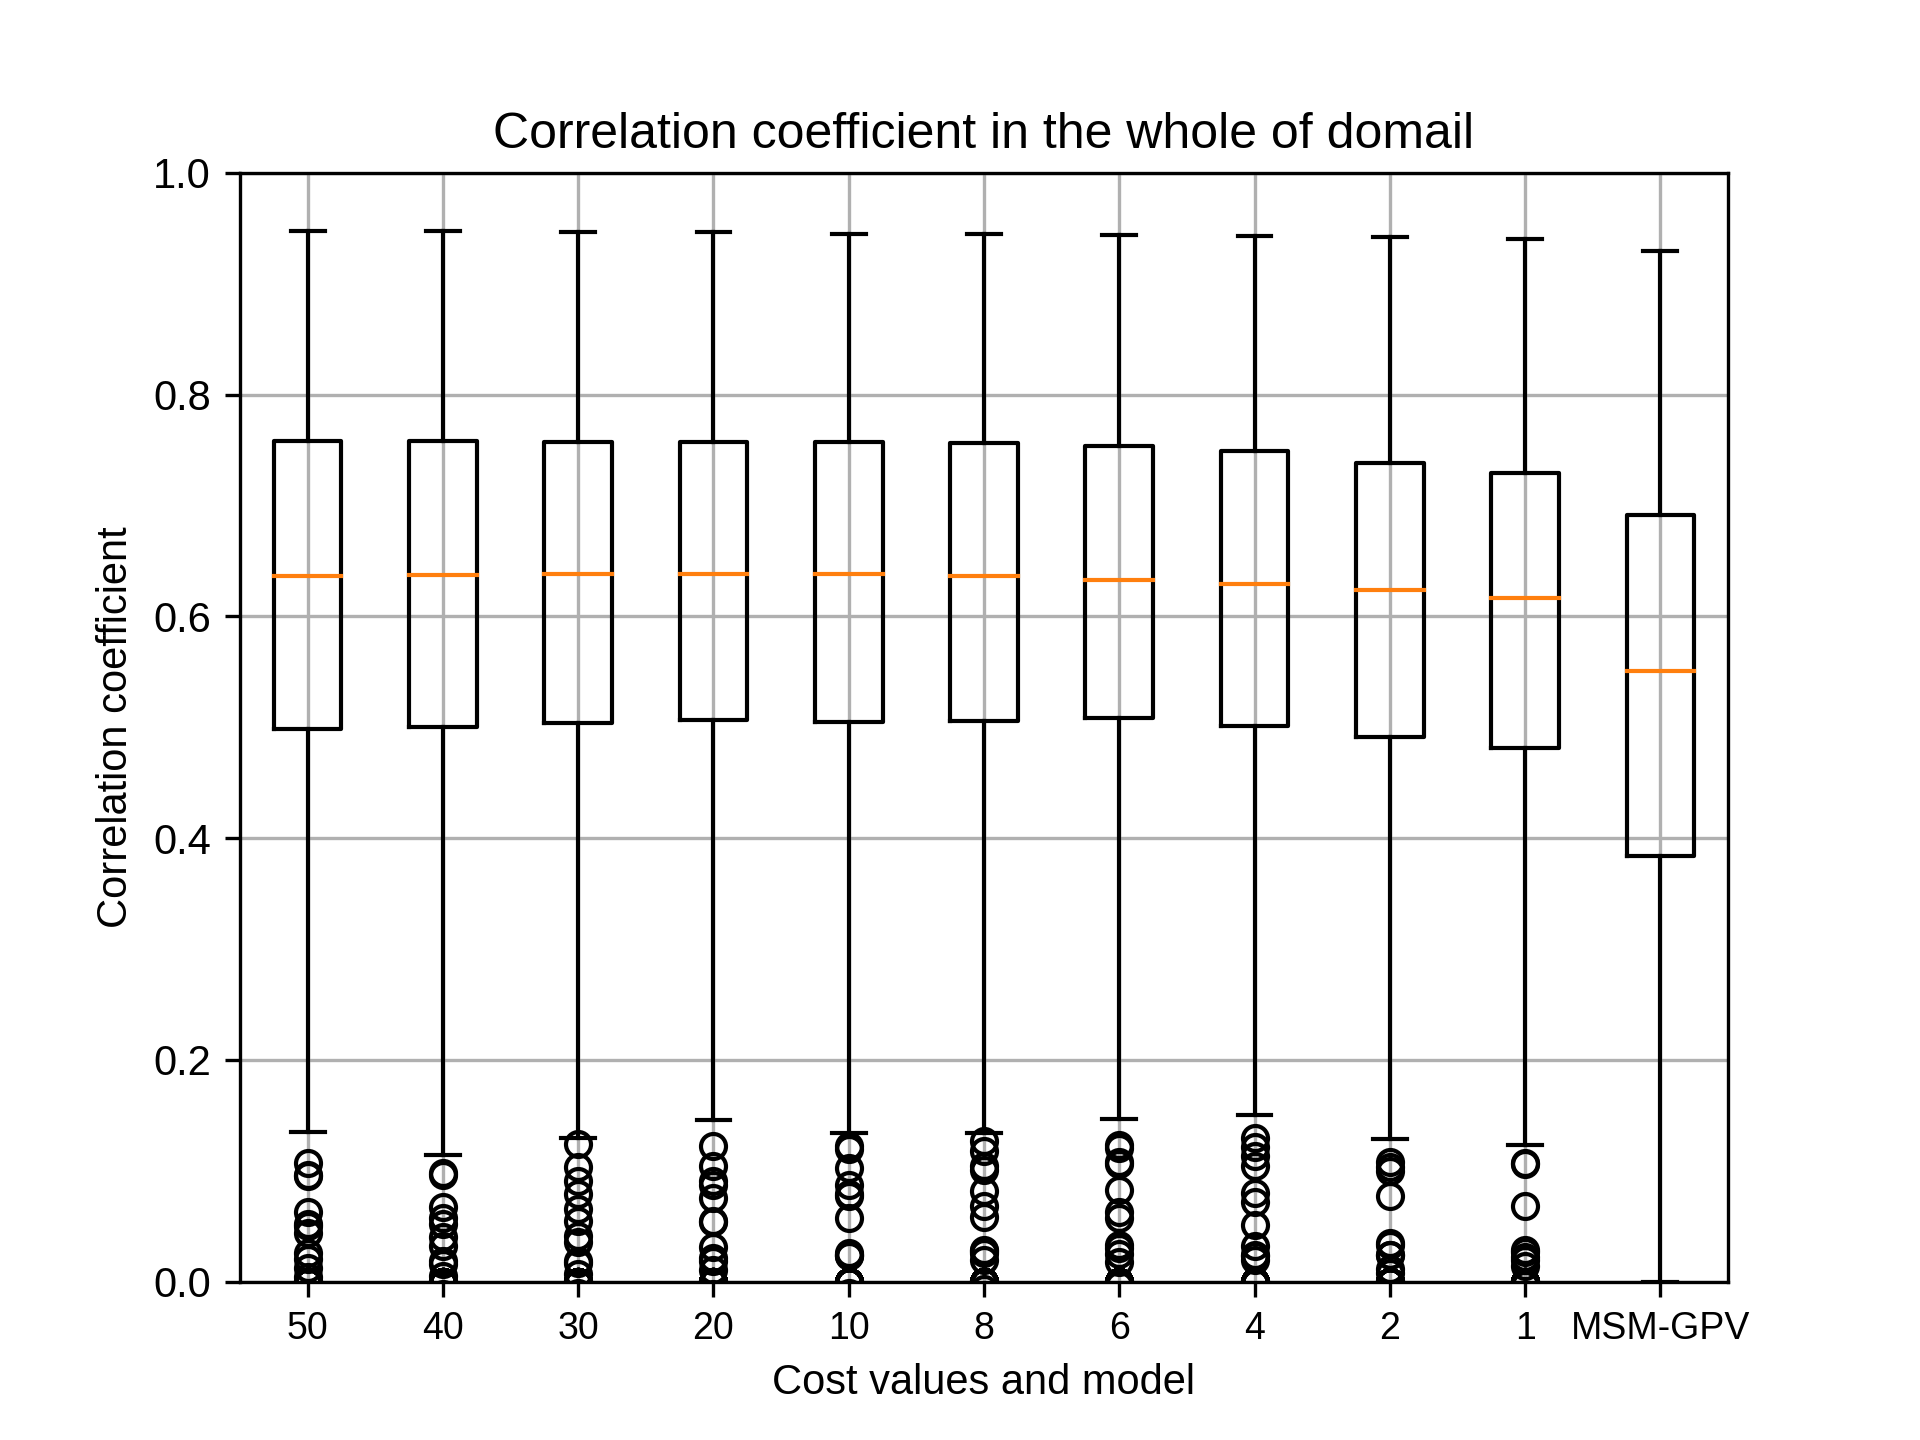
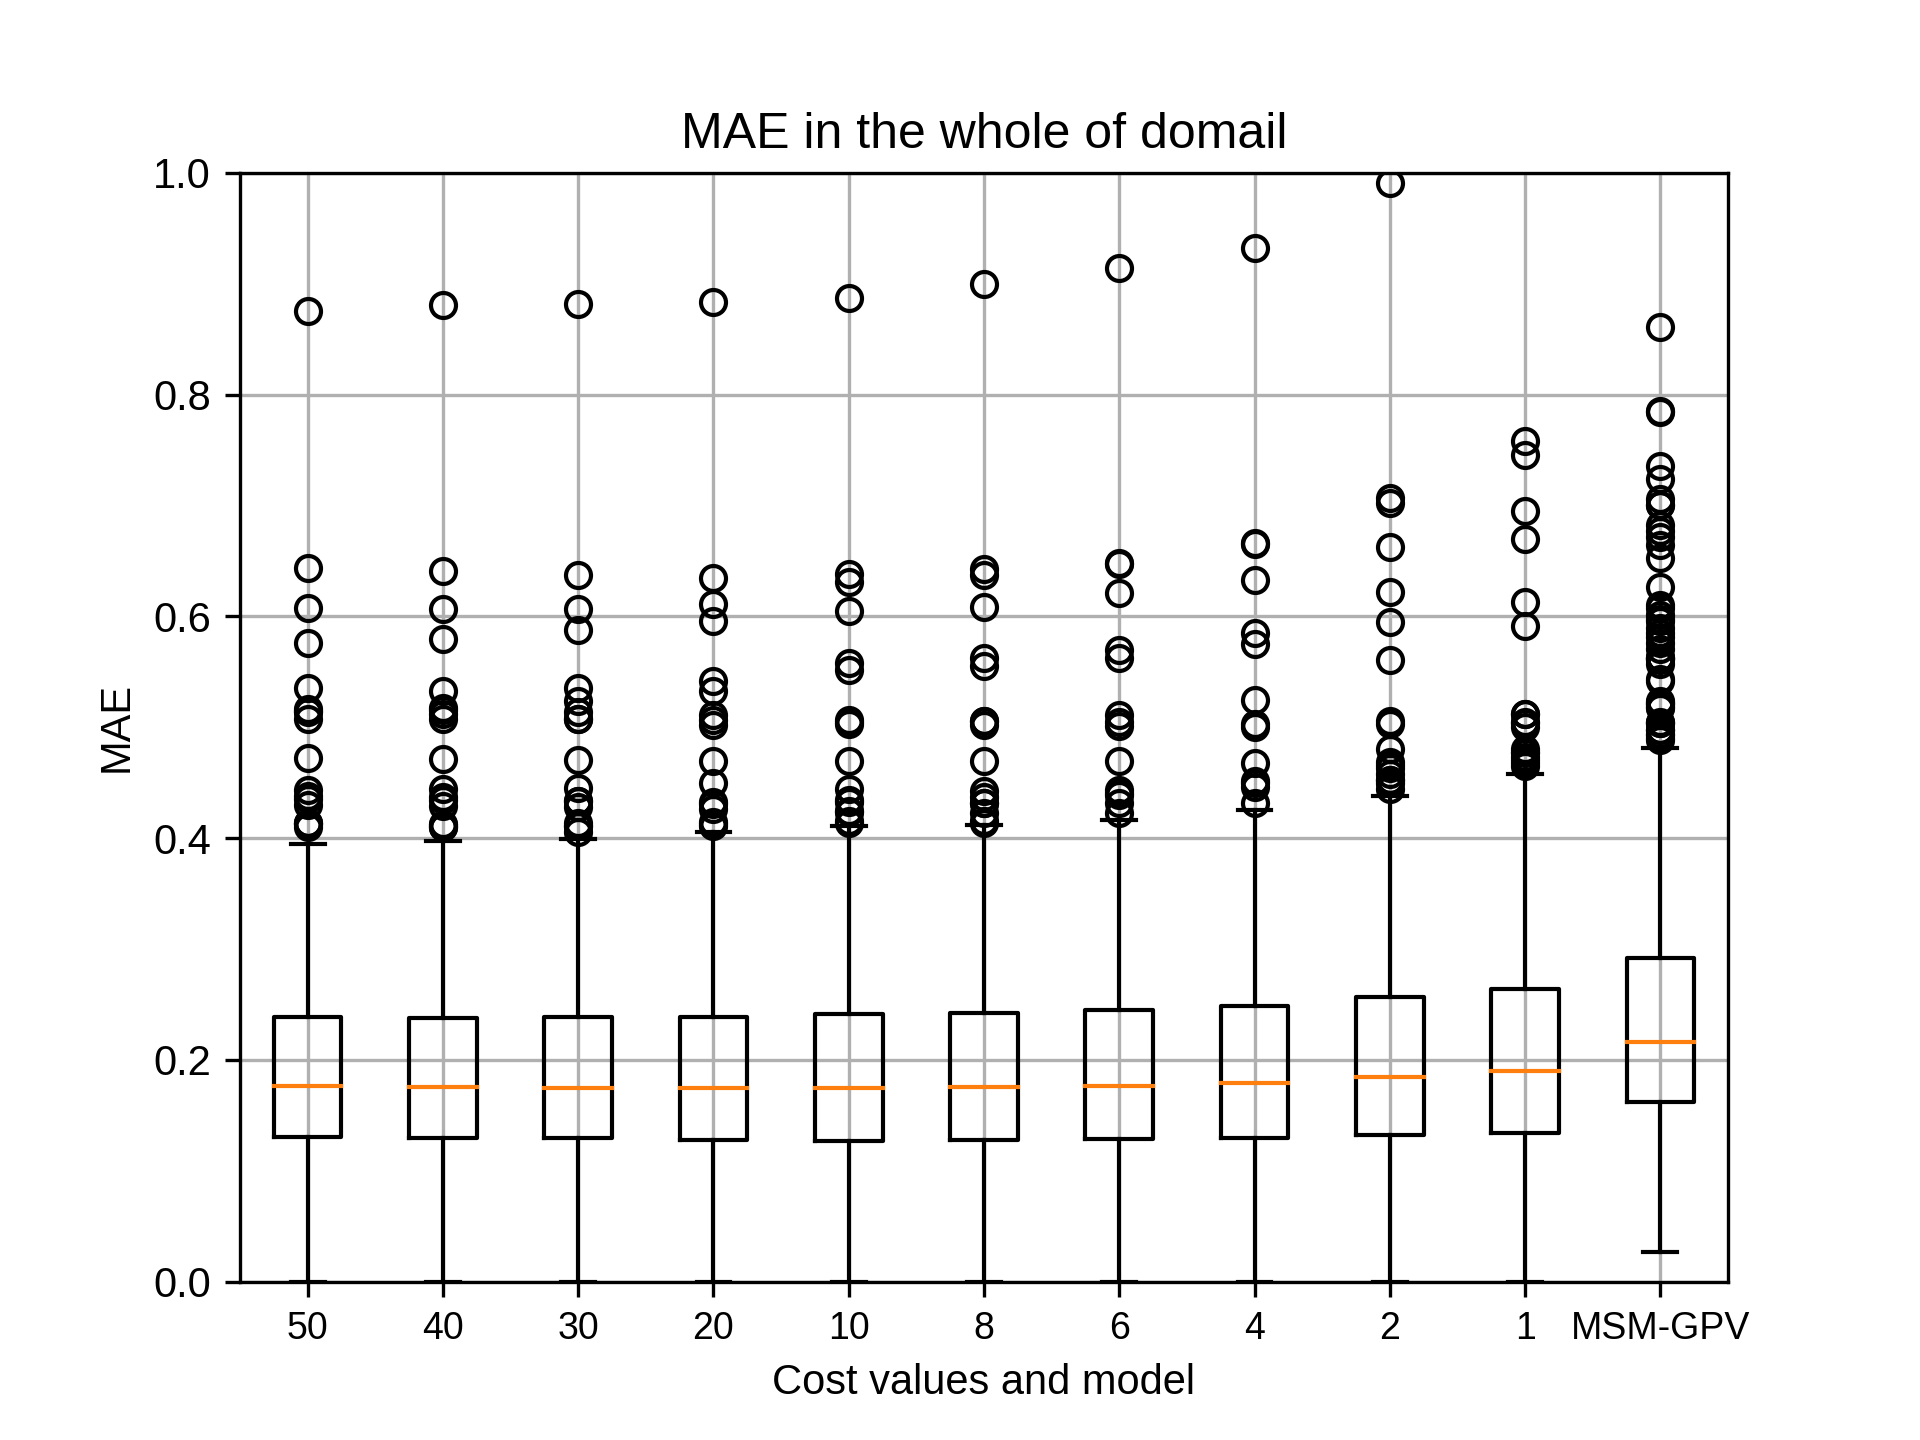
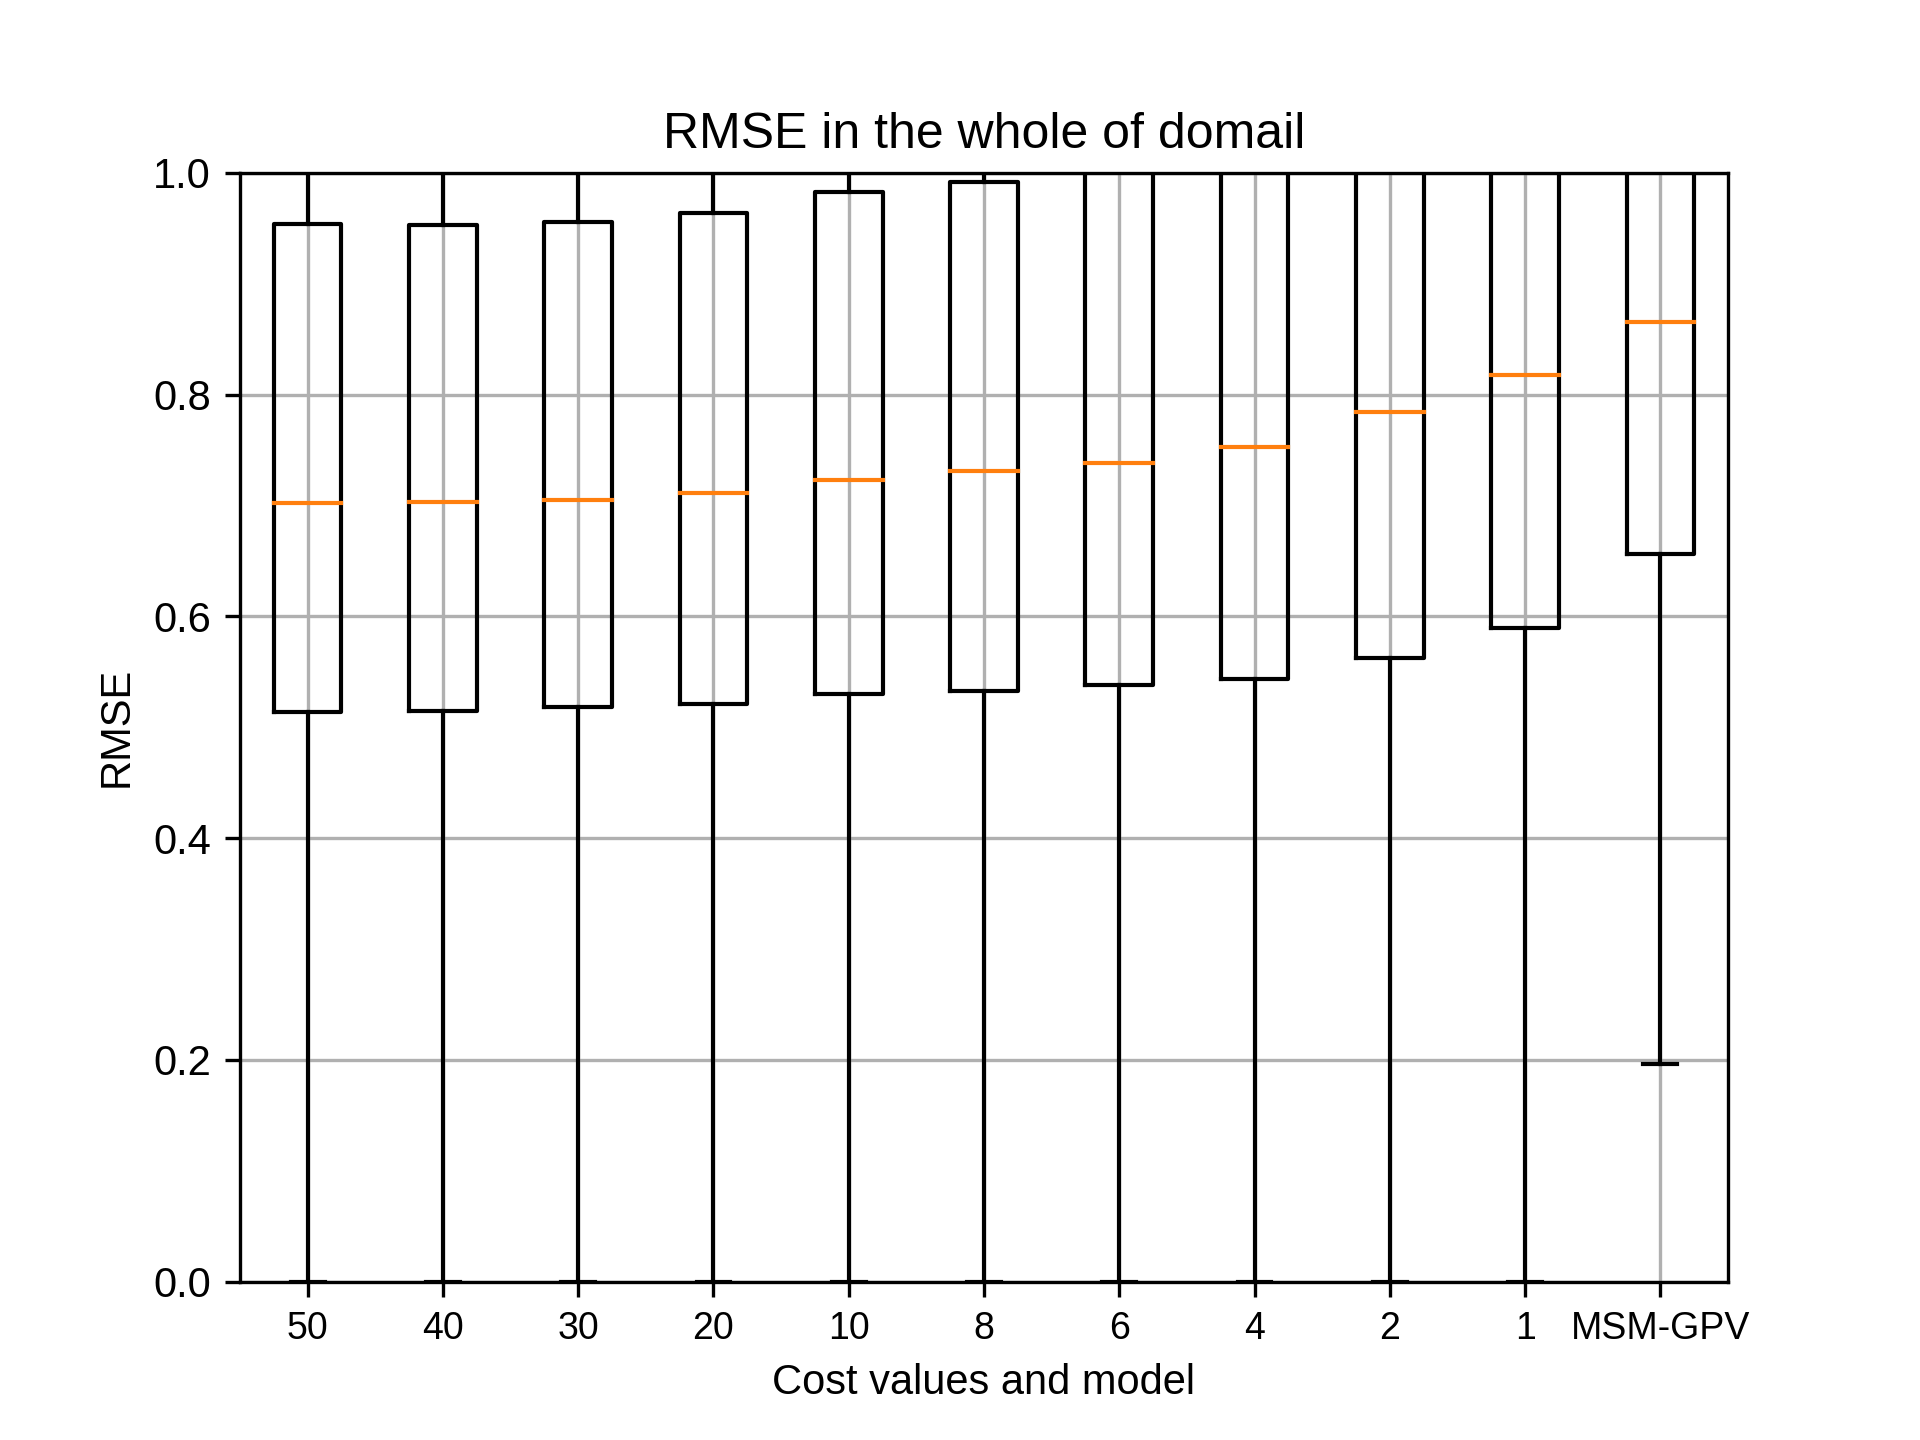
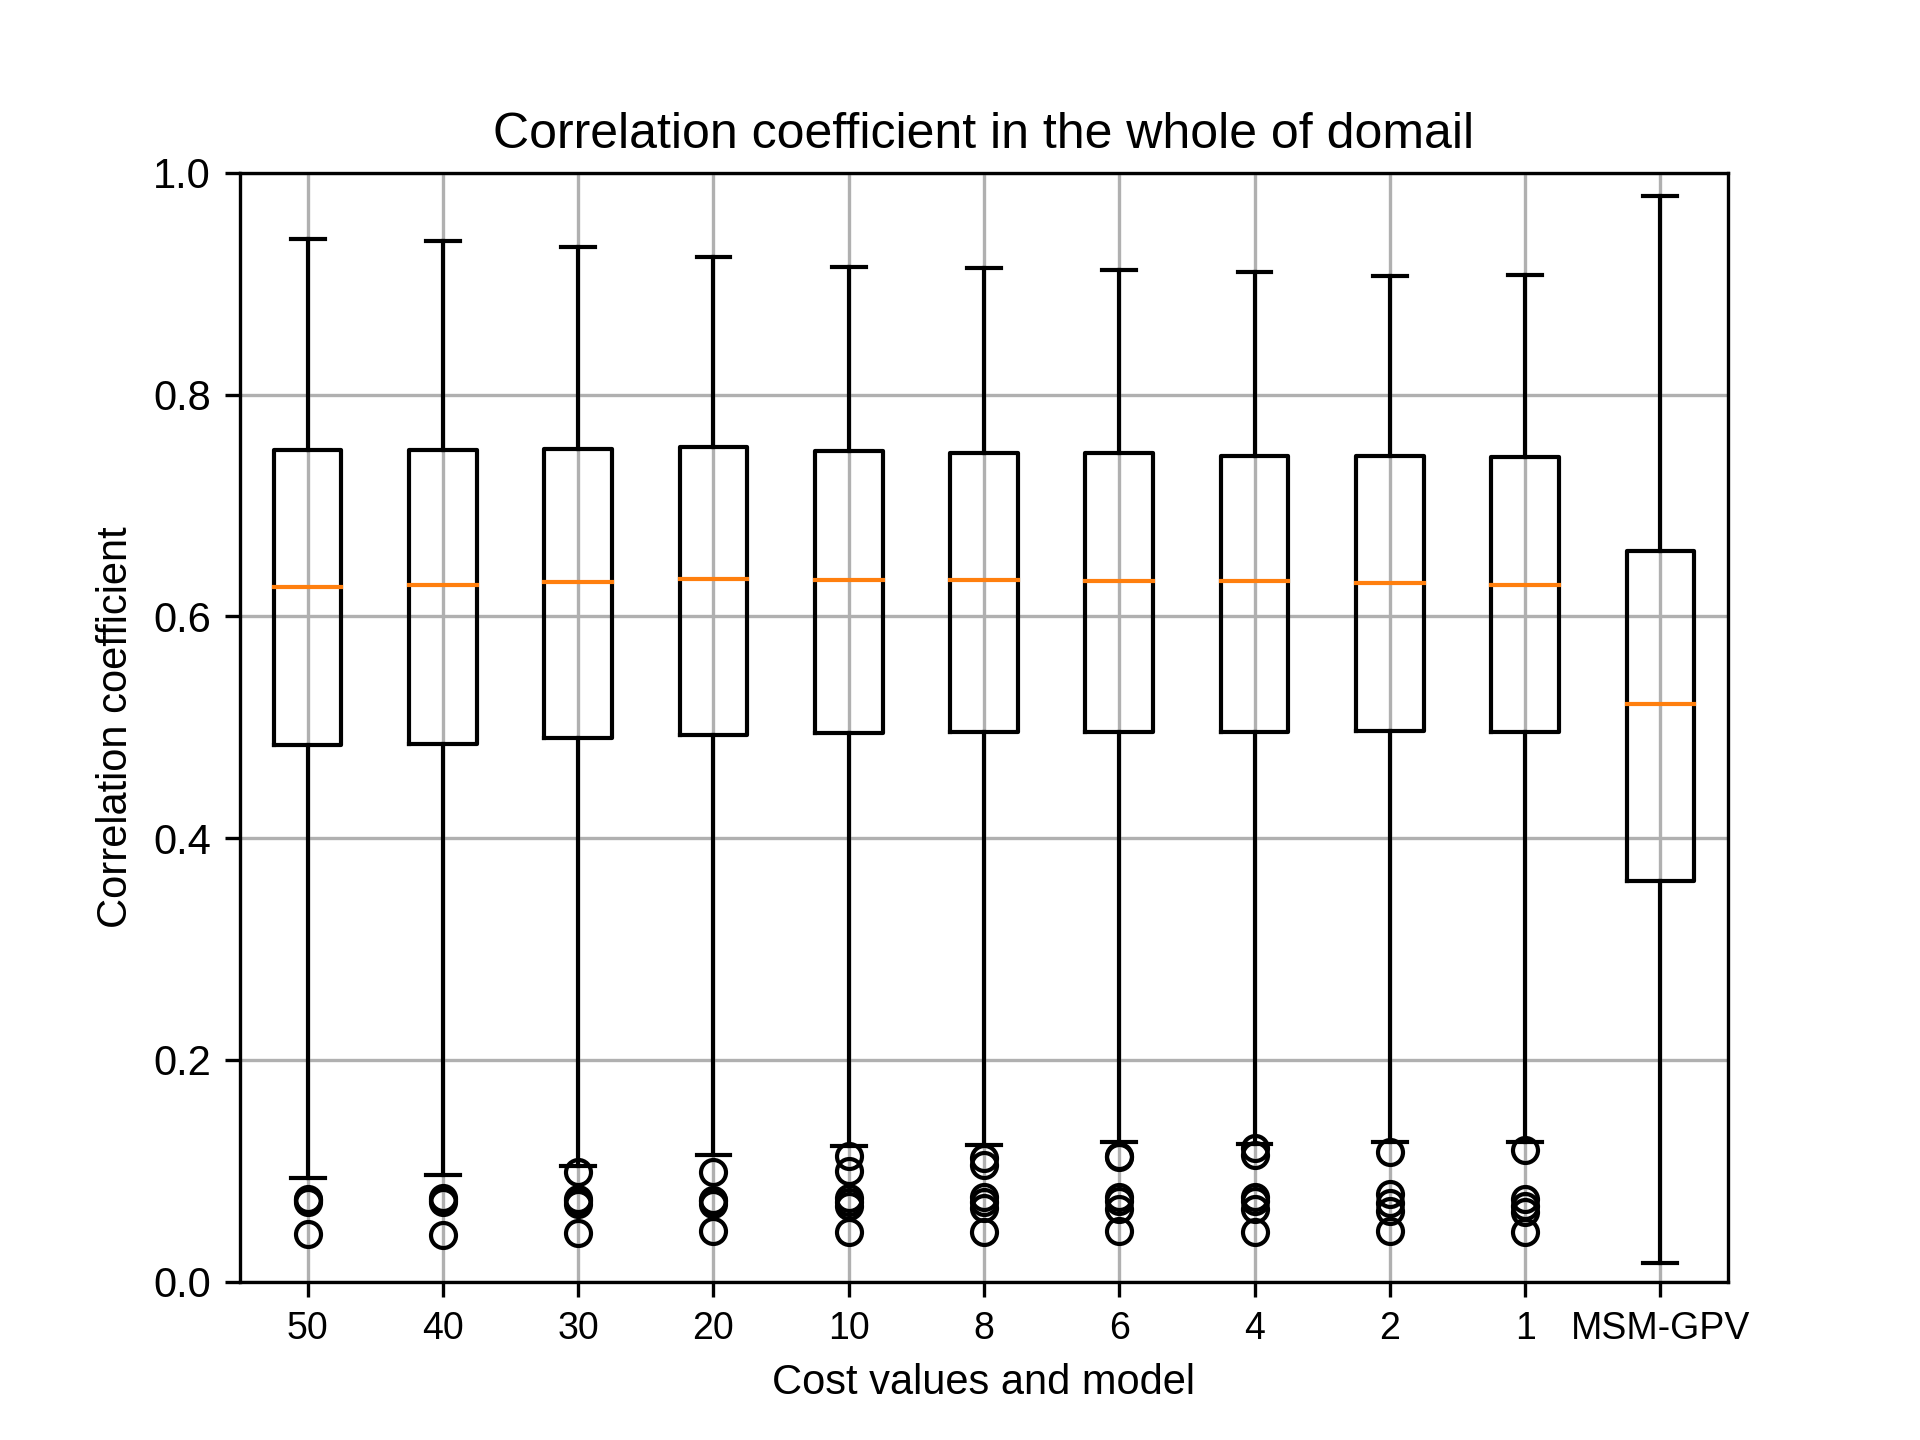
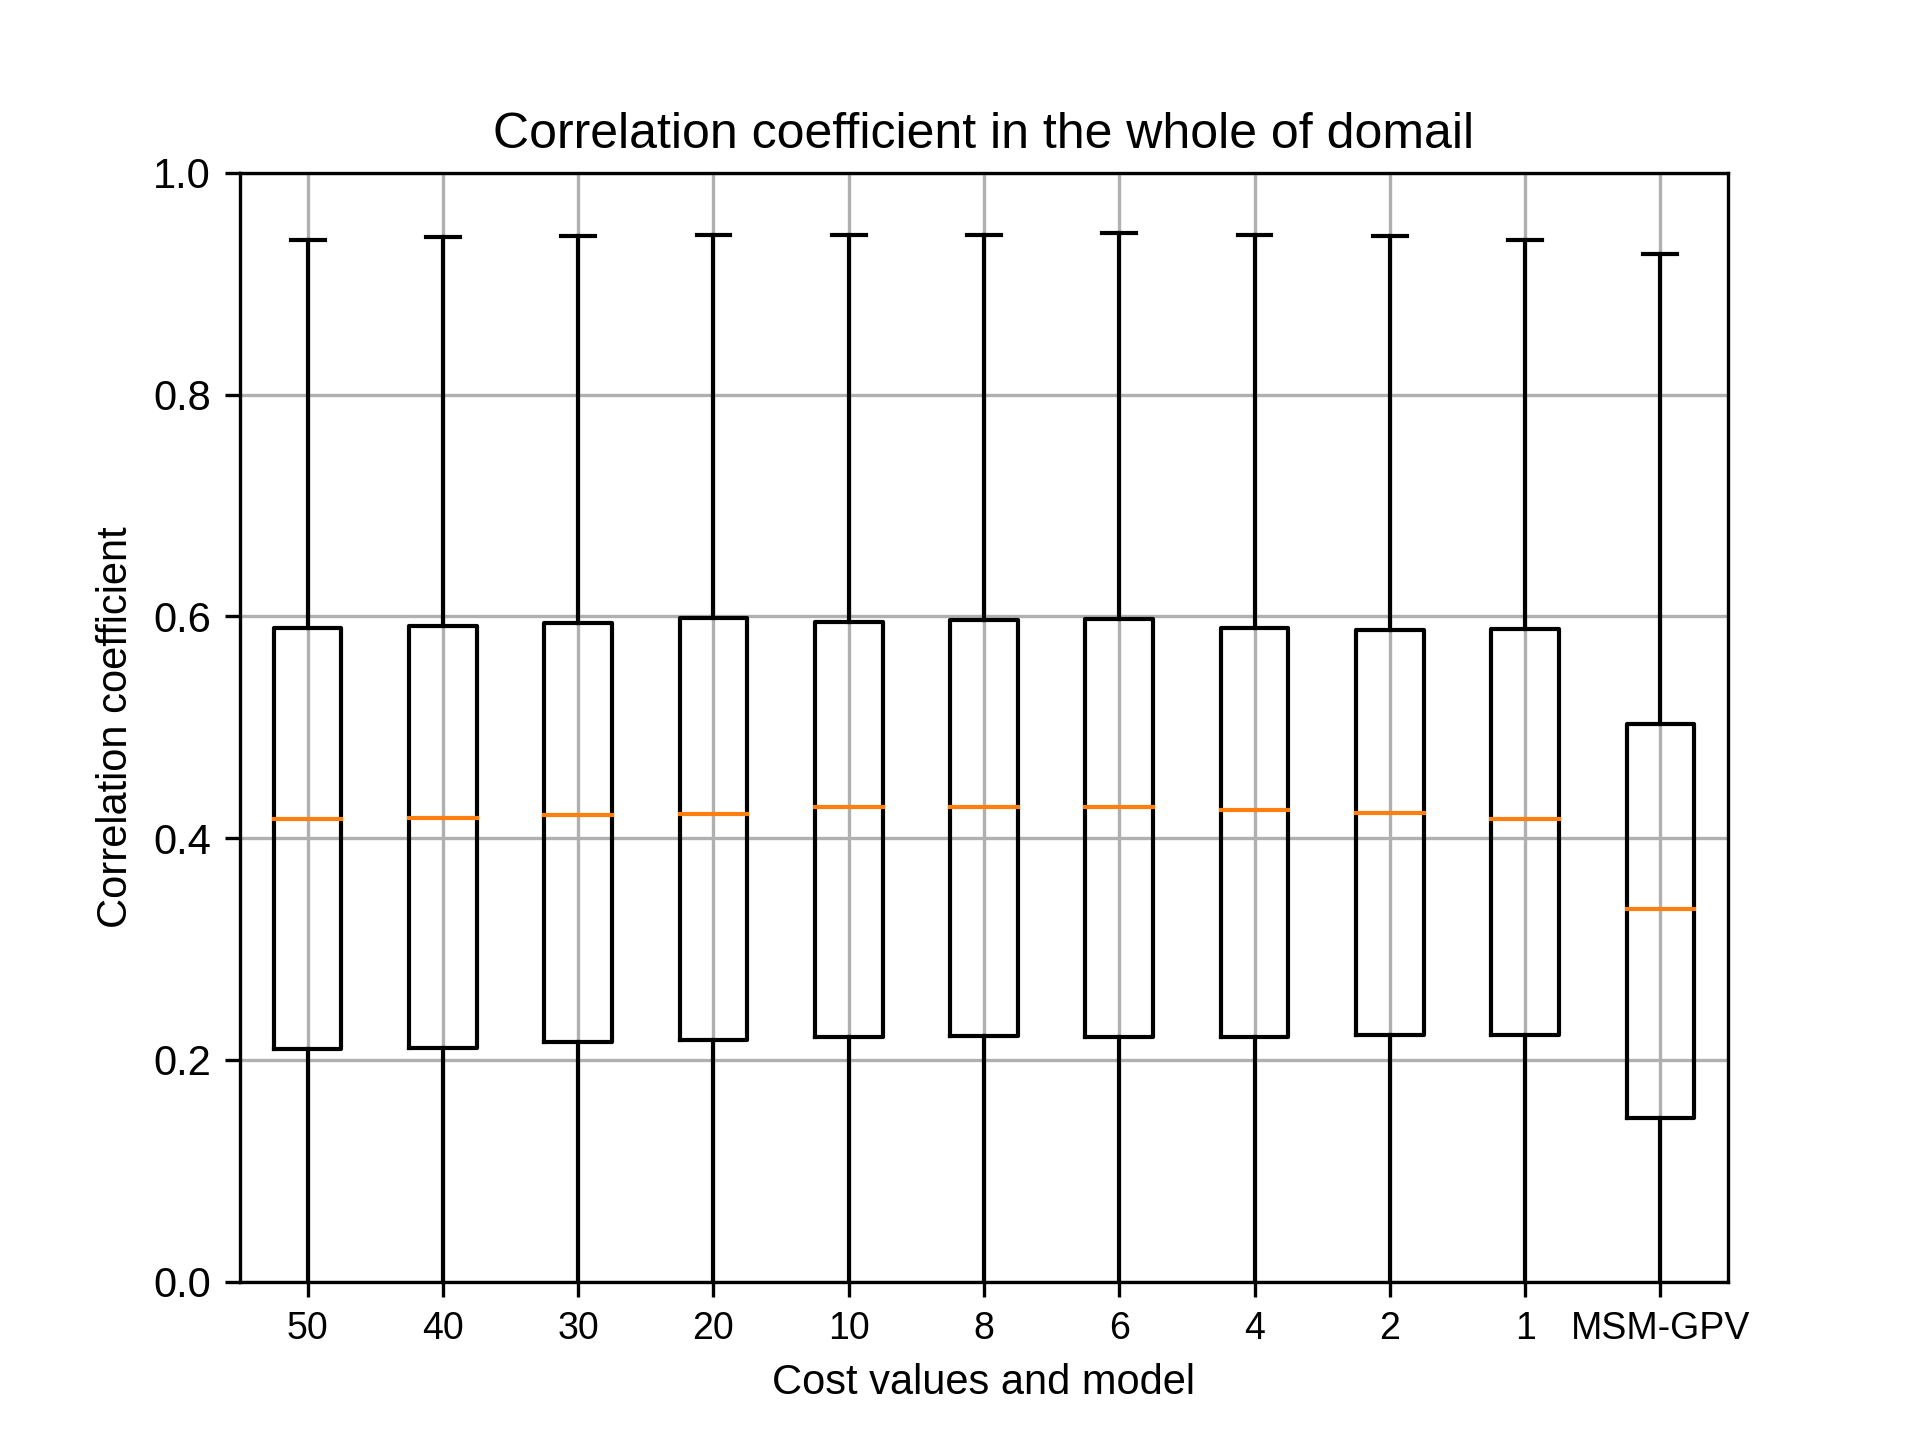
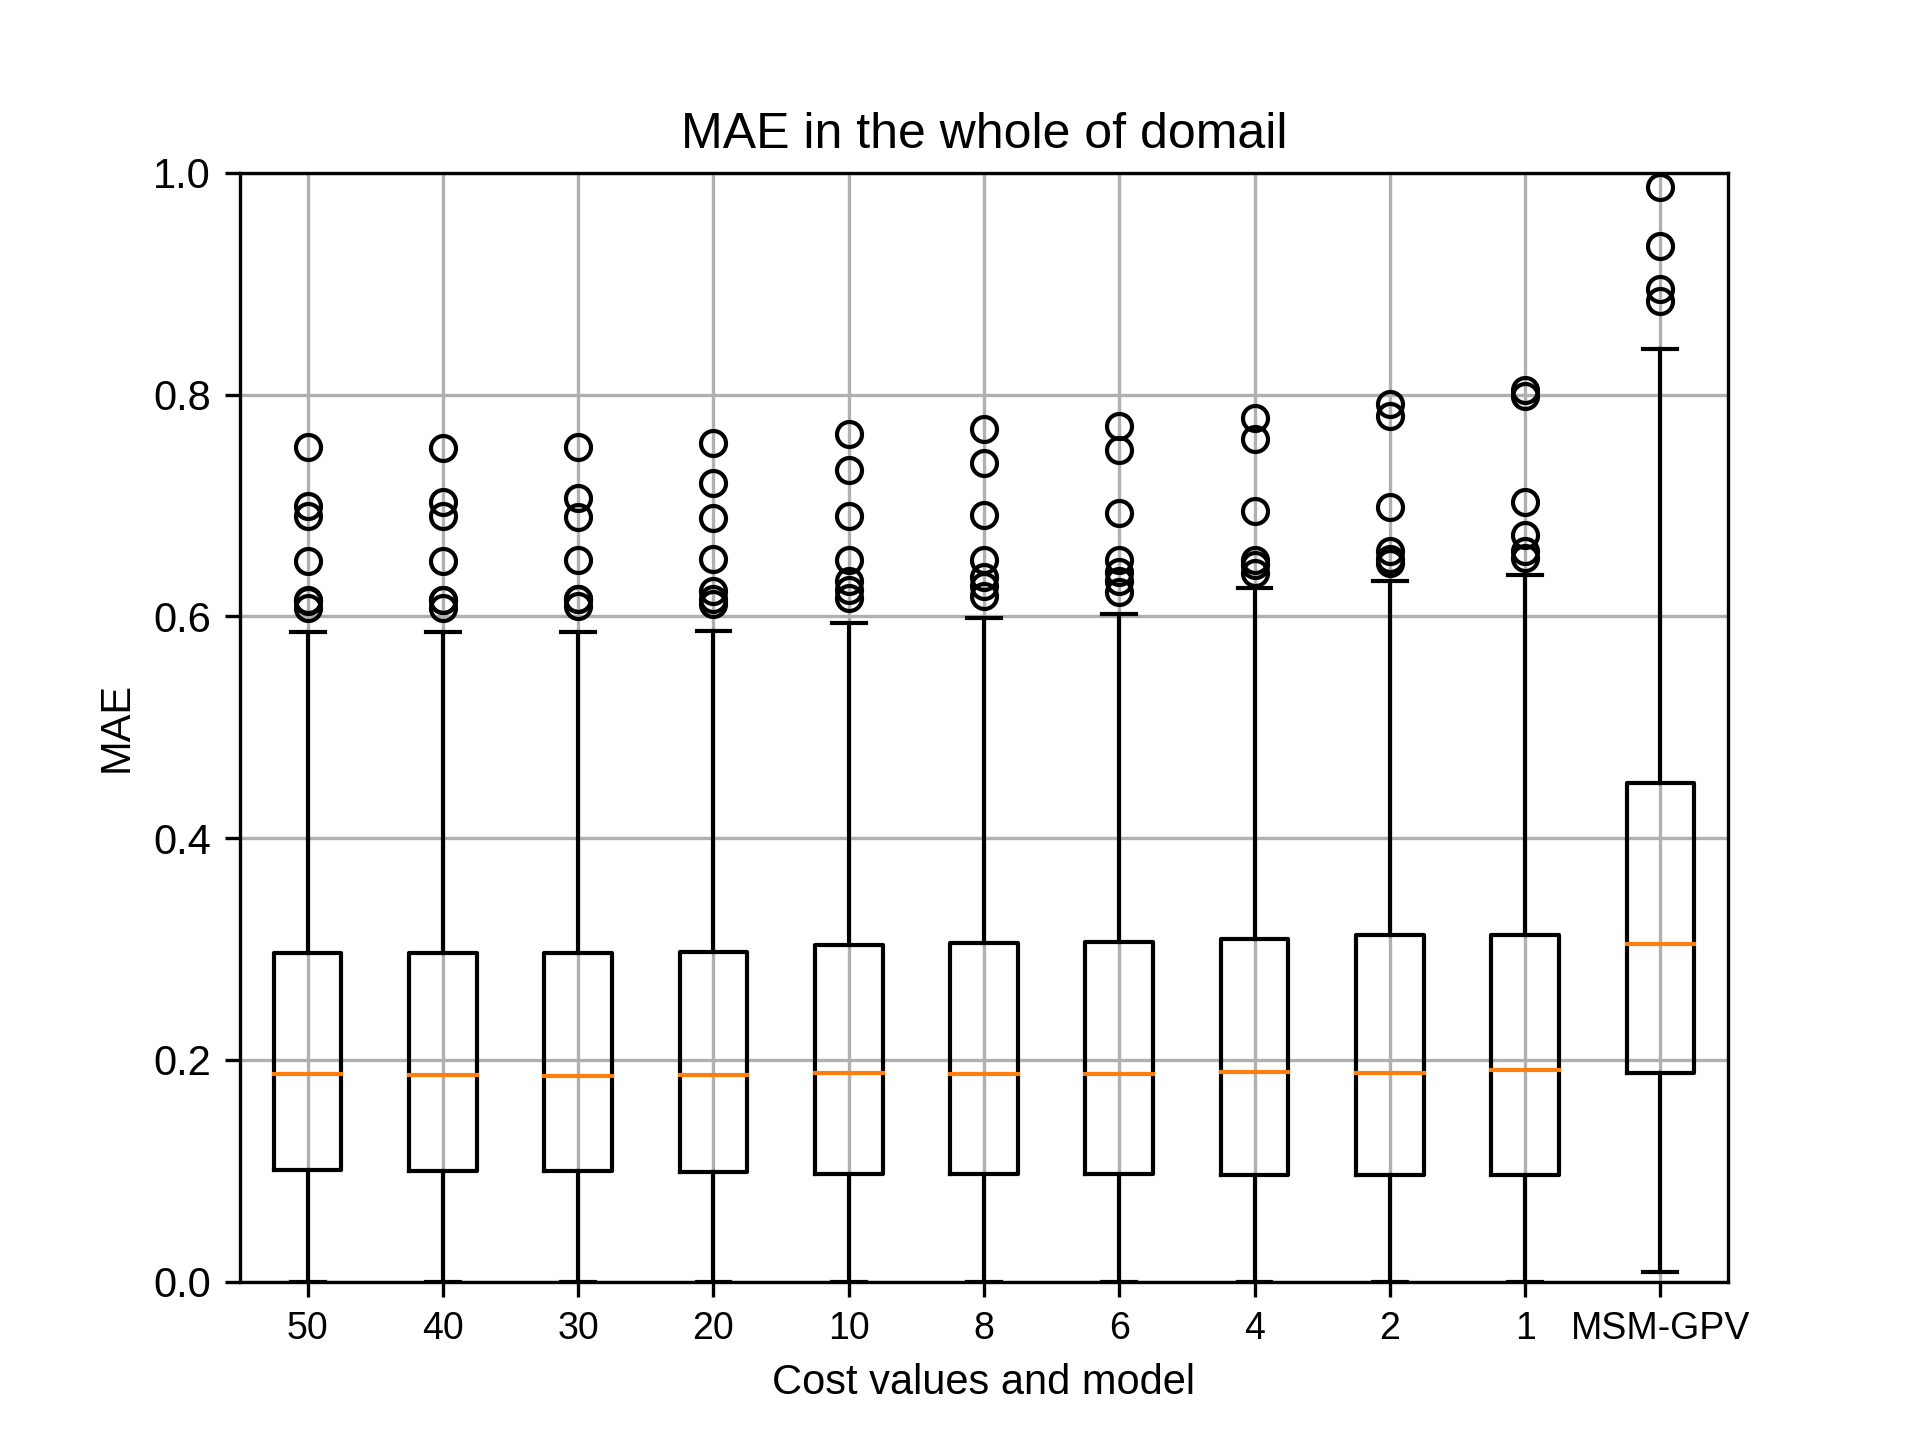
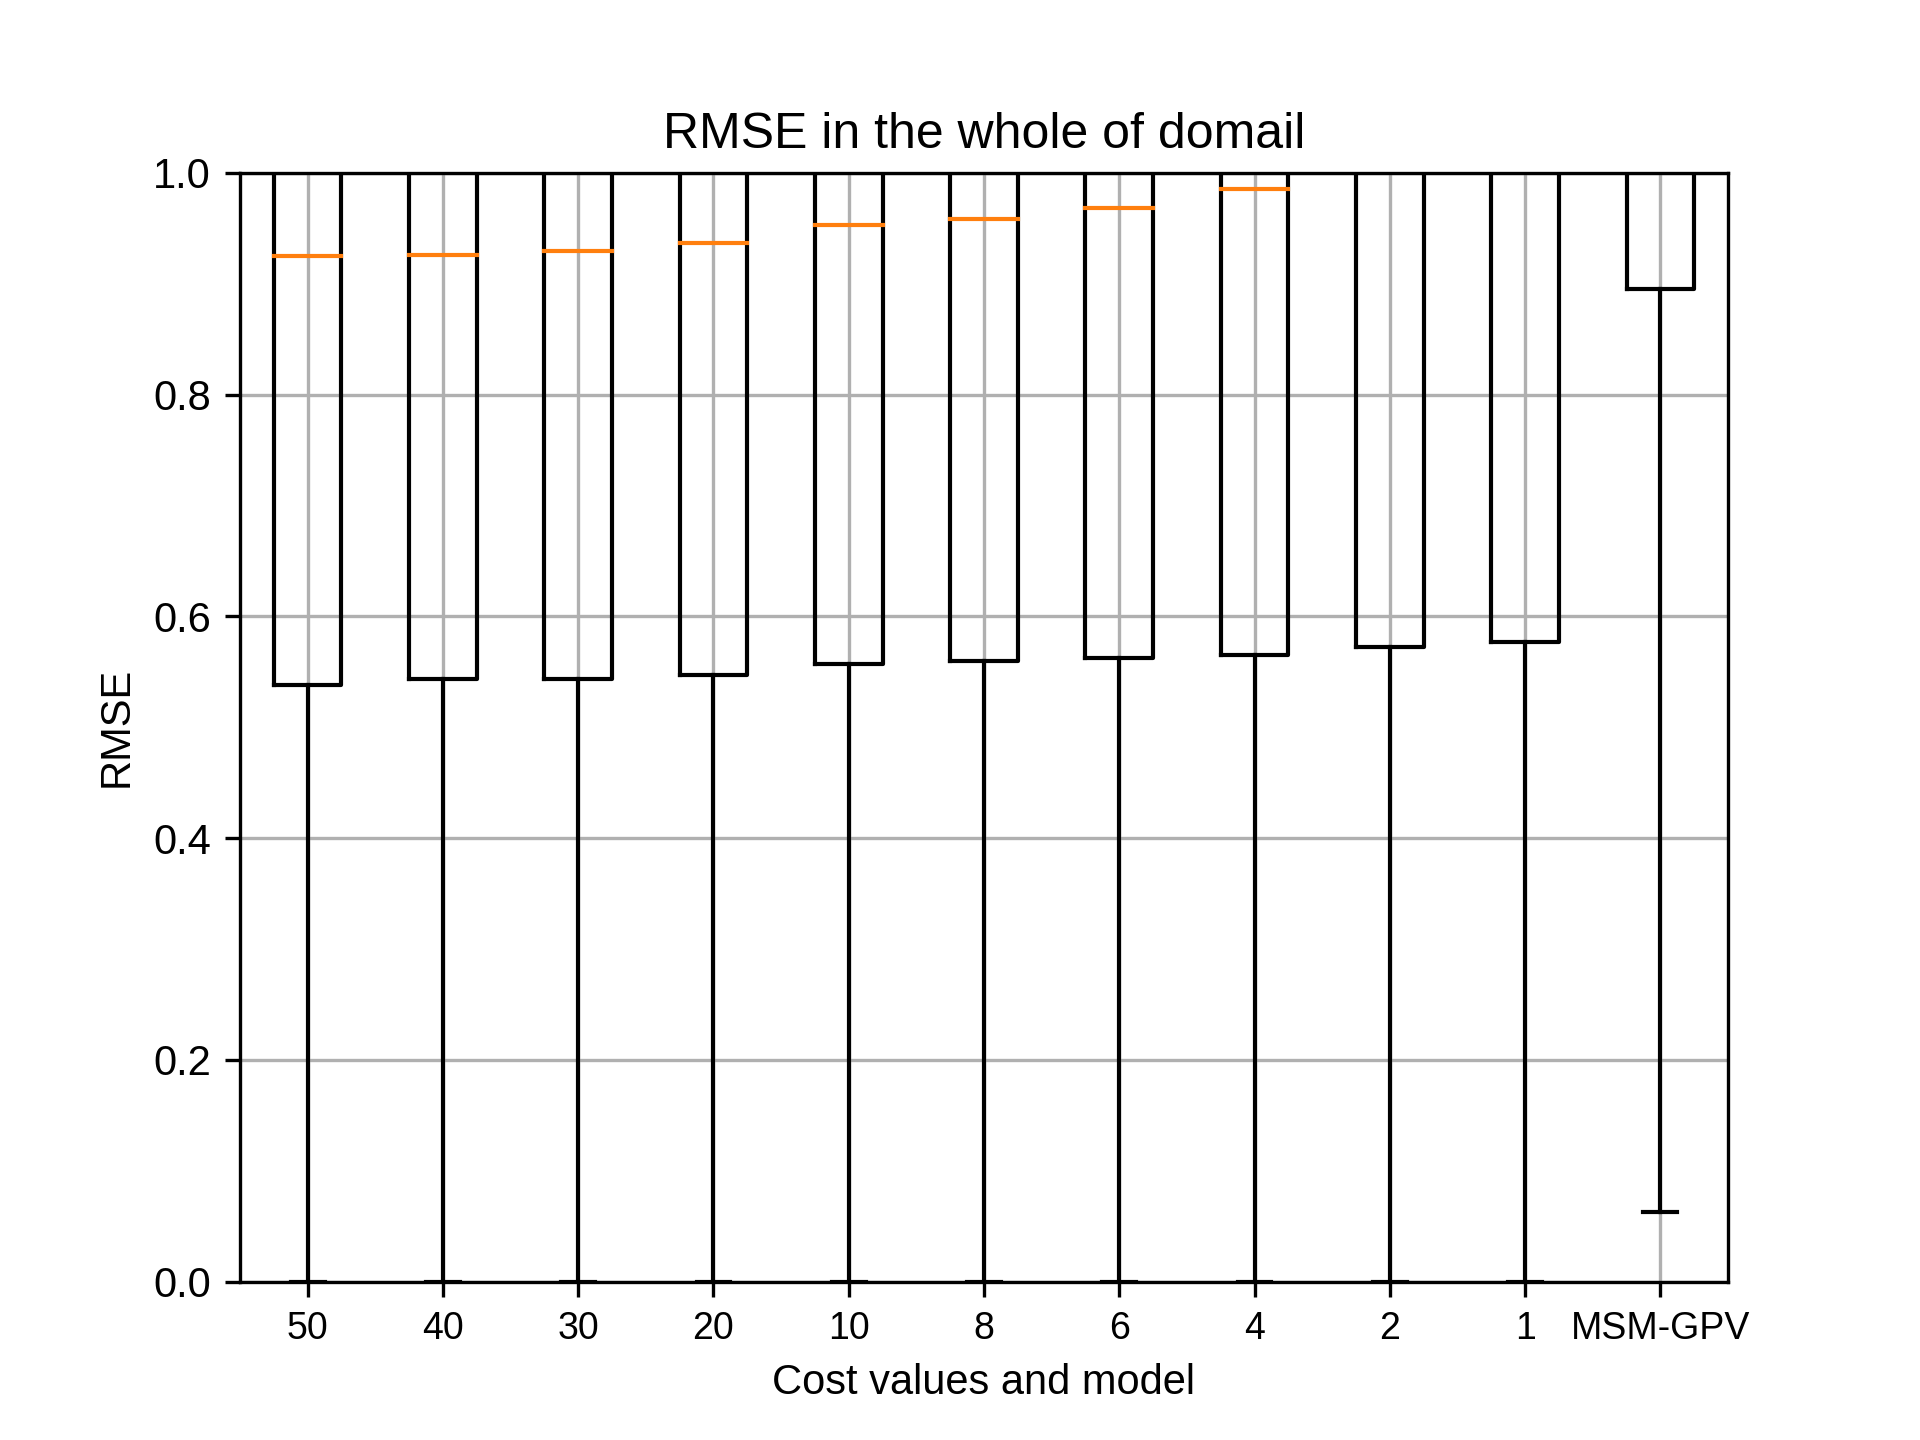
コストは、どのパラメータも大きな差はございませんでした。
引き続き、コストの相関係数の中央値が最も大きいものを採用し、エプシロンを行います。
コストの結果は以下の通りです。(siteごとに1つずつ書き込みます)
吉兼先生
7月のsiteA~siteEのコストの結果が出ました。
コストは、どのパラメータも大きな差はございませんでした。
引き続き、コストの相関係数の中央値が最も大きいものを採用し、エプシロンを行います。
コストの結果は以下の通りです。(siteごとに1つずつ書き込みます)
kobayashi_yusukeFriday, September 11th, 2020 at 6:06:43 PM GMT+09:00
@takao-y
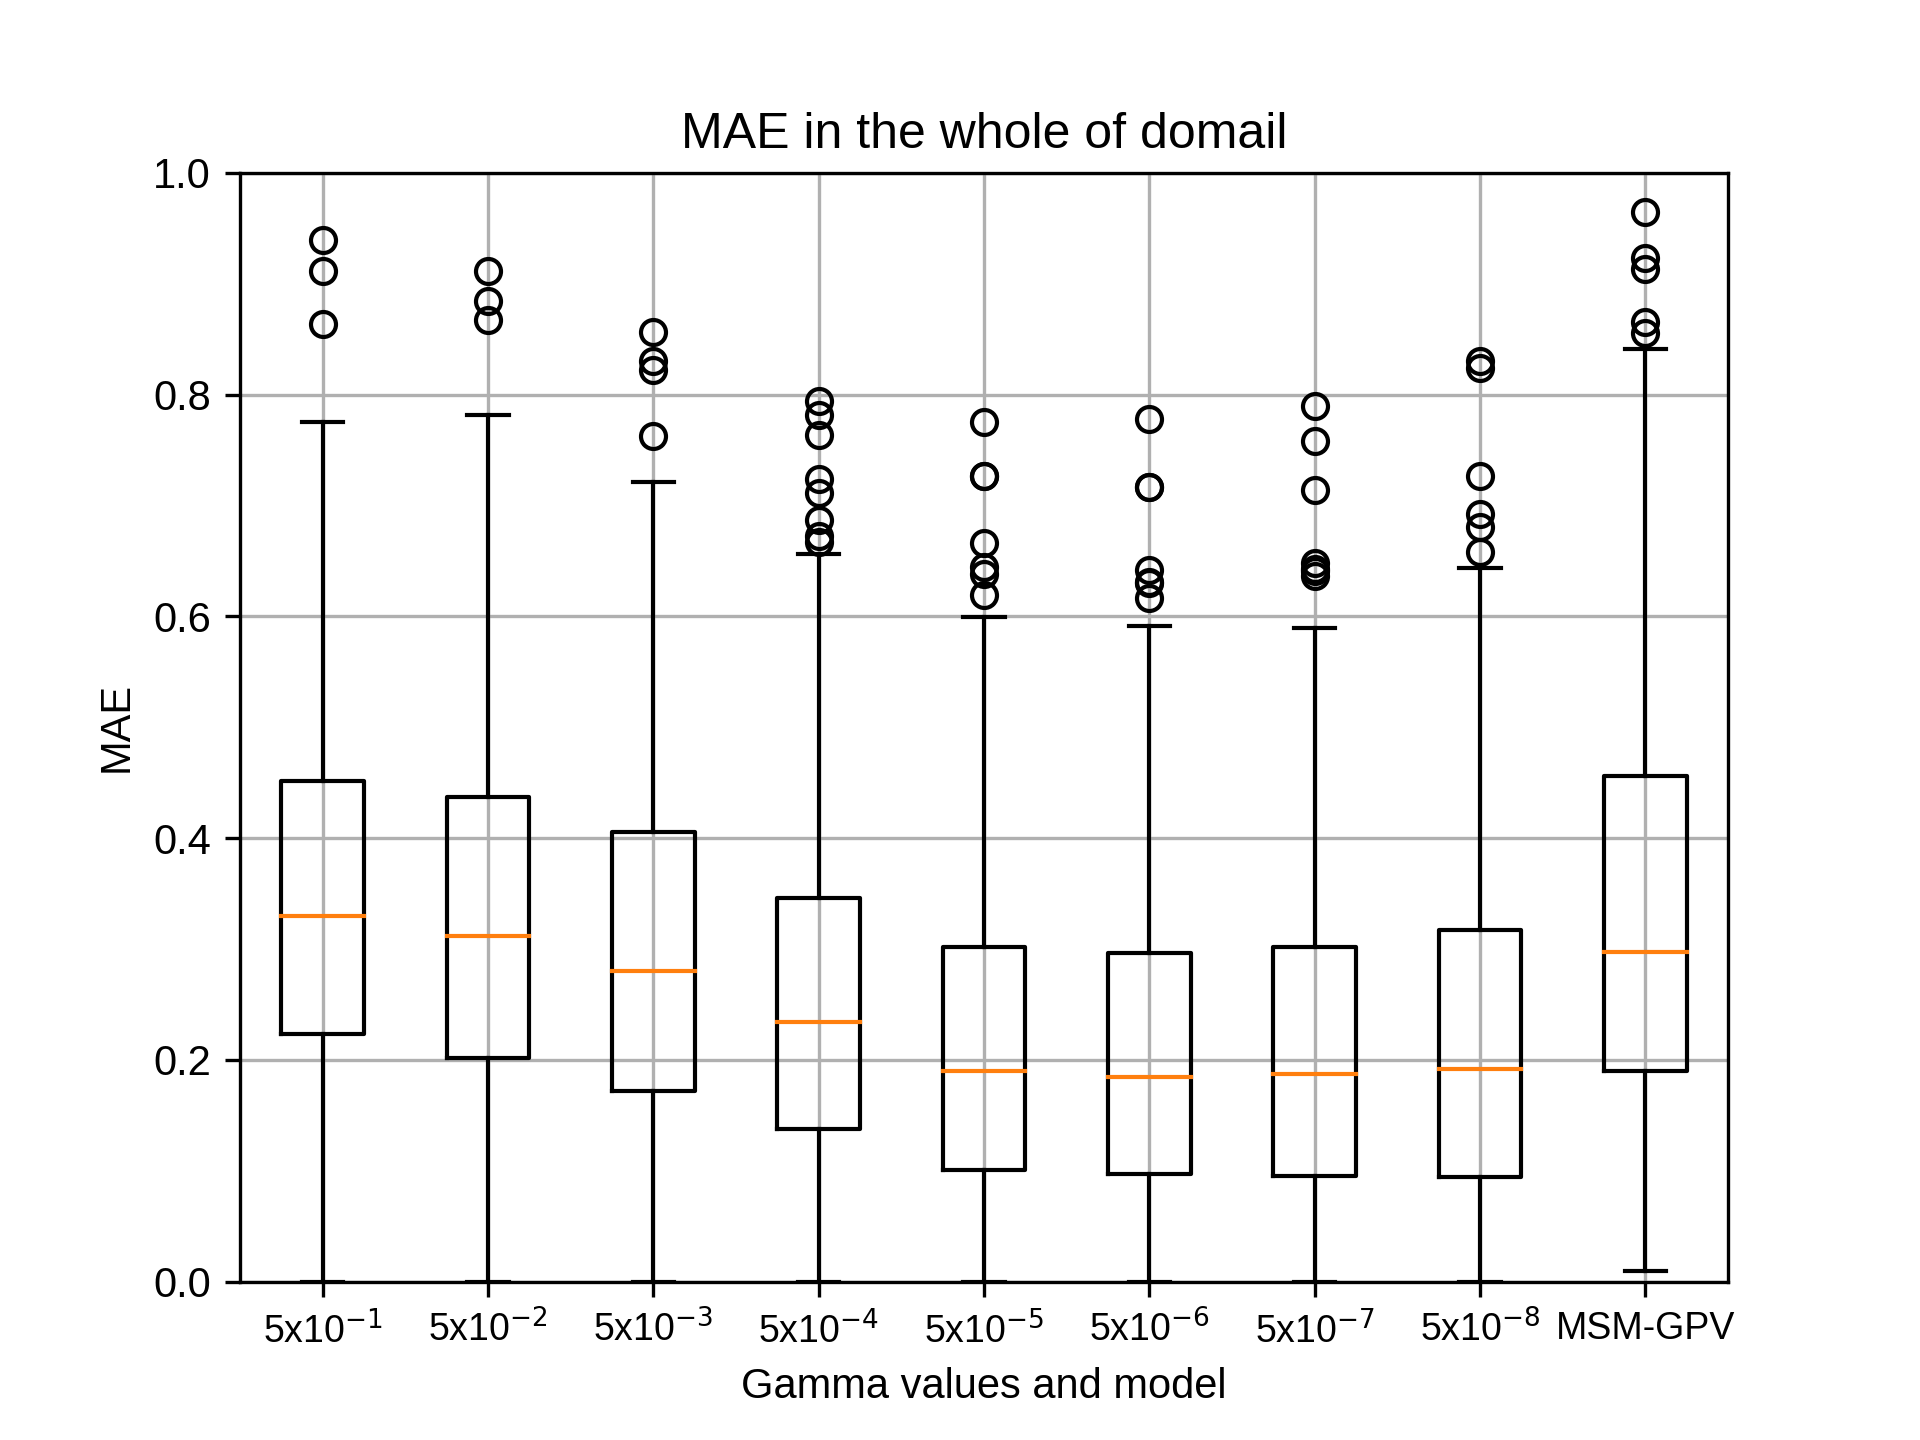
吉兼先生
7月のsiteAのコストのグラフは添付のとおりです。
ガンマのパラメータは5x10の-7乗です。
この結果、コストは8を採用して、エプシロンを計算します。
吉兼先生
7月のsiteAのコストのグラフは添付のとおりです。
ガンマのパラメータは5x10の-7乗です。
この結果、コストは8を採用して、エプシロンを計算します。
kobayashi_yusukeFriday, September 11th, 2020 at 6:07:55 PM GMT+09:00

@takao-y
吉兼先生
7月のsiteBのコストのグラフは添付のとおりです。
ガンマのパラメータは5x10の-6乗です。
この結果、コストは4を採用して、エプシロンを計算します。
吉兼先生
7月のsiteBのコストのグラフは添付のとおりです。
ガンマのパラメータは5x10の-6乗です。
この結果、コストは4を採用して、エプシロンを計算します。
kobayashi_yusukeFriday, September 11th, 2020 at 6:09:05 PM GMT+09:00
@takao-y
吉兼先生
7月のsiteCのコストのグラフは添付のとおりです。
ガンマのパラメータは5x10の-7乗です。
この結果、コストは4を採用して、エプシロンを計算します。
吉兼先生
7月のsiteCのコストのグラフは添付のとおりです。
ガンマのパラメータは5x10の-7乗です。
この結果、コストは4を採用して、エプシロンを計算します。
kobayashi_yusukeFriday, September 11th, 2020 at 6:10:36 PM GMT+09:00
@takao-y
吉兼先生
7月のsiteDのコストのグラフは添付のとおりです。
ガンマのパラメータは5x10の-8乗です。
この結果、コストは10を採用して、エプシロンを計算します。
吉兼先生
7月のsiteDのコストのグラフは添付のとおりです。
ガンマのパラメータは5x10の-8乗です。
この結果、コストは10を採用して、エプシロンを計算します。
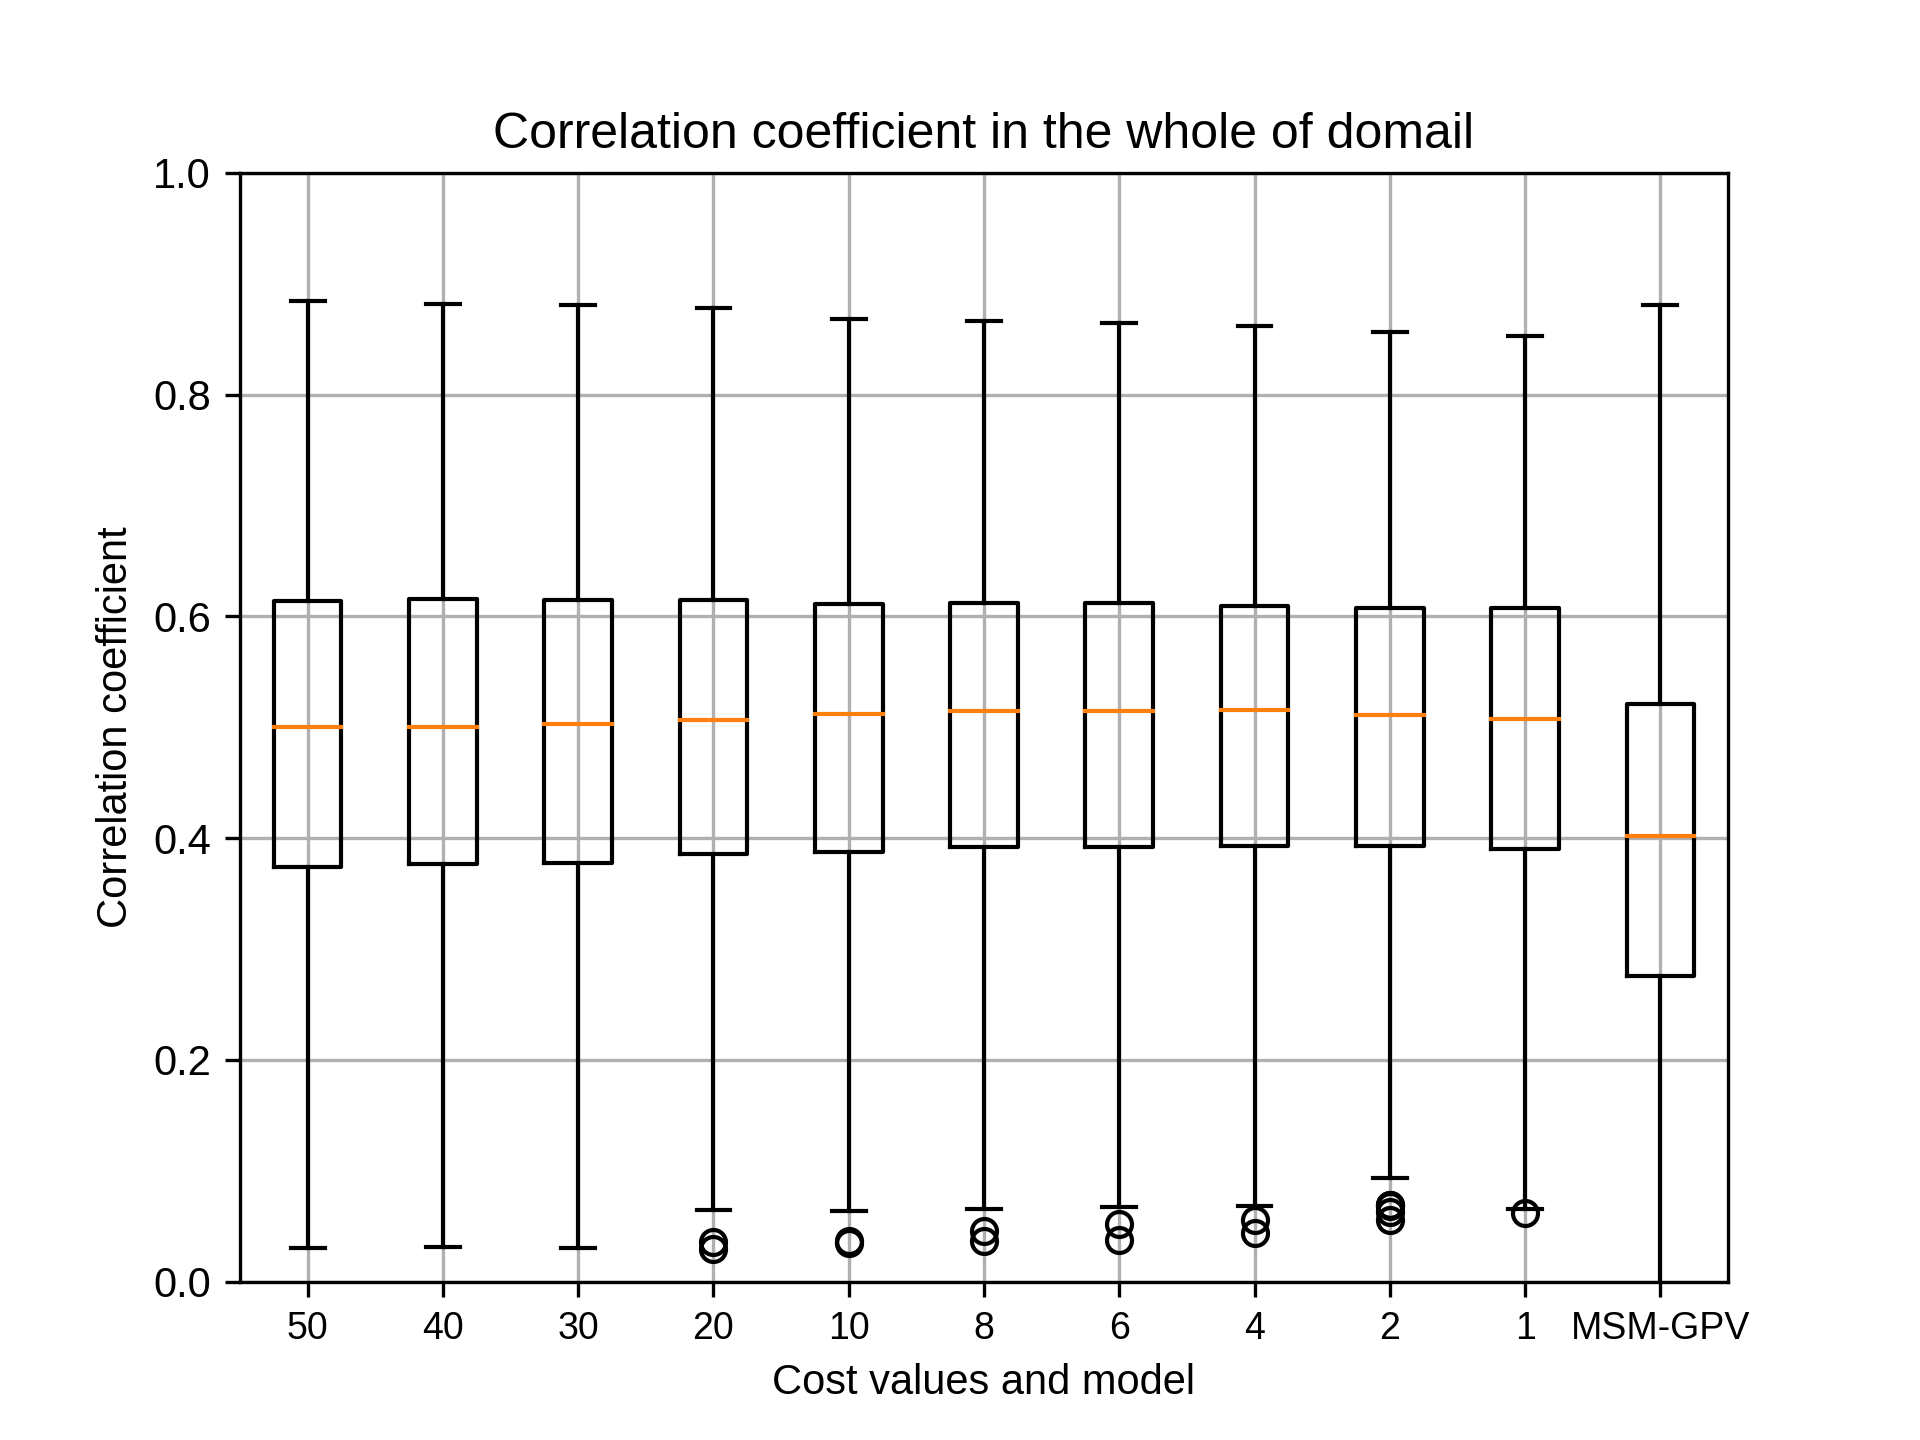
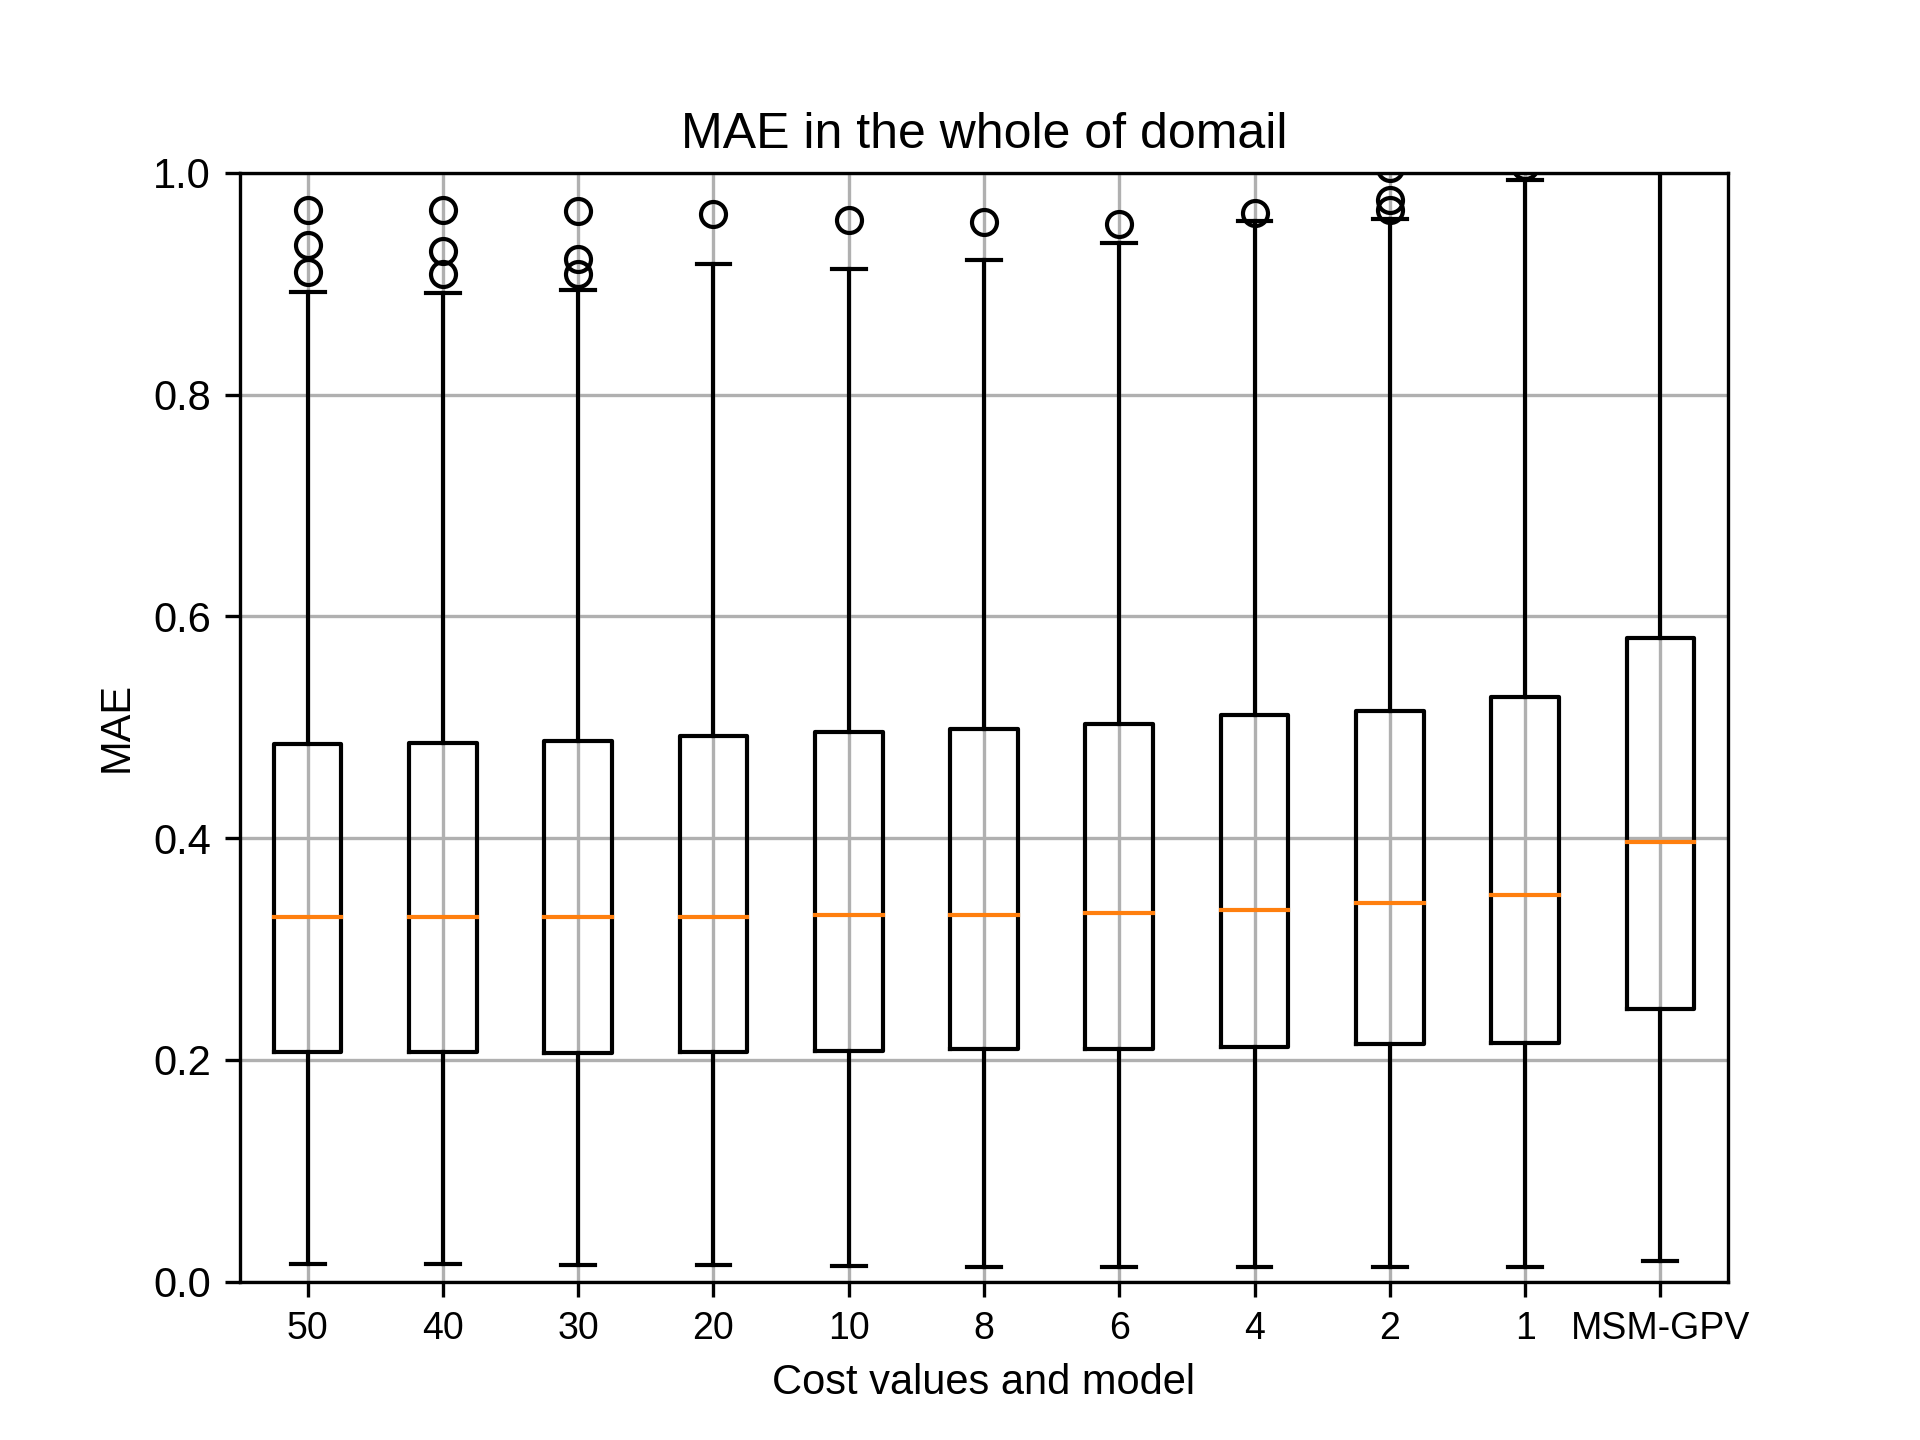
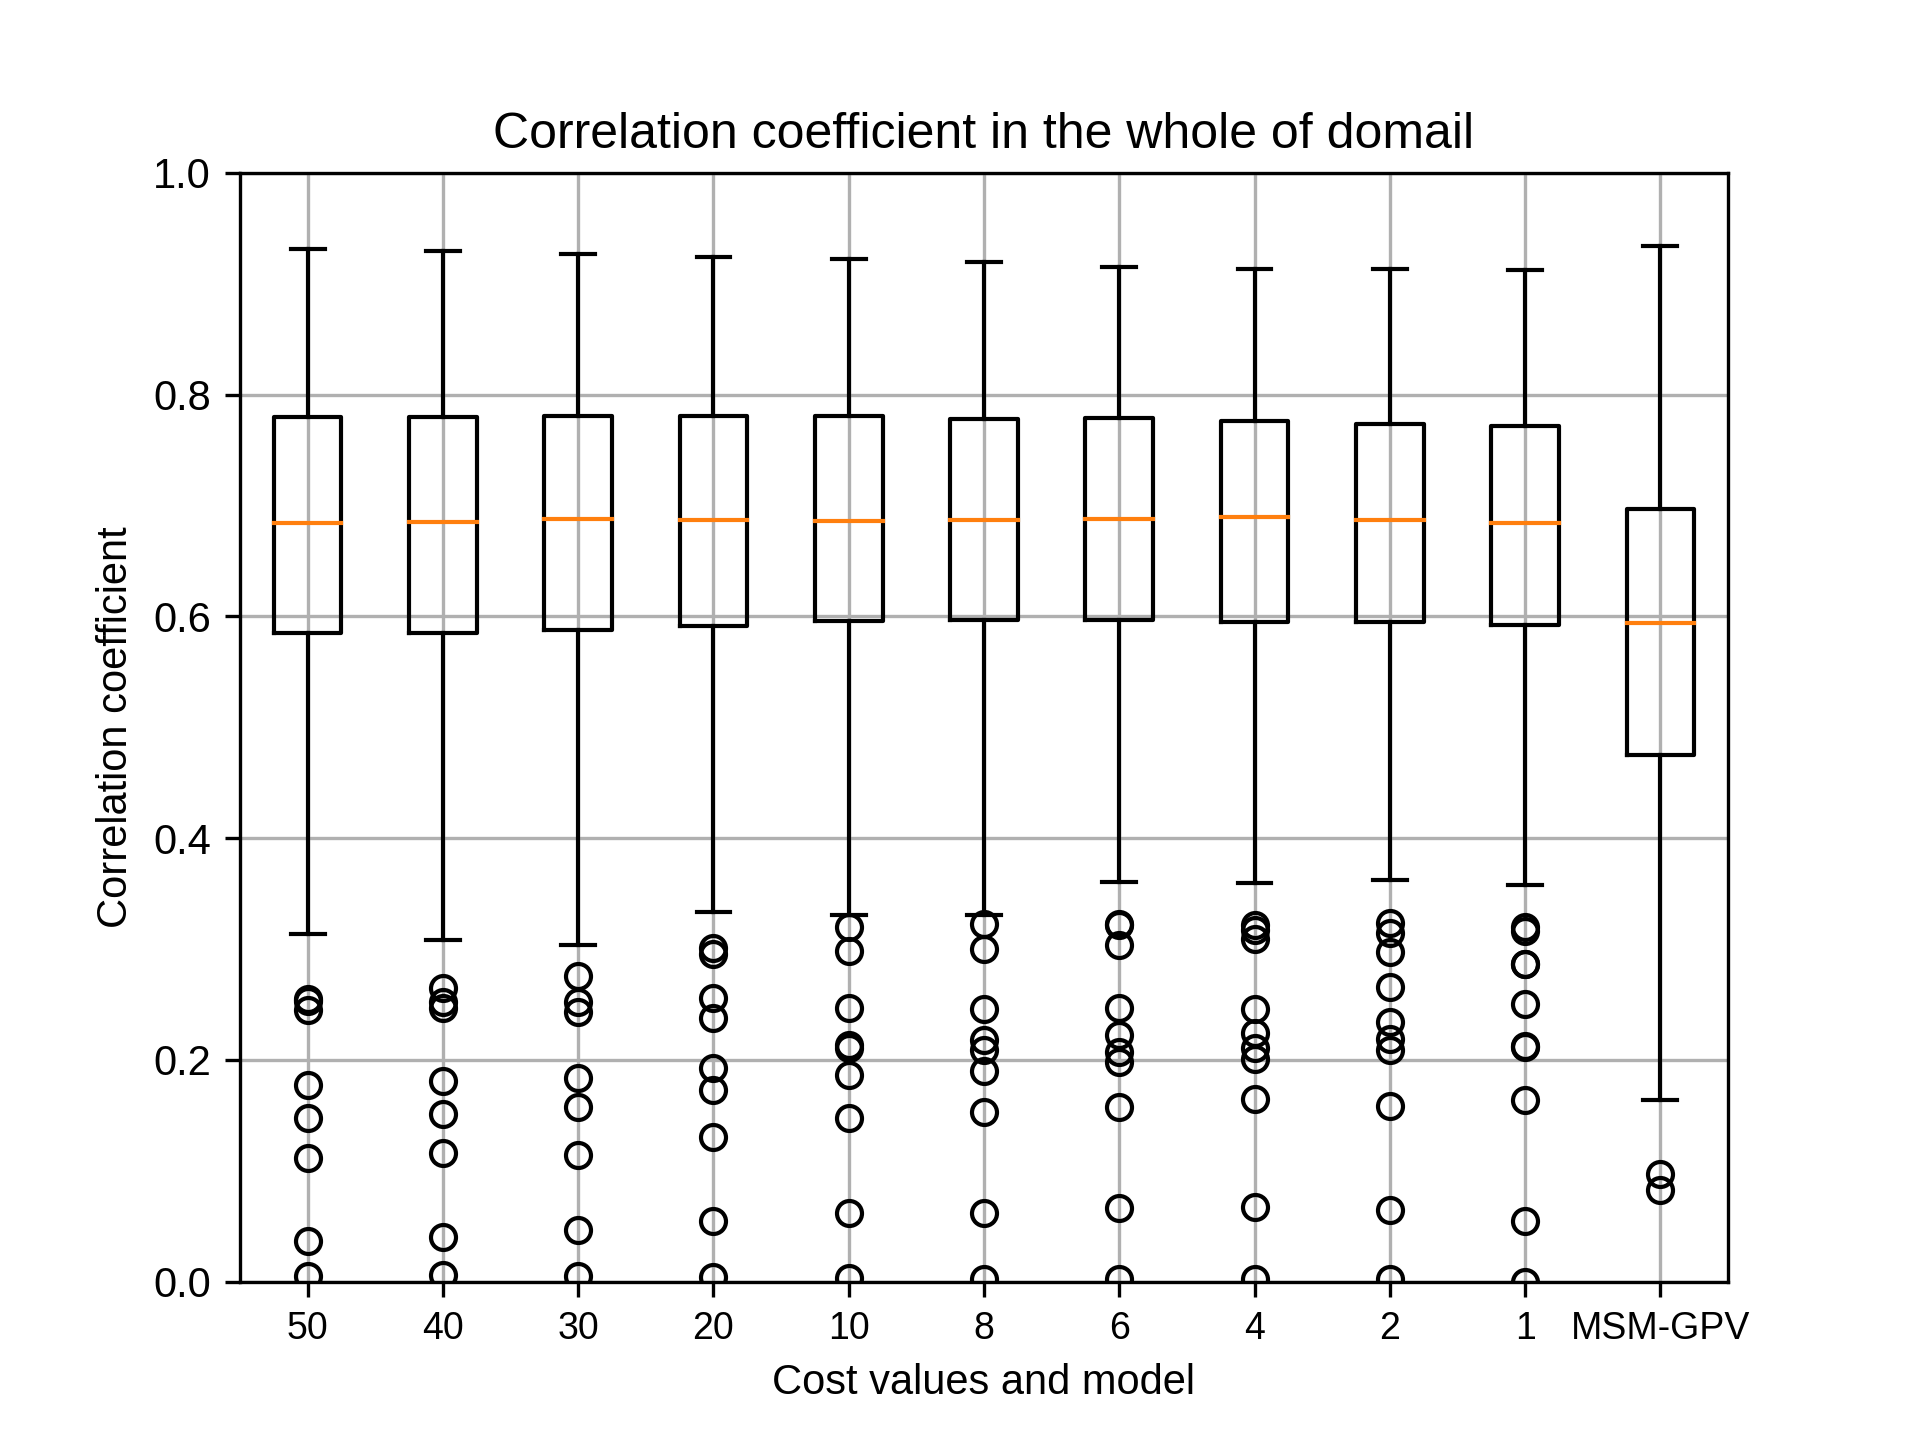
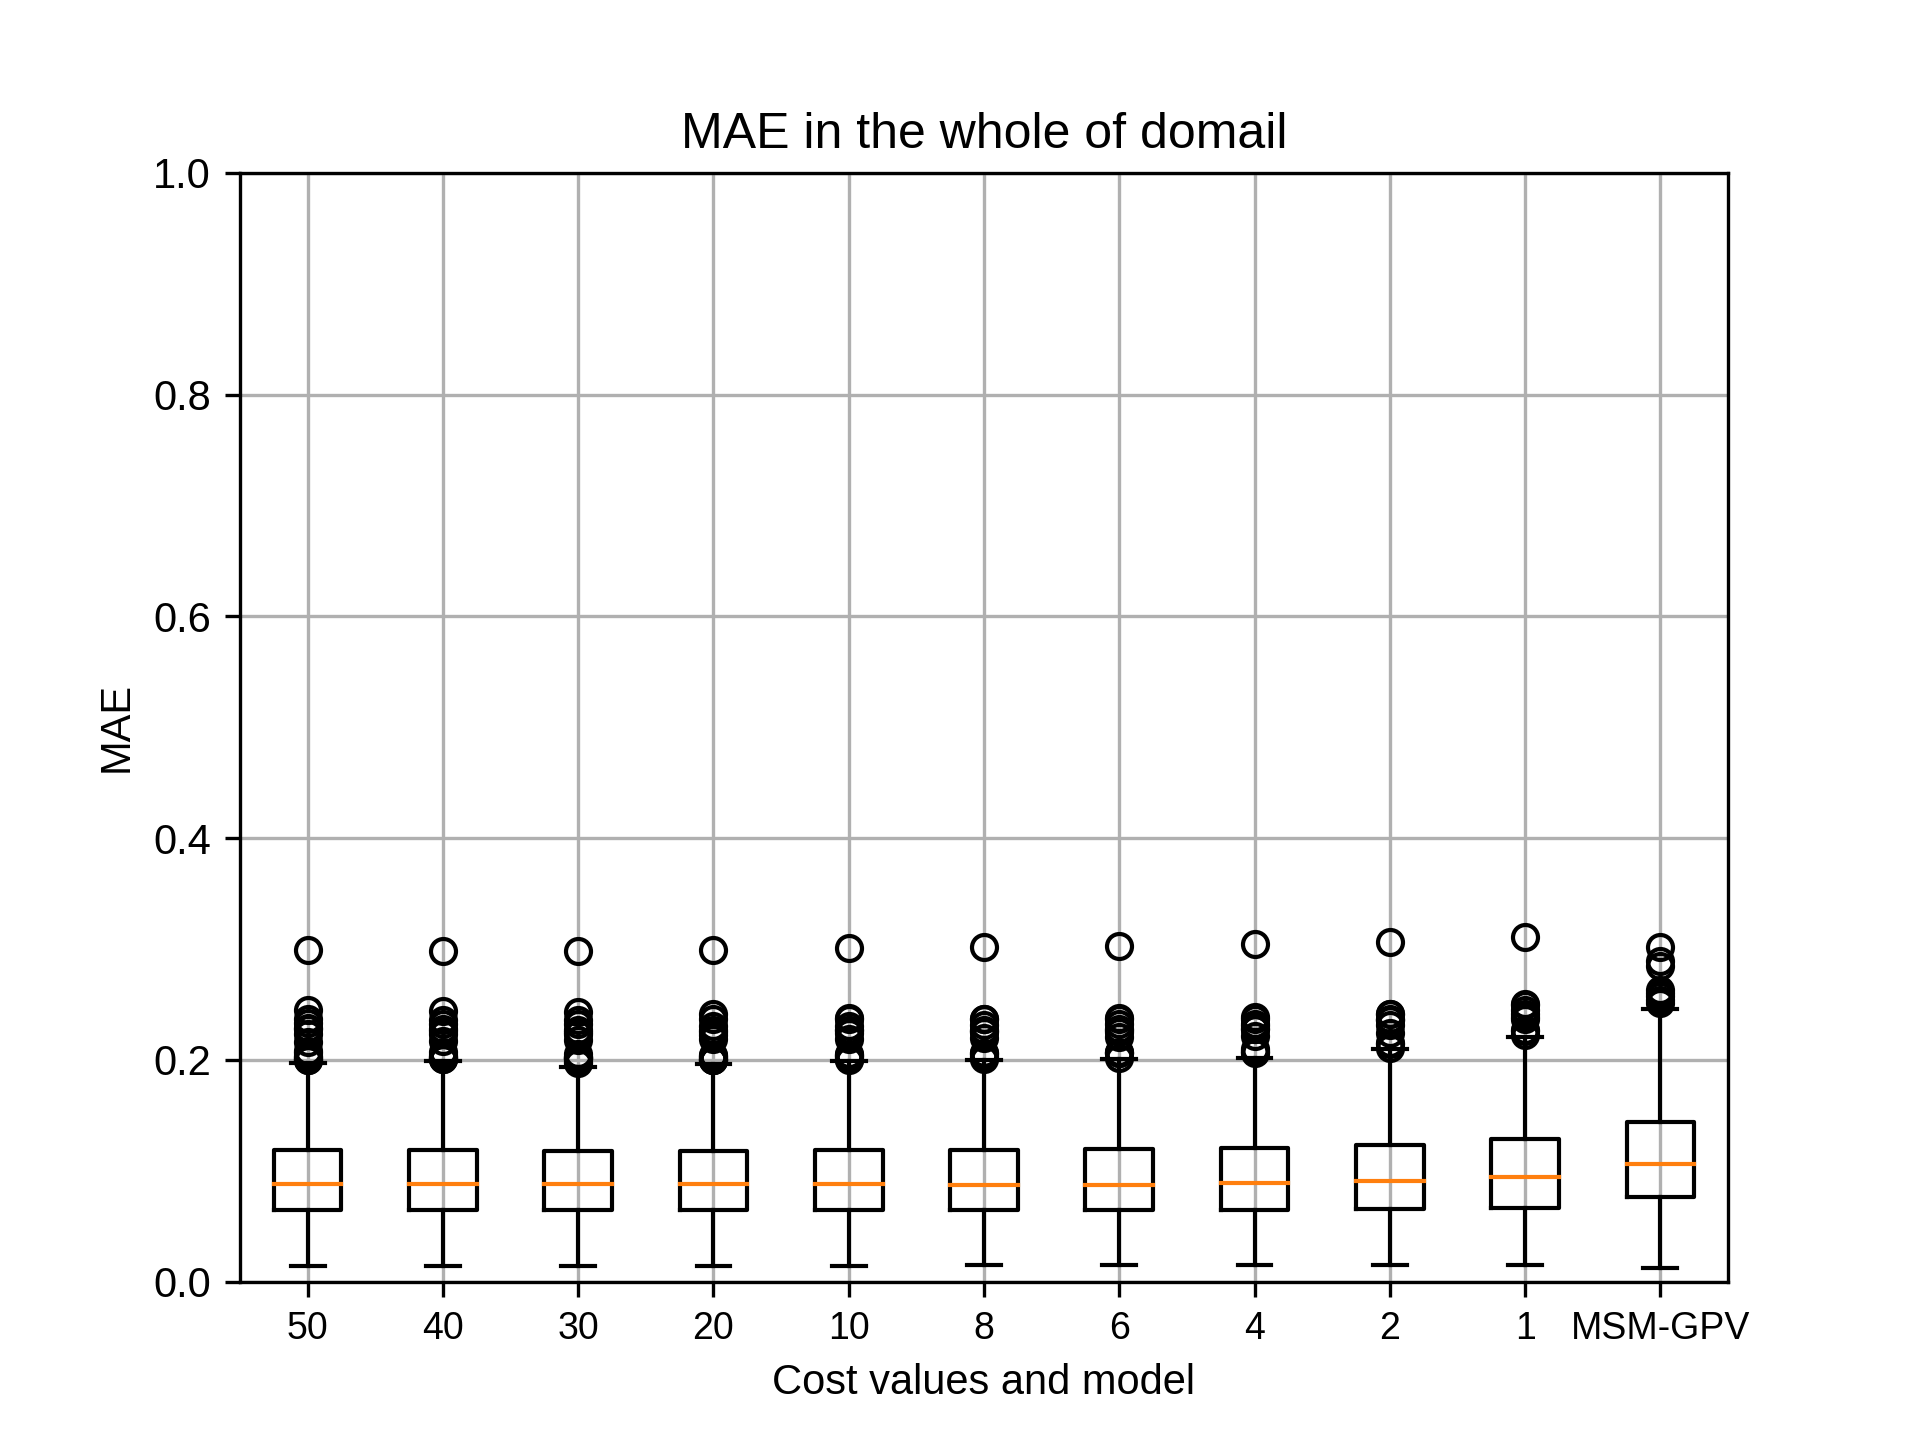
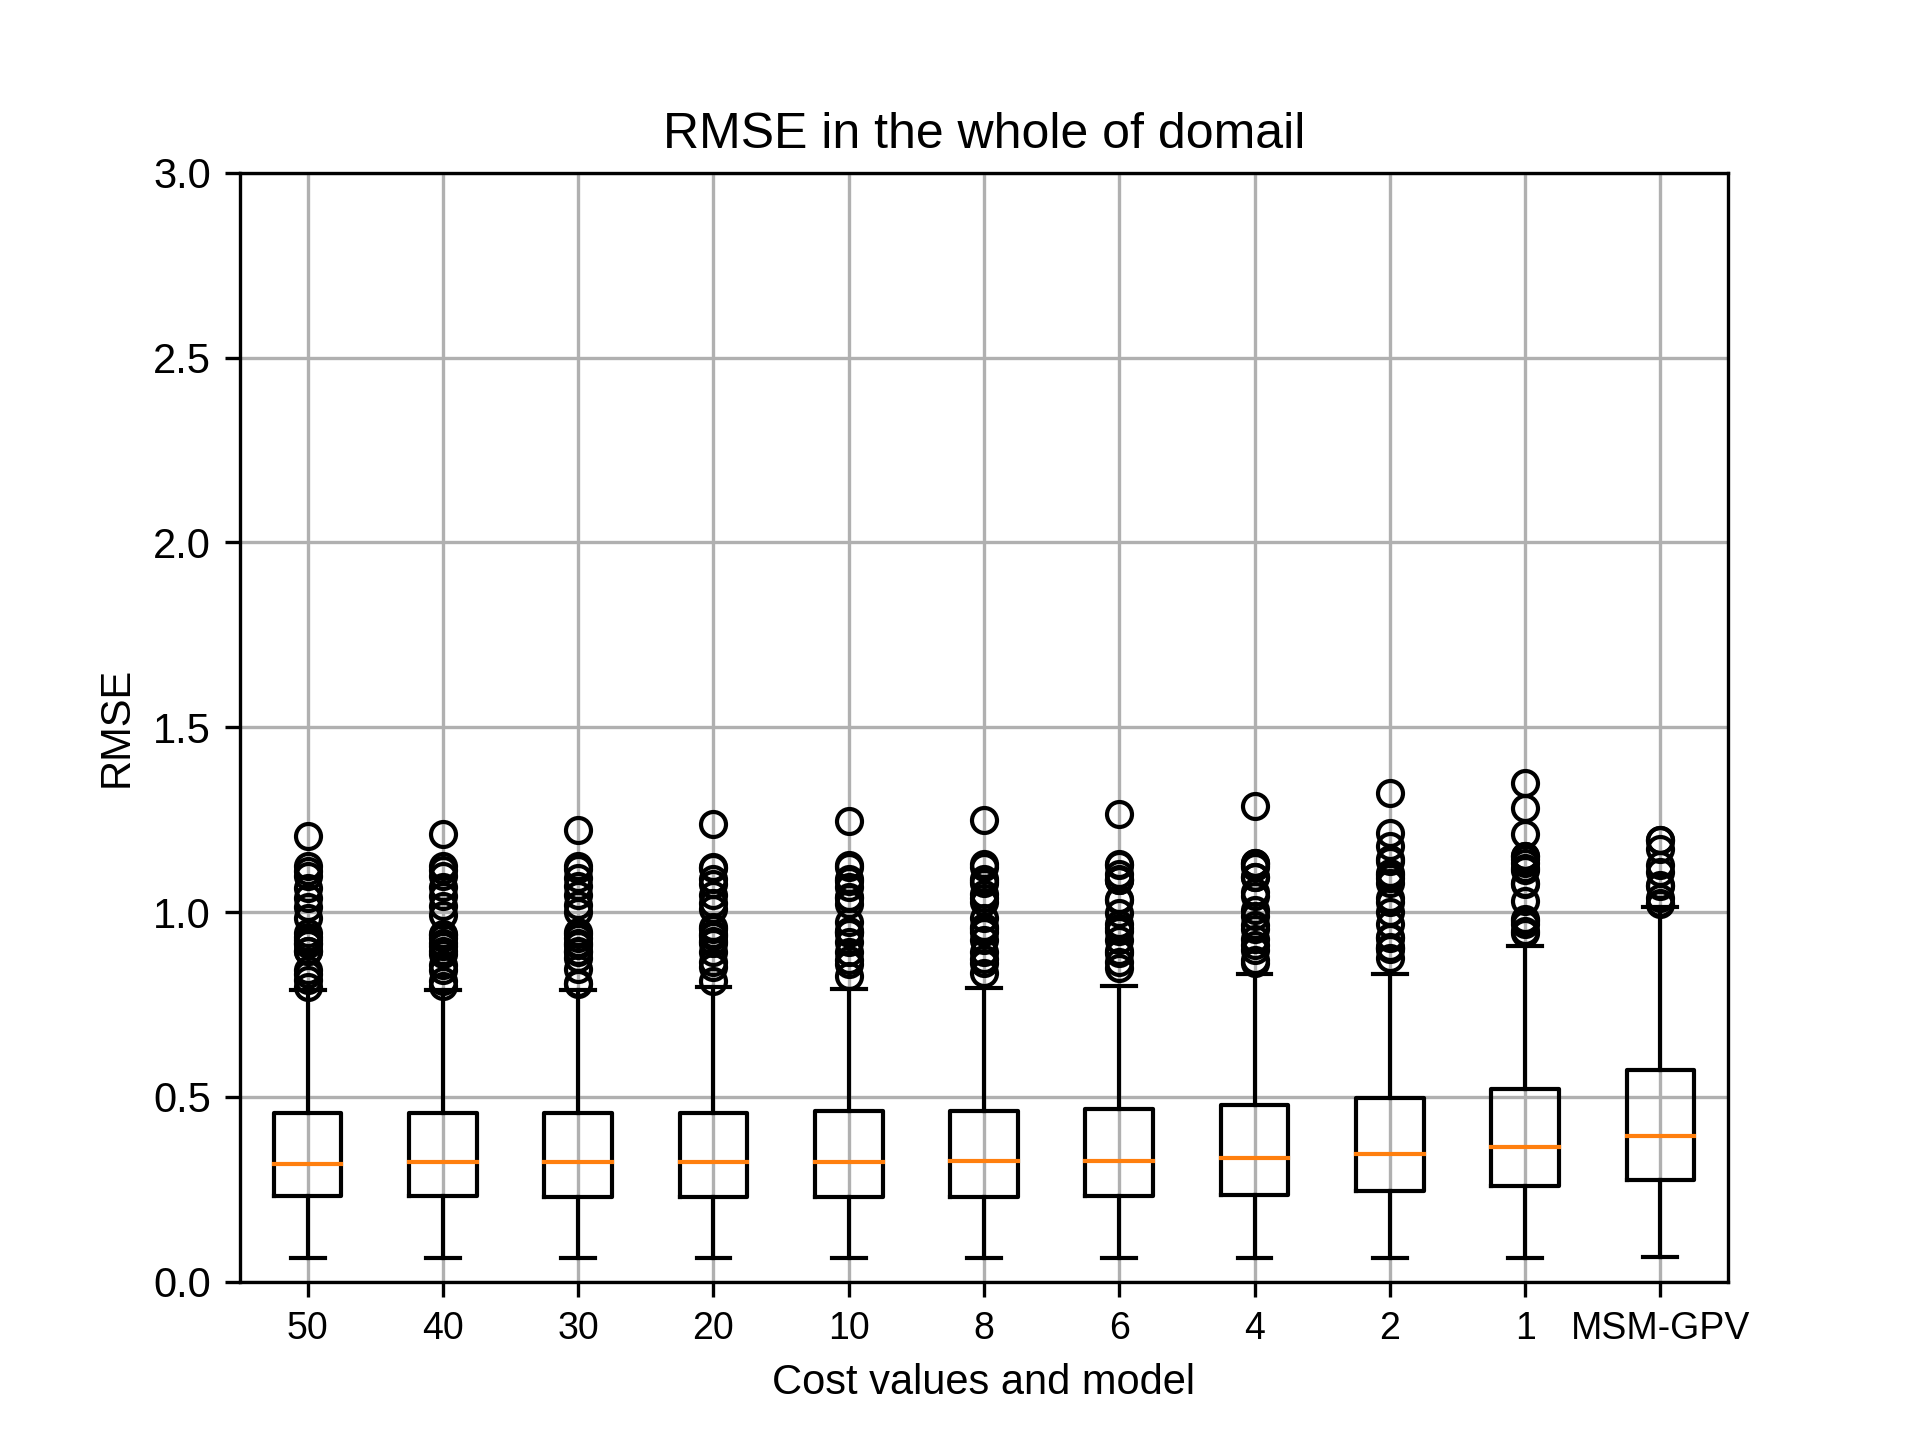
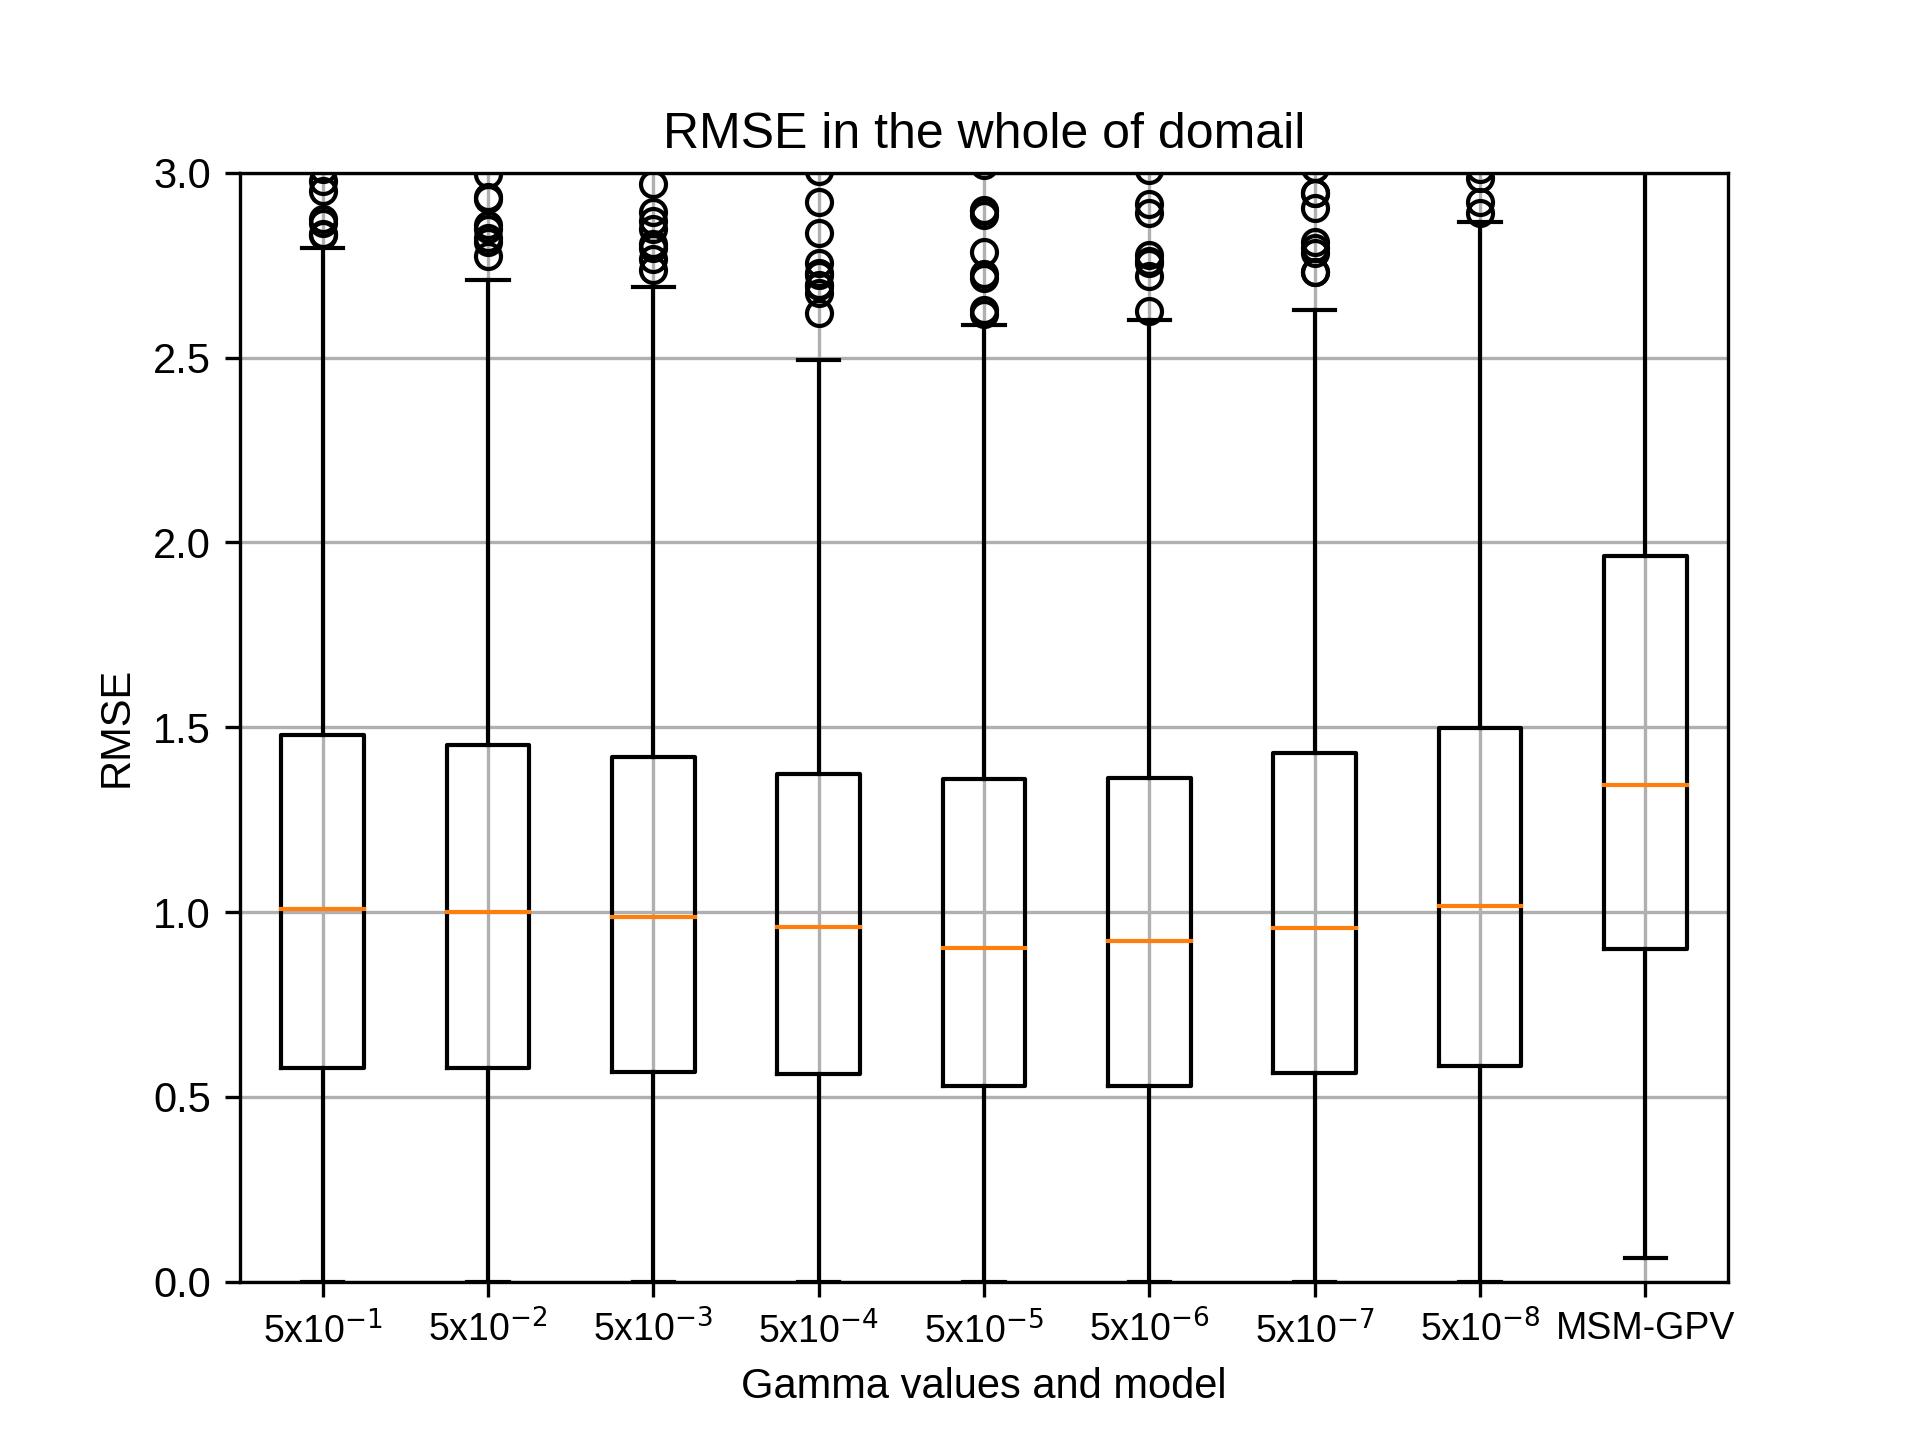
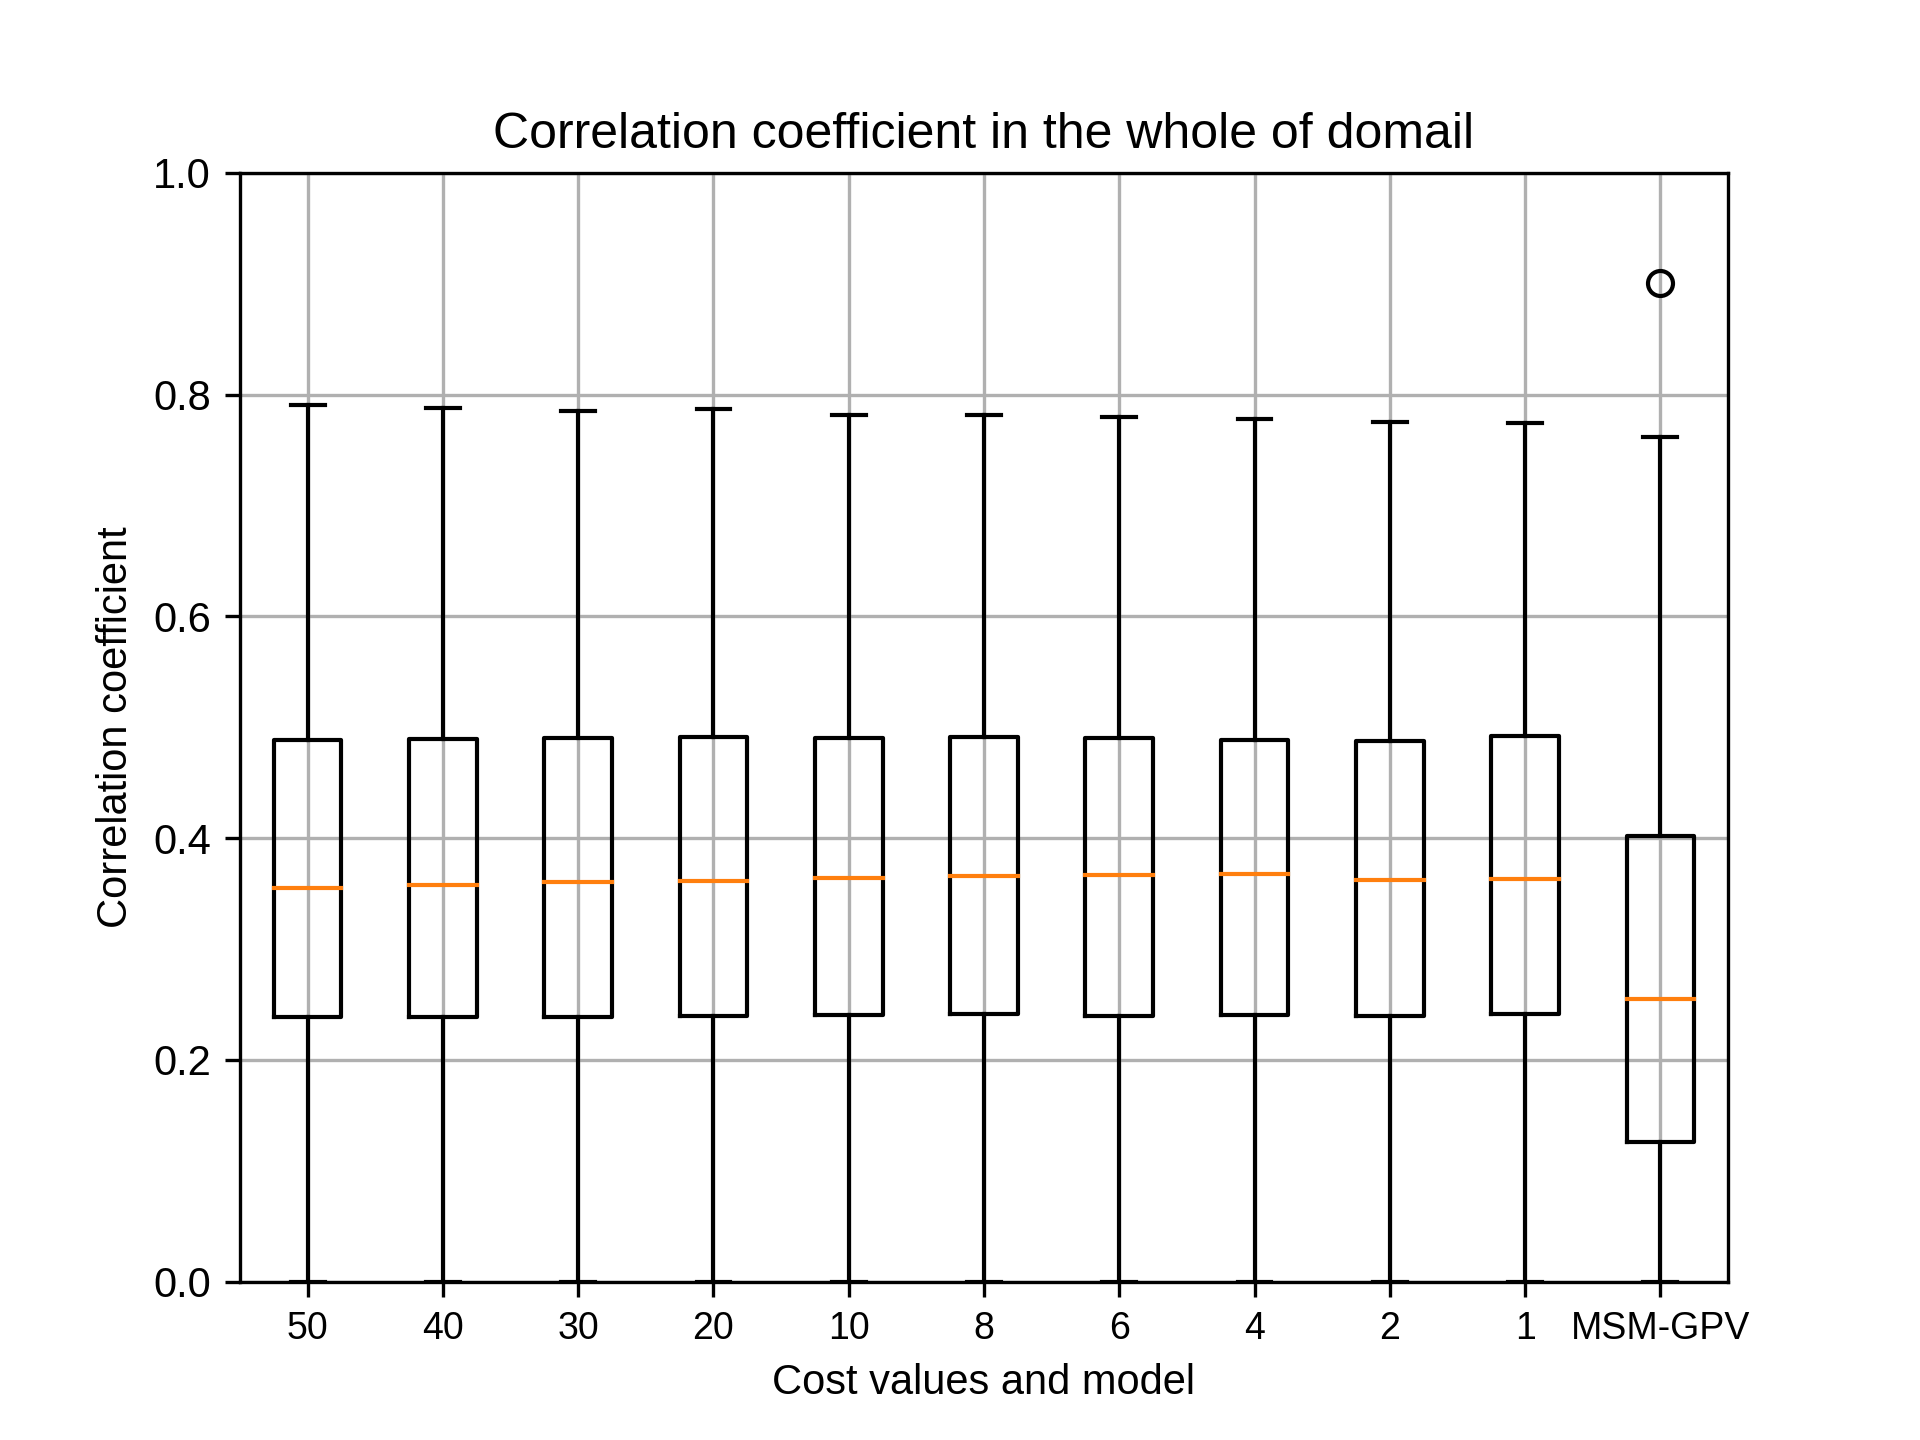
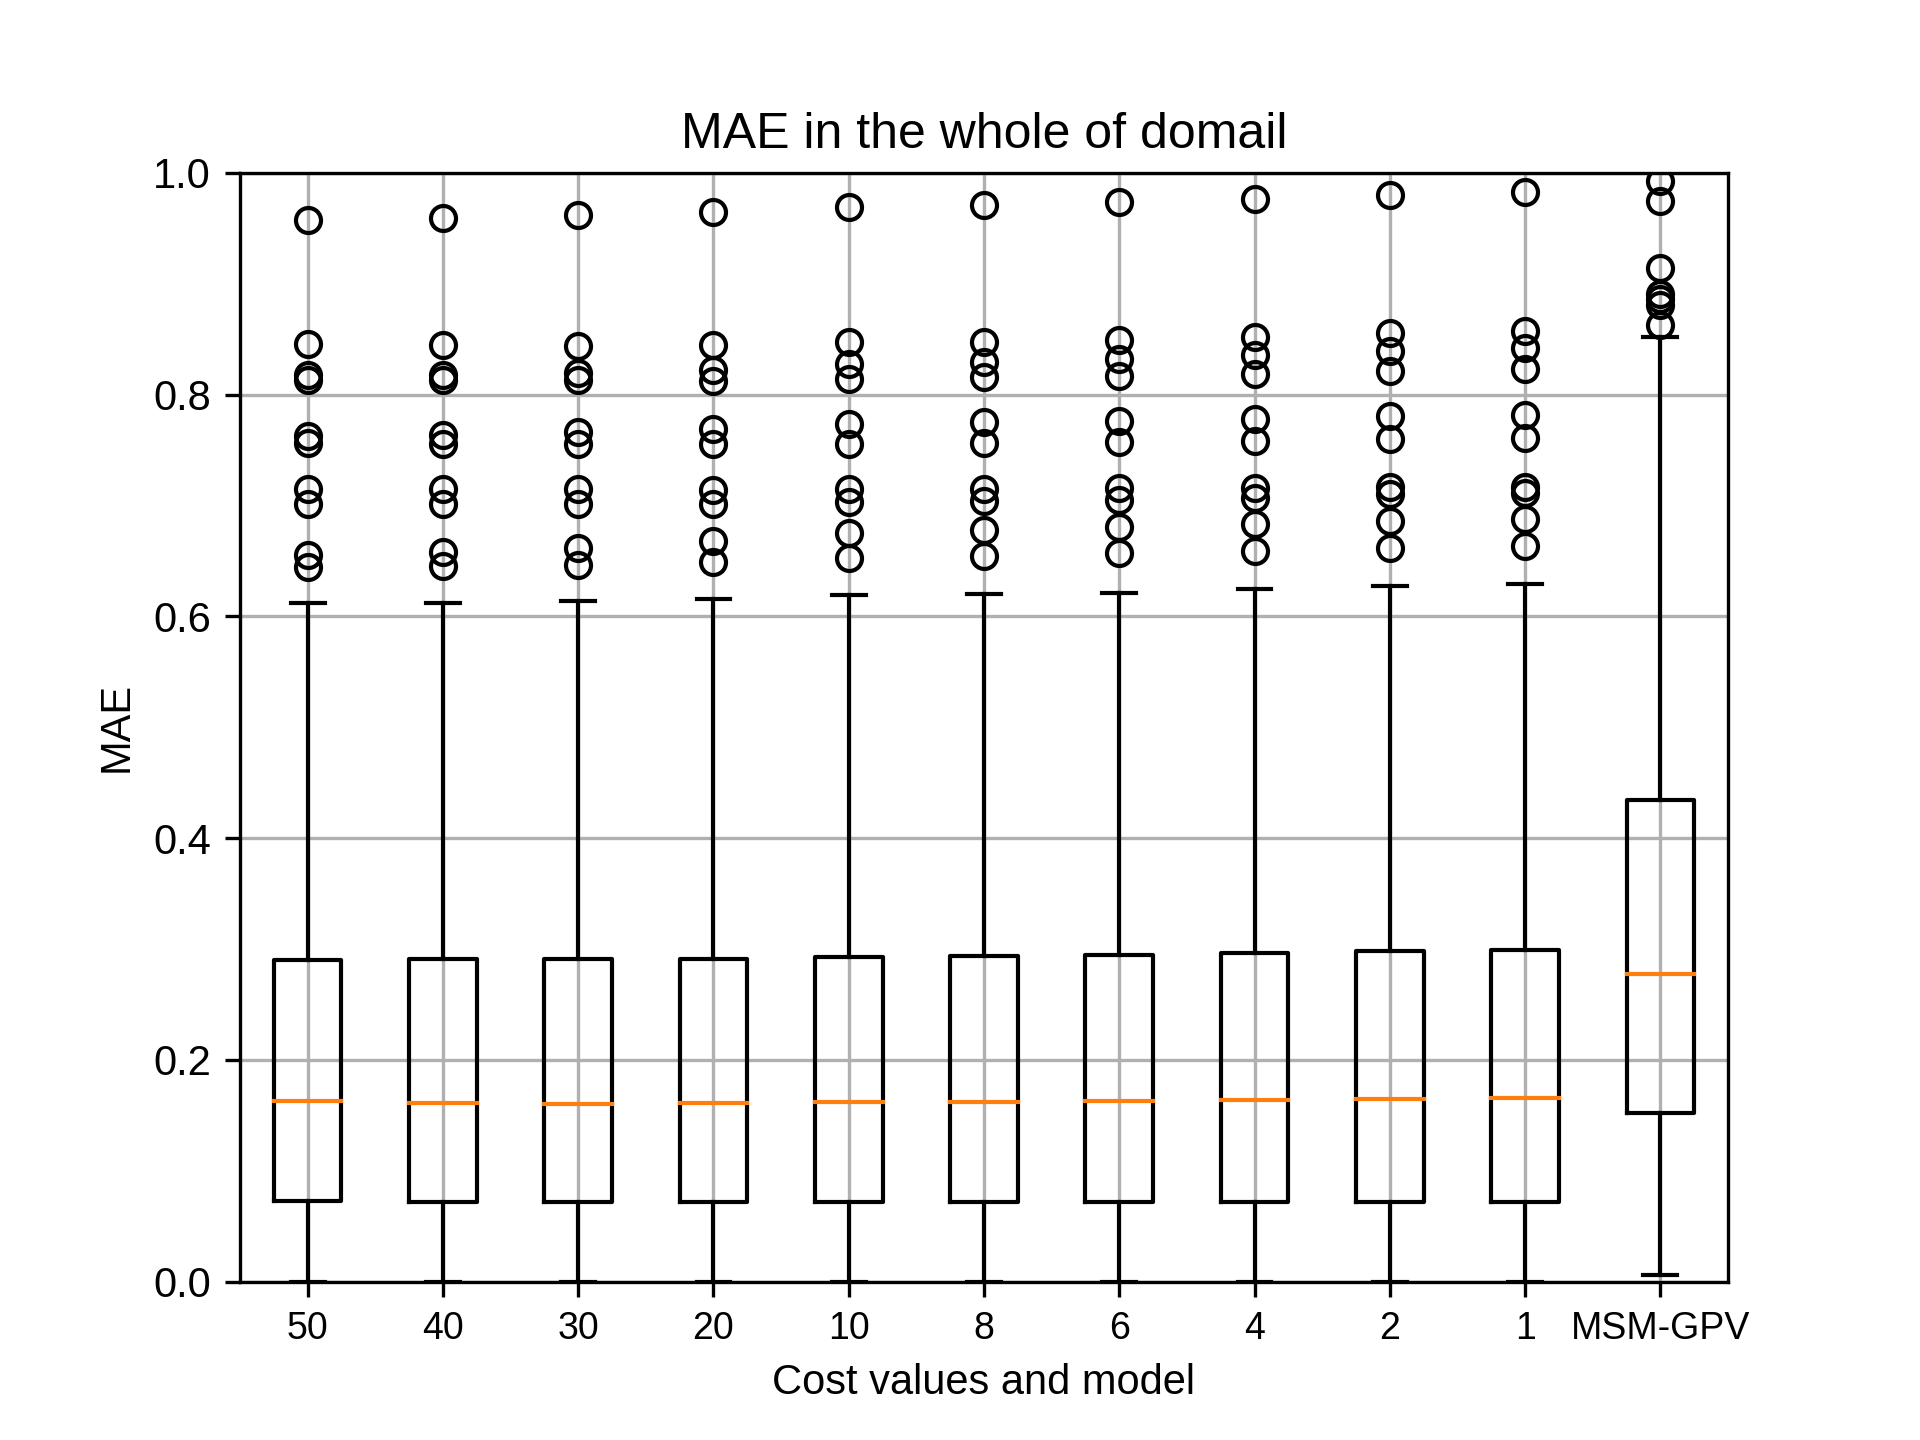
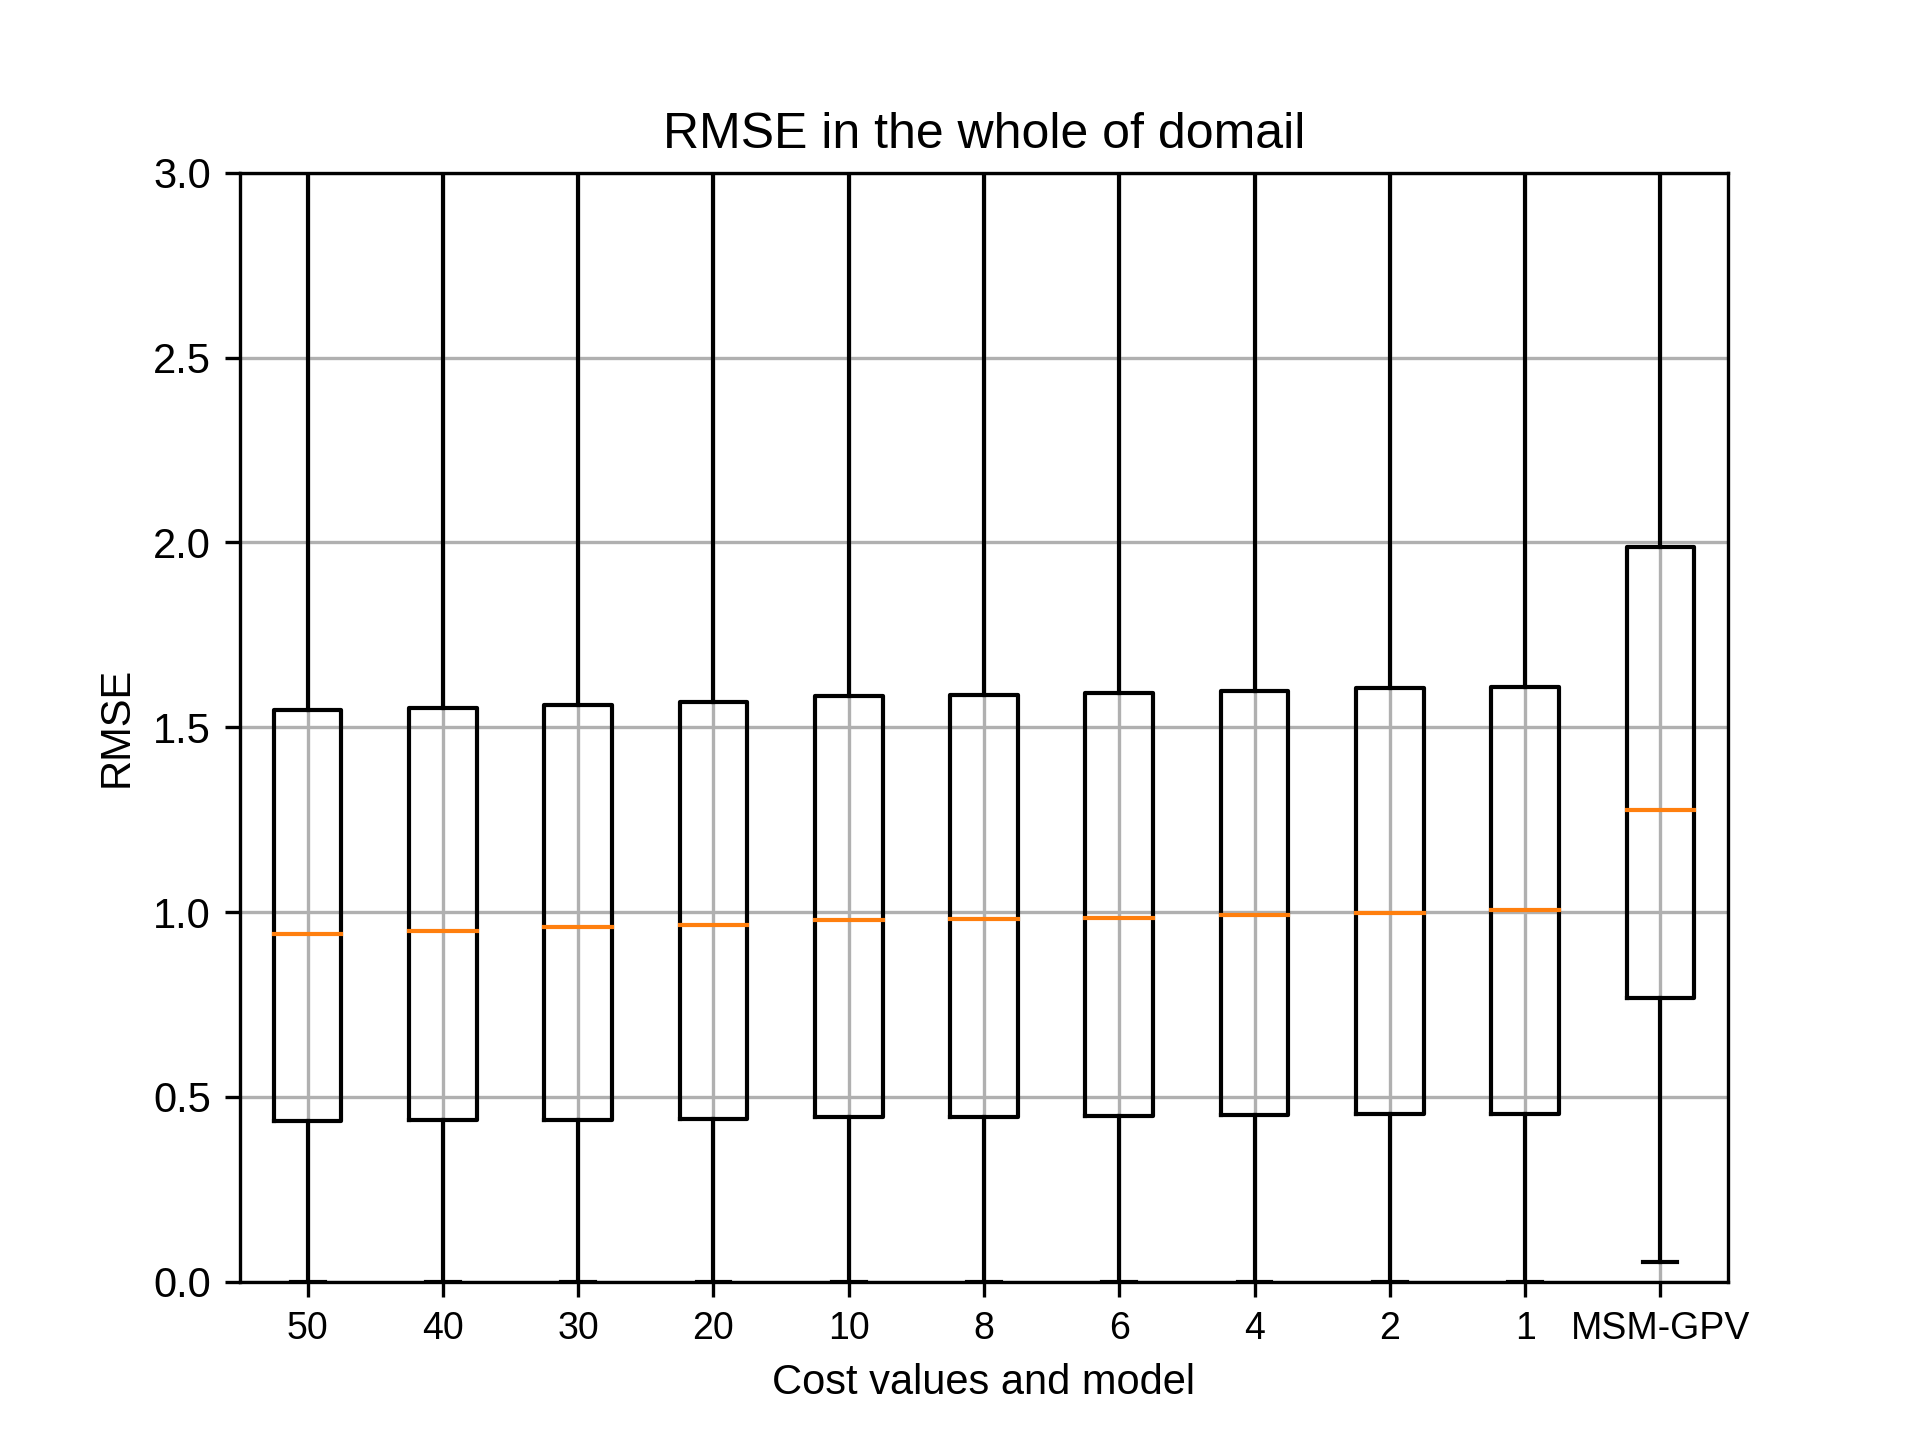
kobayashi_yusukeFriday, September 11th, 2020 at 6:13:31 PM GMT+09:00

@takao-y
吉兼先生
7月のsiteEのコストのグラフは添付のとおりです。
ガンマのパラメータは5x10の-3乗です。
この結果、コストは2を採用して、エプシロンを計算します。
各領域のコストの結果は以上となります。あわせて各領域の位置図を添付します。
引き続きよろしくお願いします。
吉兼先生
7月のsiteEのコストのグラフは添付のとおりです。
ガンマのパラメータは5x10の-3乗です。
この結果、コストは2を採用して、エプシロンを計算します。
各領域のコストの結果は以上となります。あわせて各領域の位置図を添付します。
引き続きよろしくお願いします。
takao-yFriday, September 11th, 2020 at 7:53:54 PM GMT+09:00
@kobayashi_yusuke
小林様。ありがとうございます。epsilonについてもお願いいたします。
小林様。ありがとうございます。epsilonについてもお願いいたします。
kobayashi_yusukeMonday, September 14th, 2020 at 2:59:38 PM GMT+09:00
@takao-y
吉兼先生
小林です。お世話になっております。
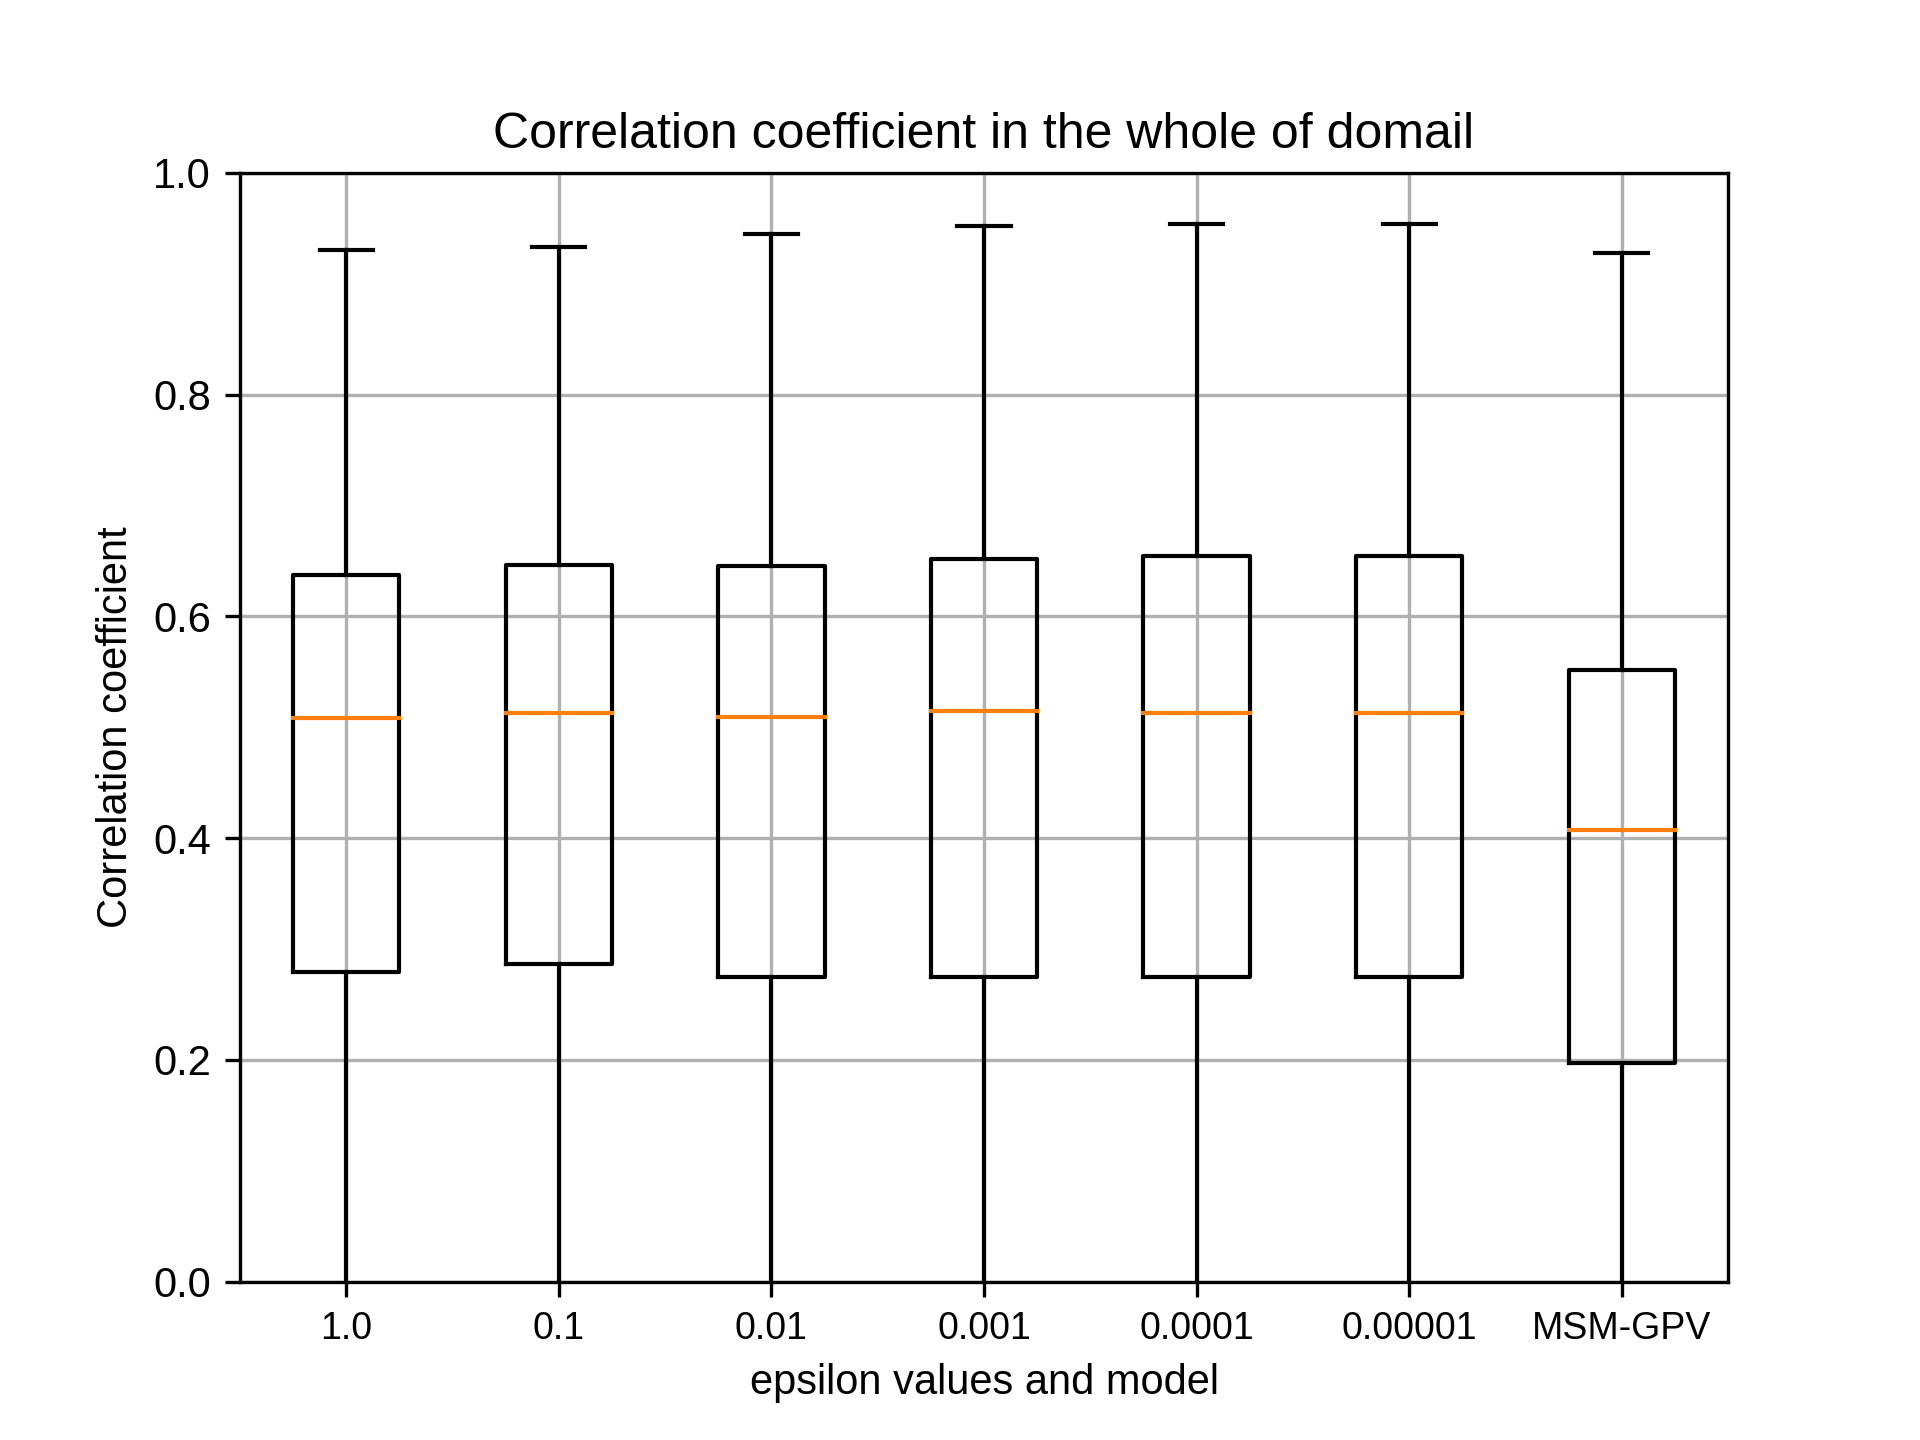
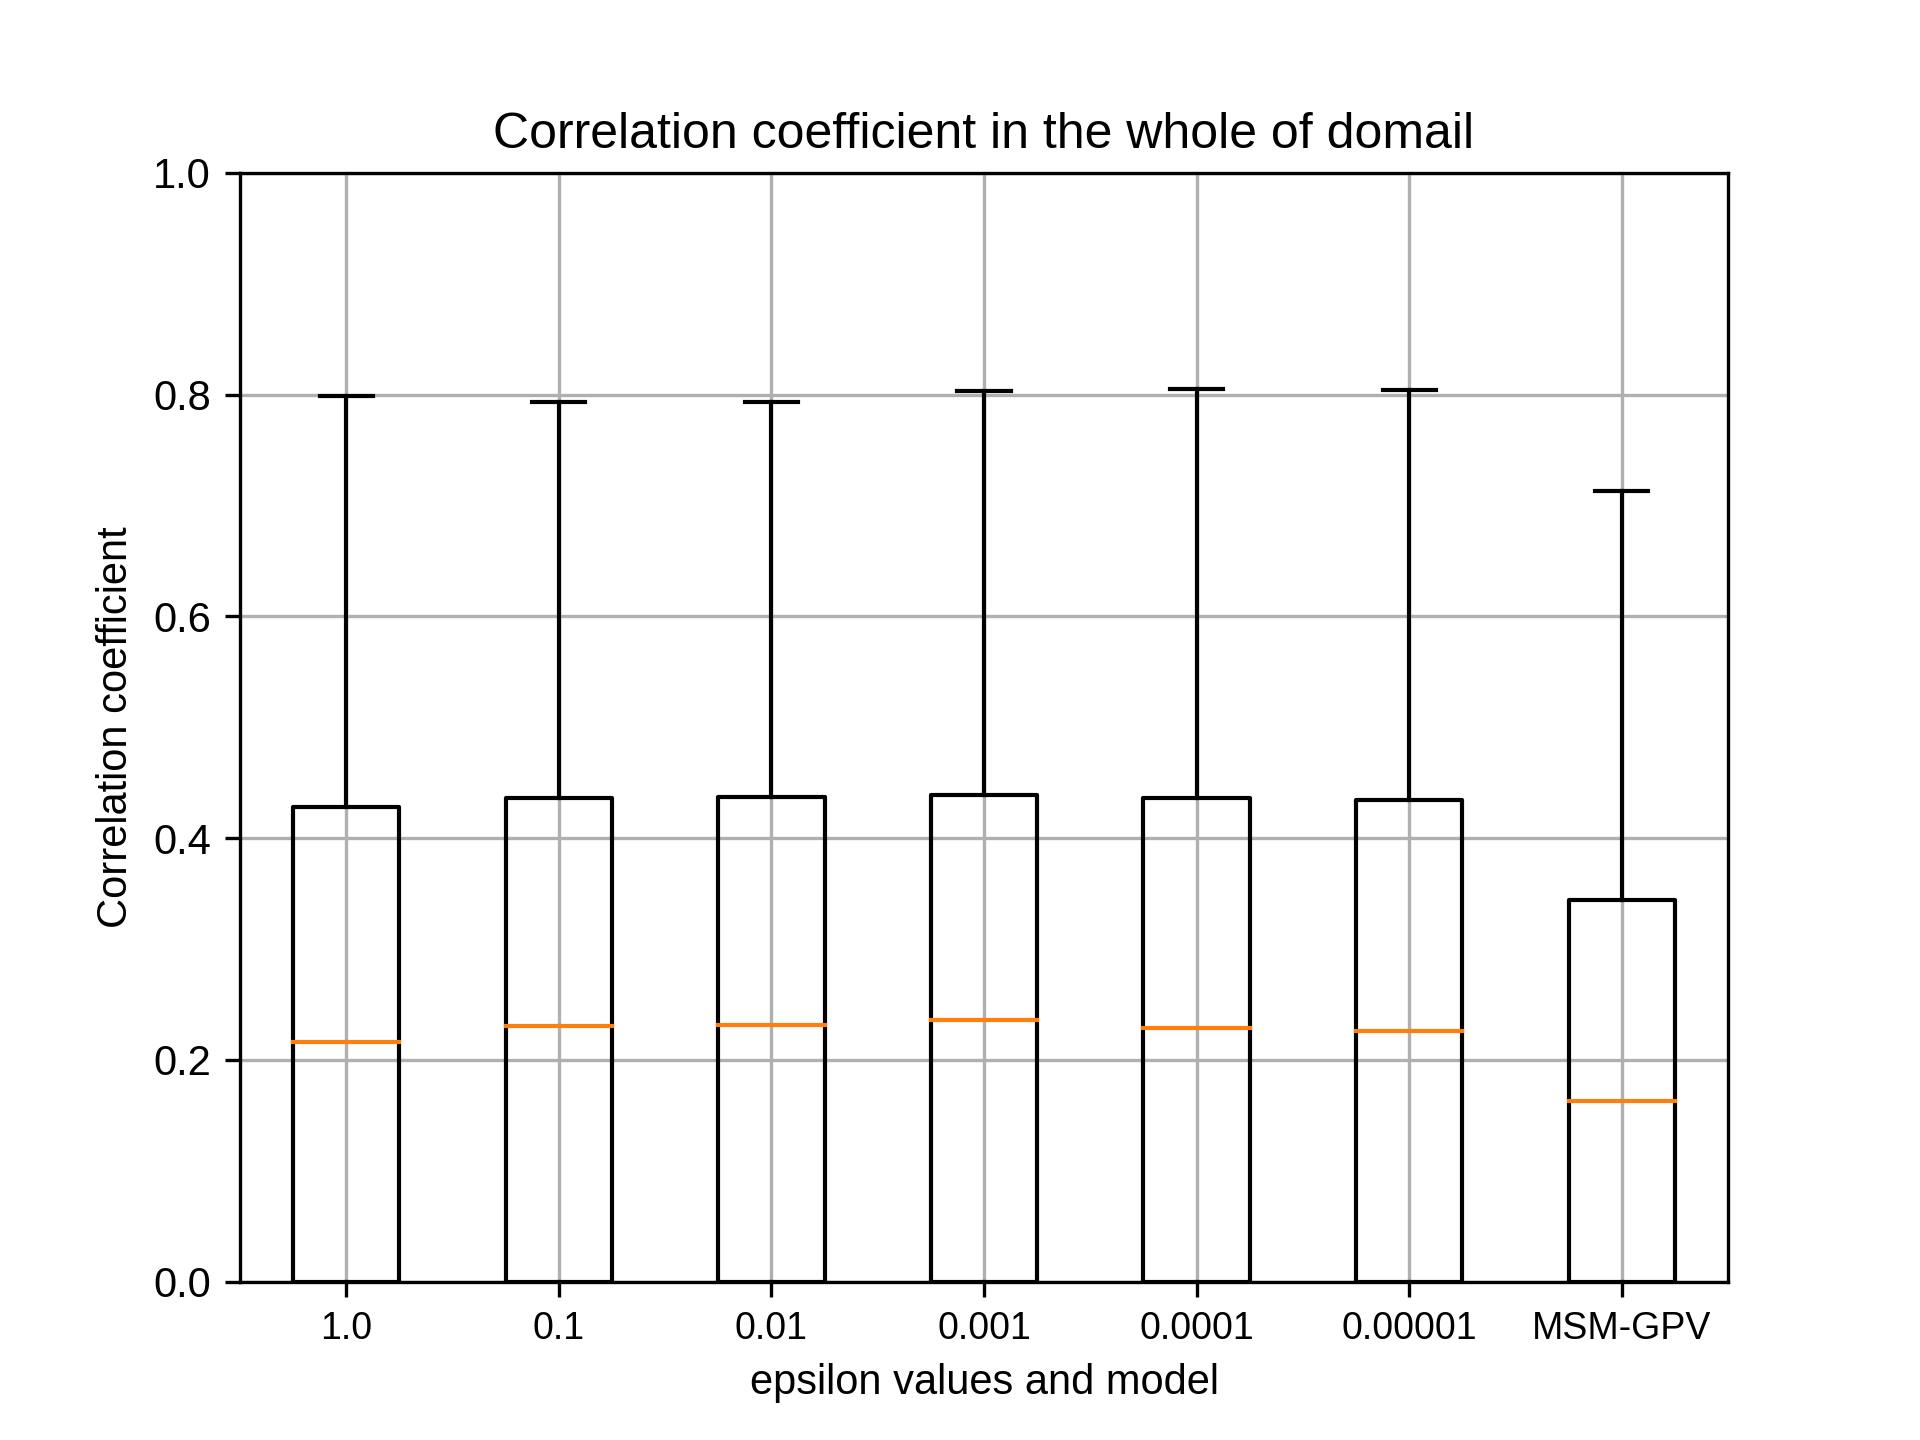
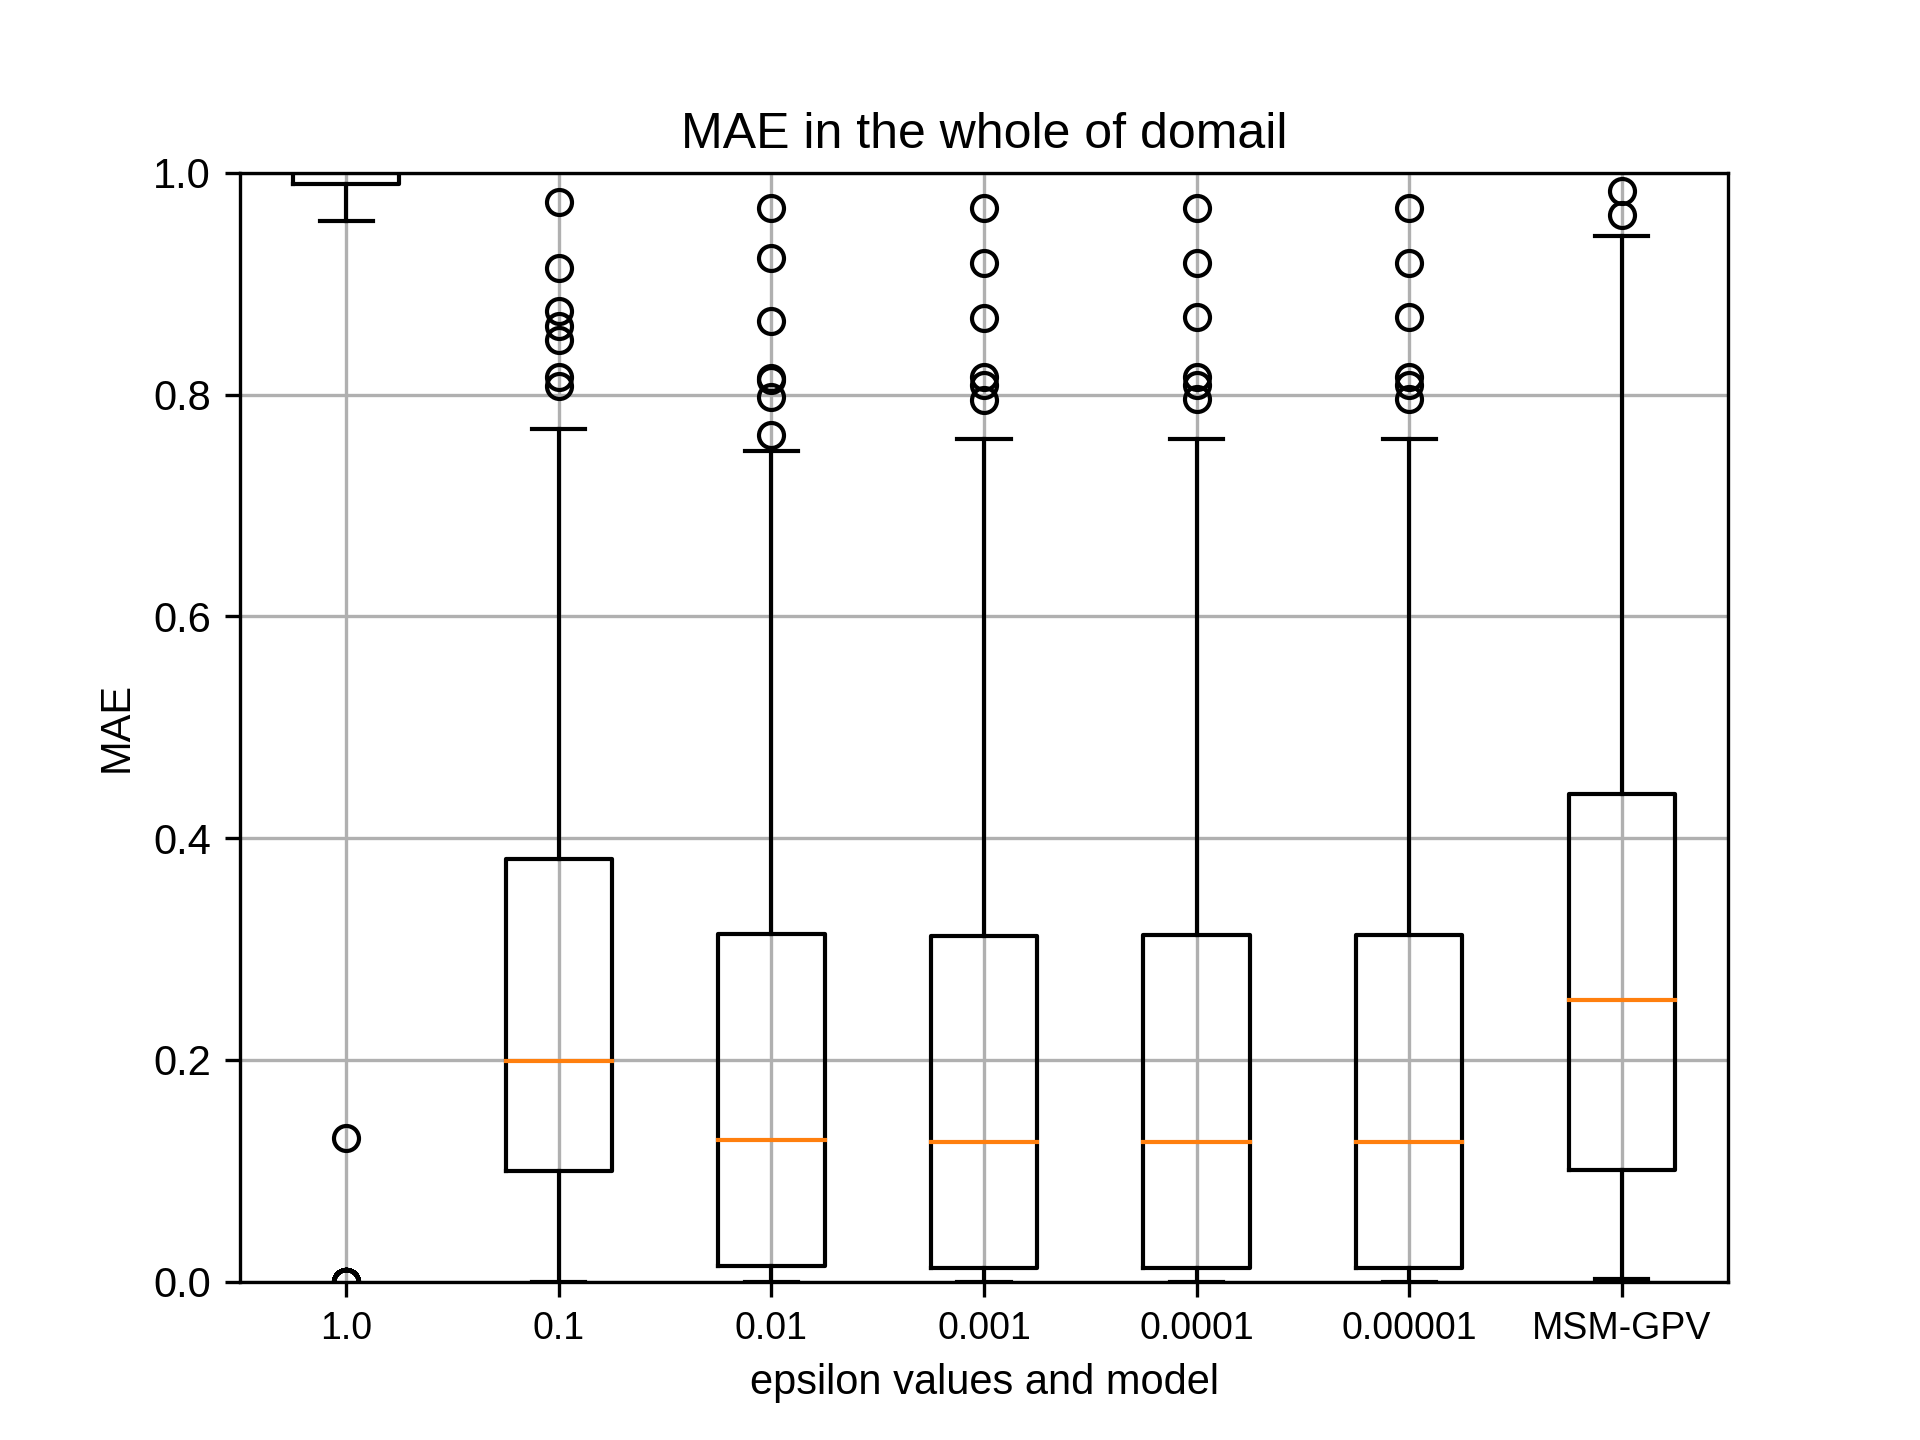
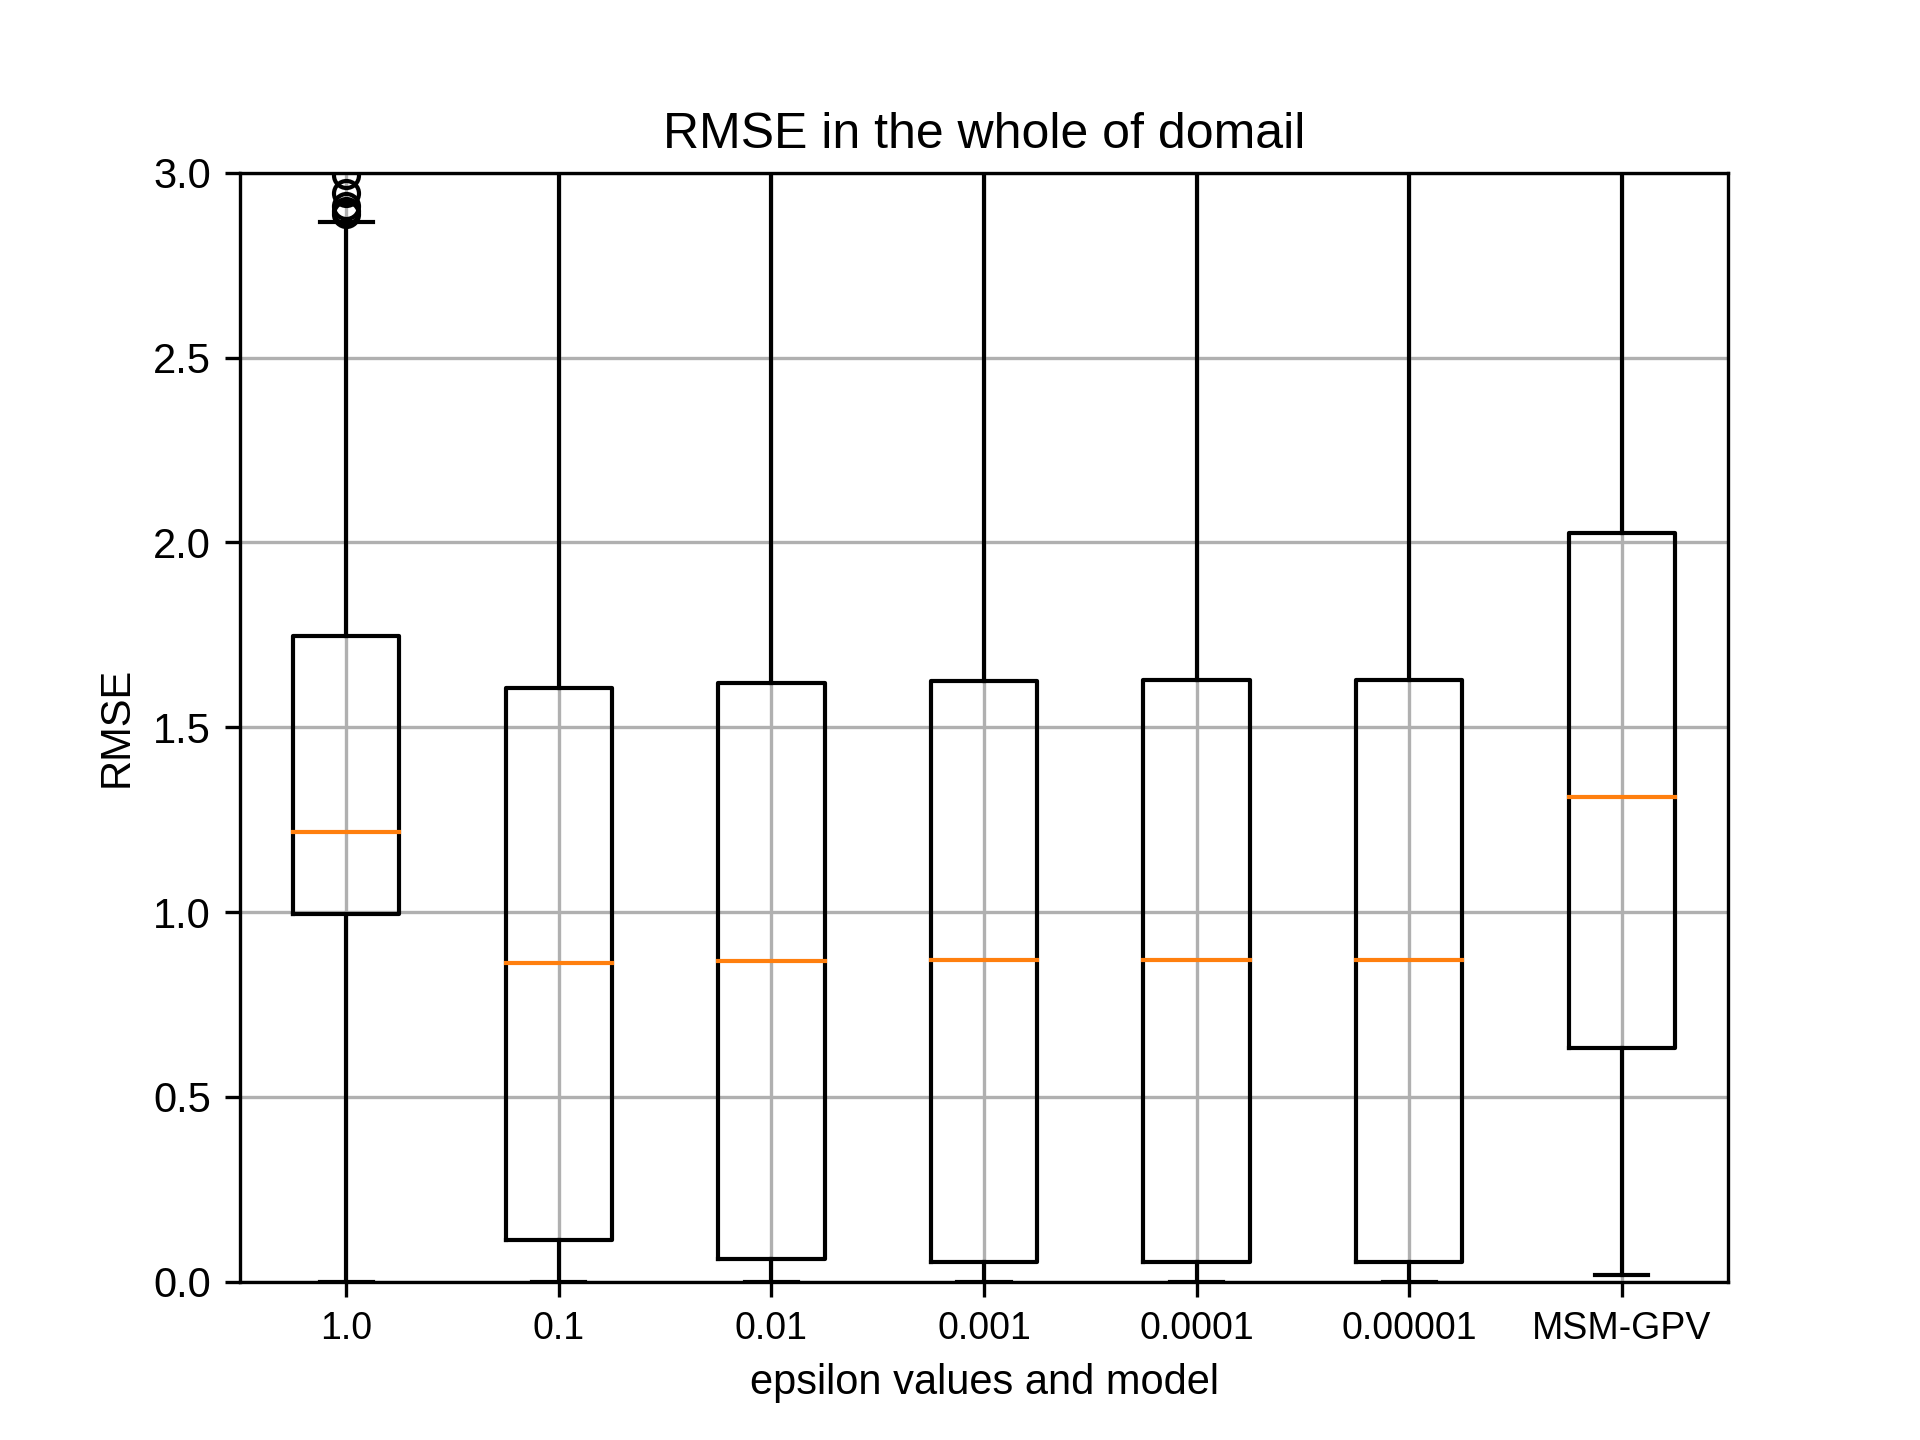
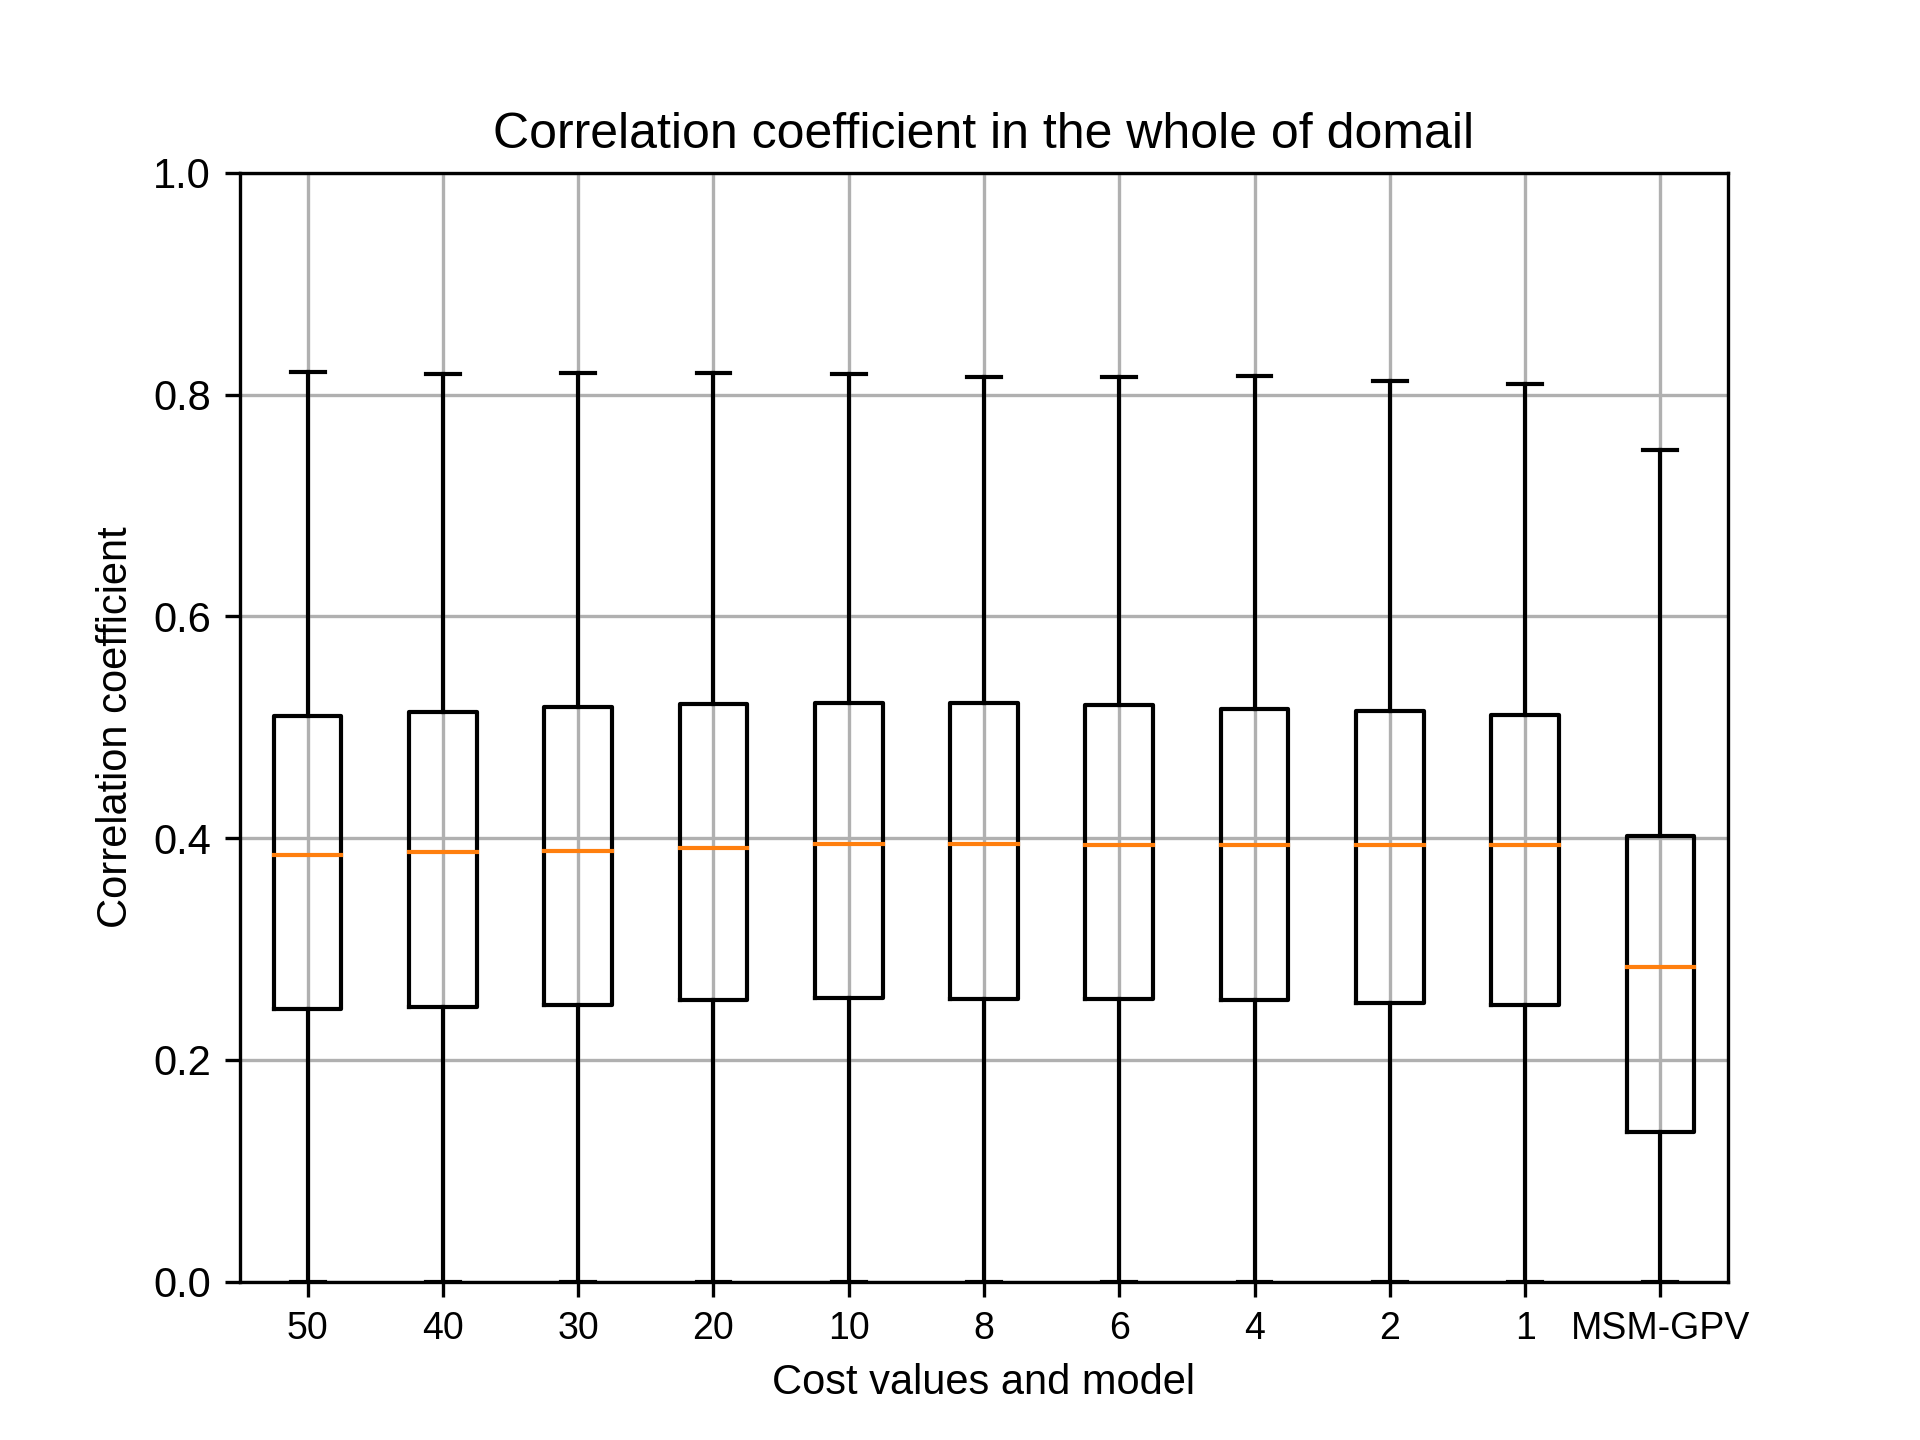
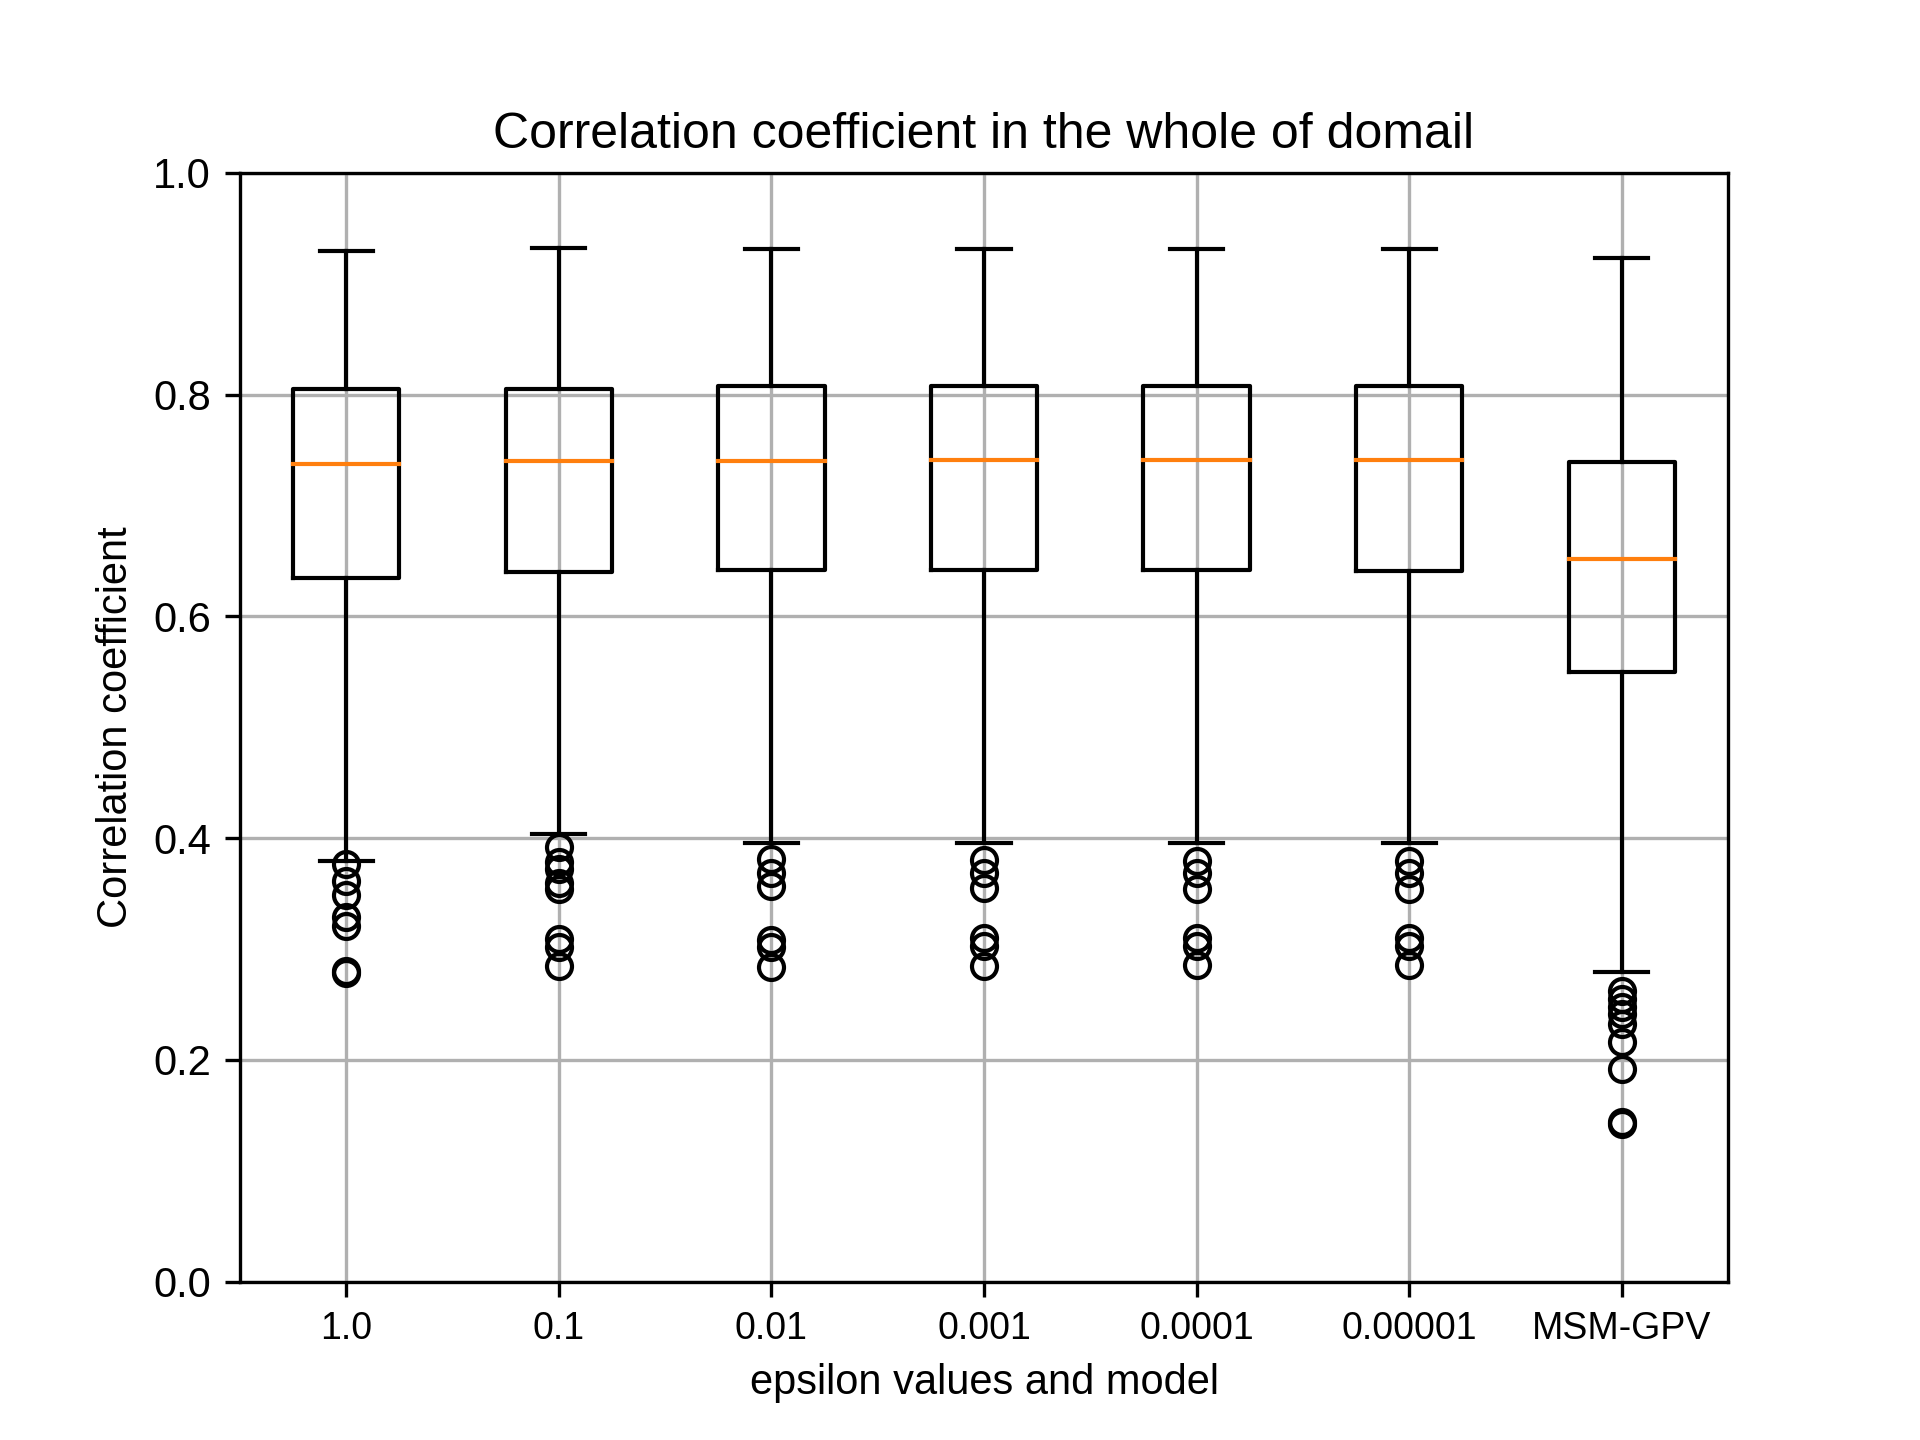
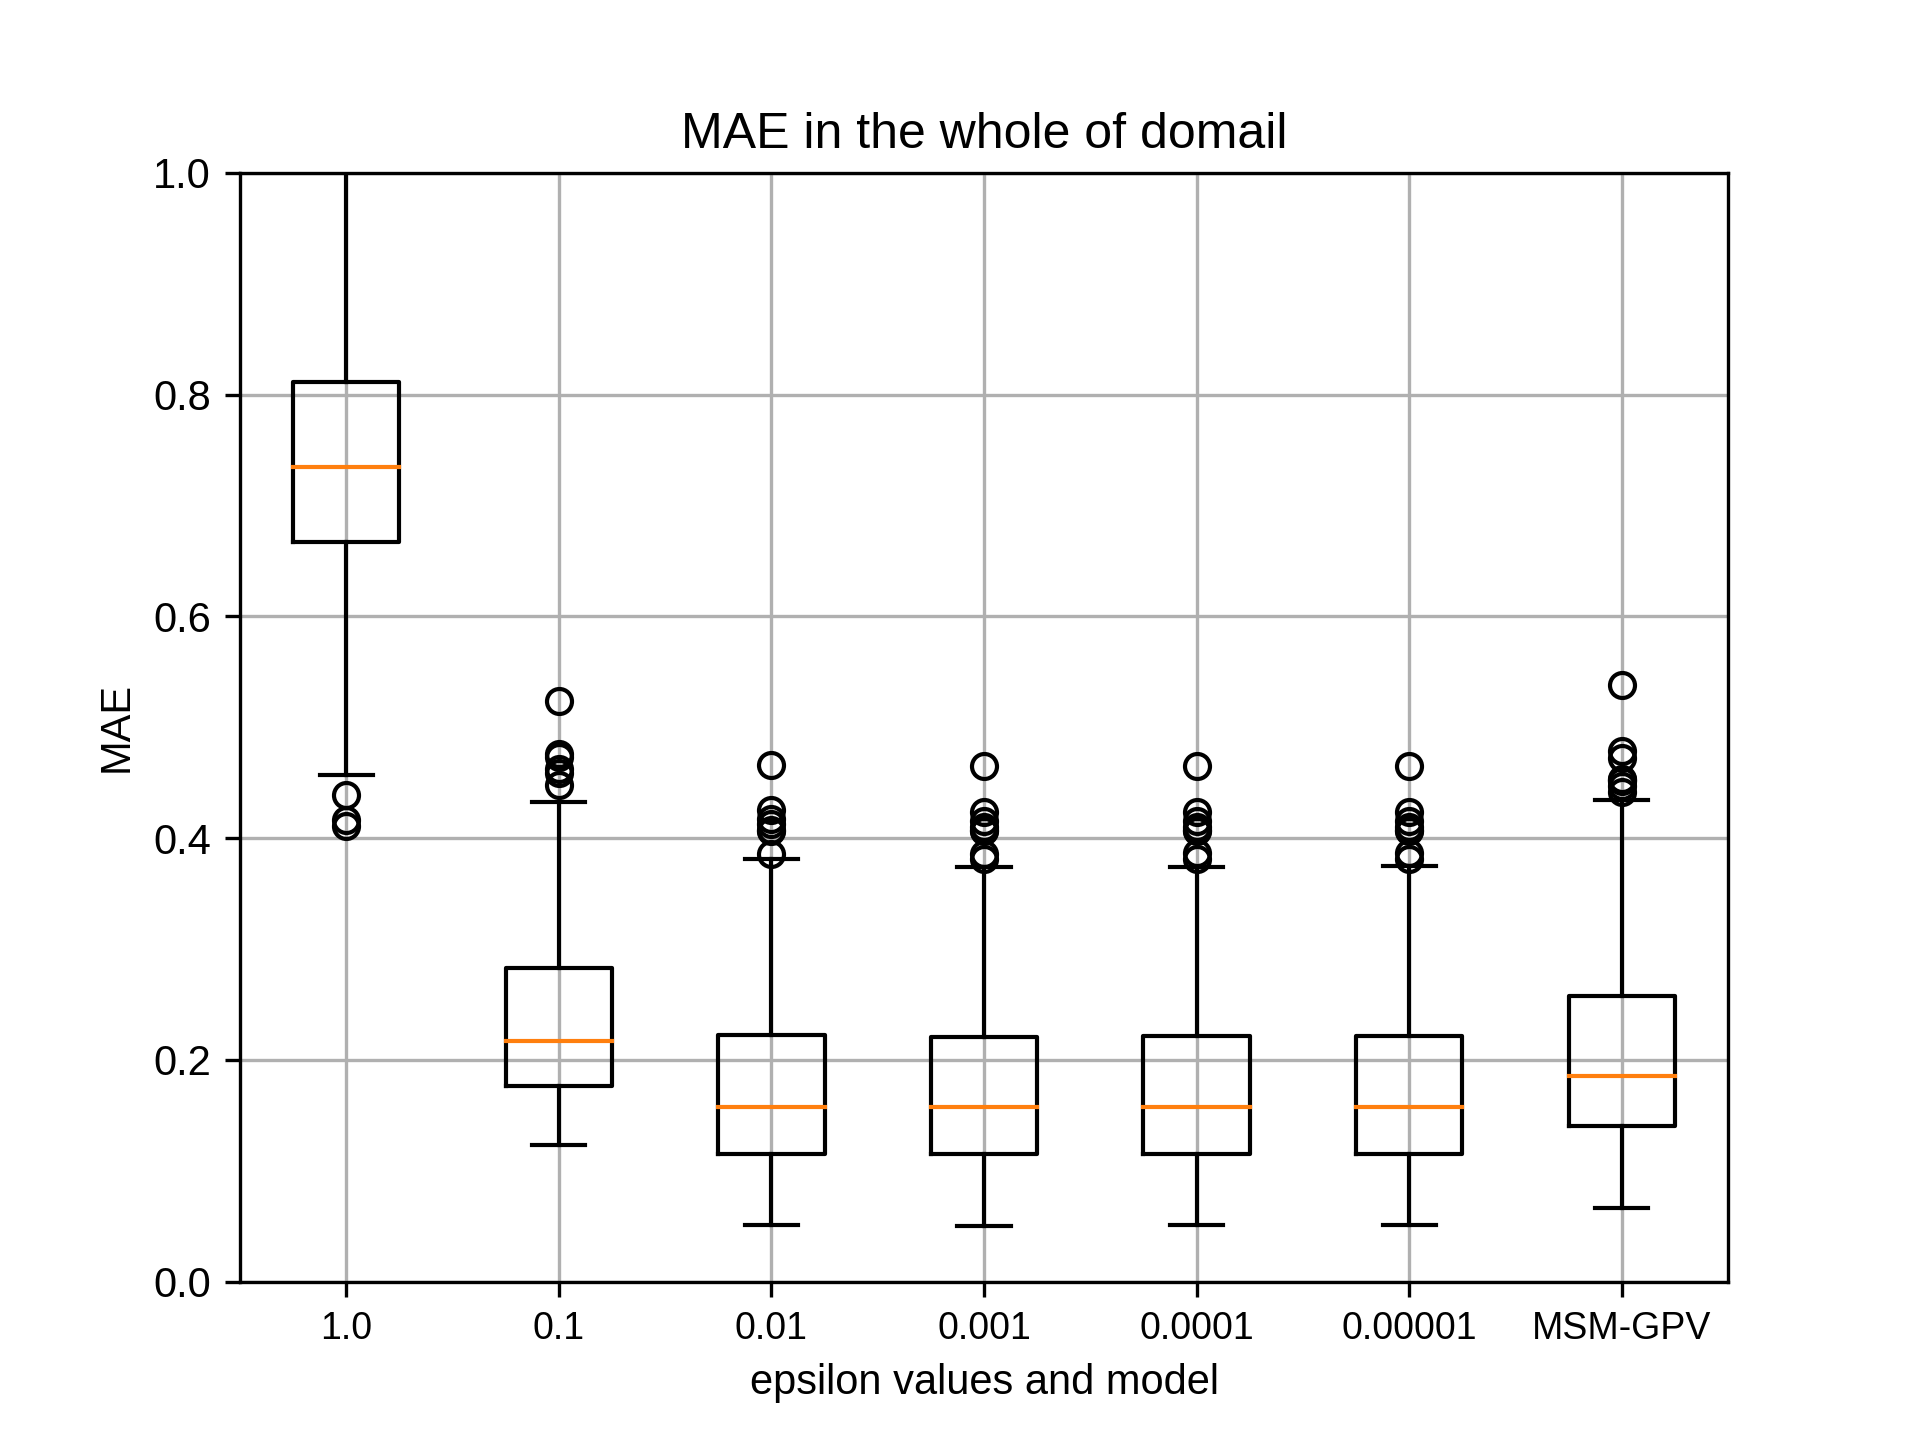
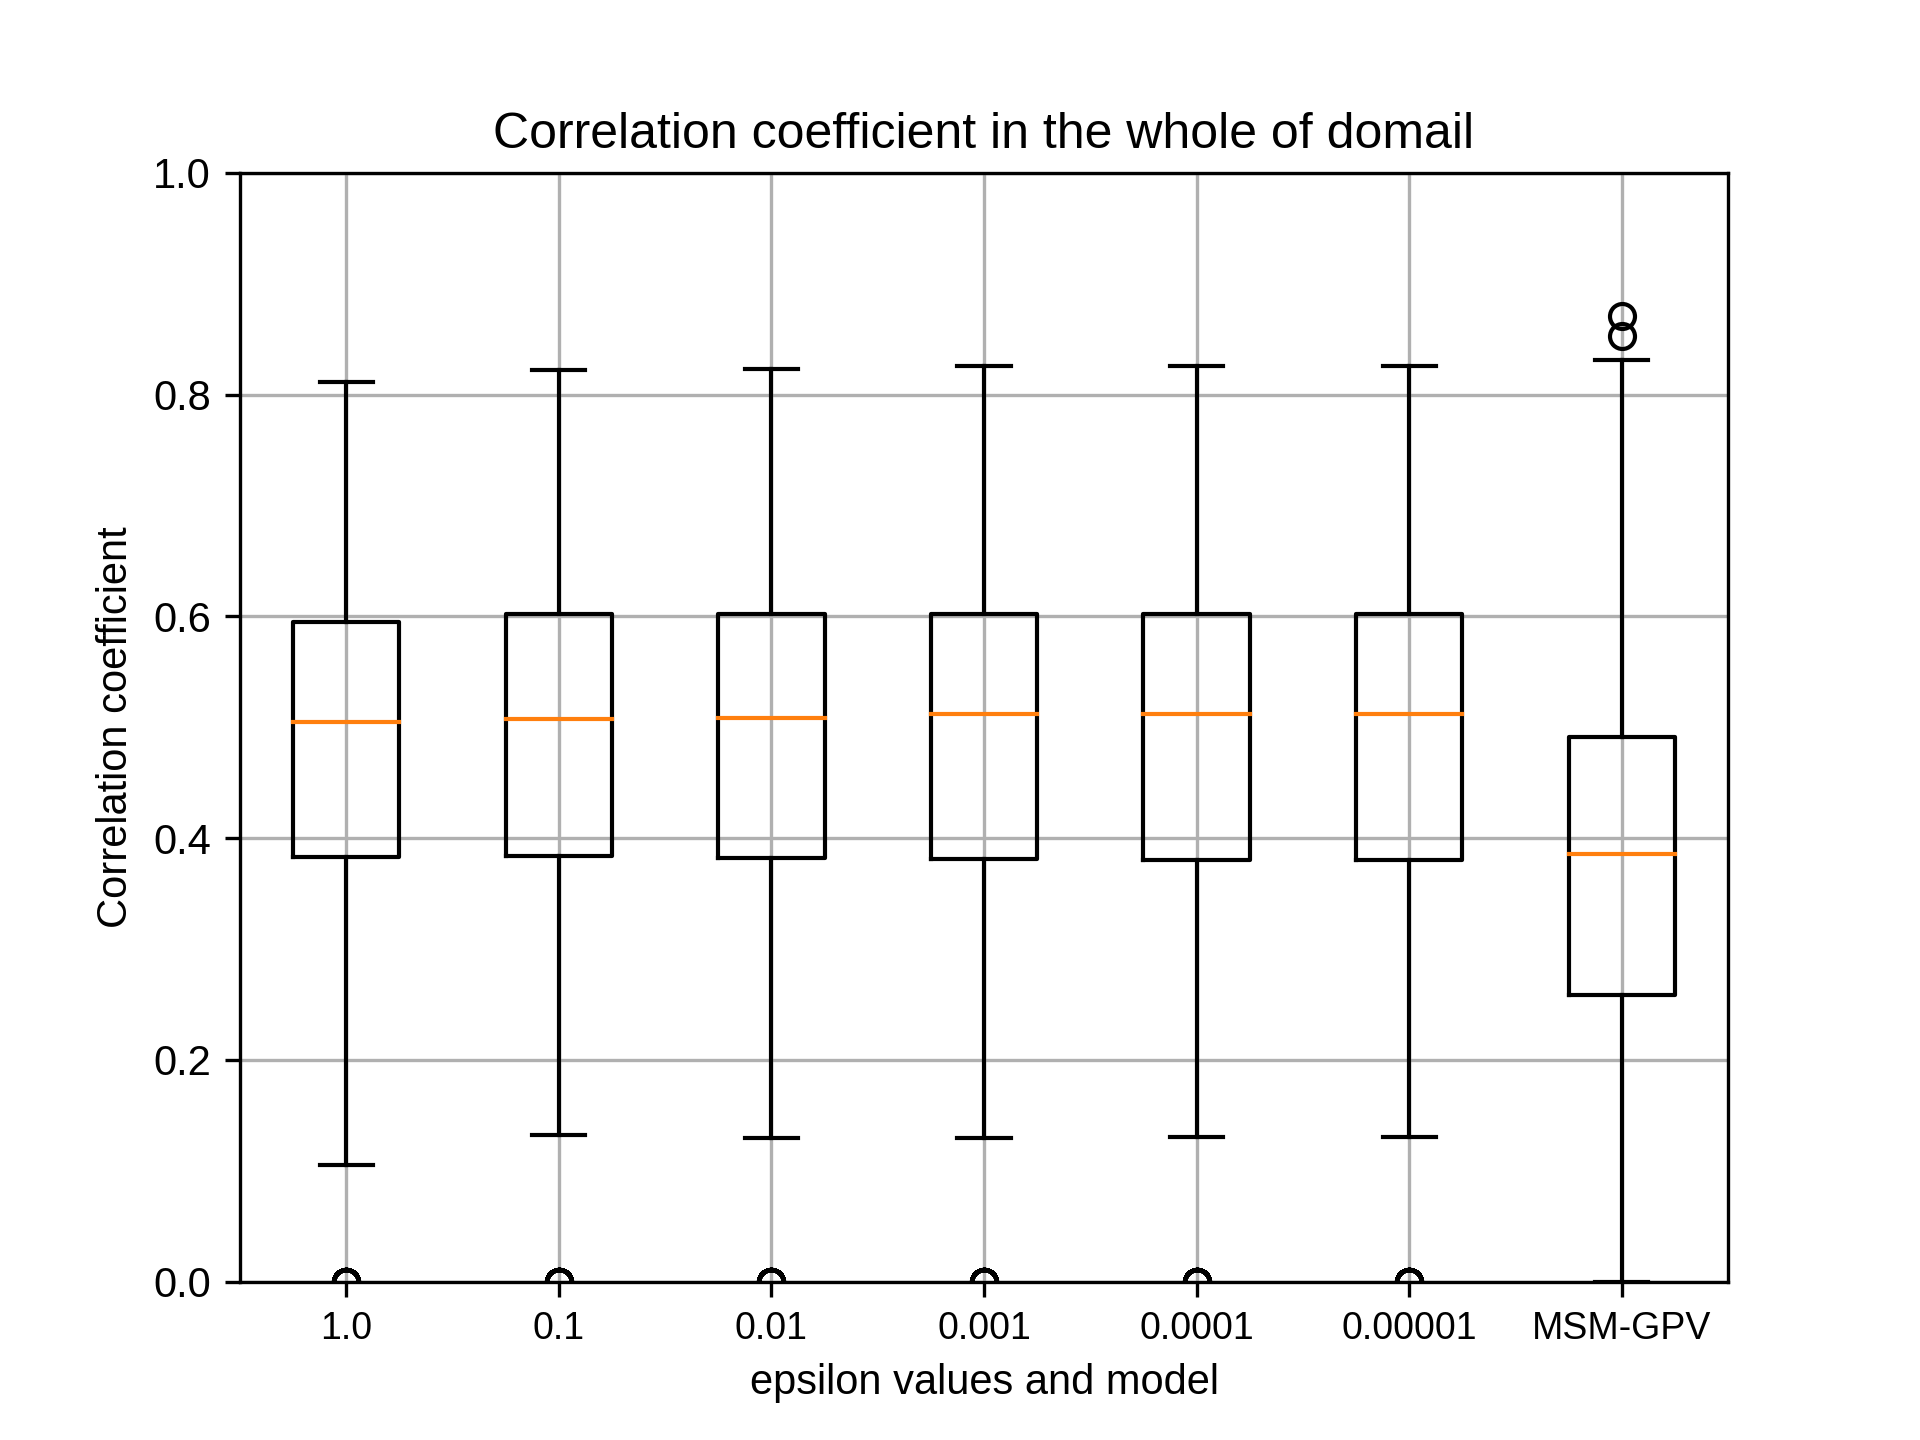
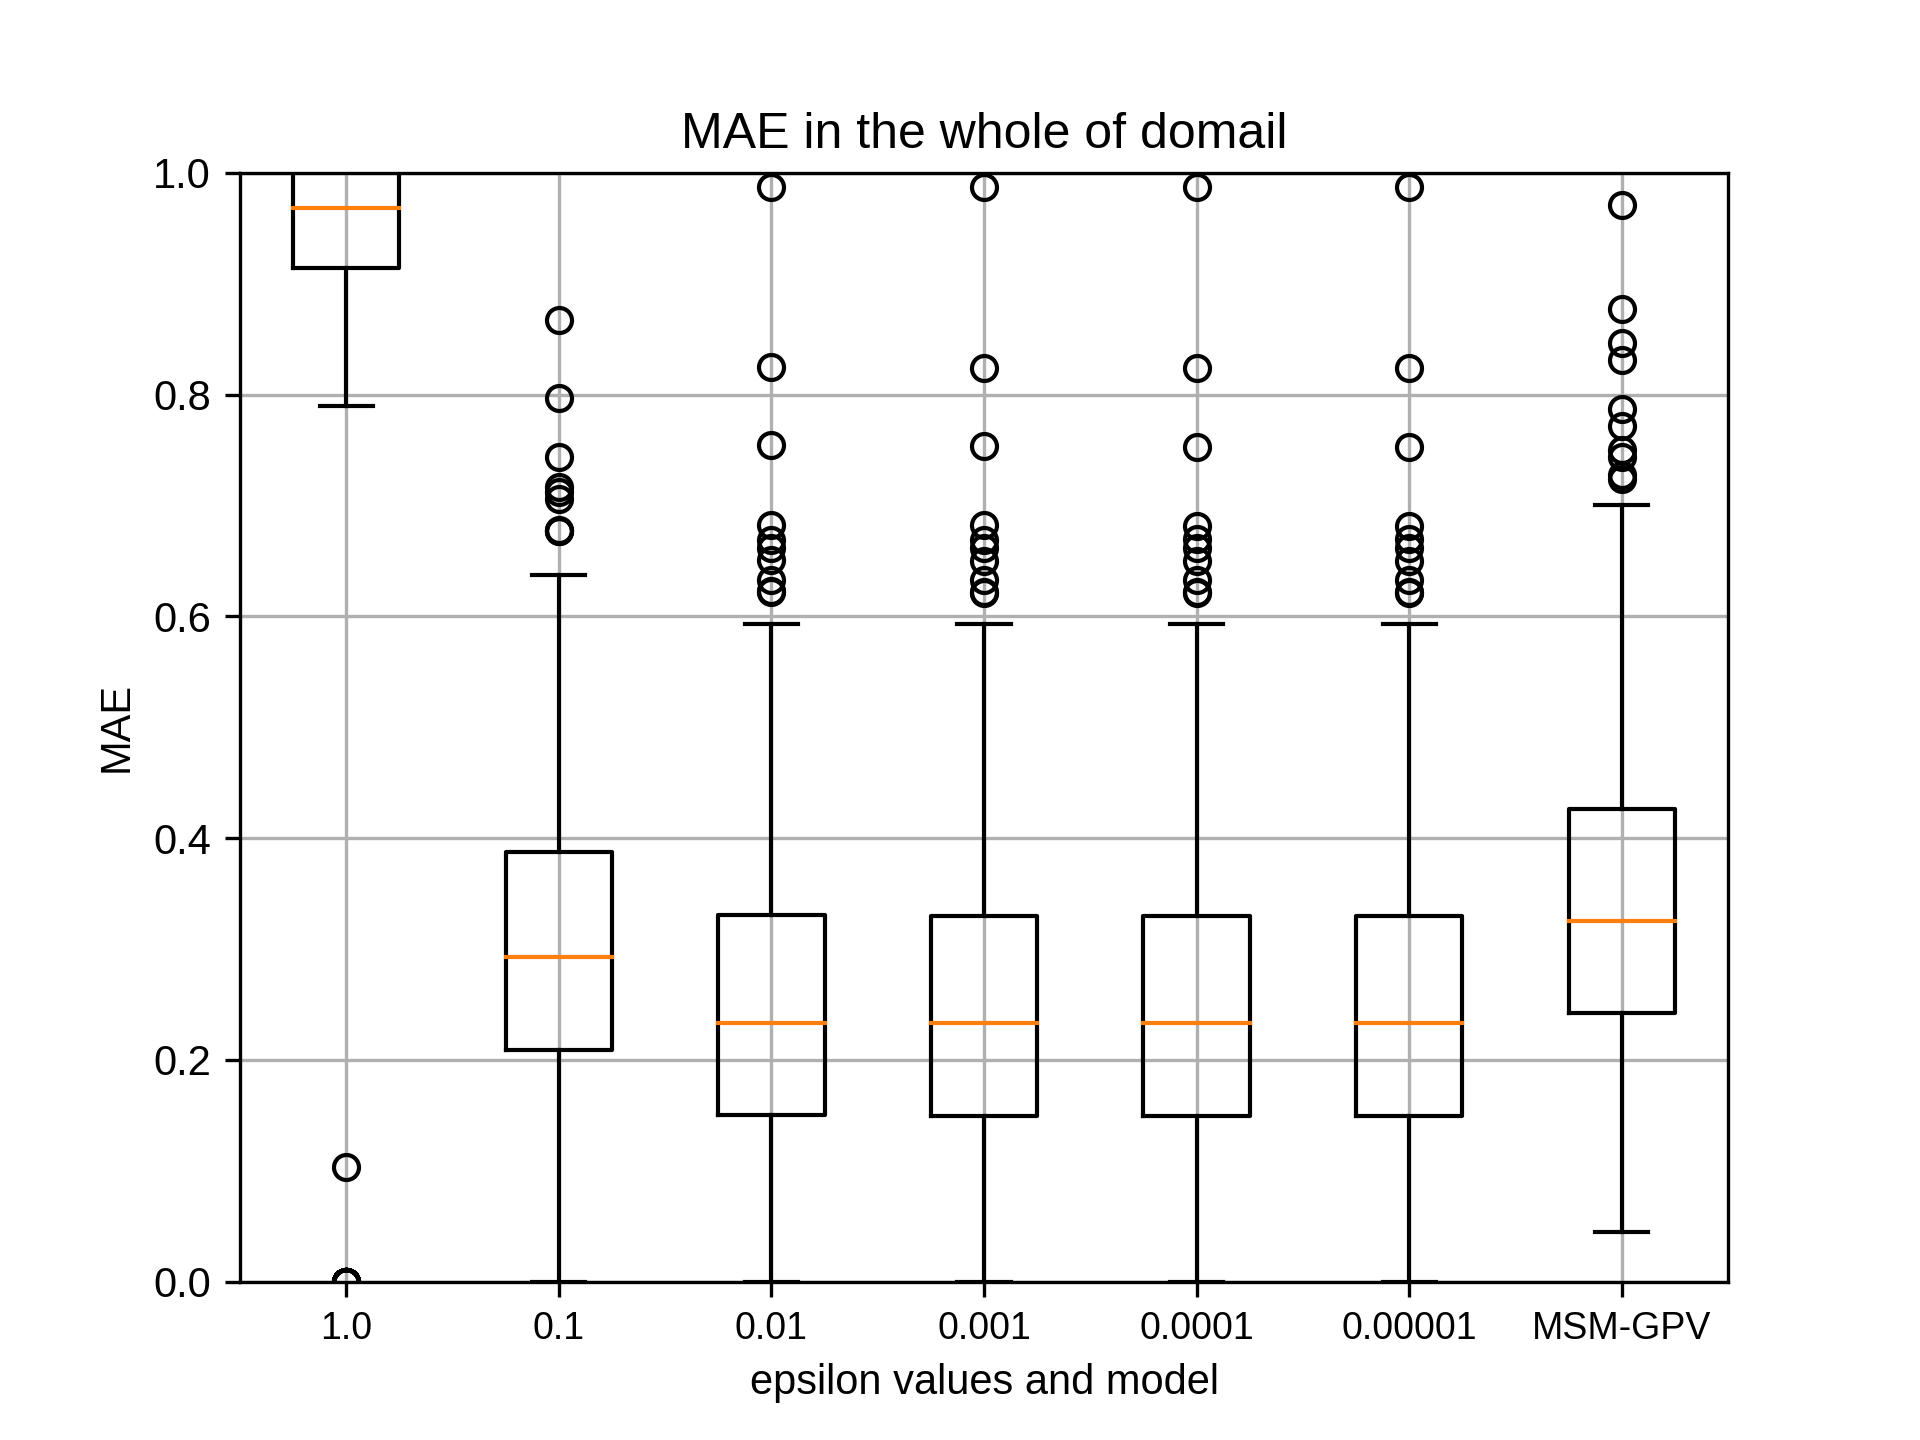
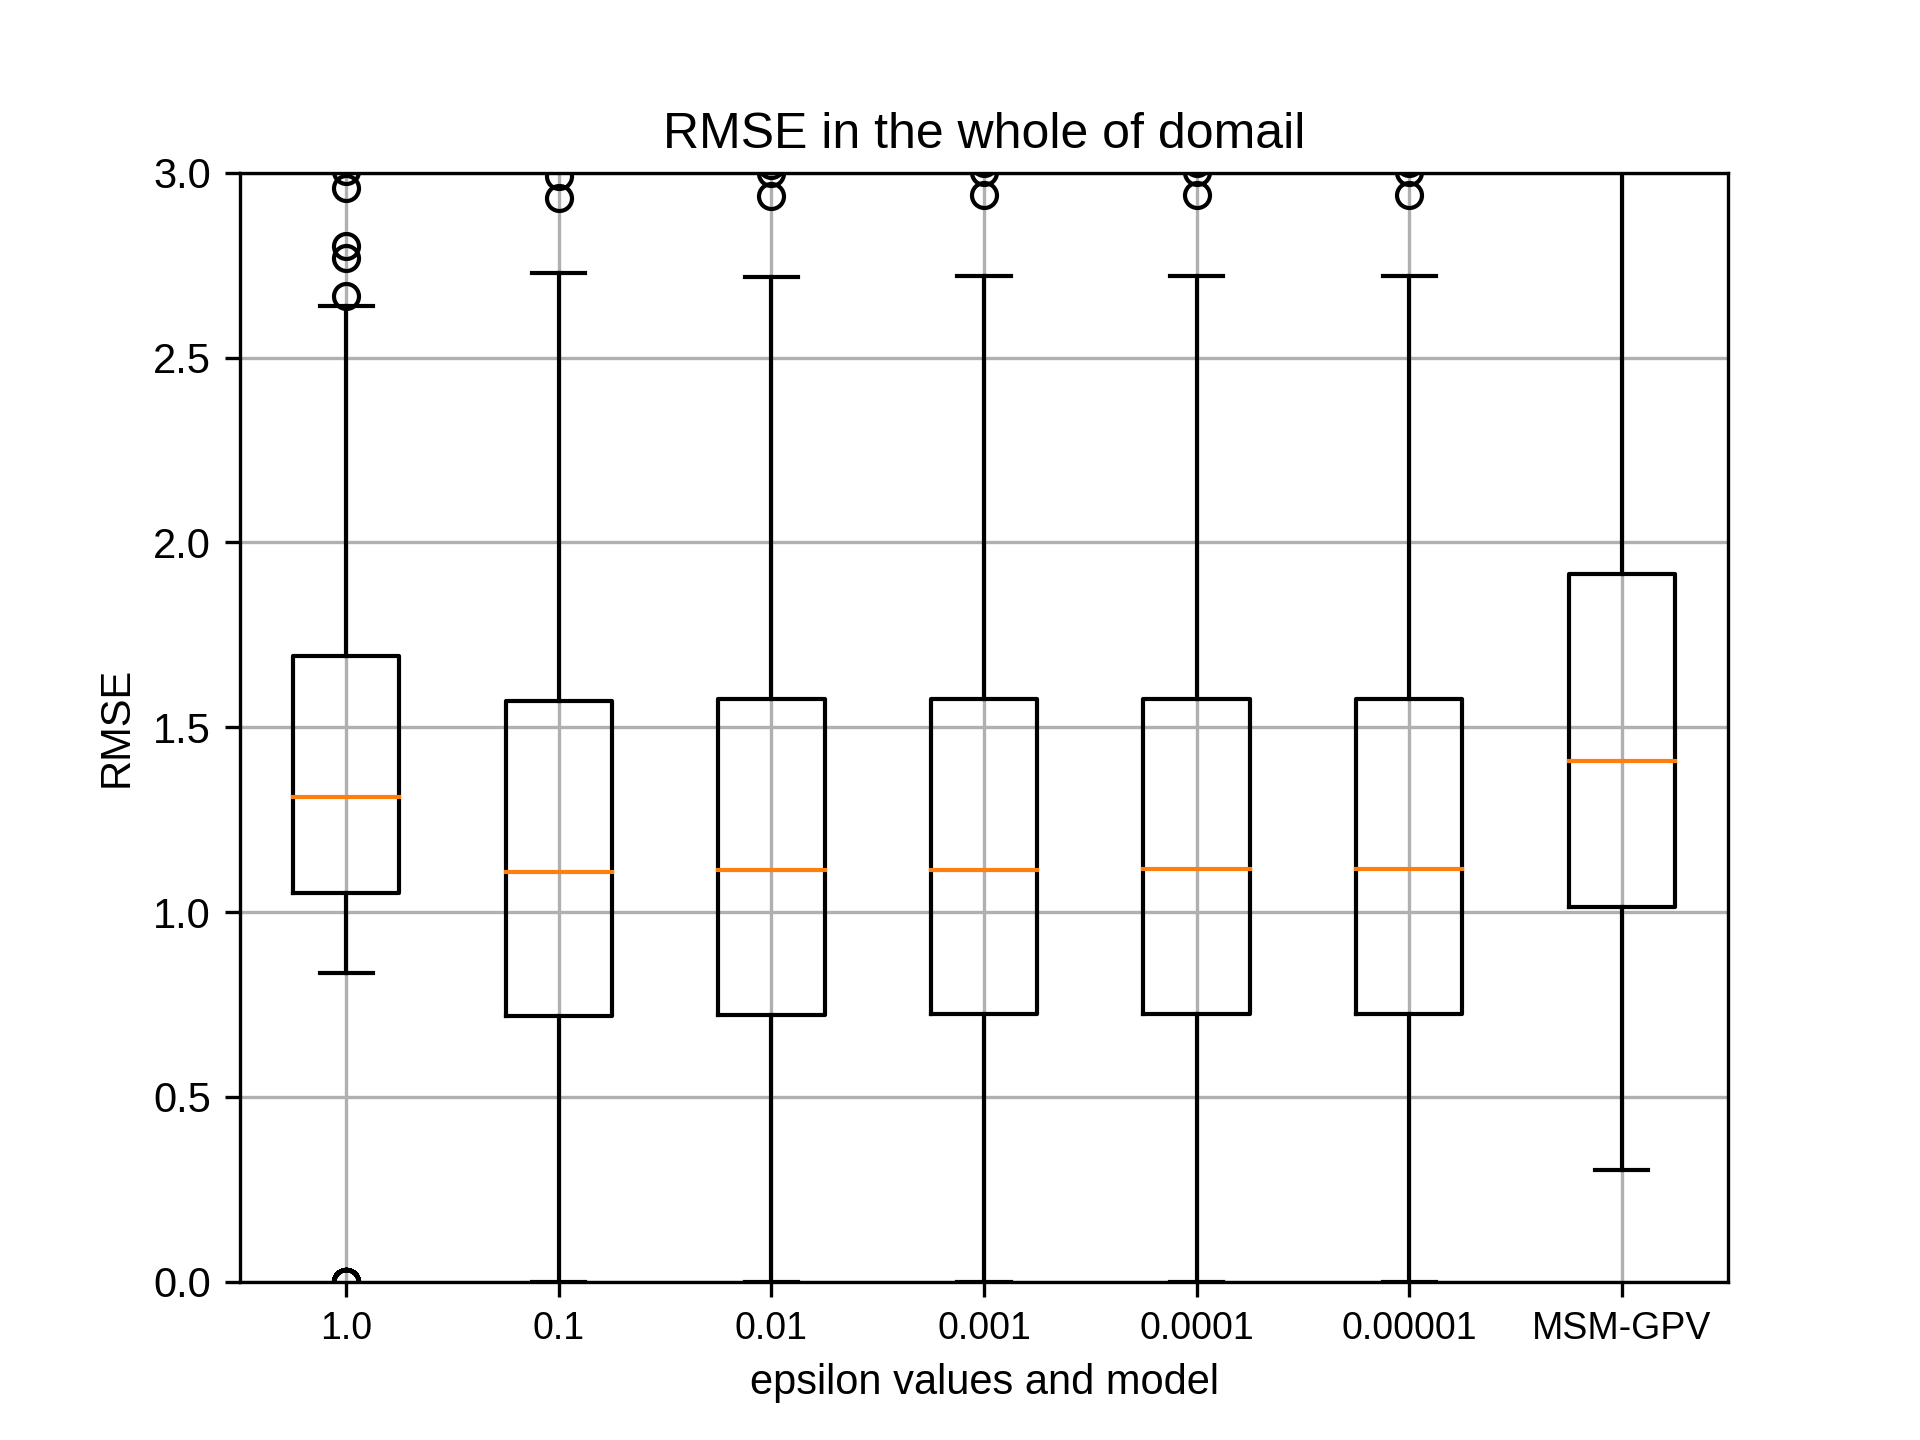
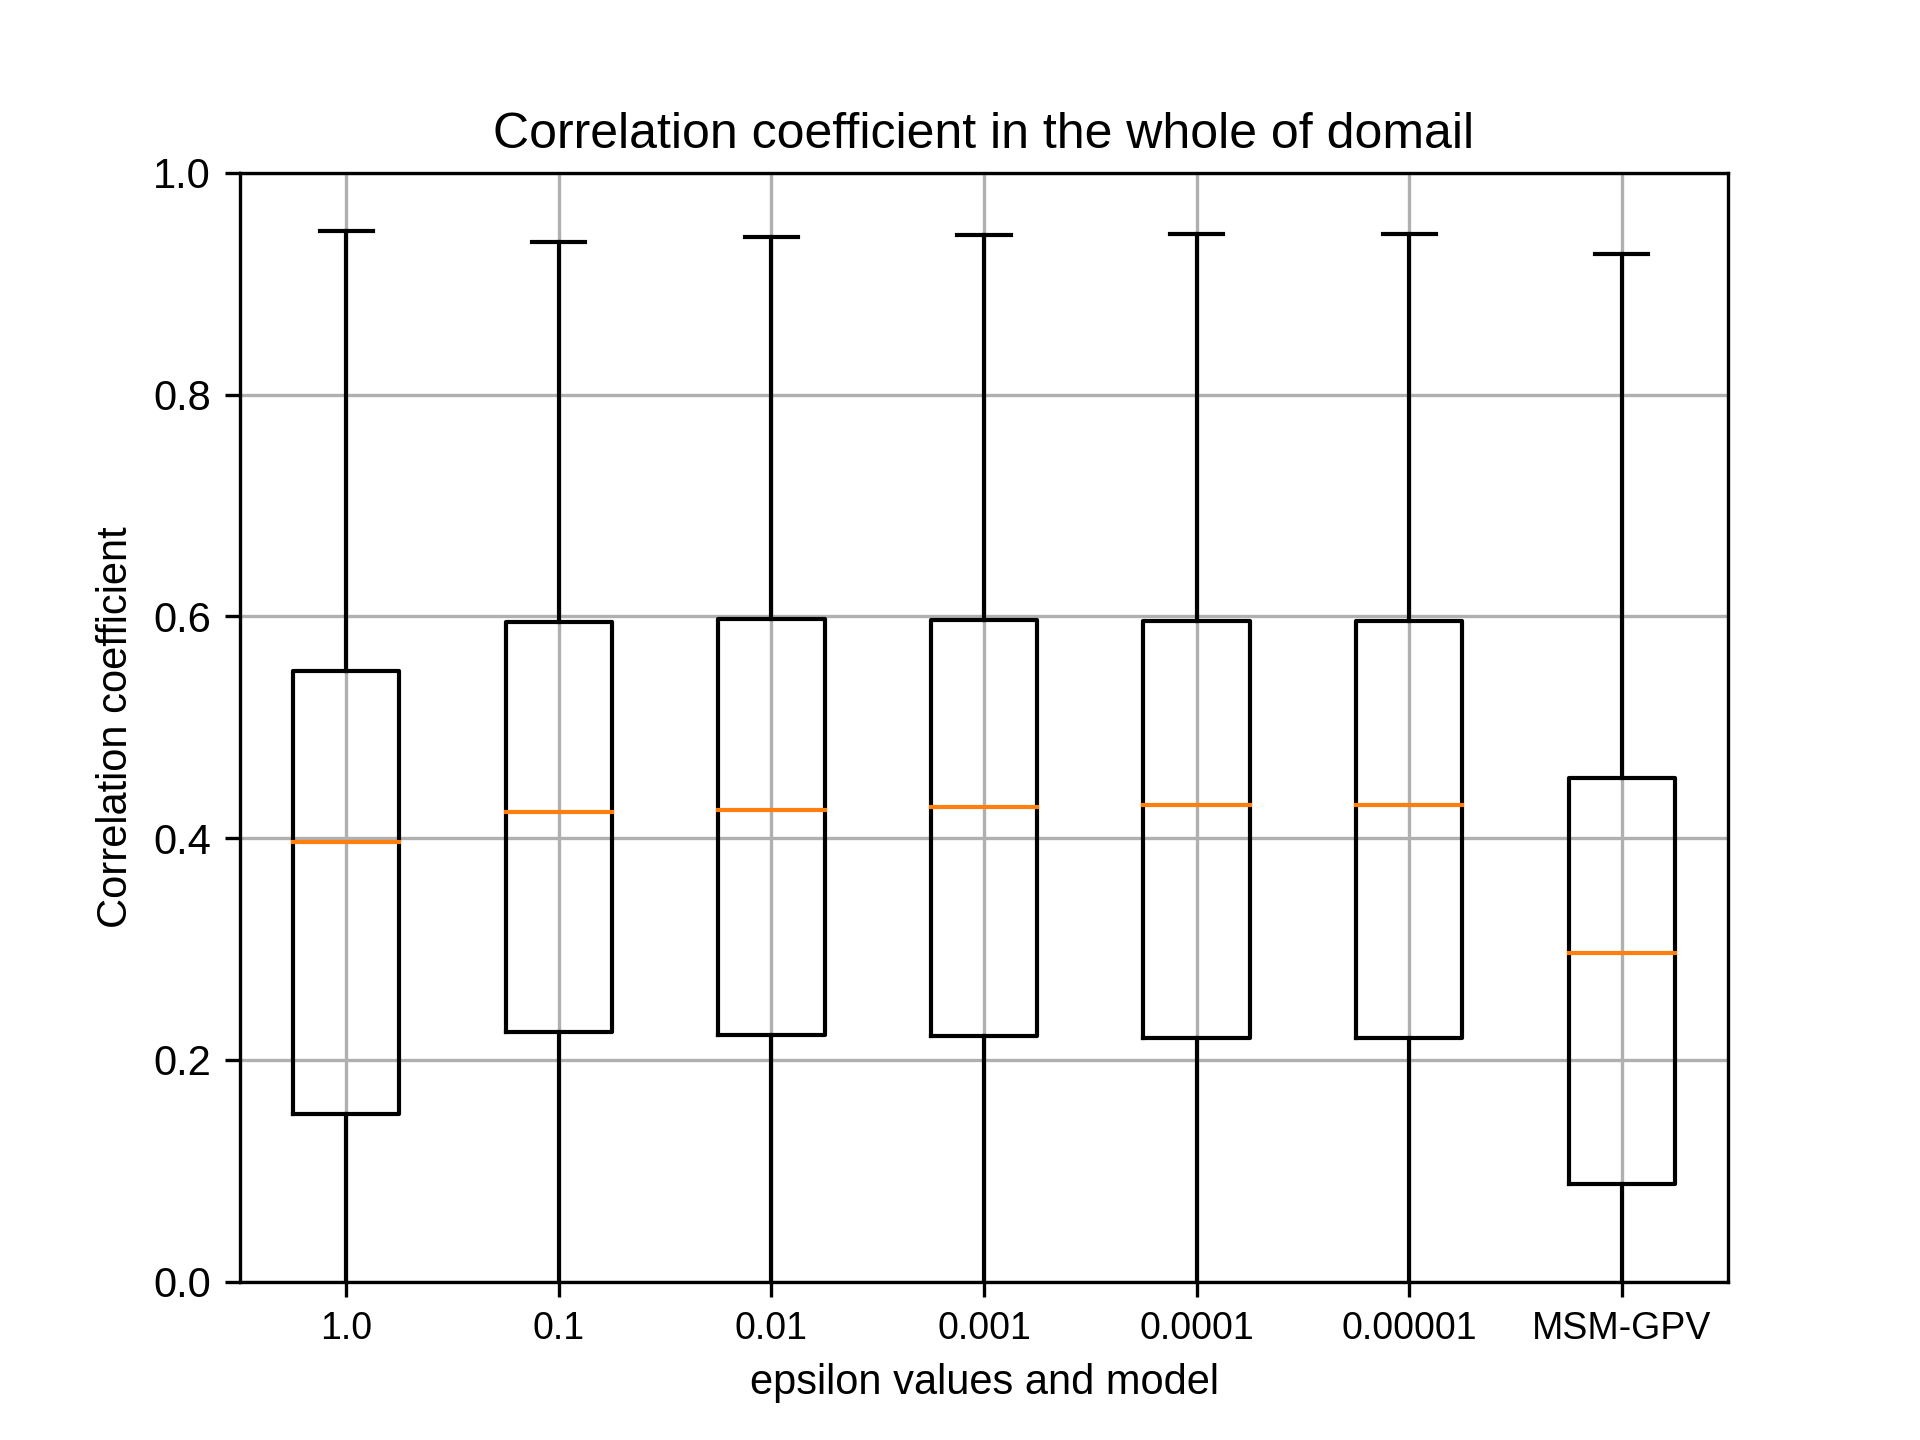
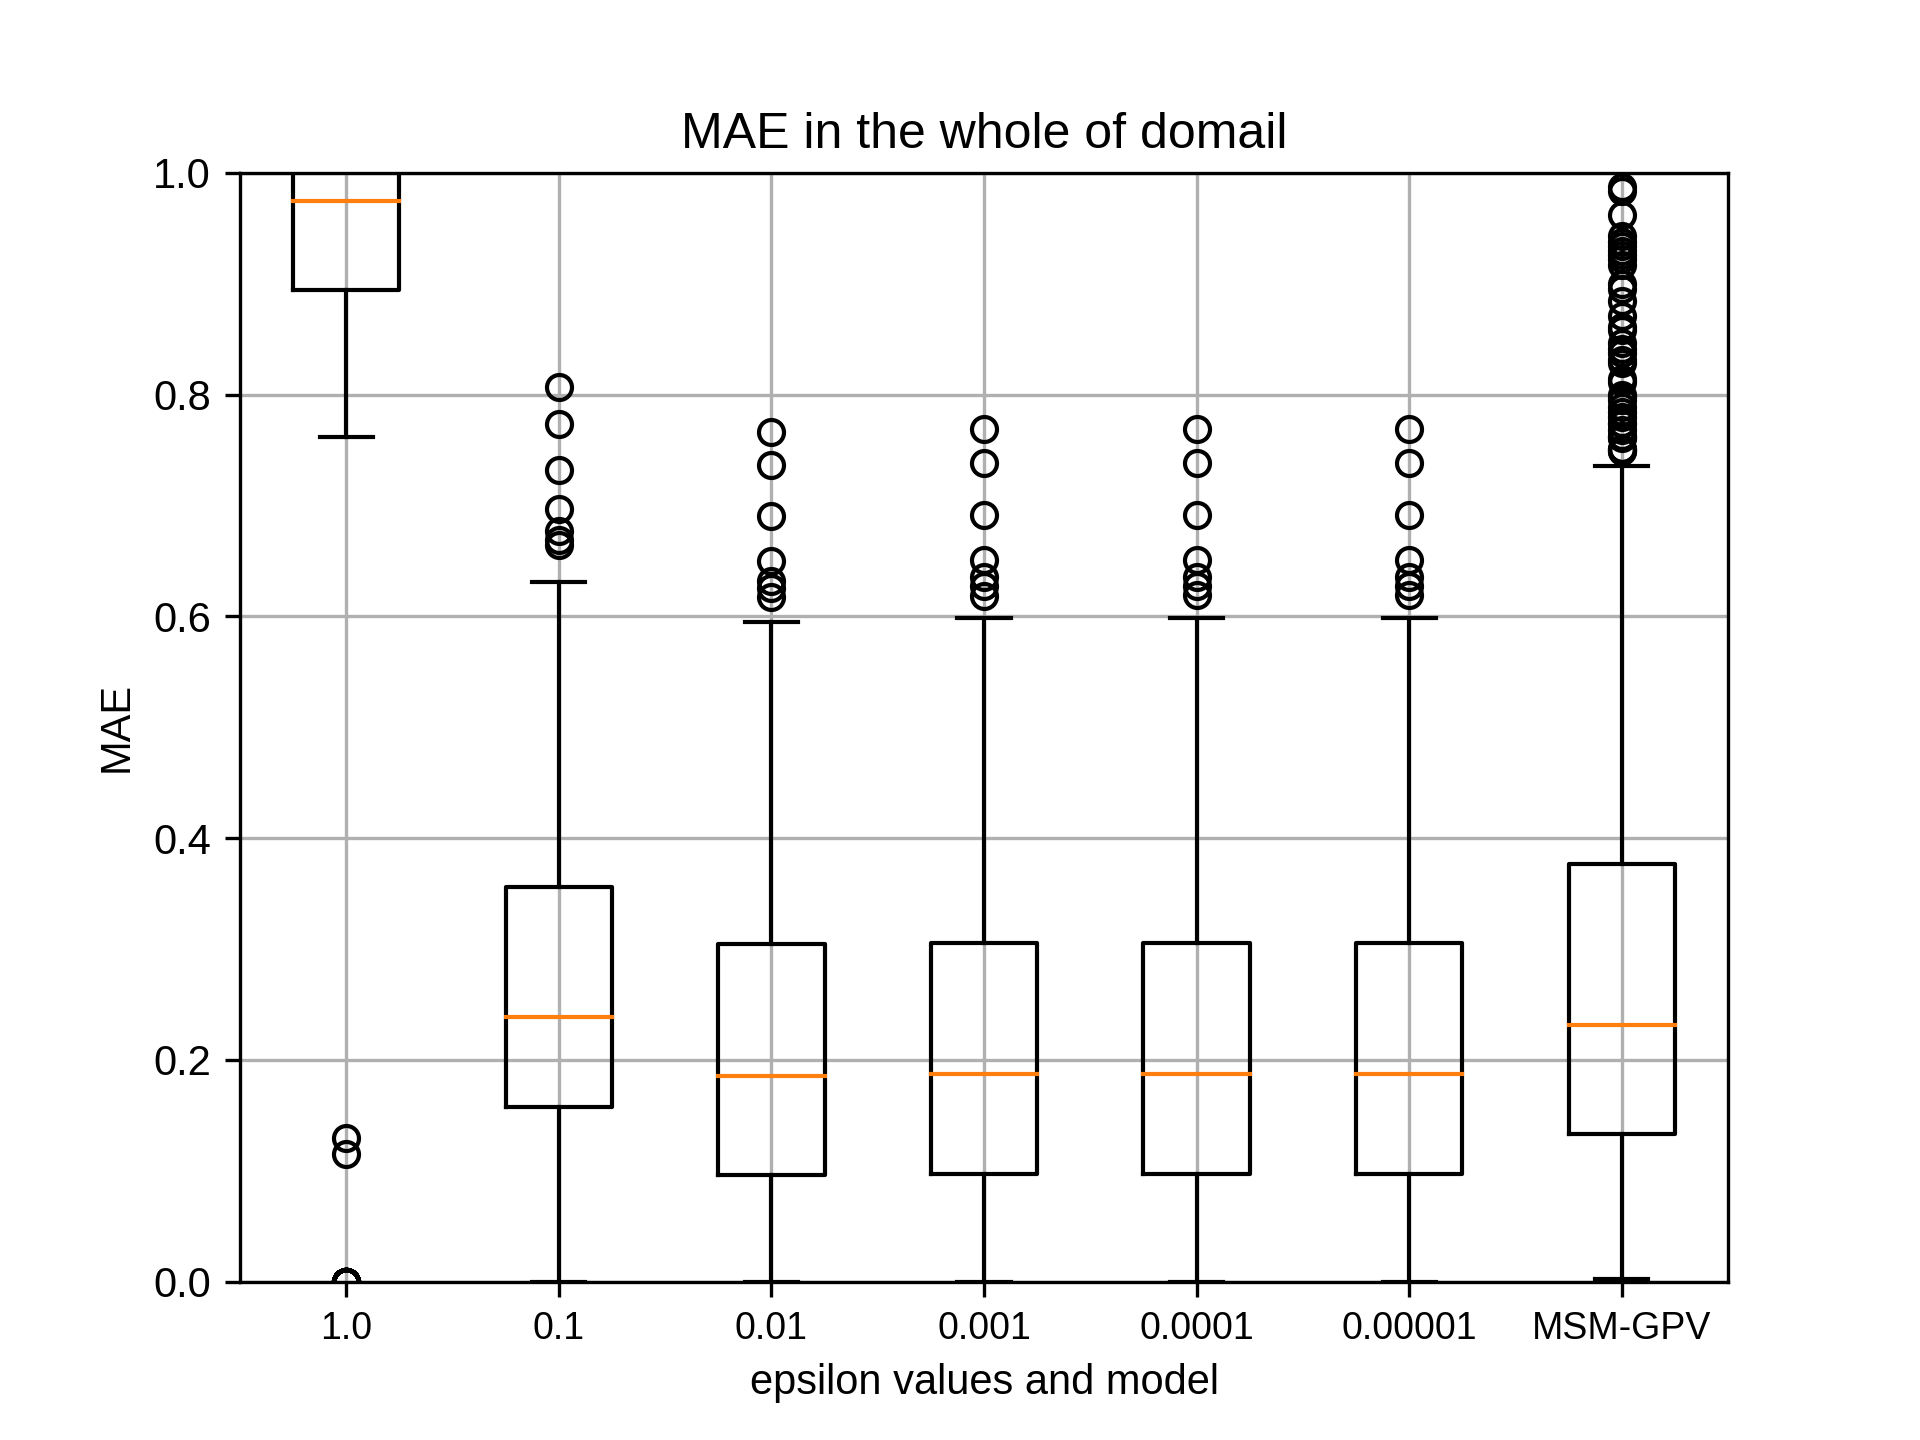
epsilonにつきまして結果が出ましたのでご報告いたします。
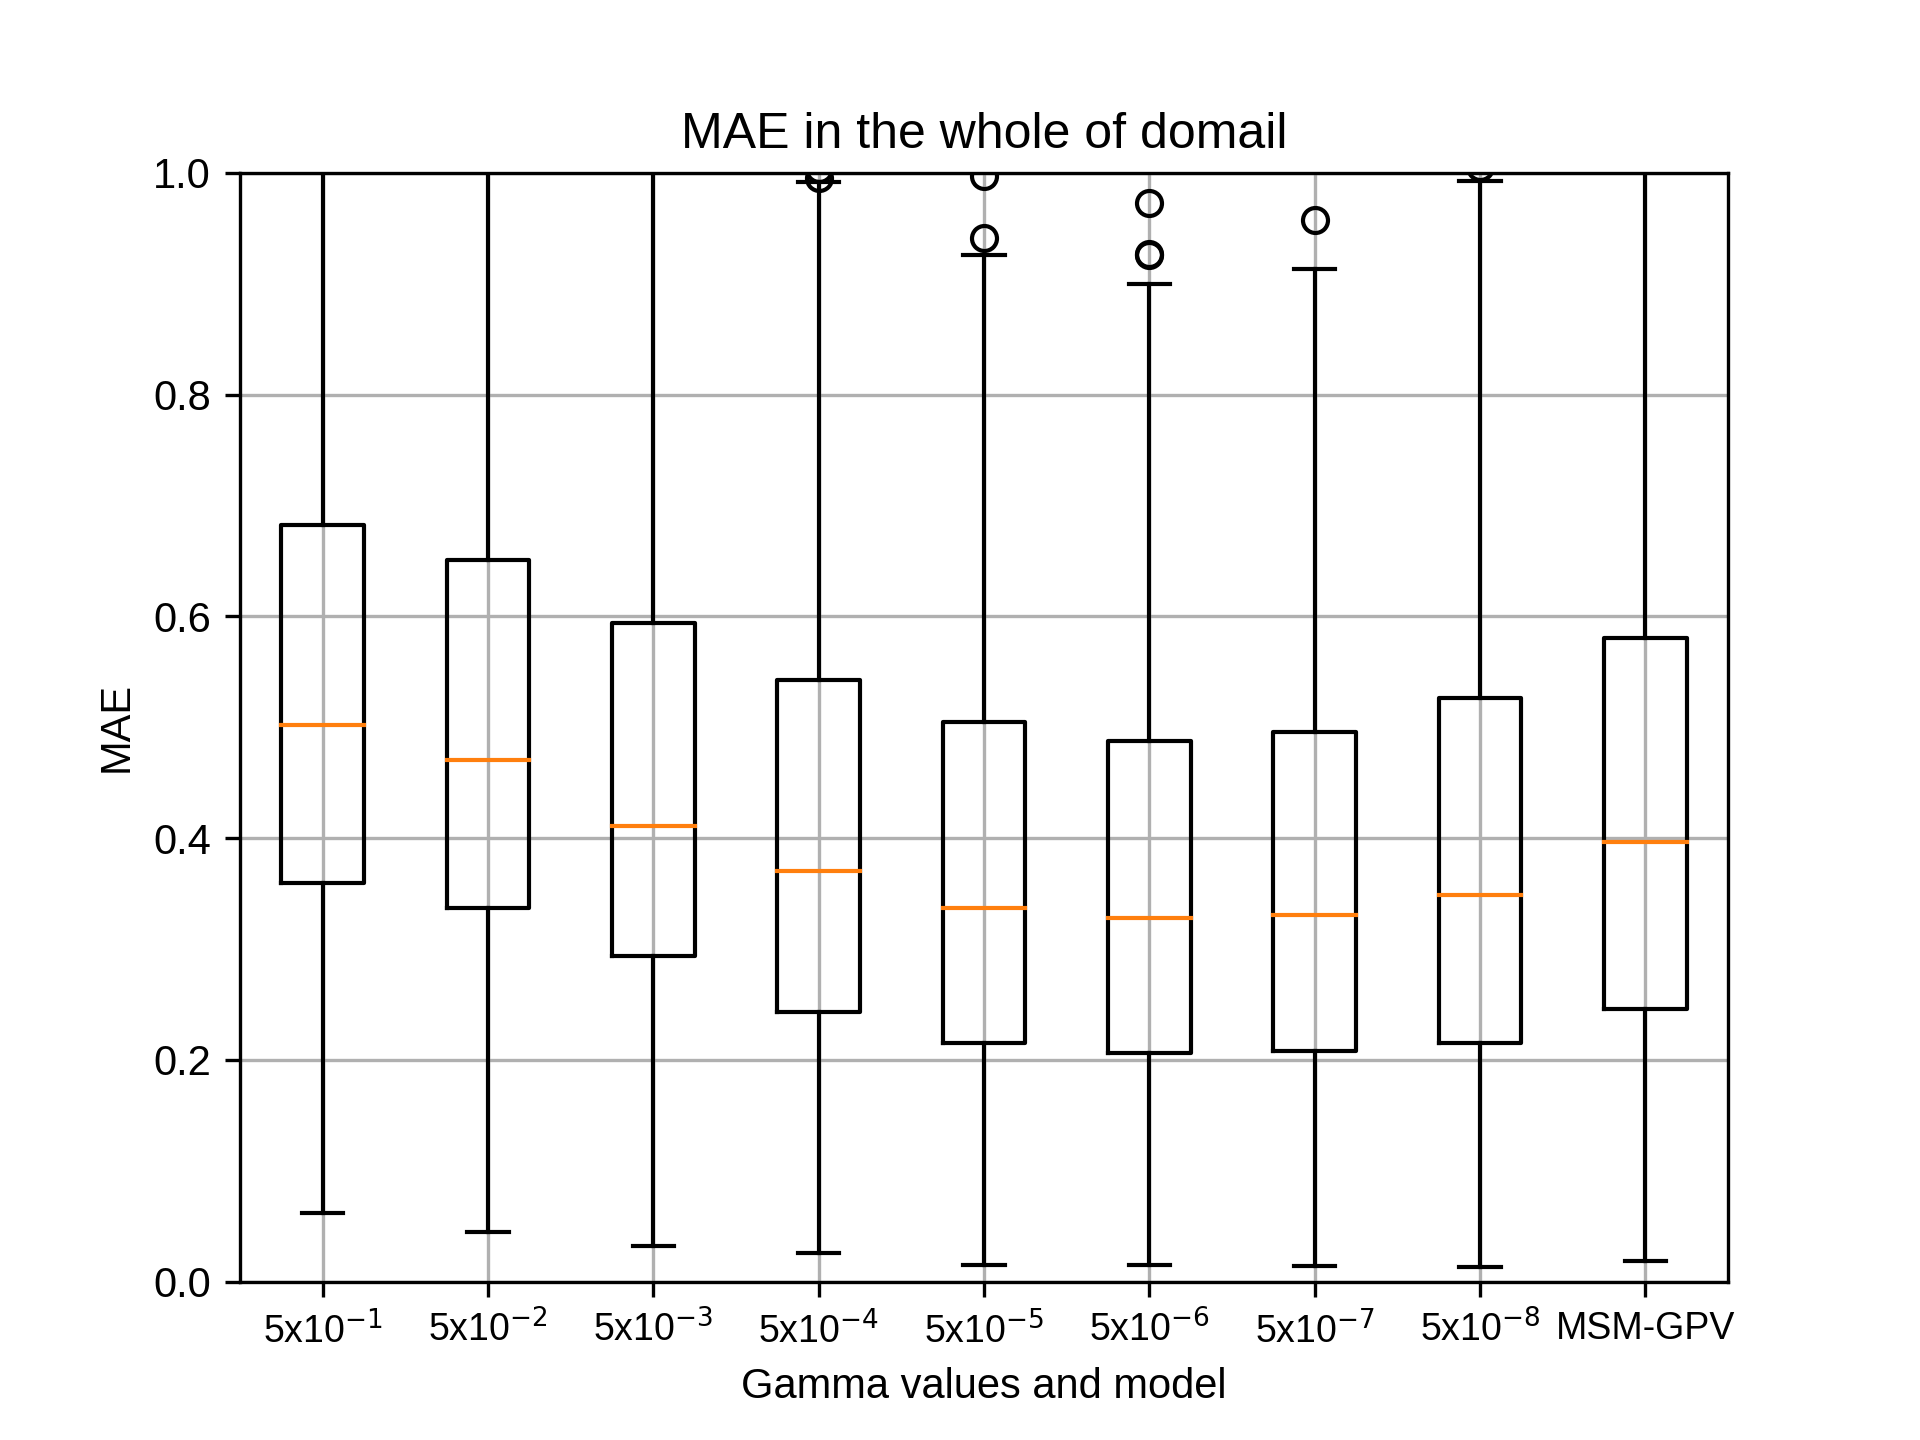
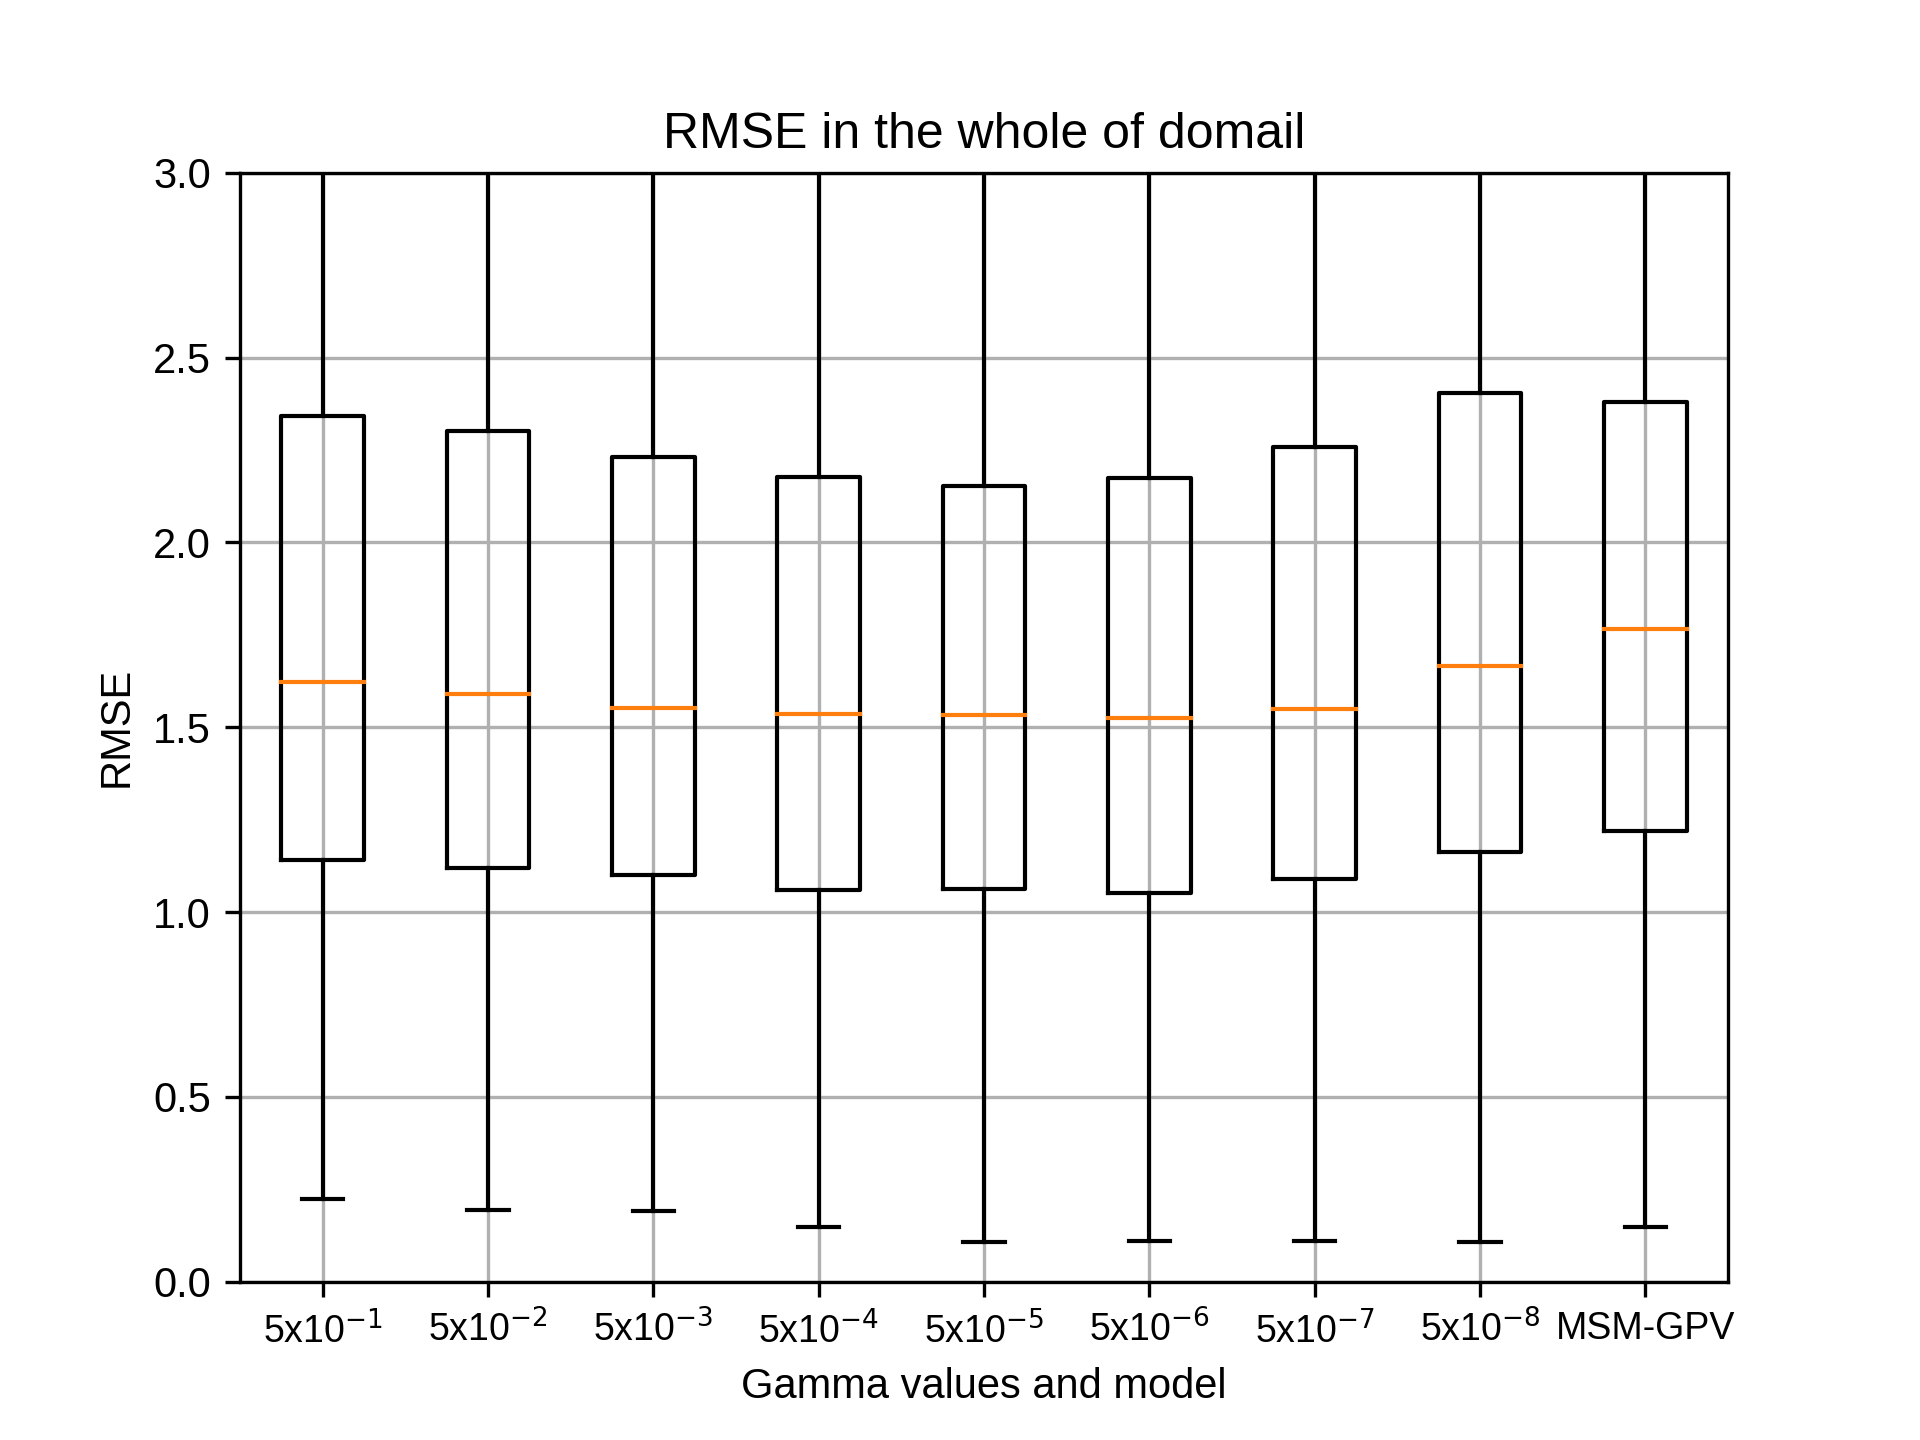
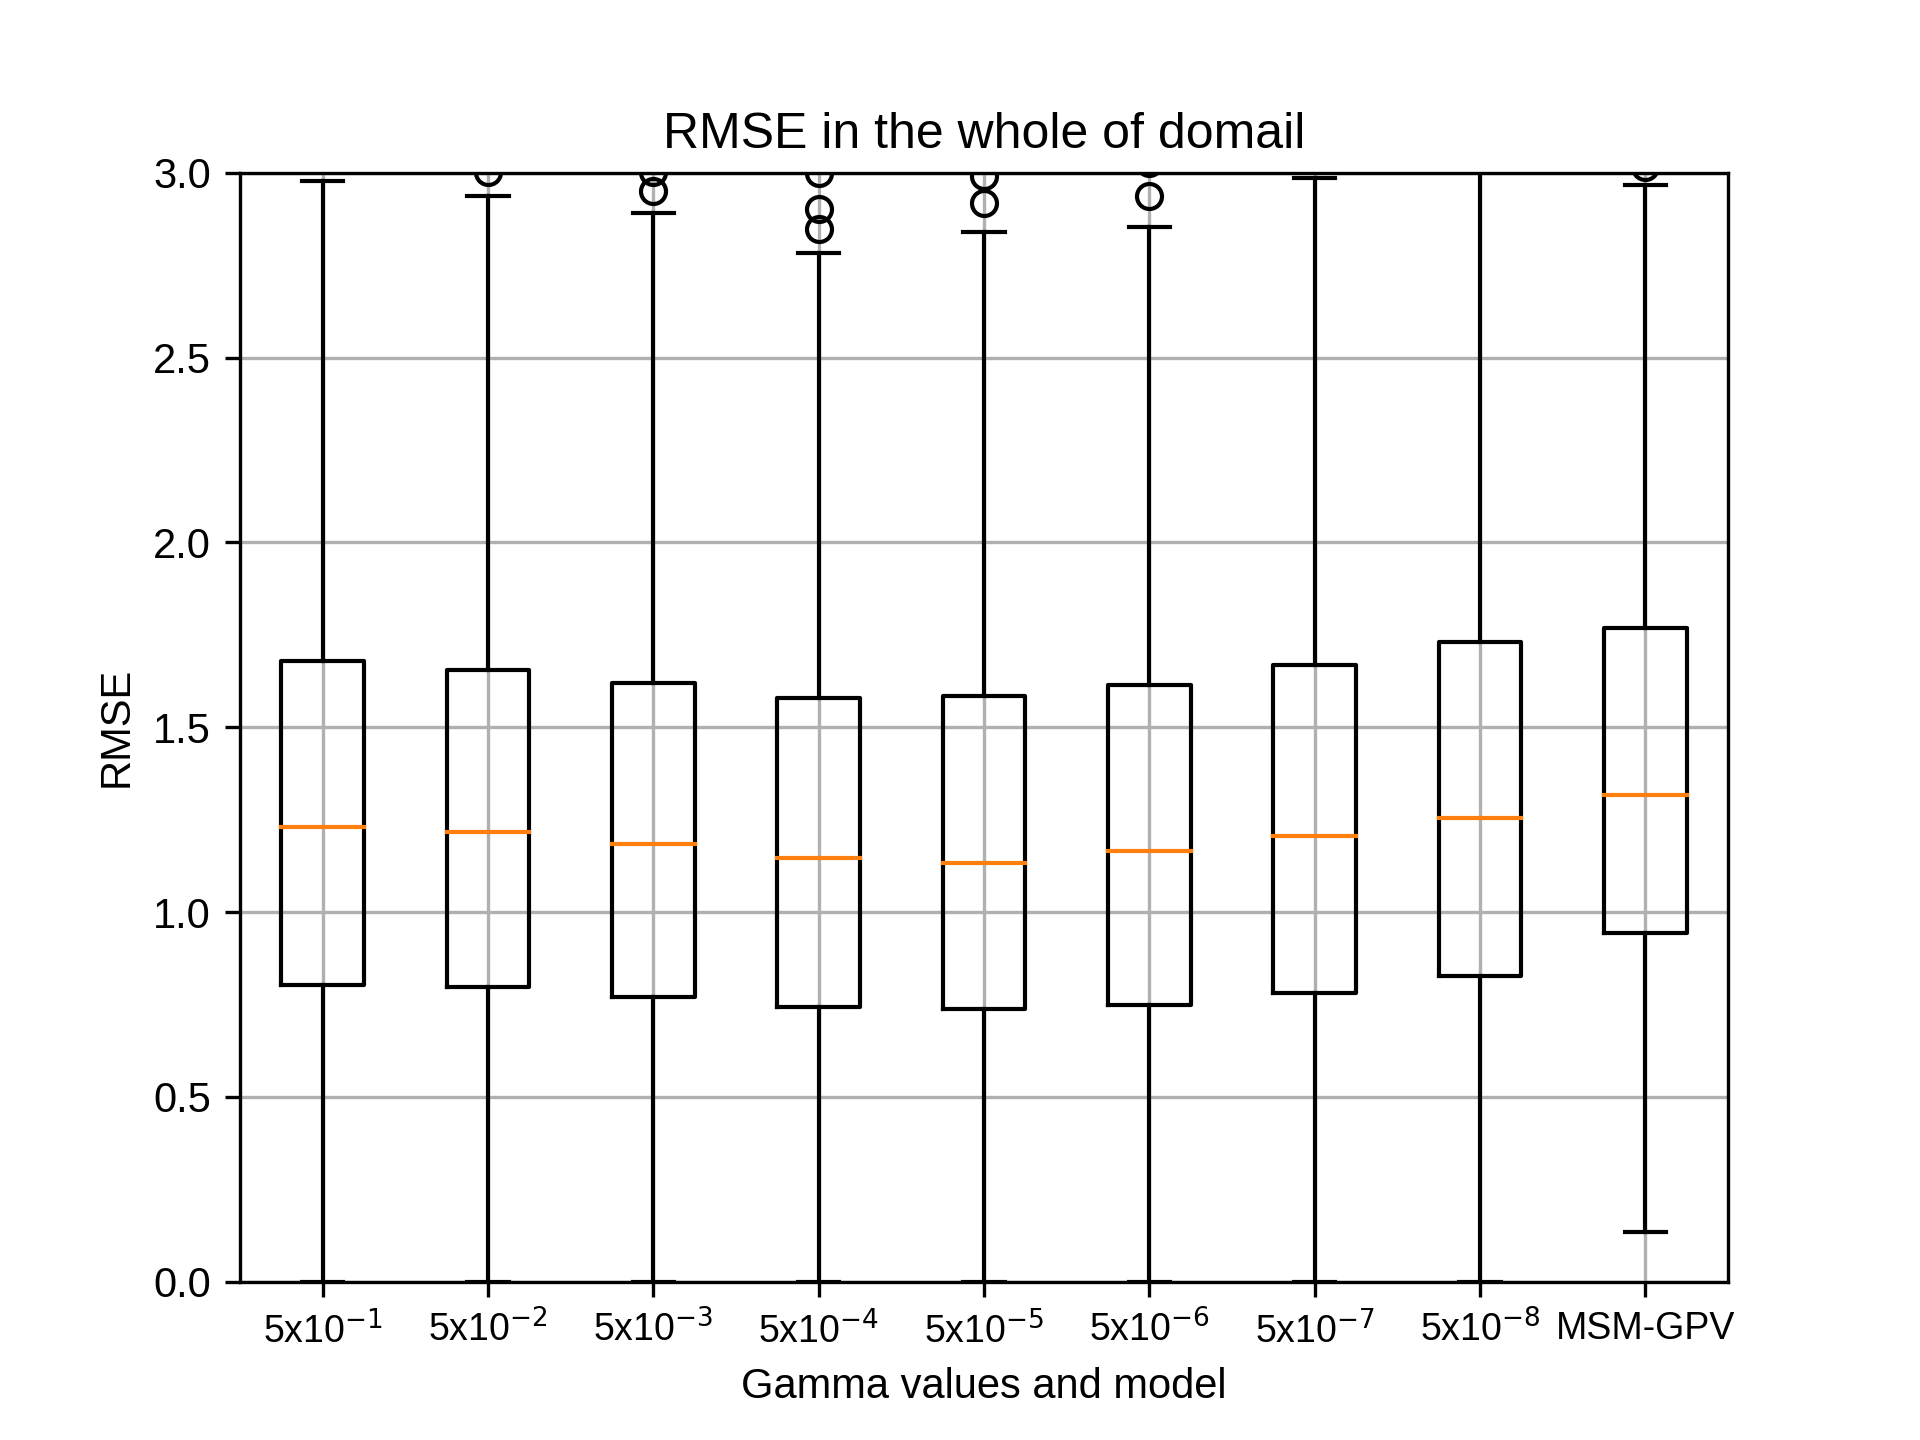
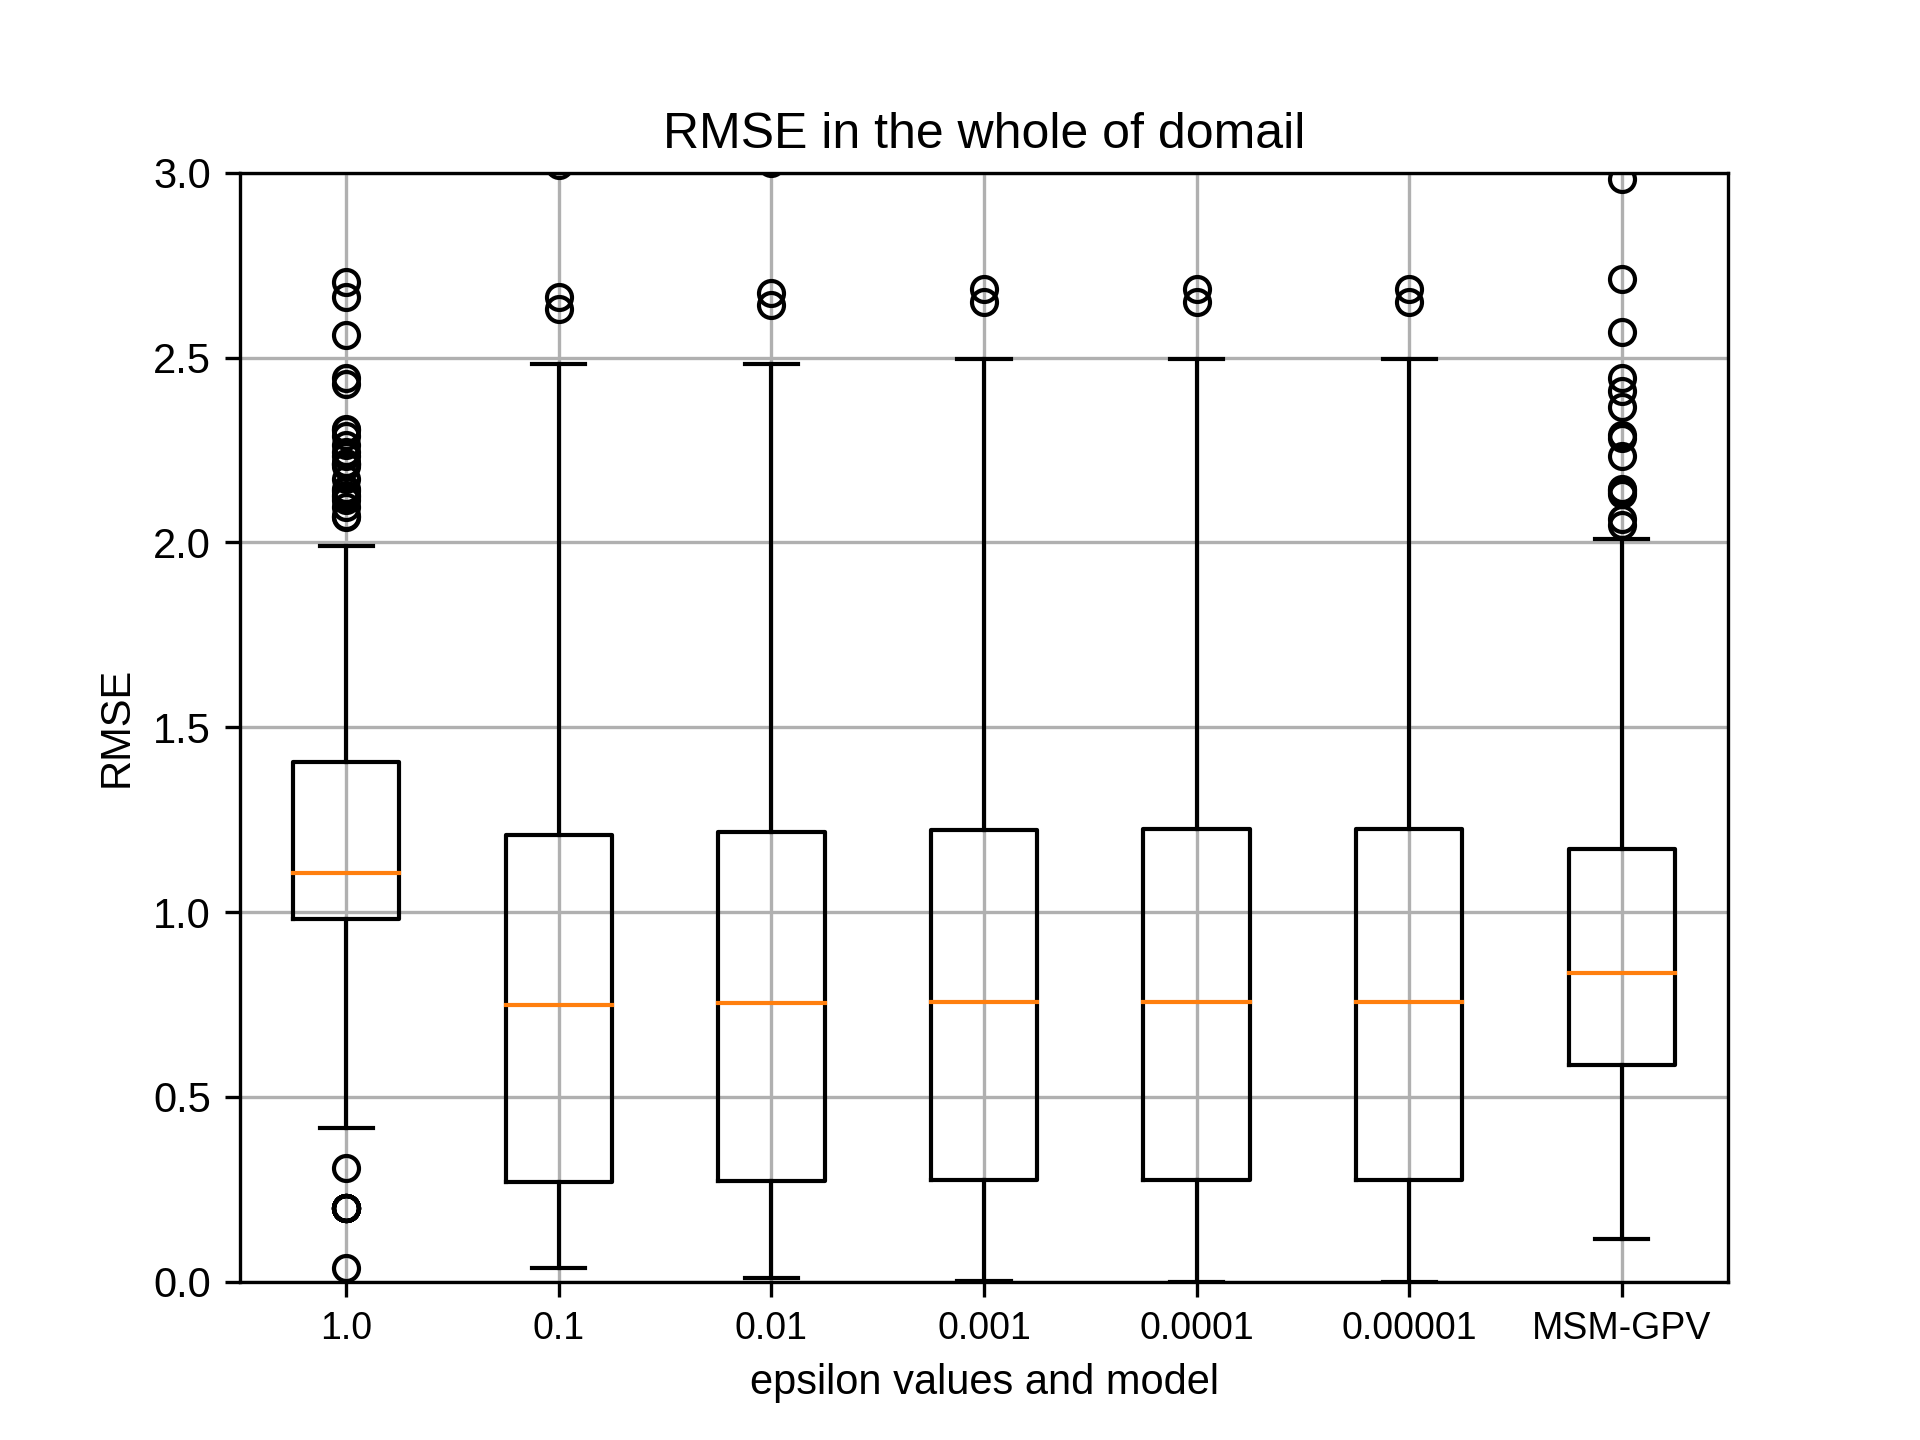
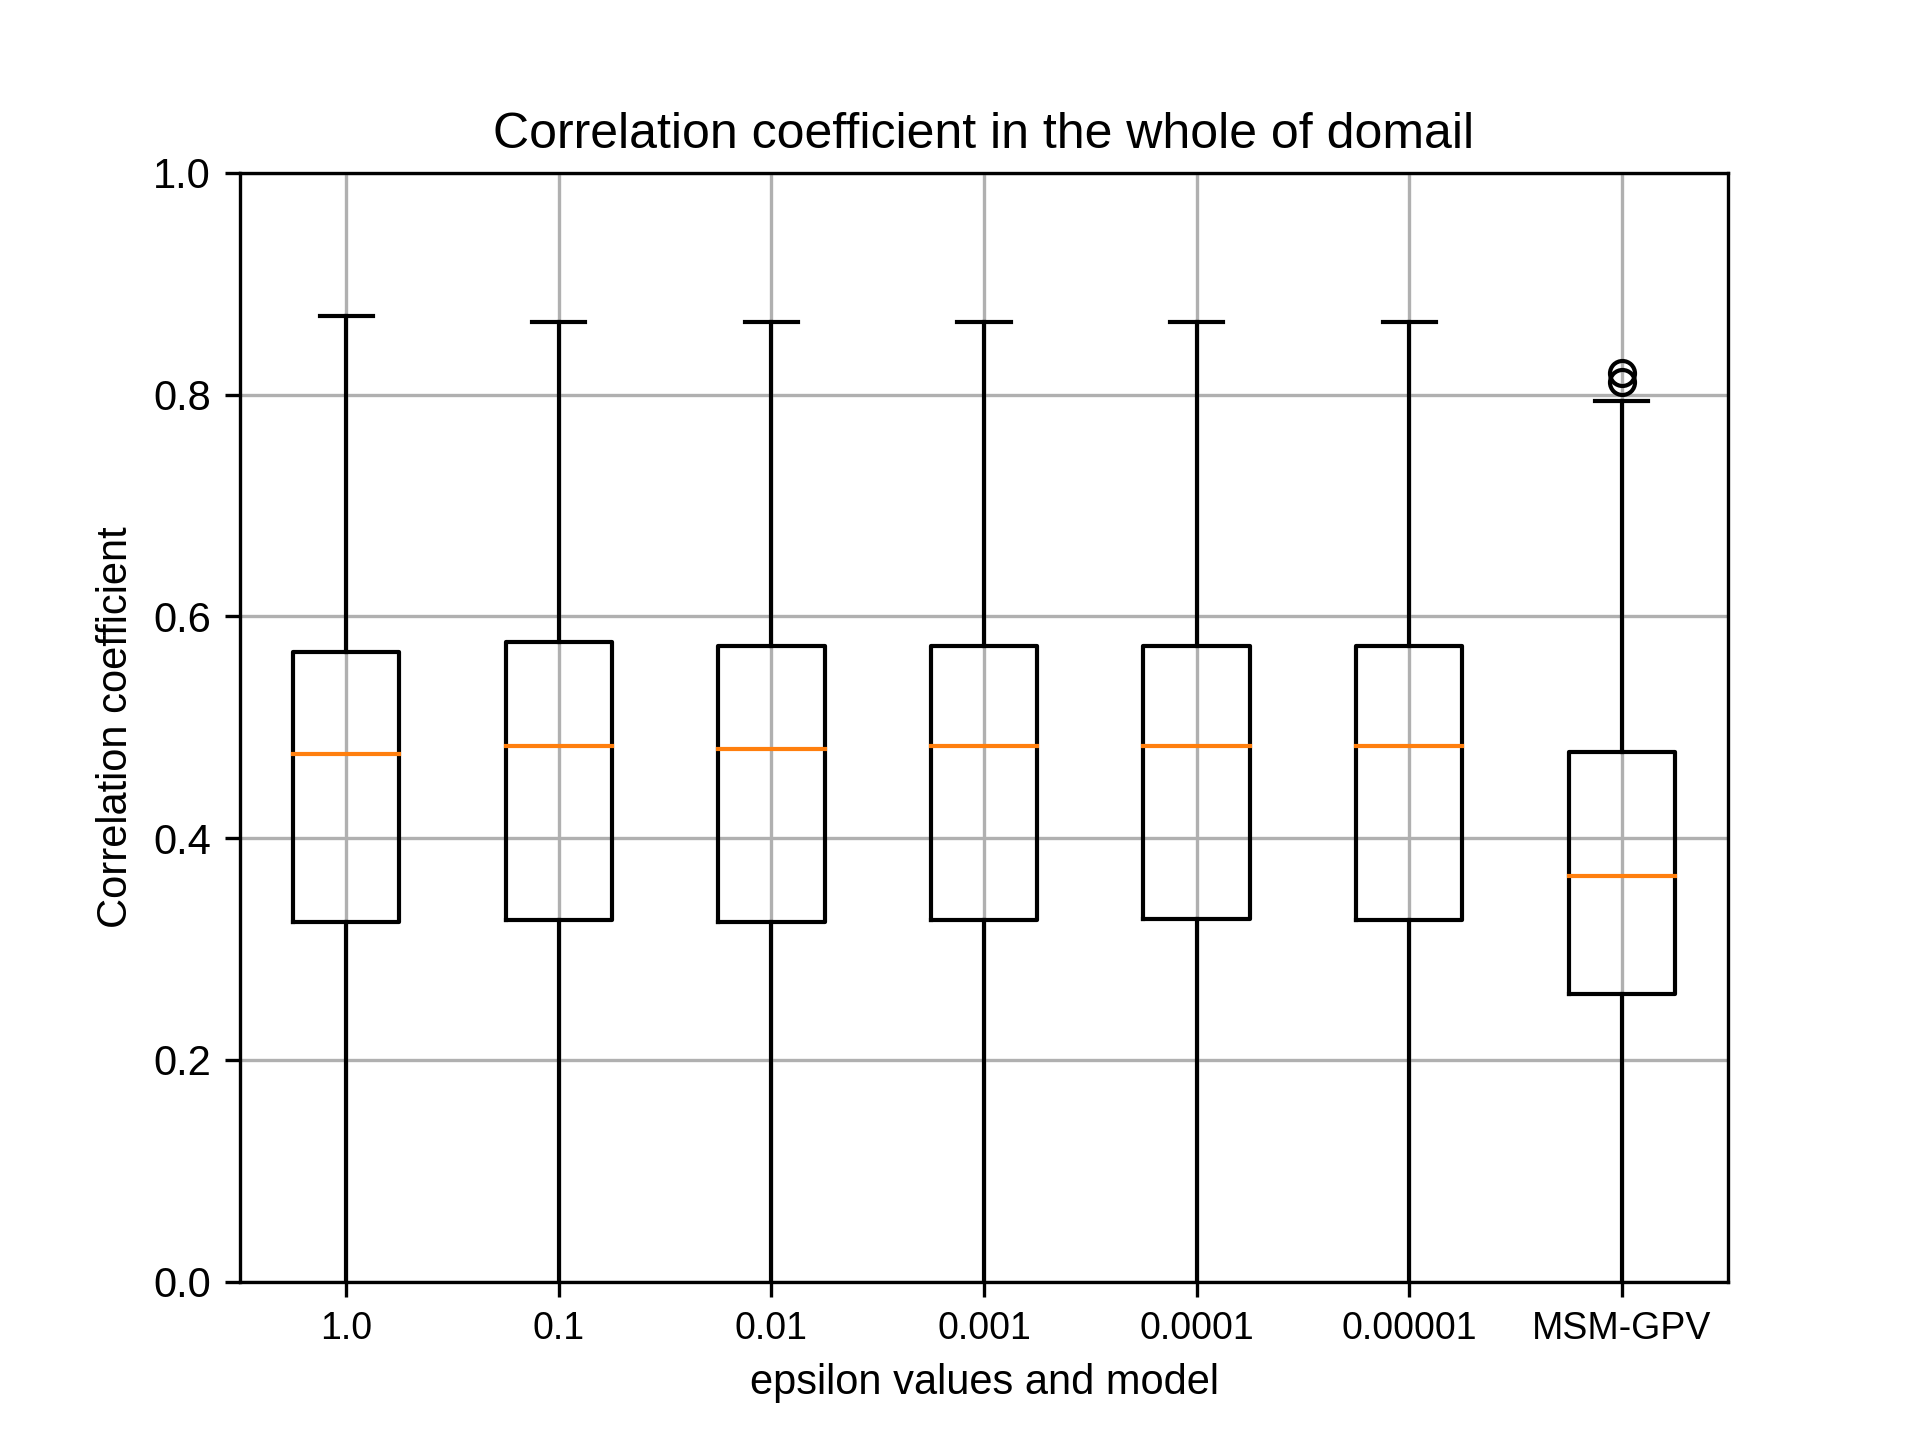
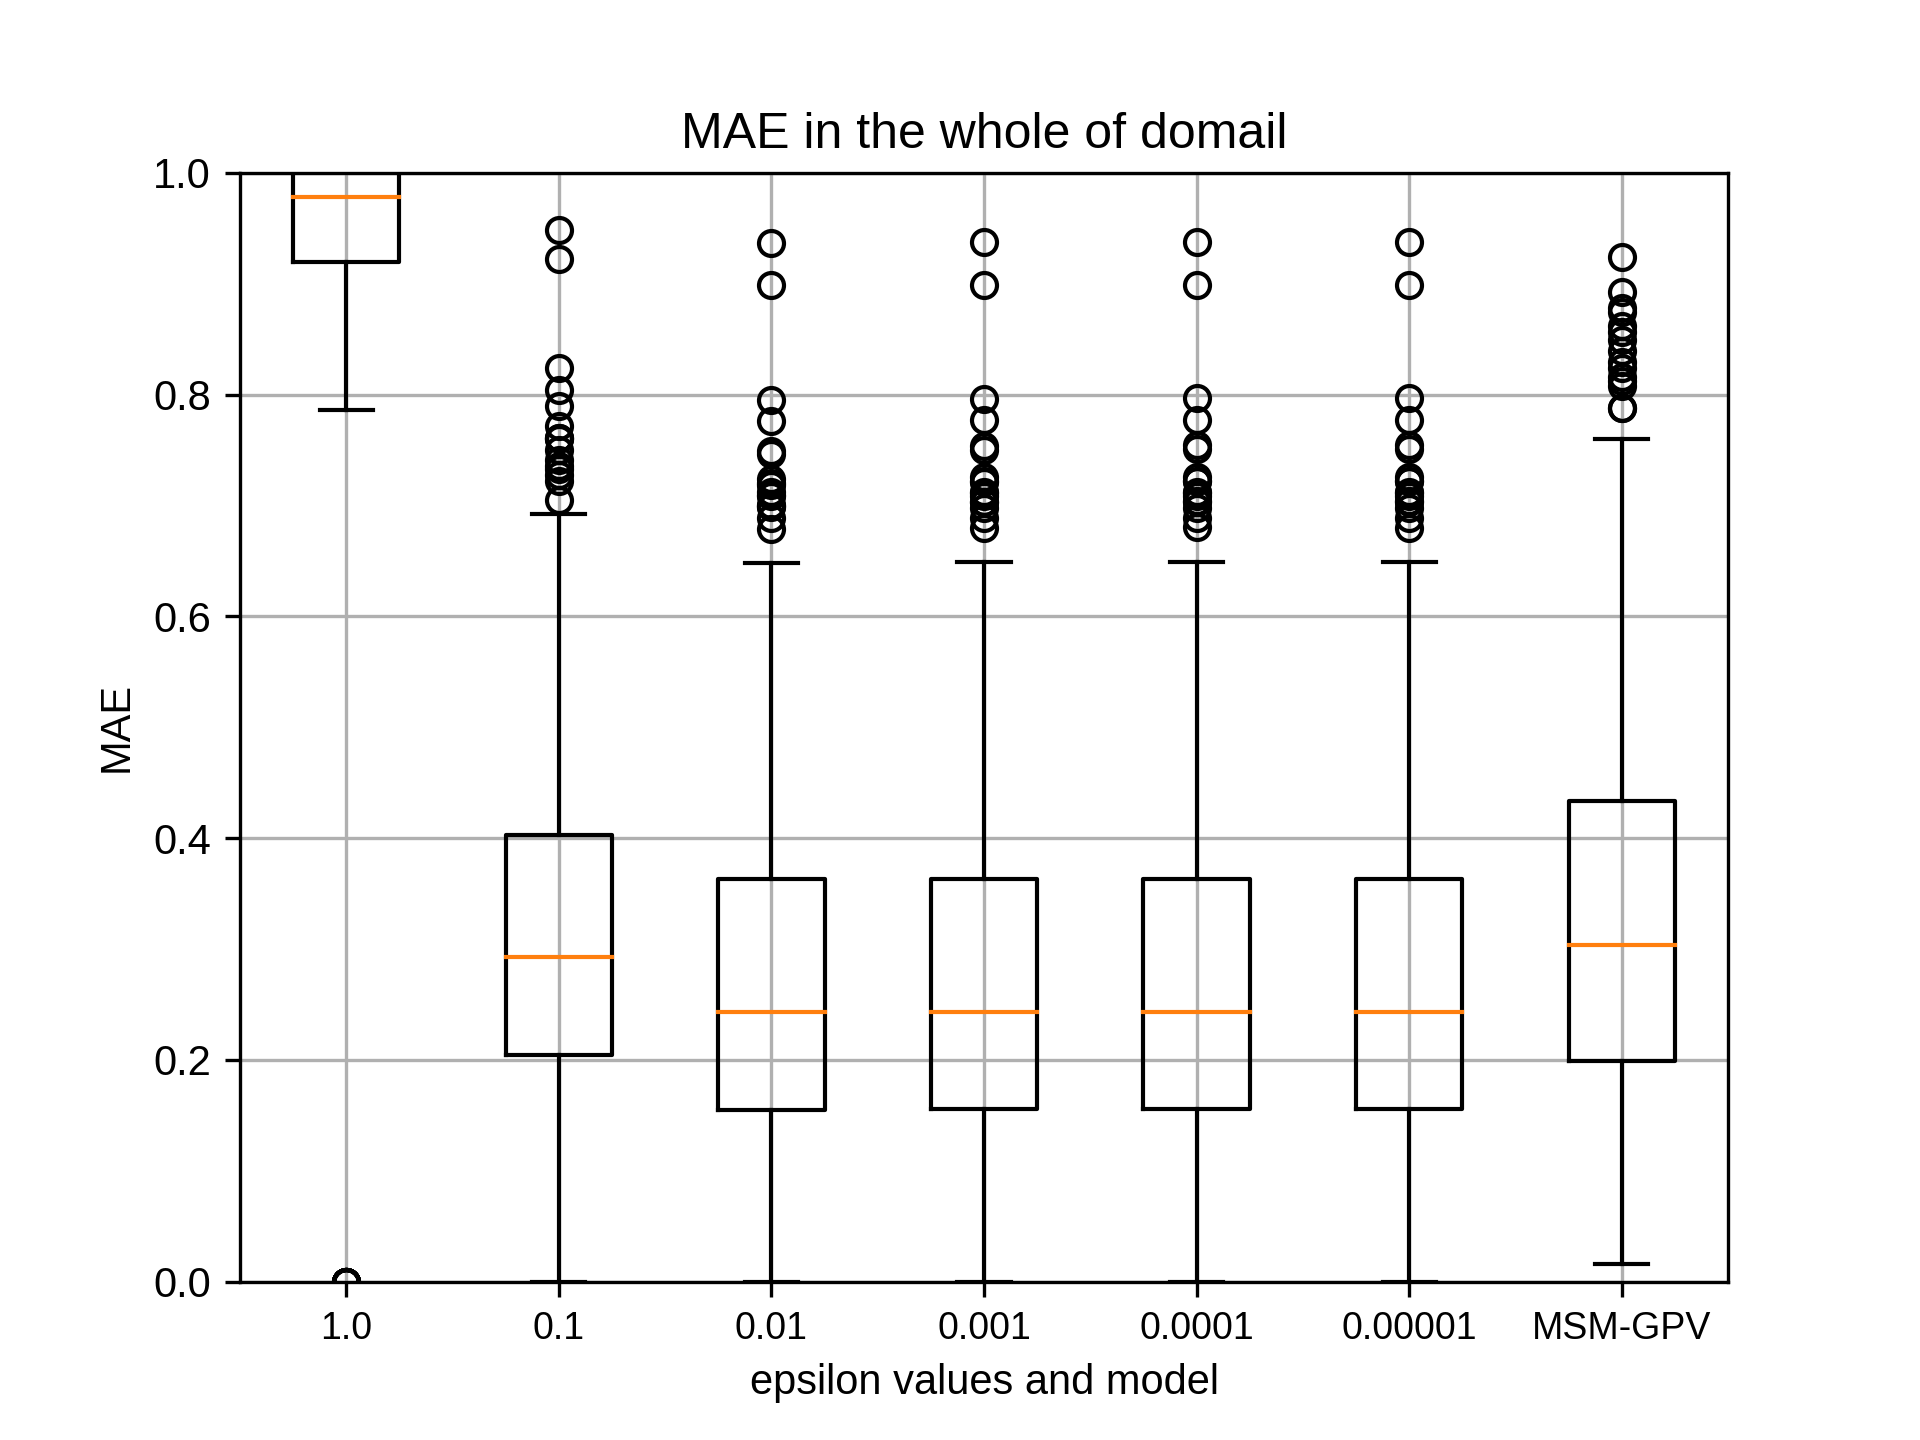
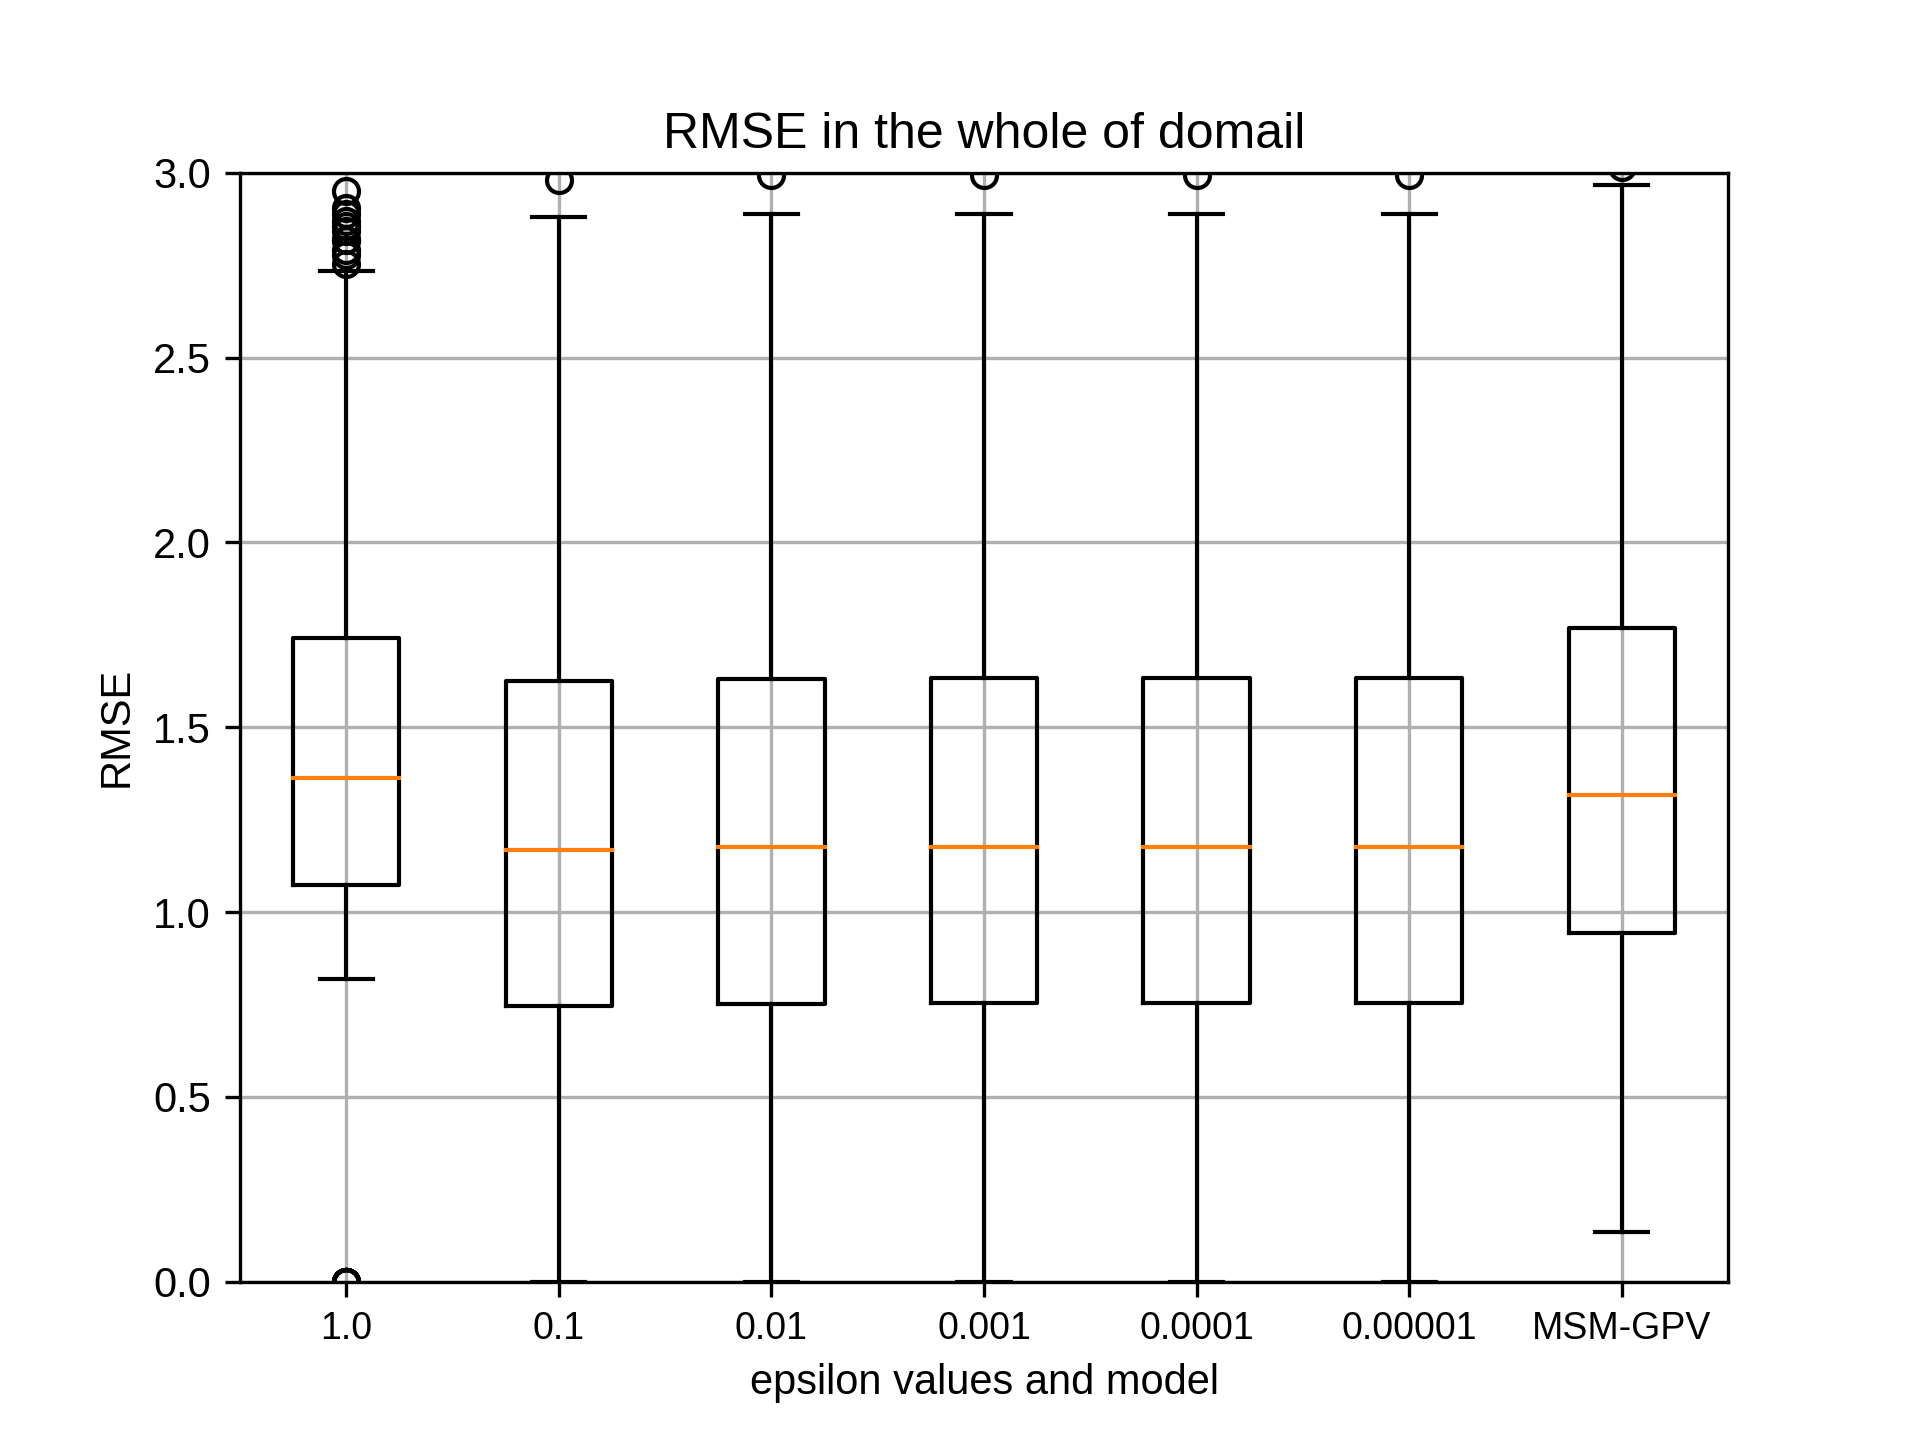
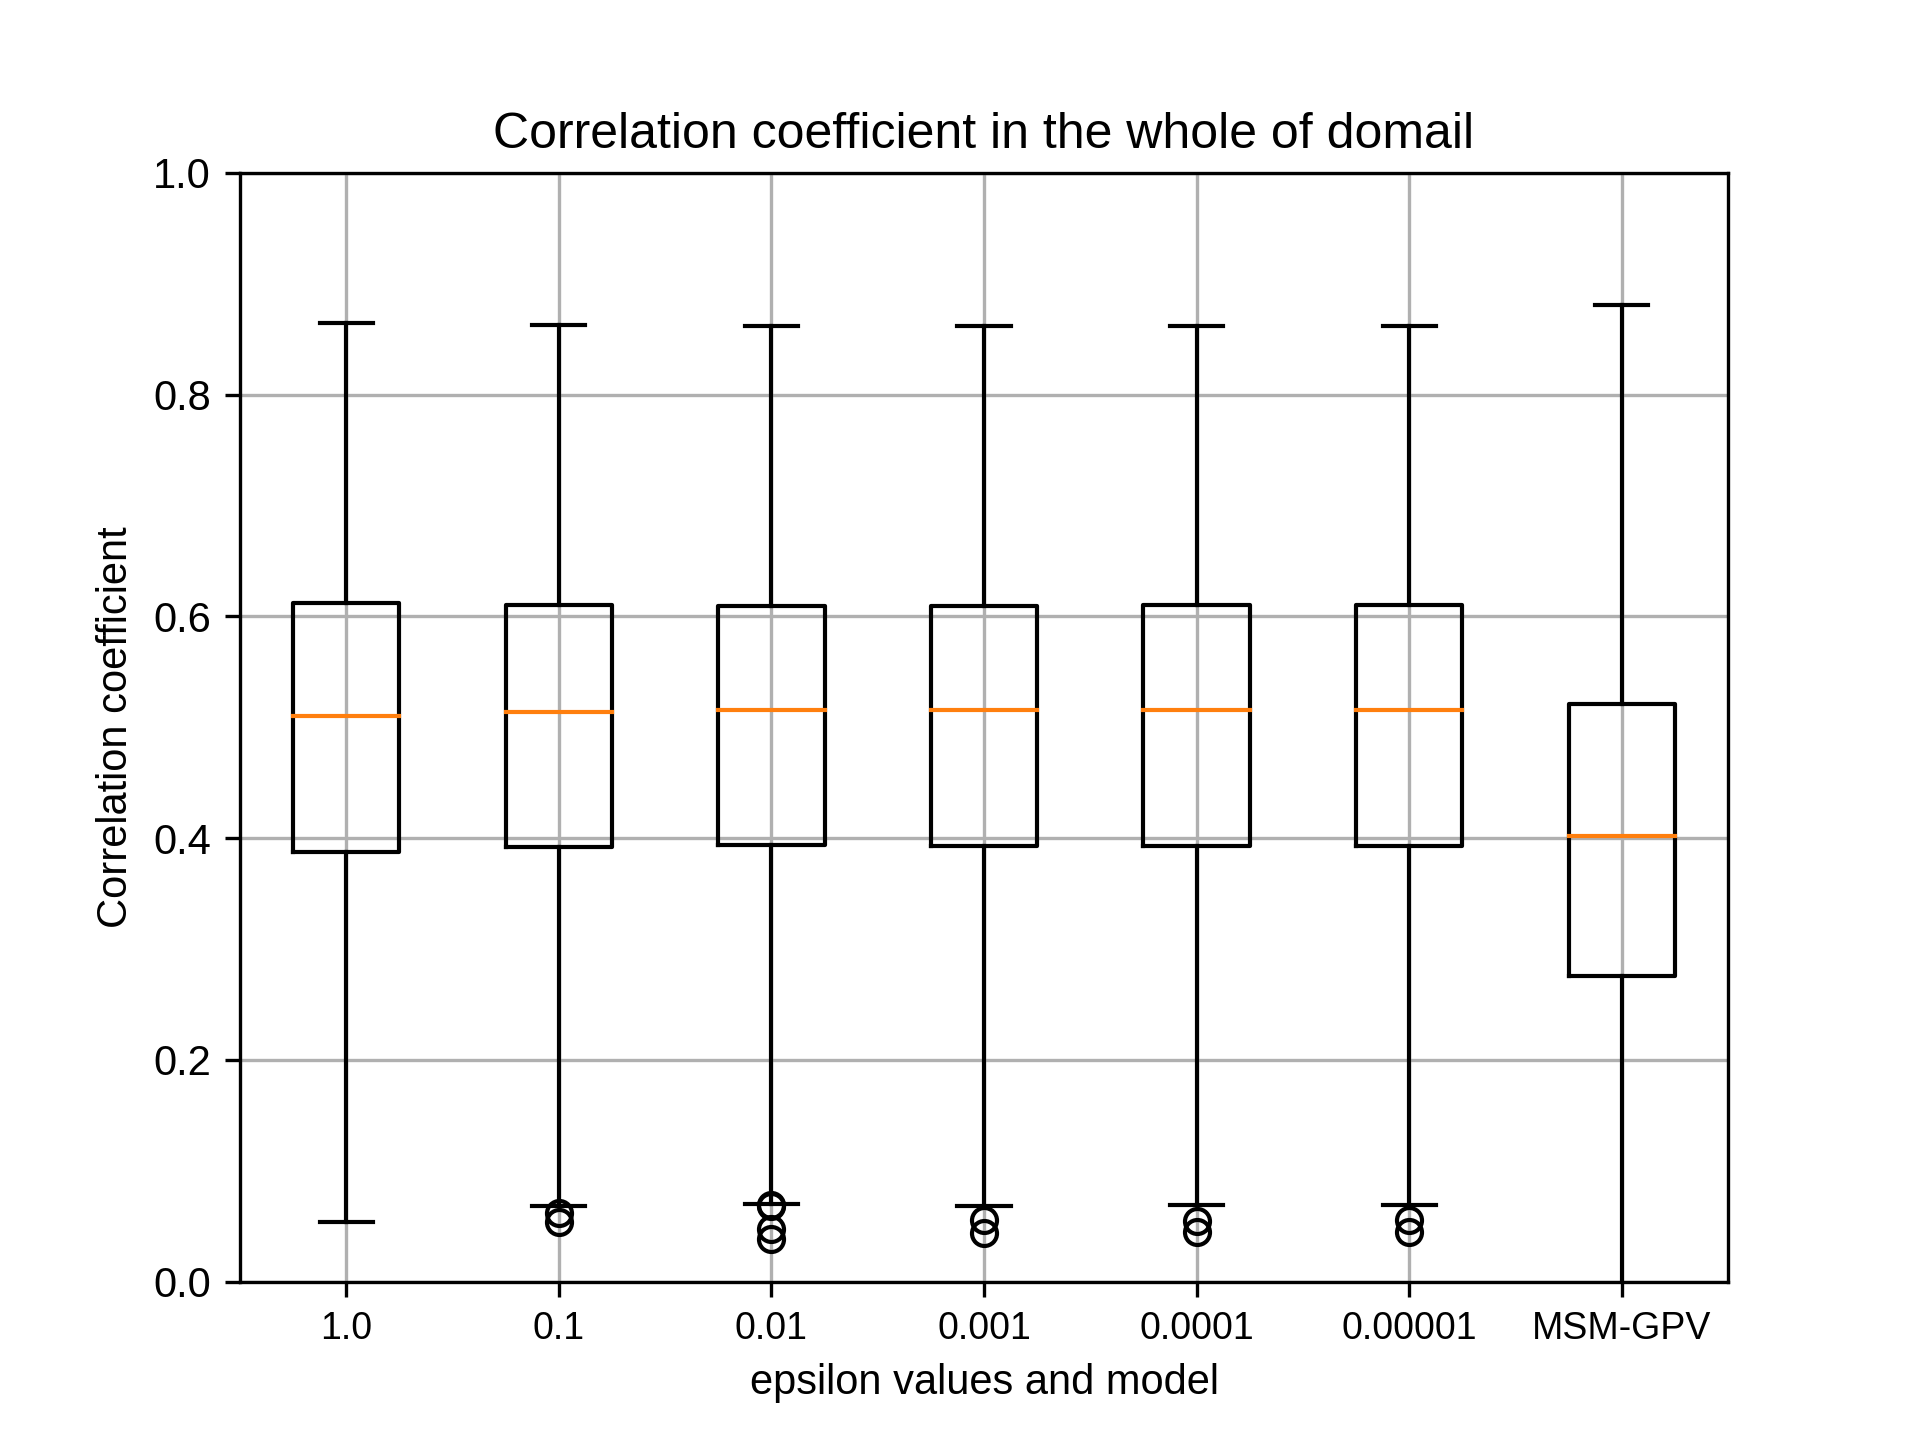
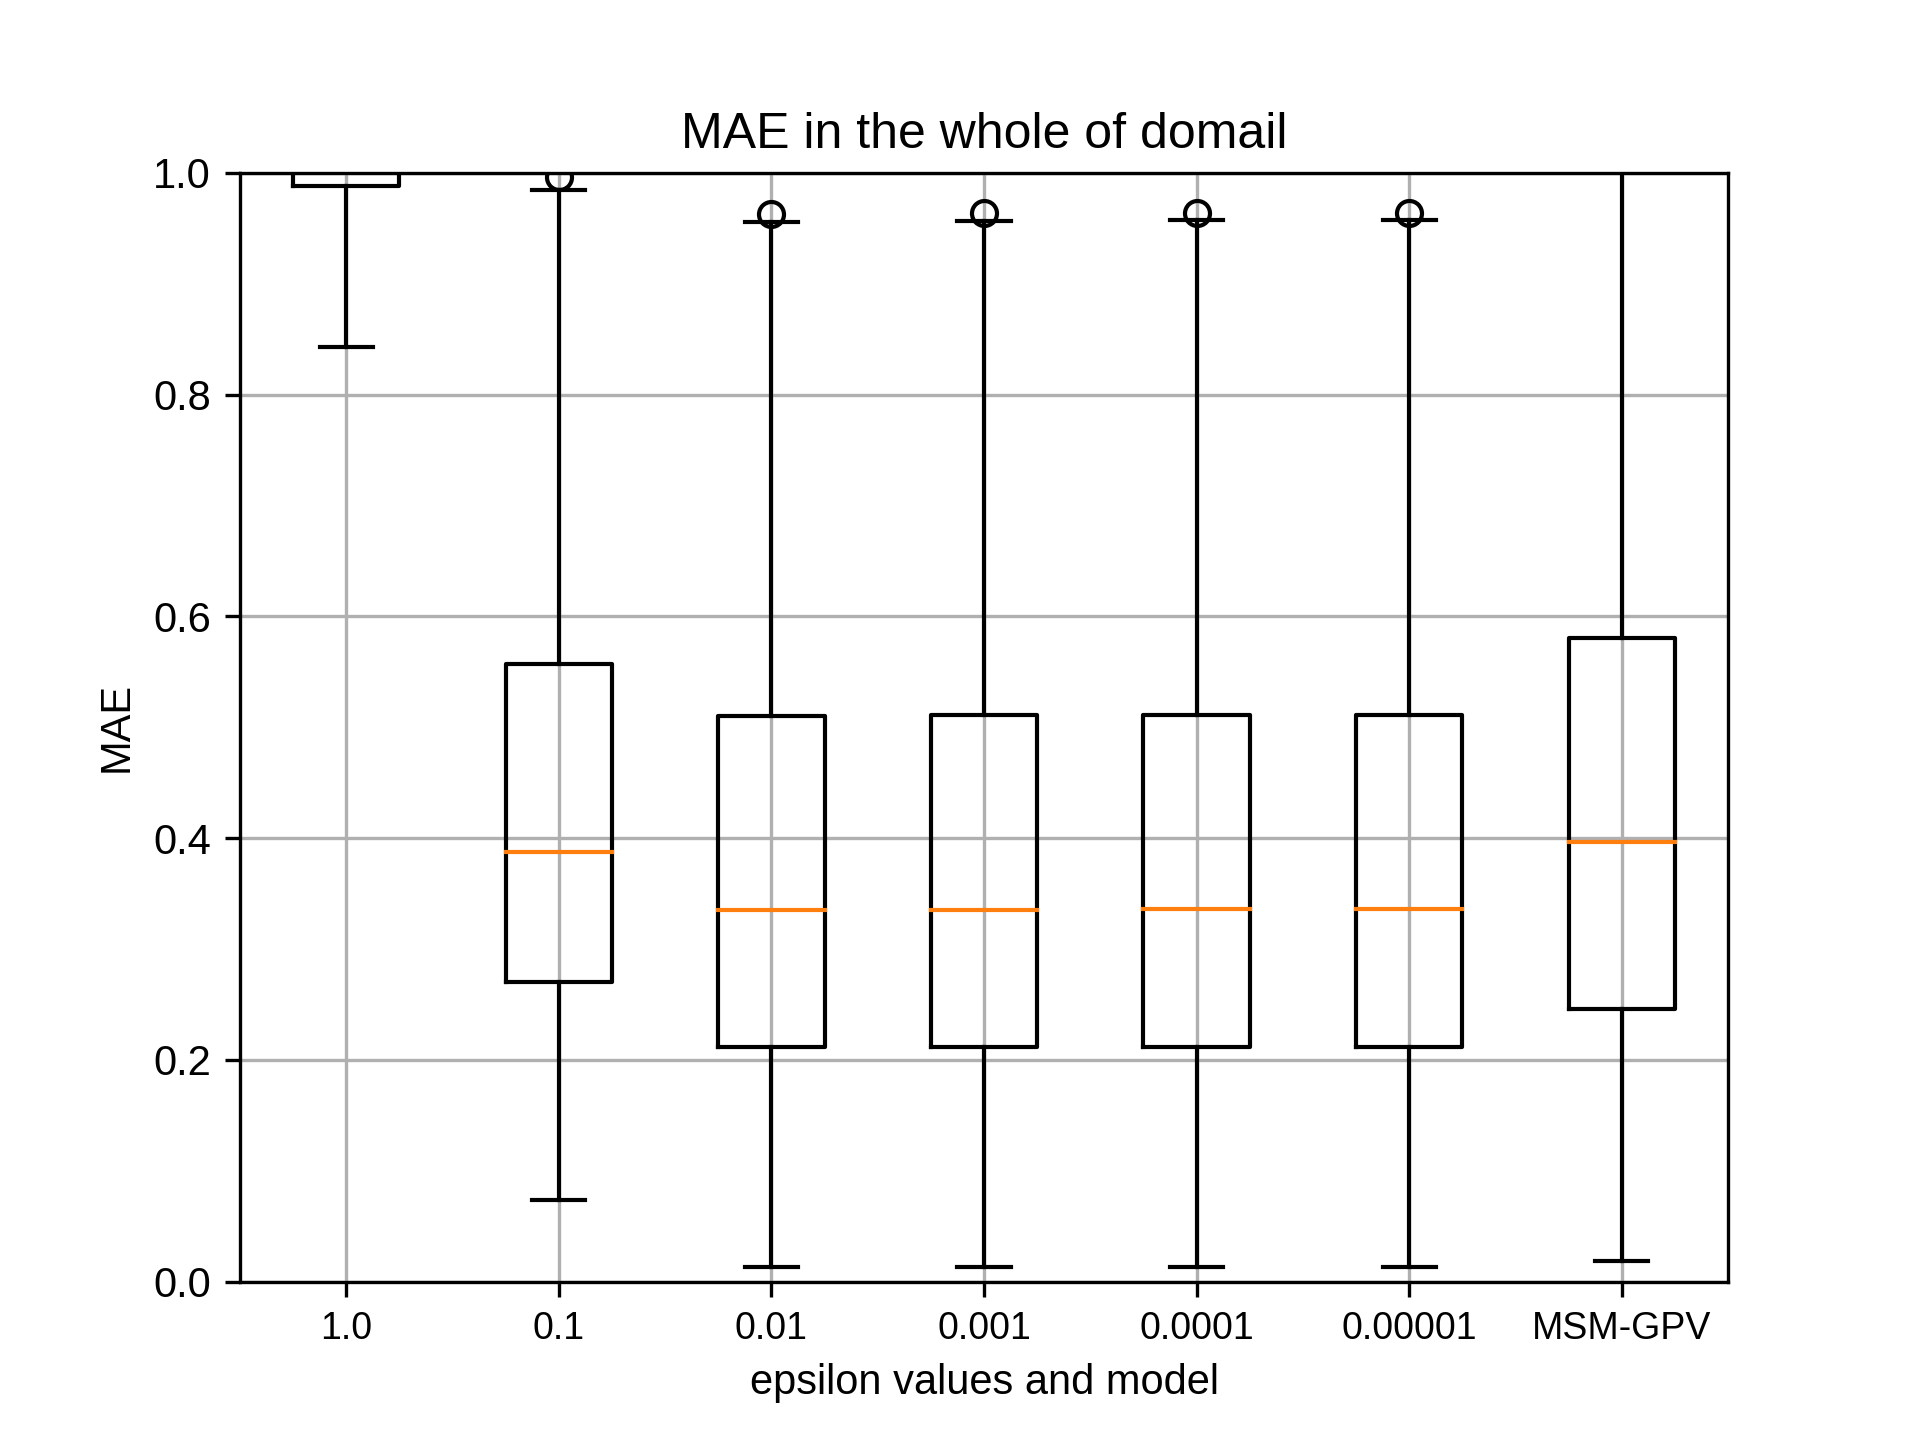
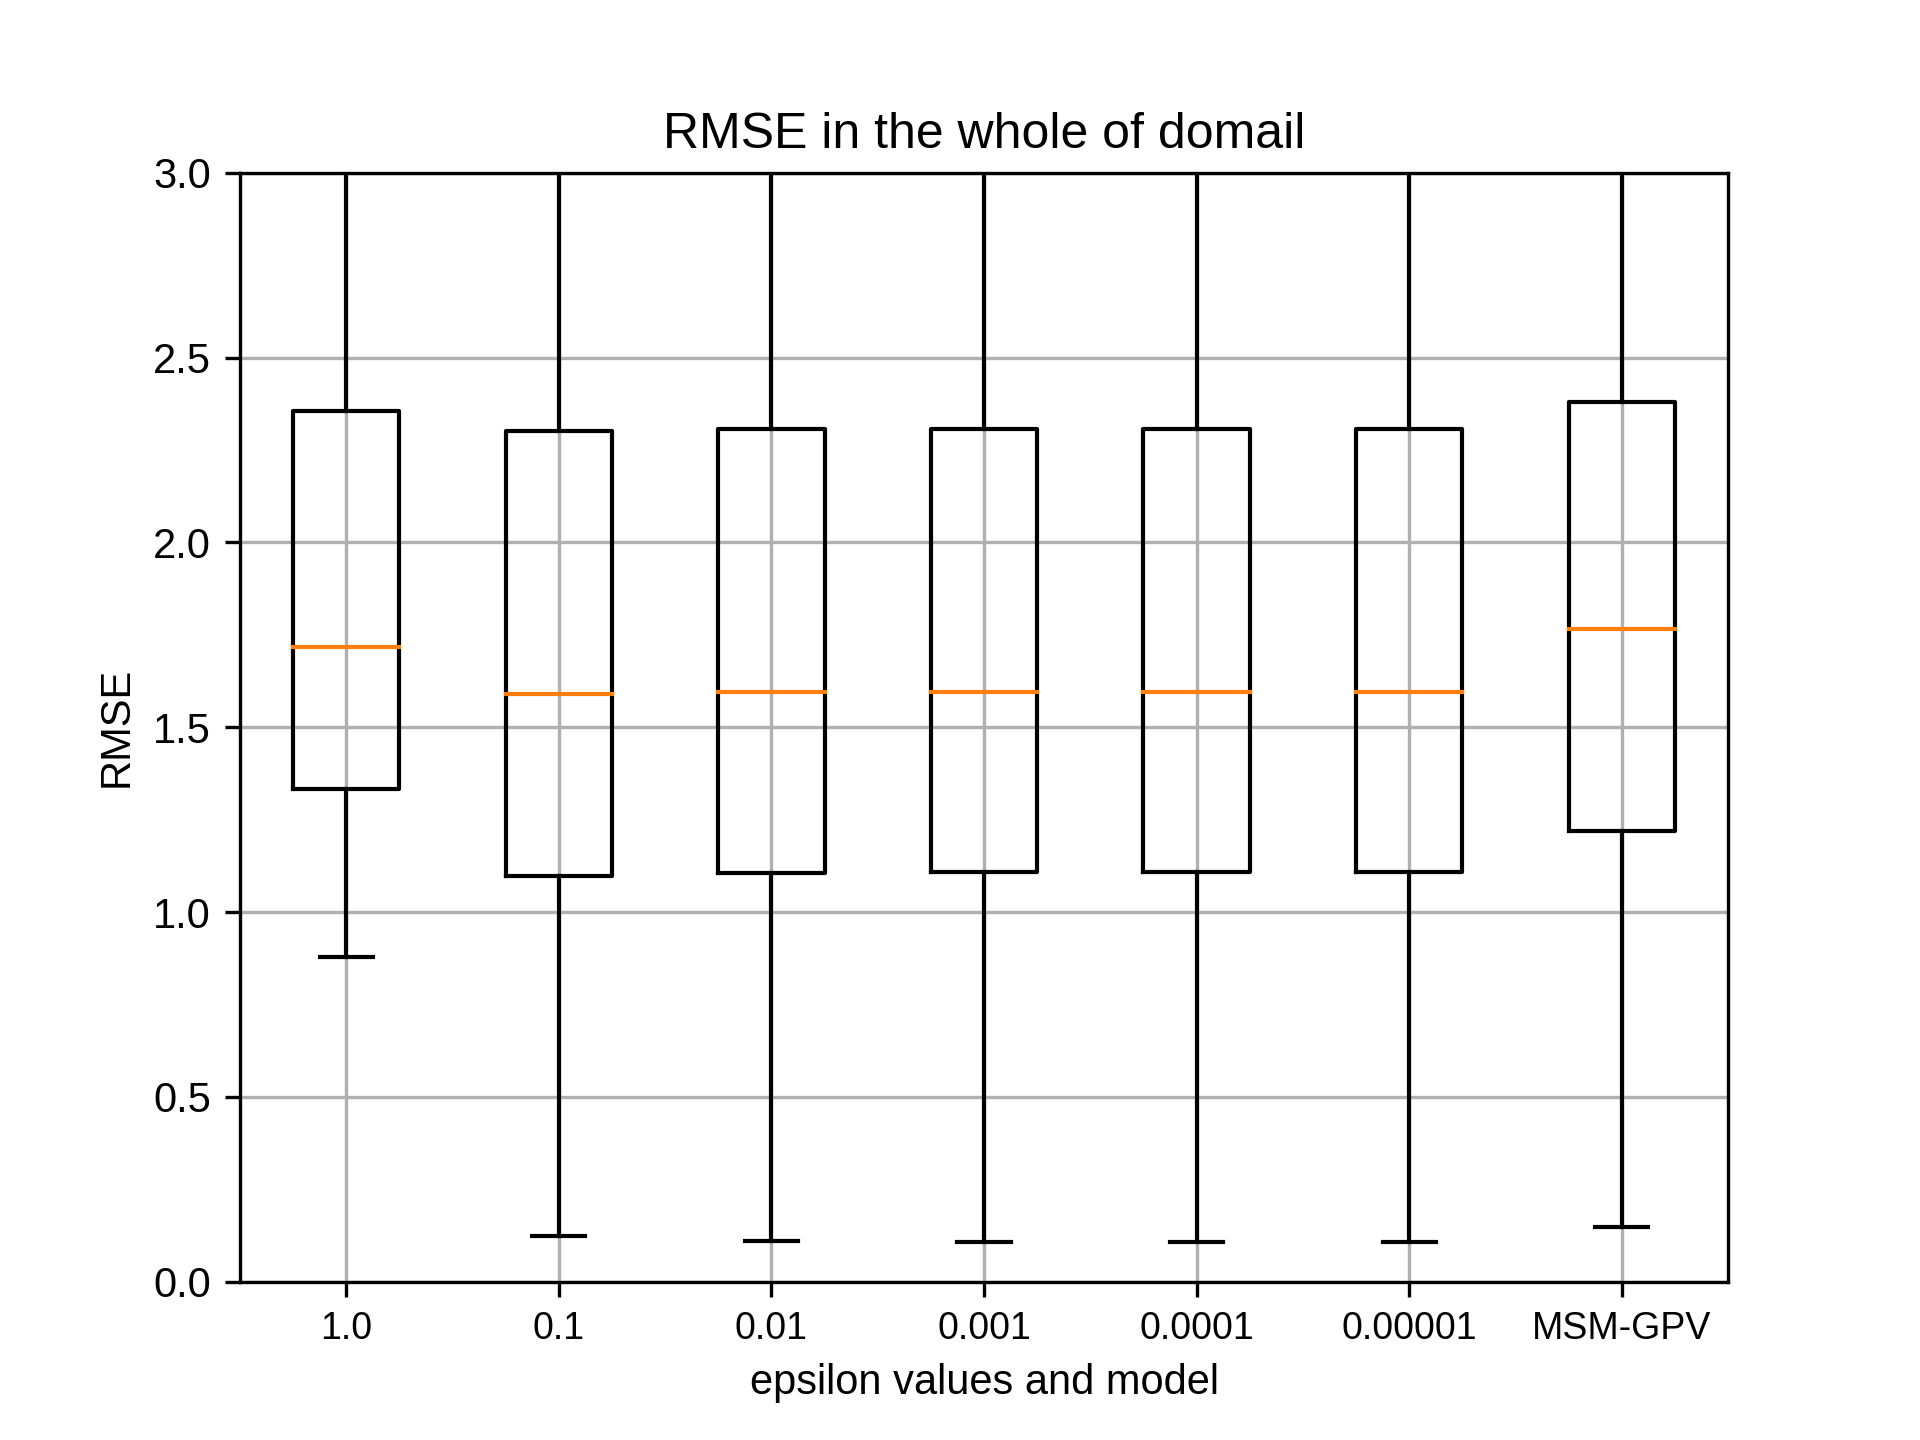
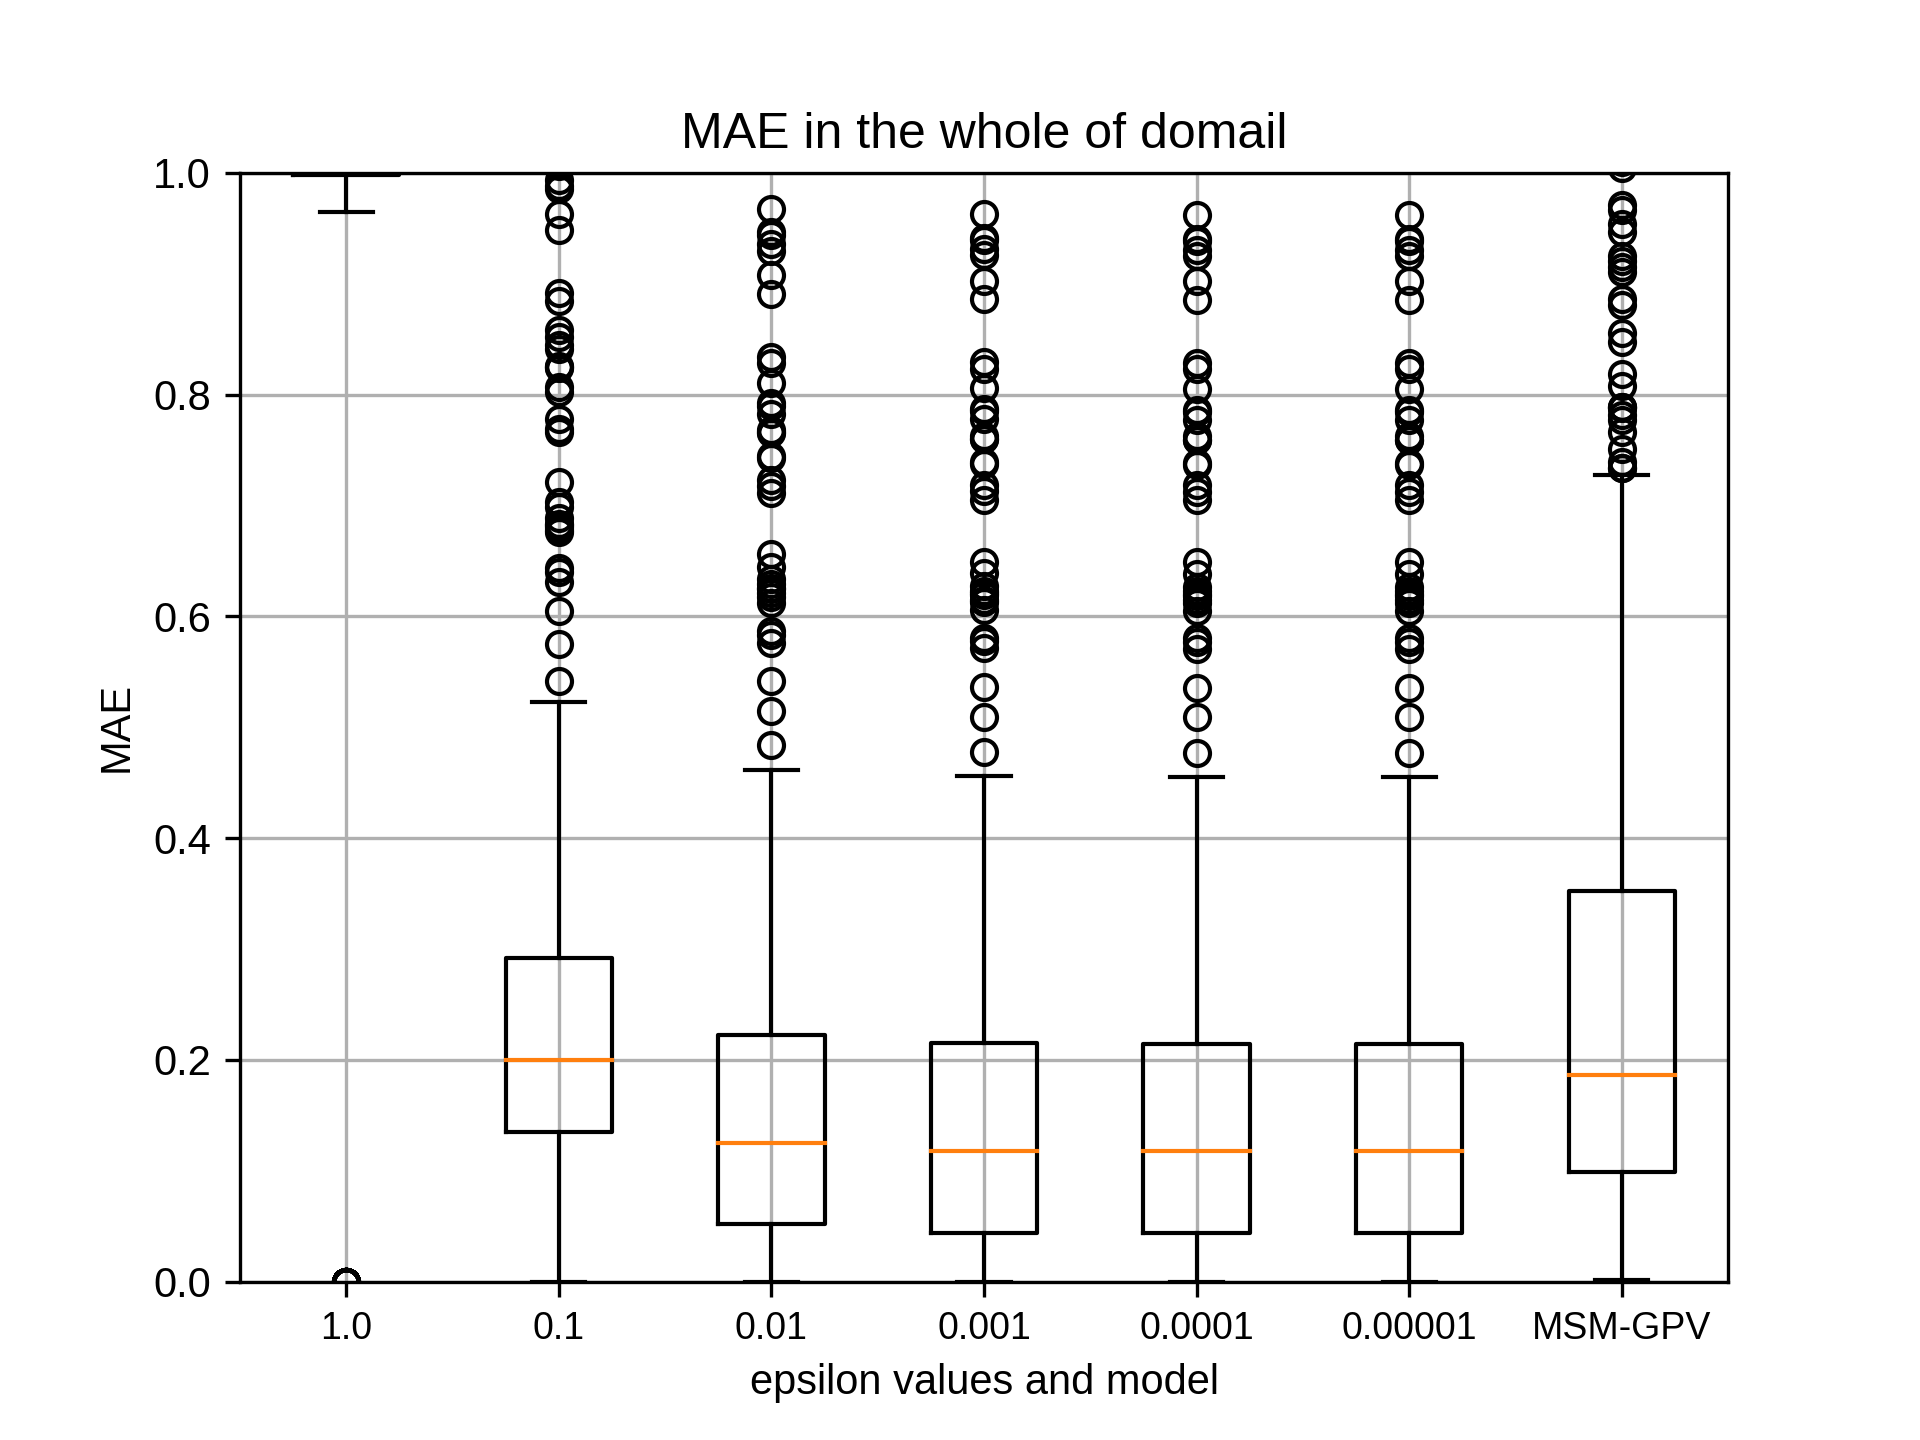
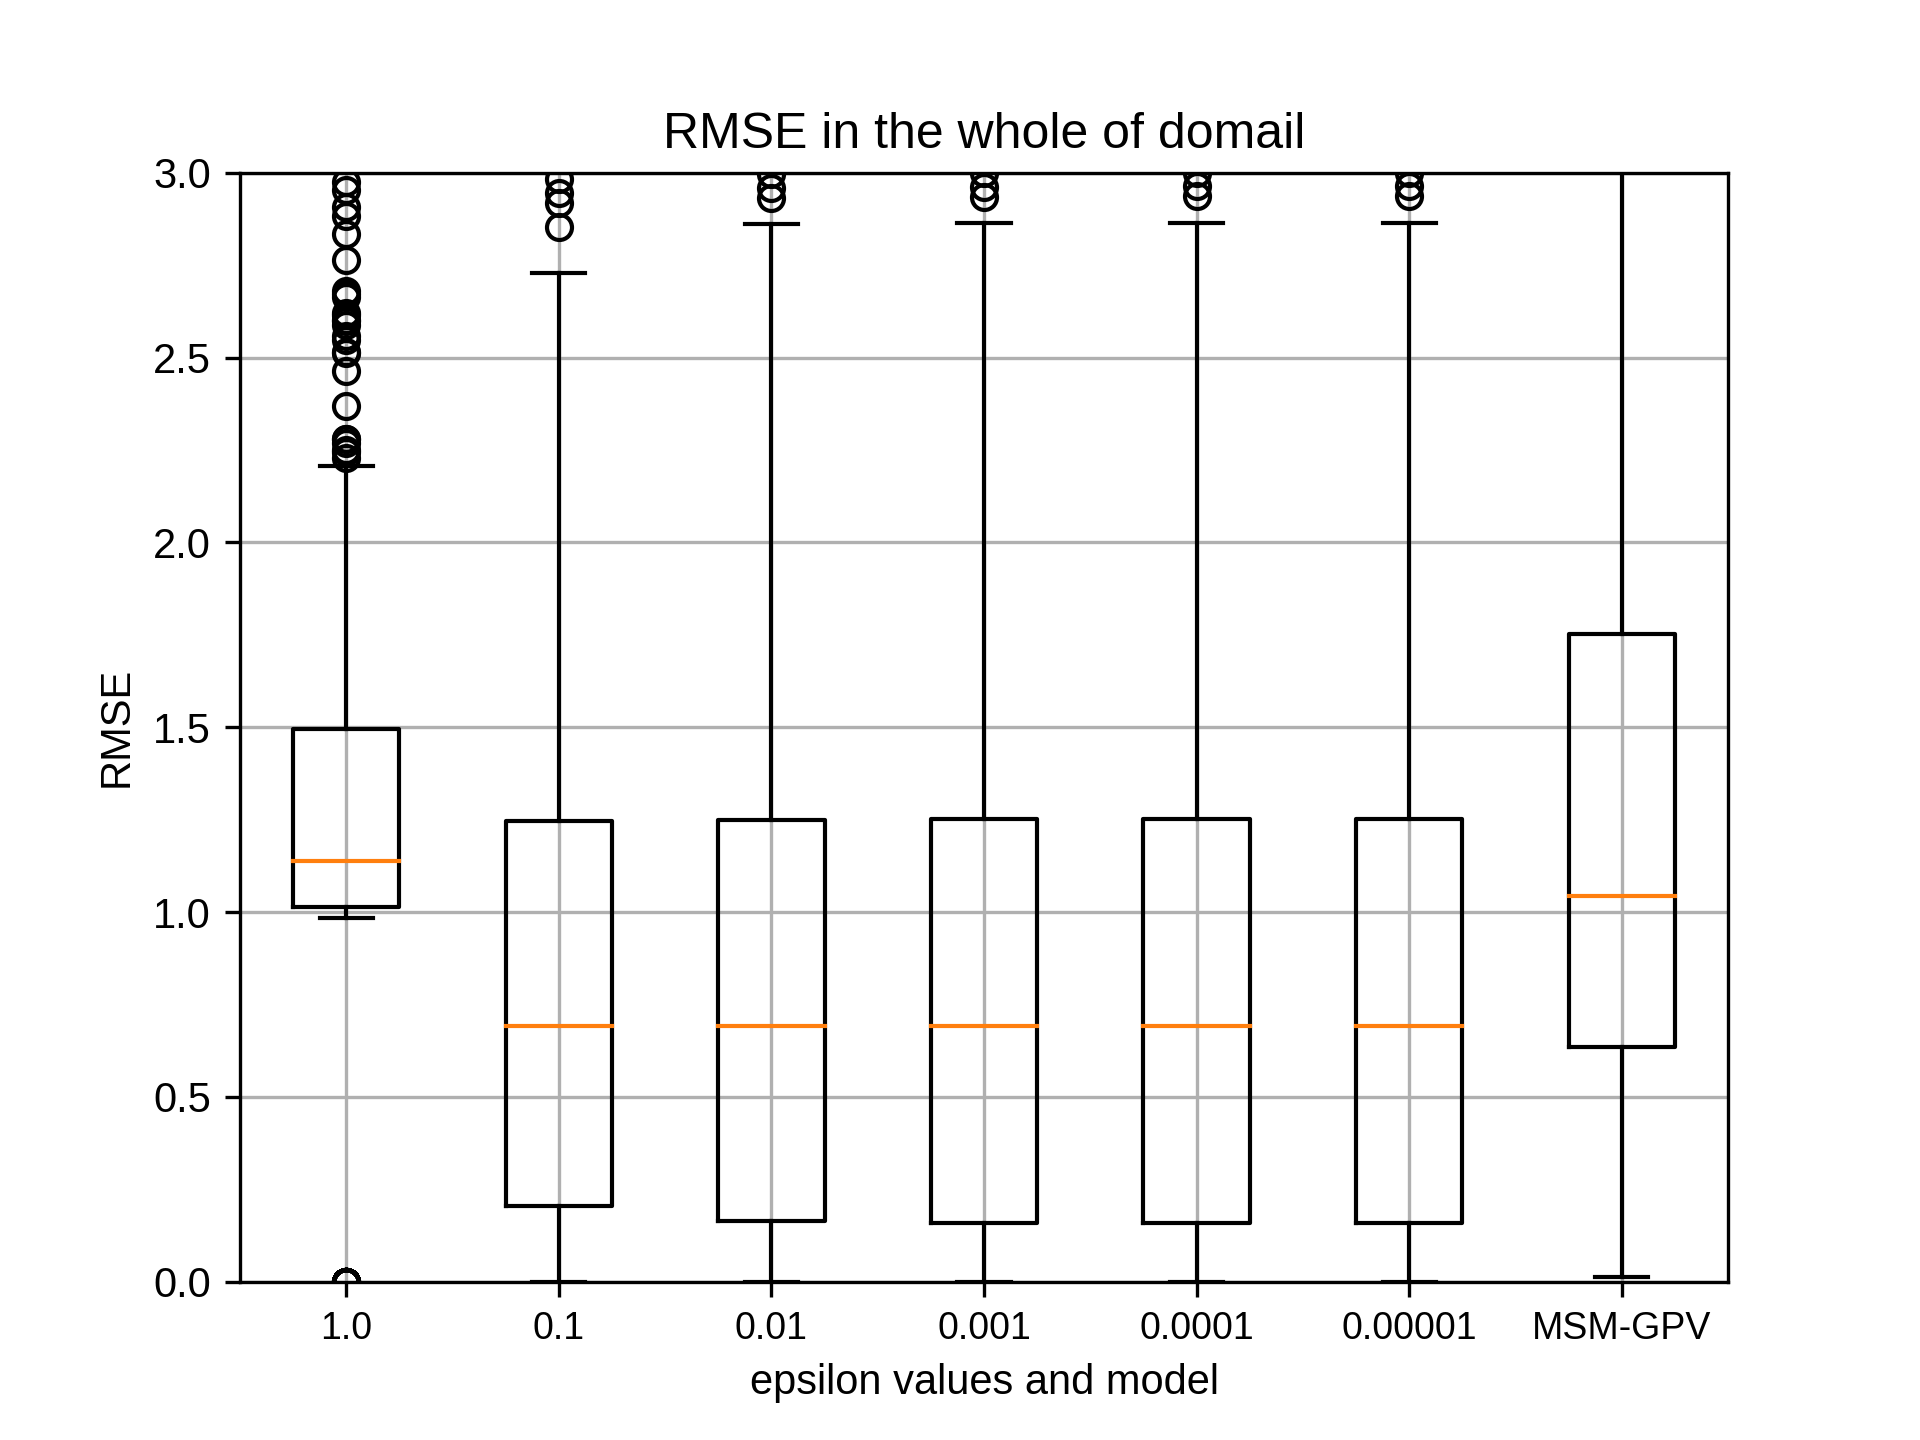
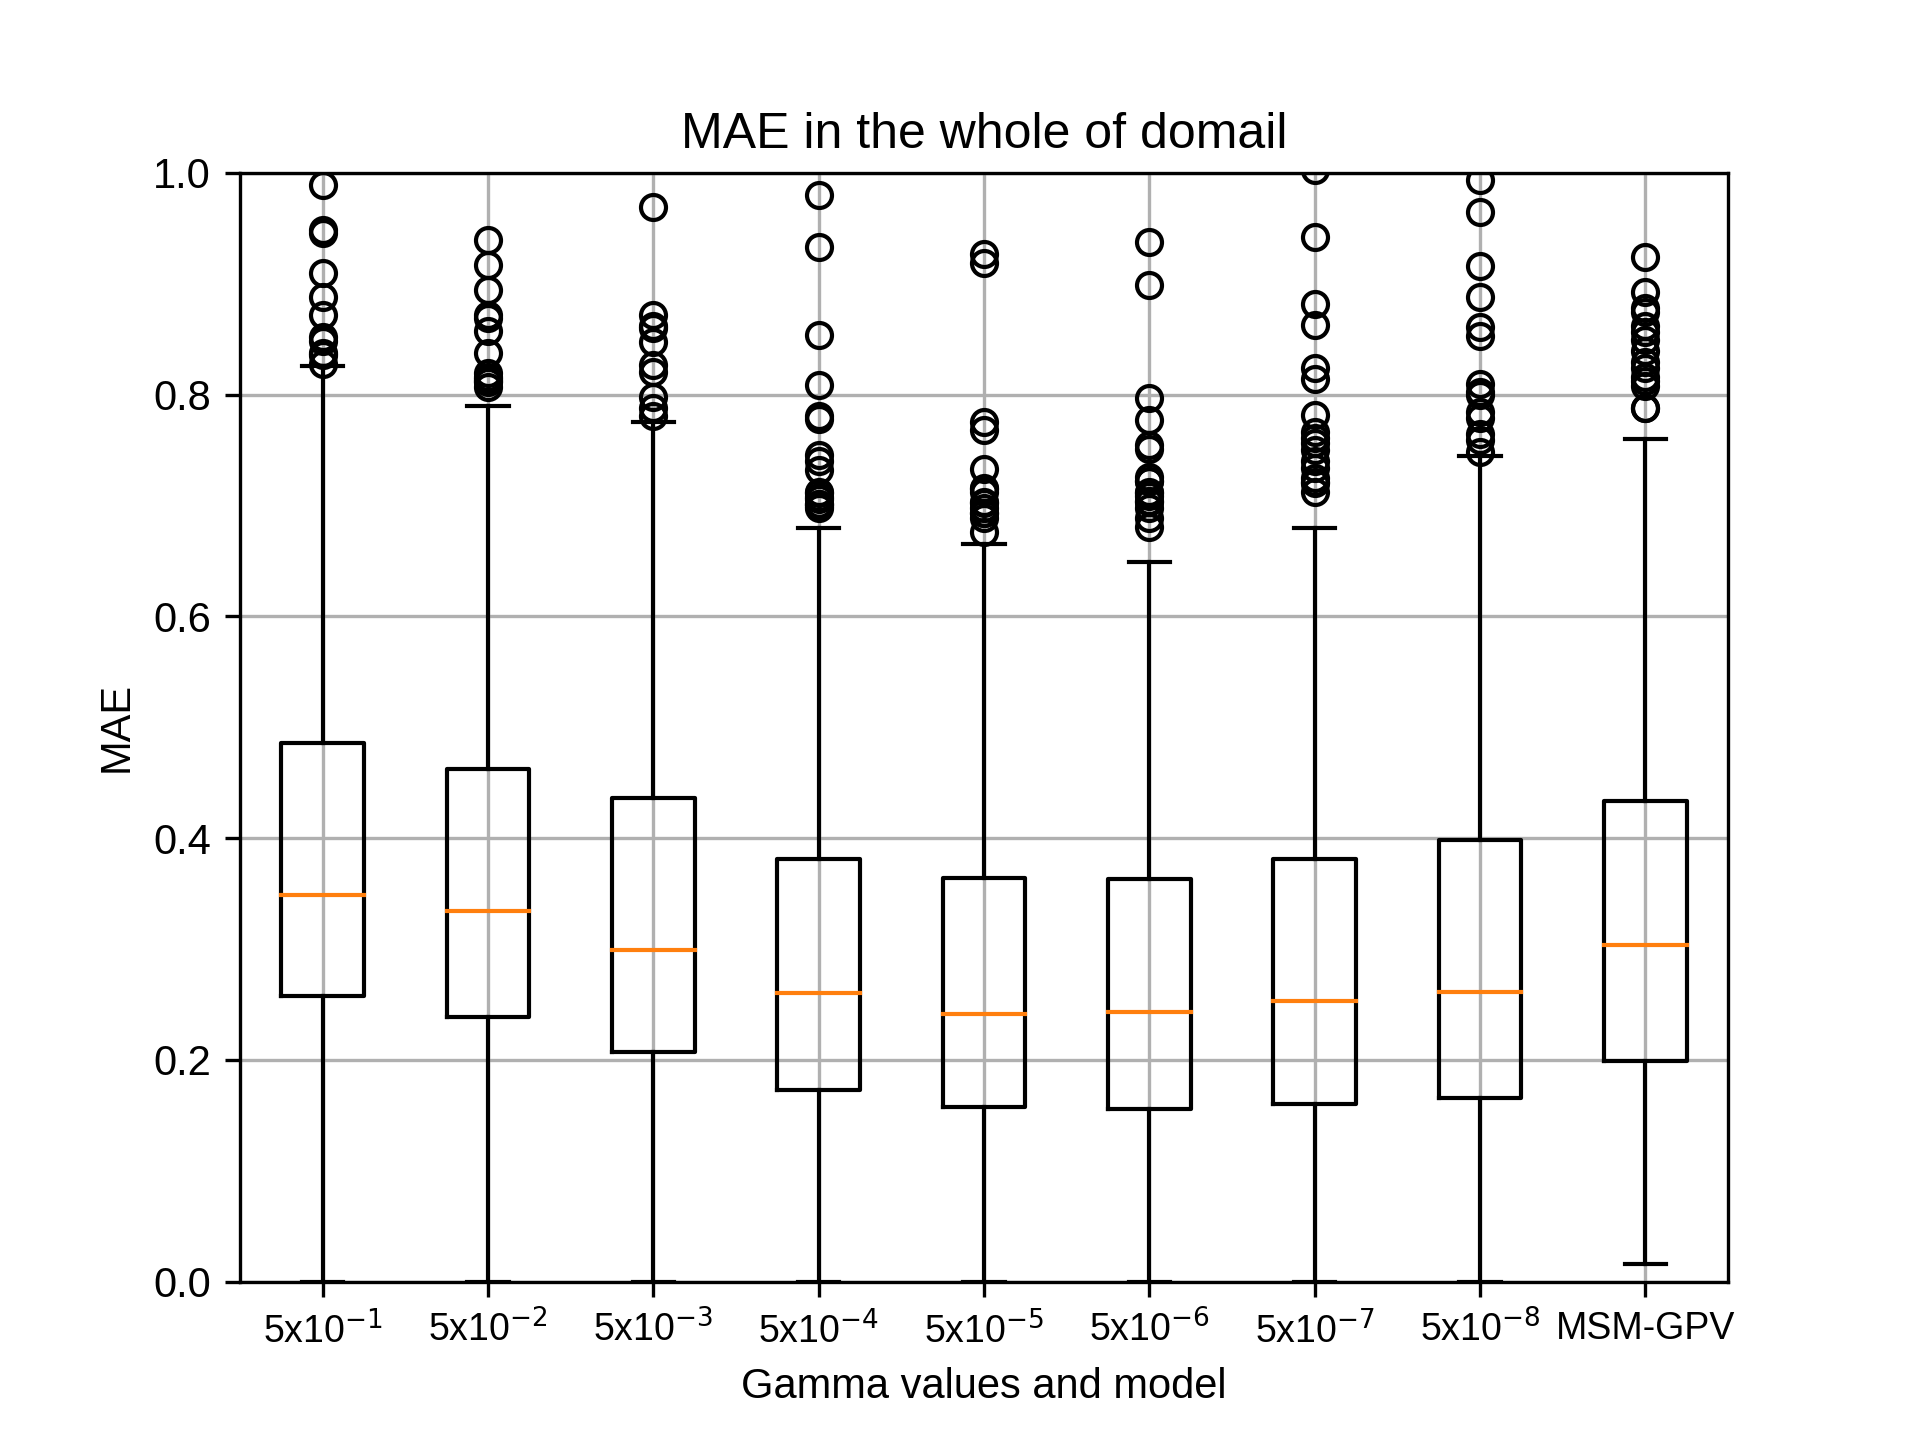
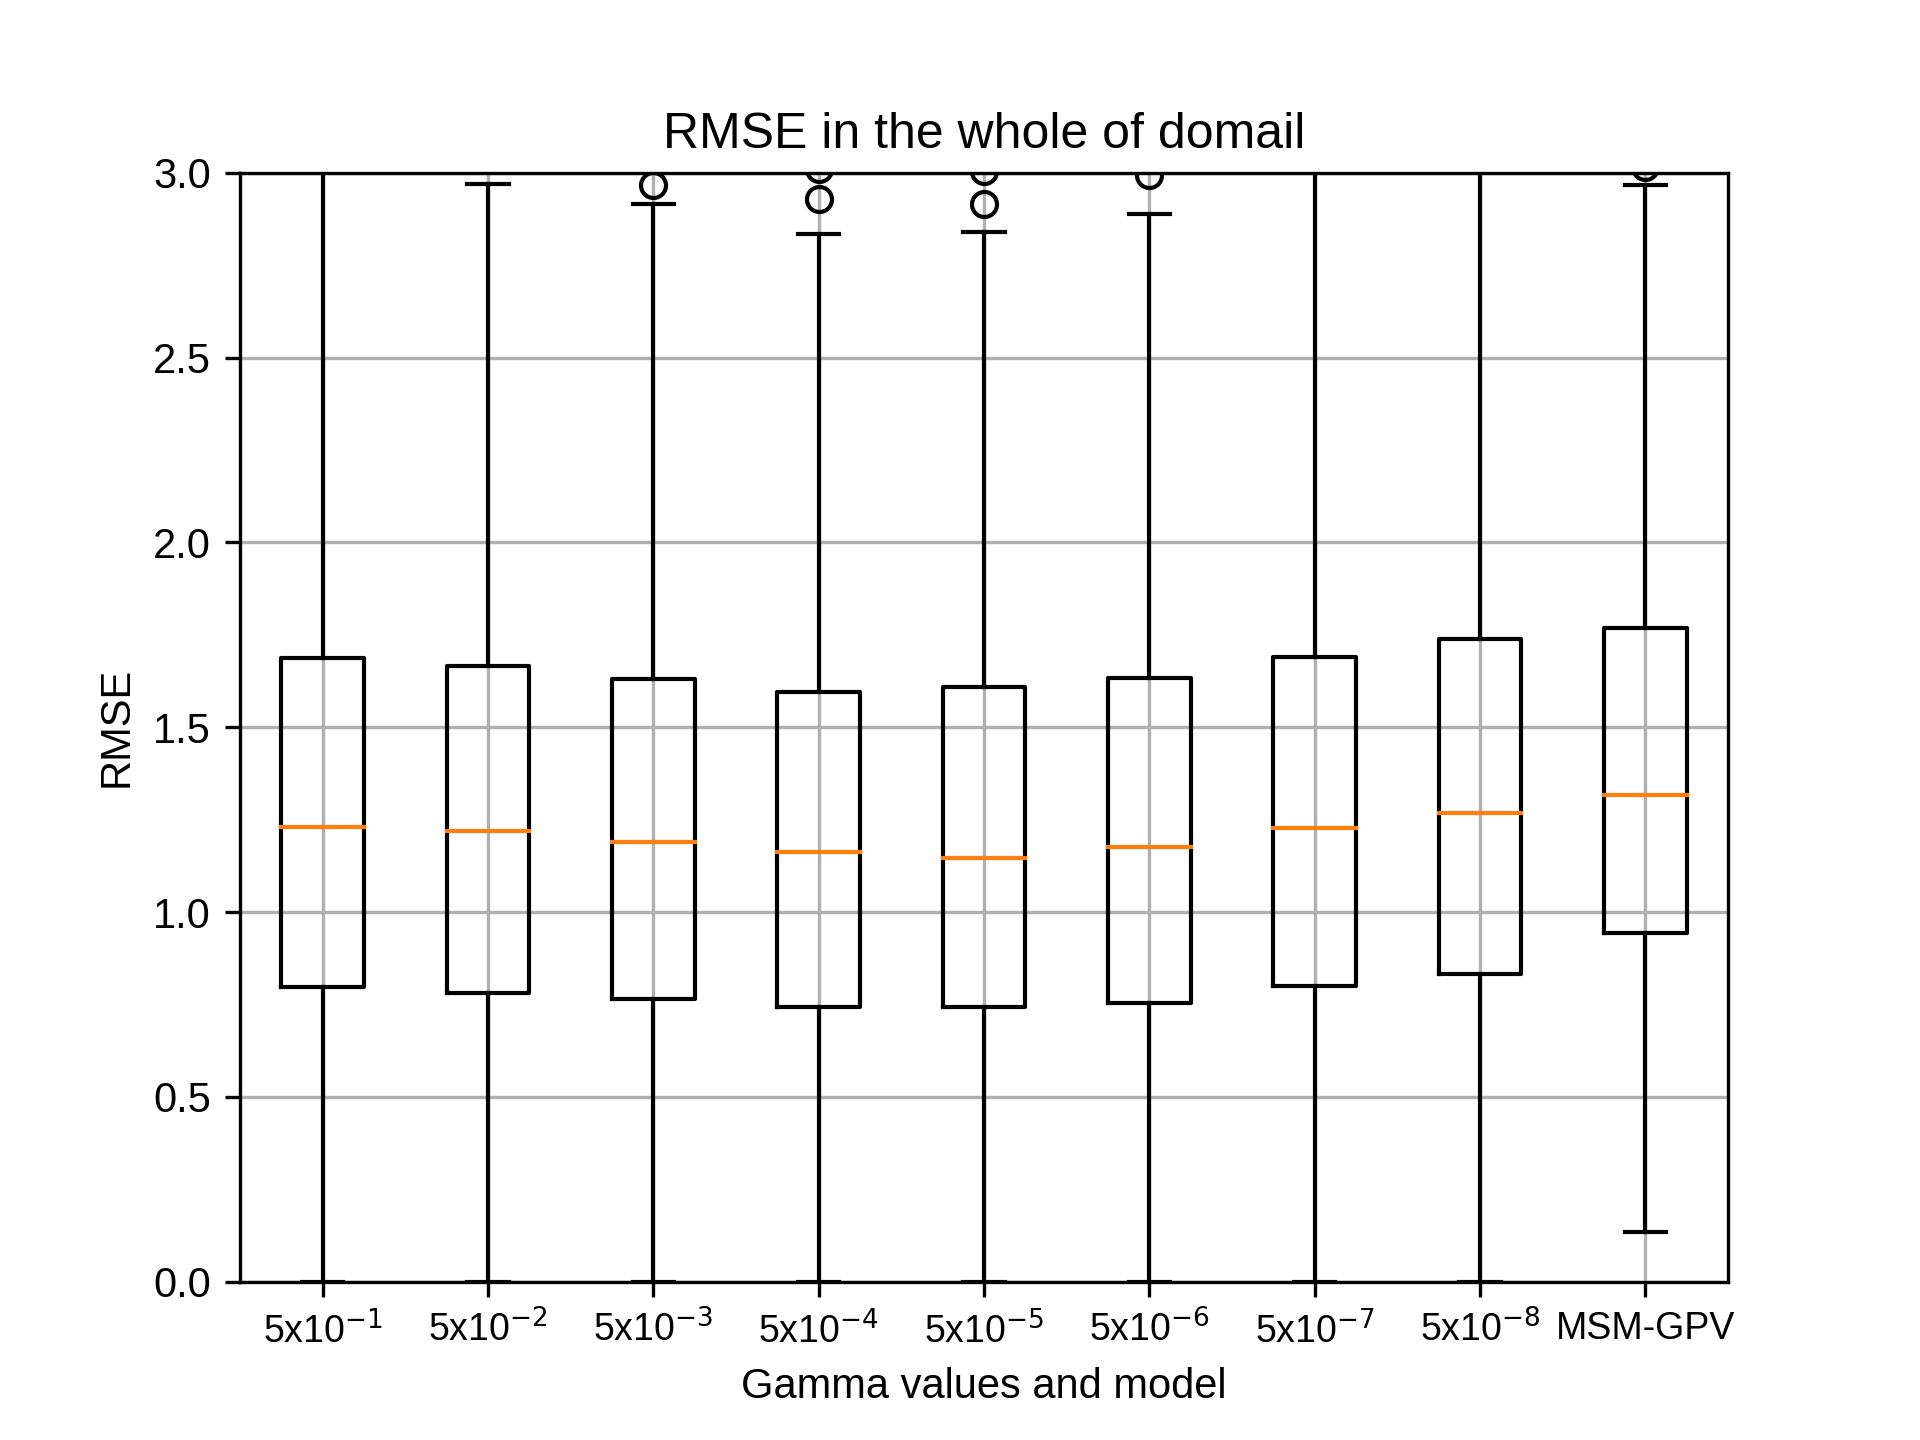
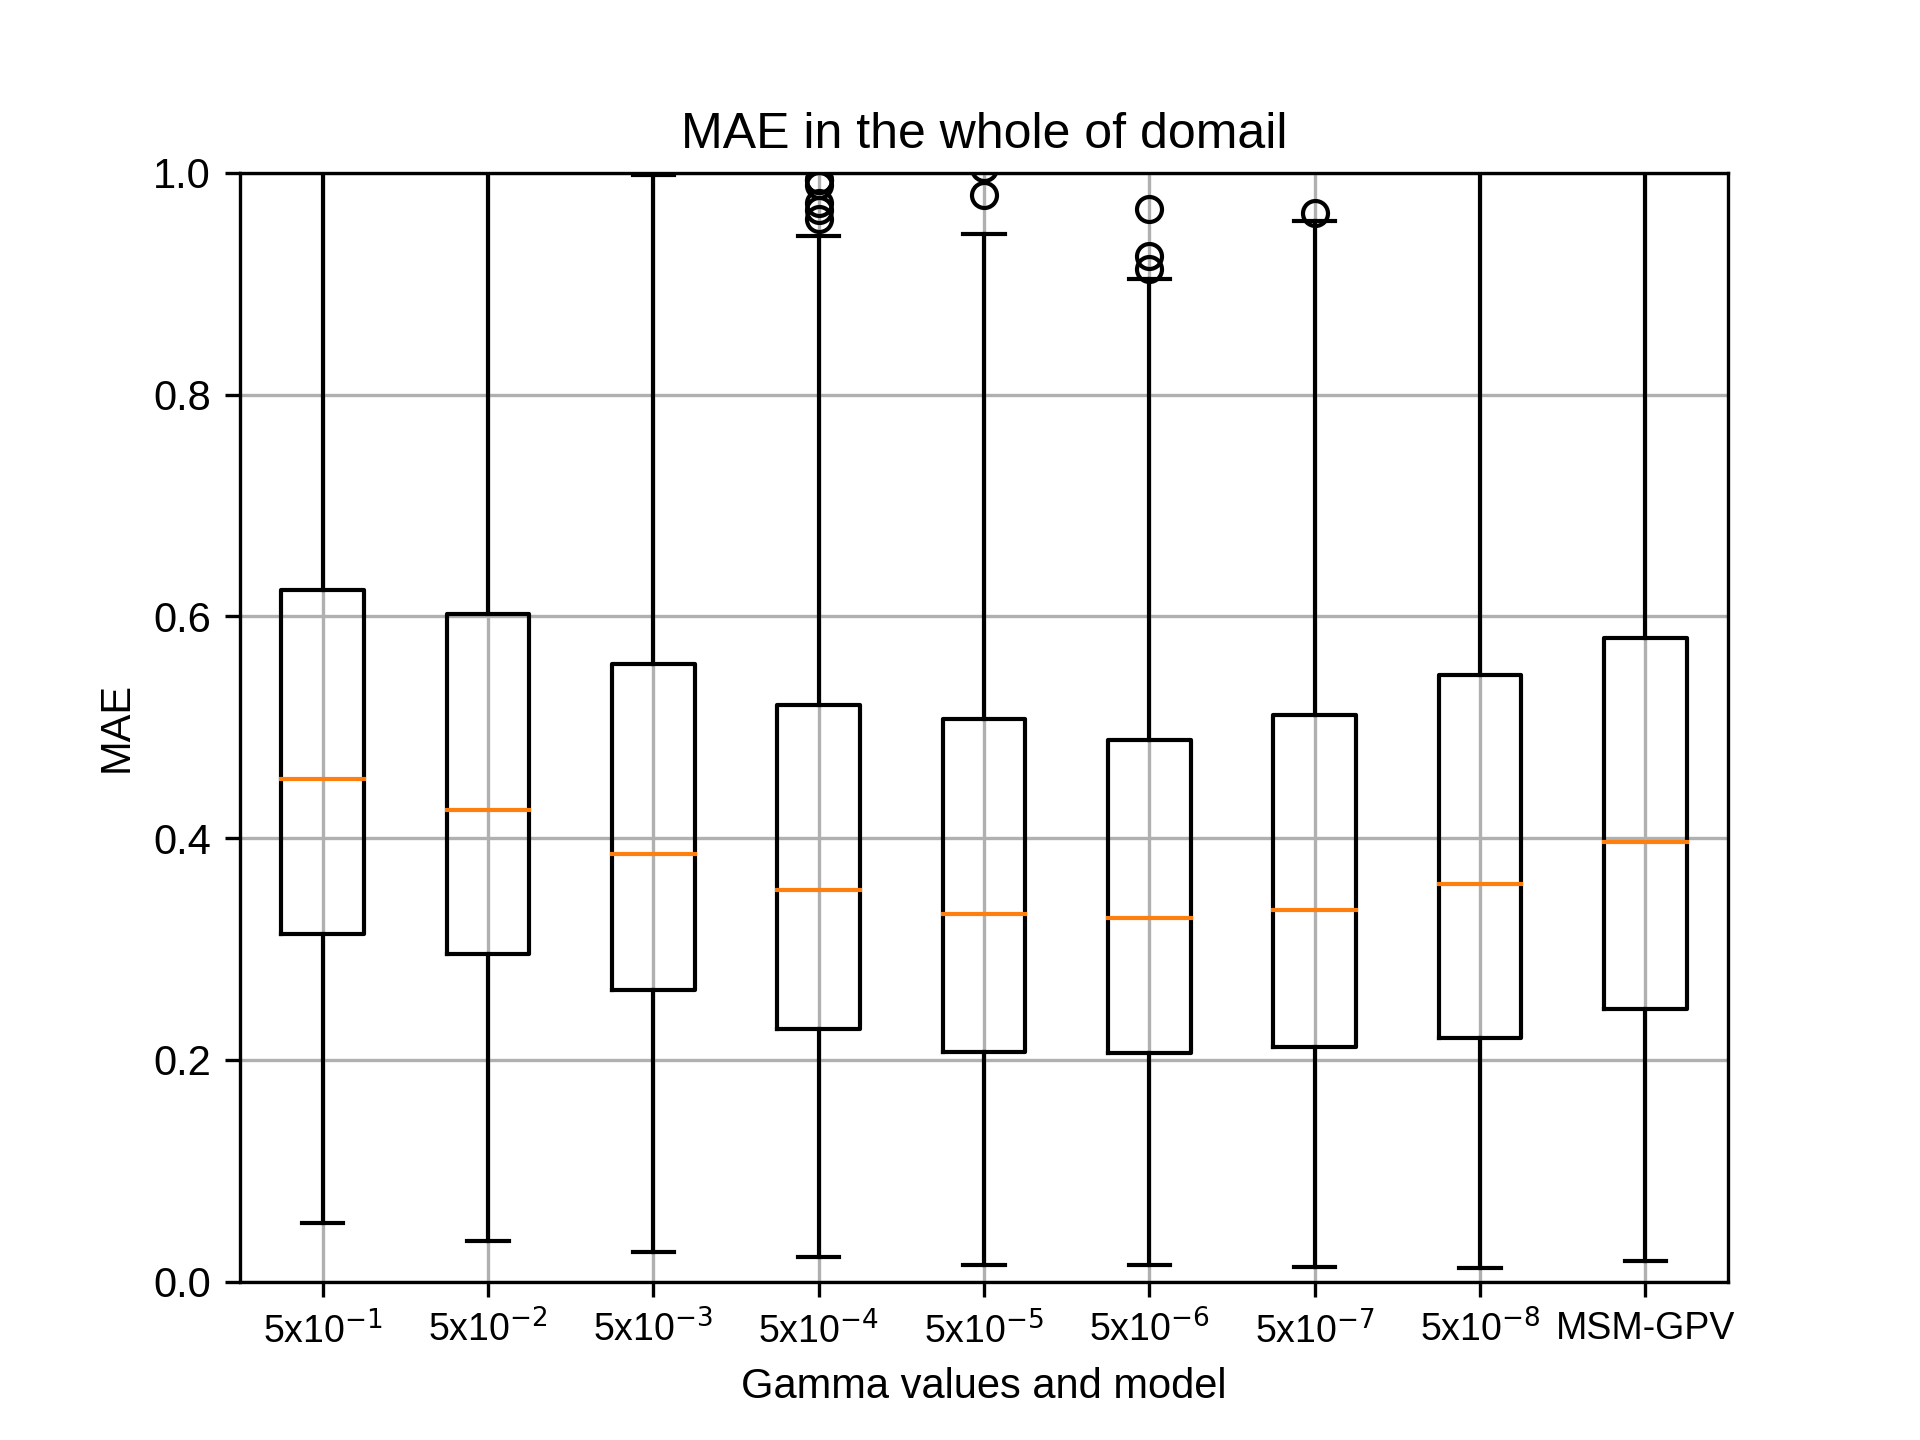
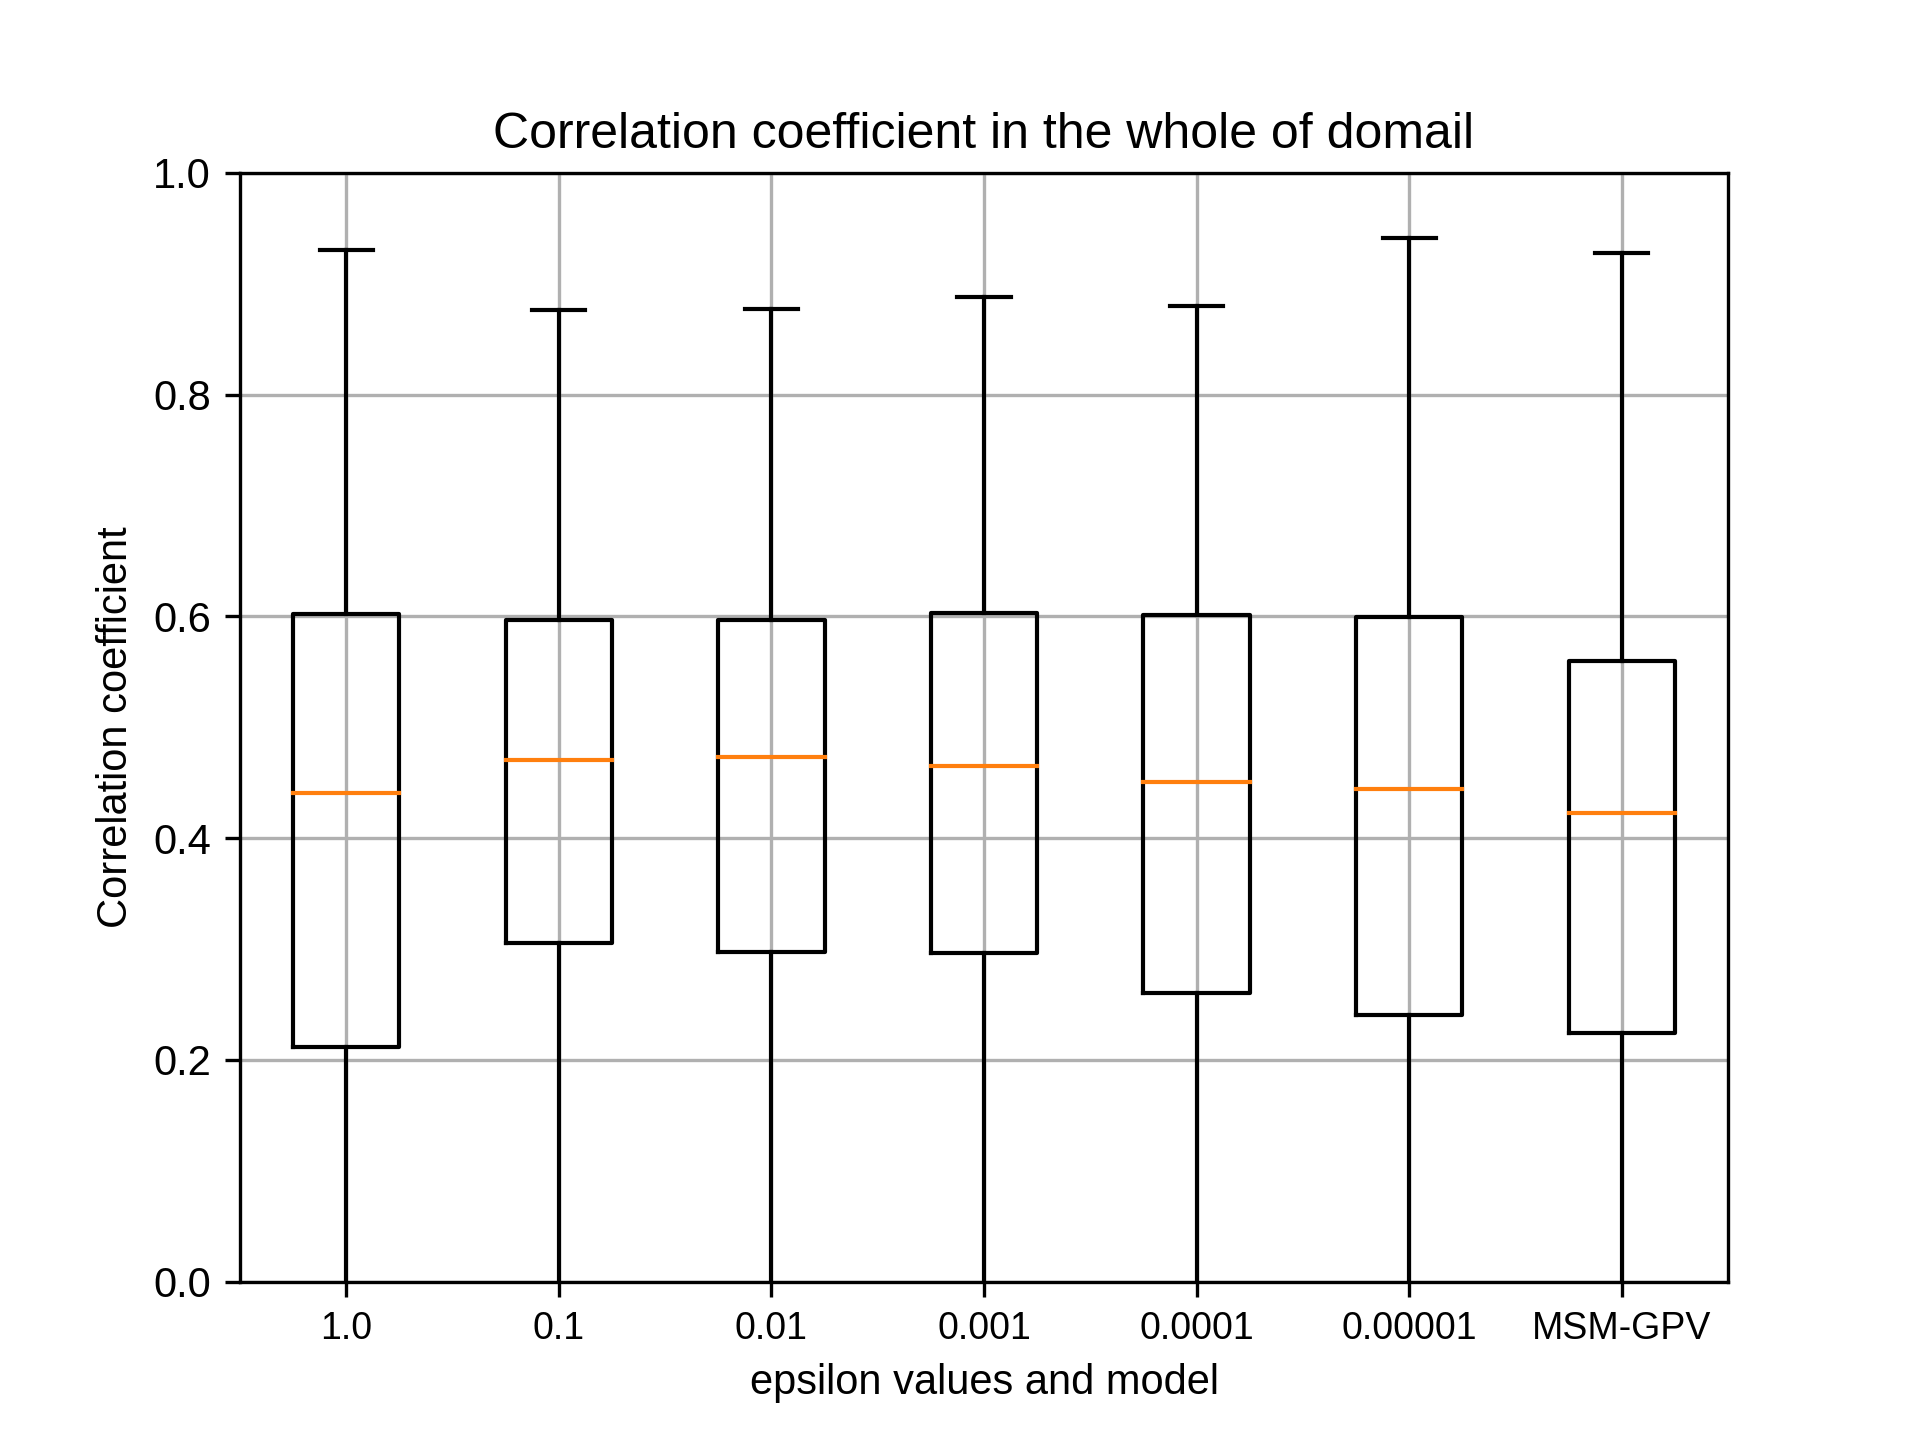
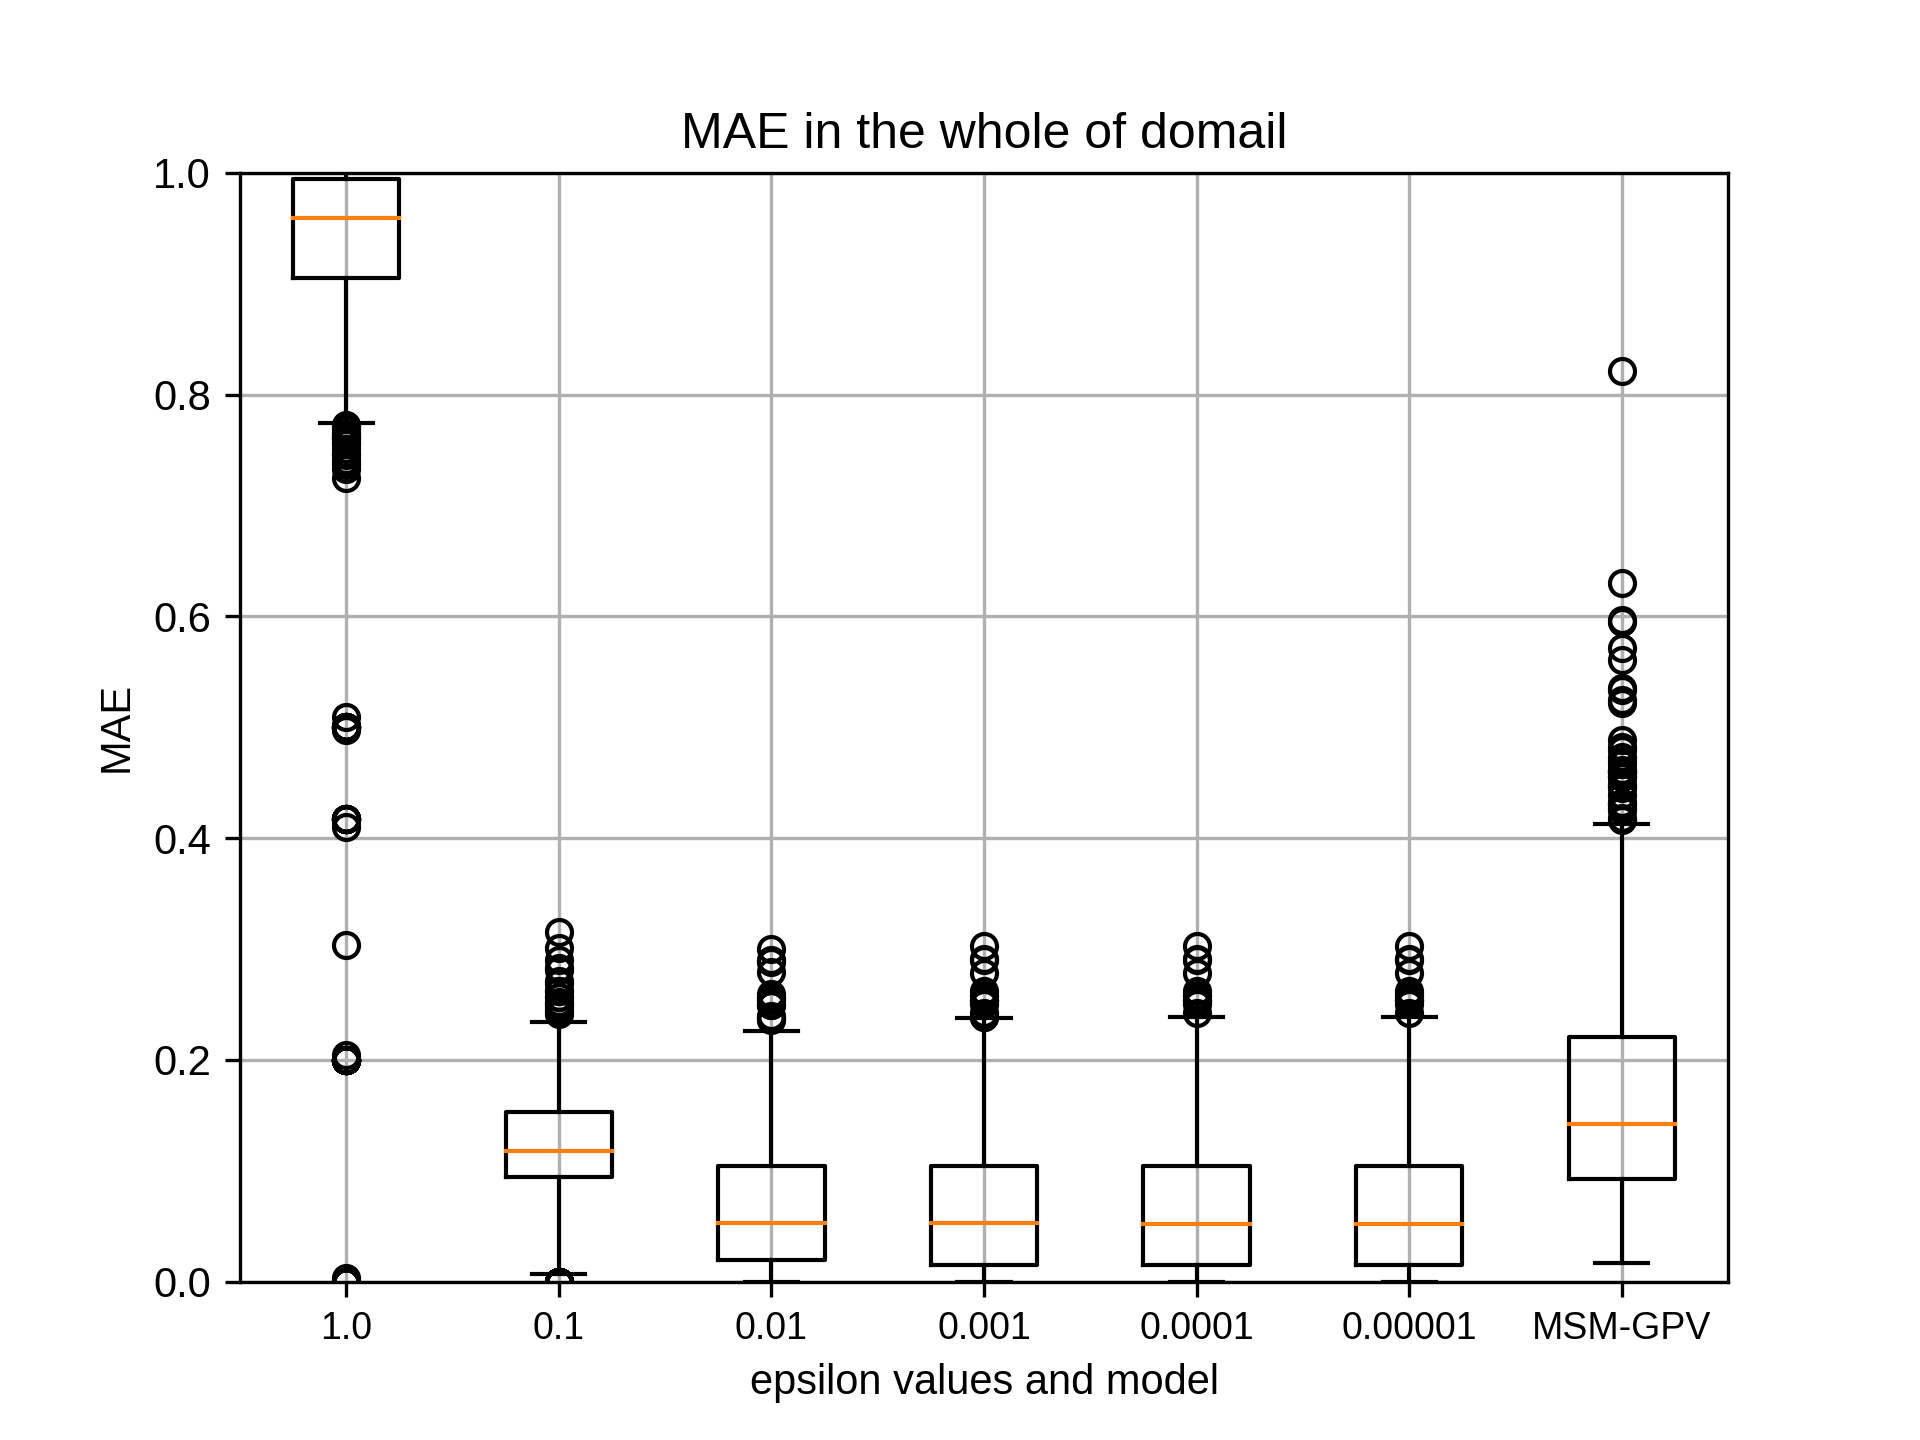
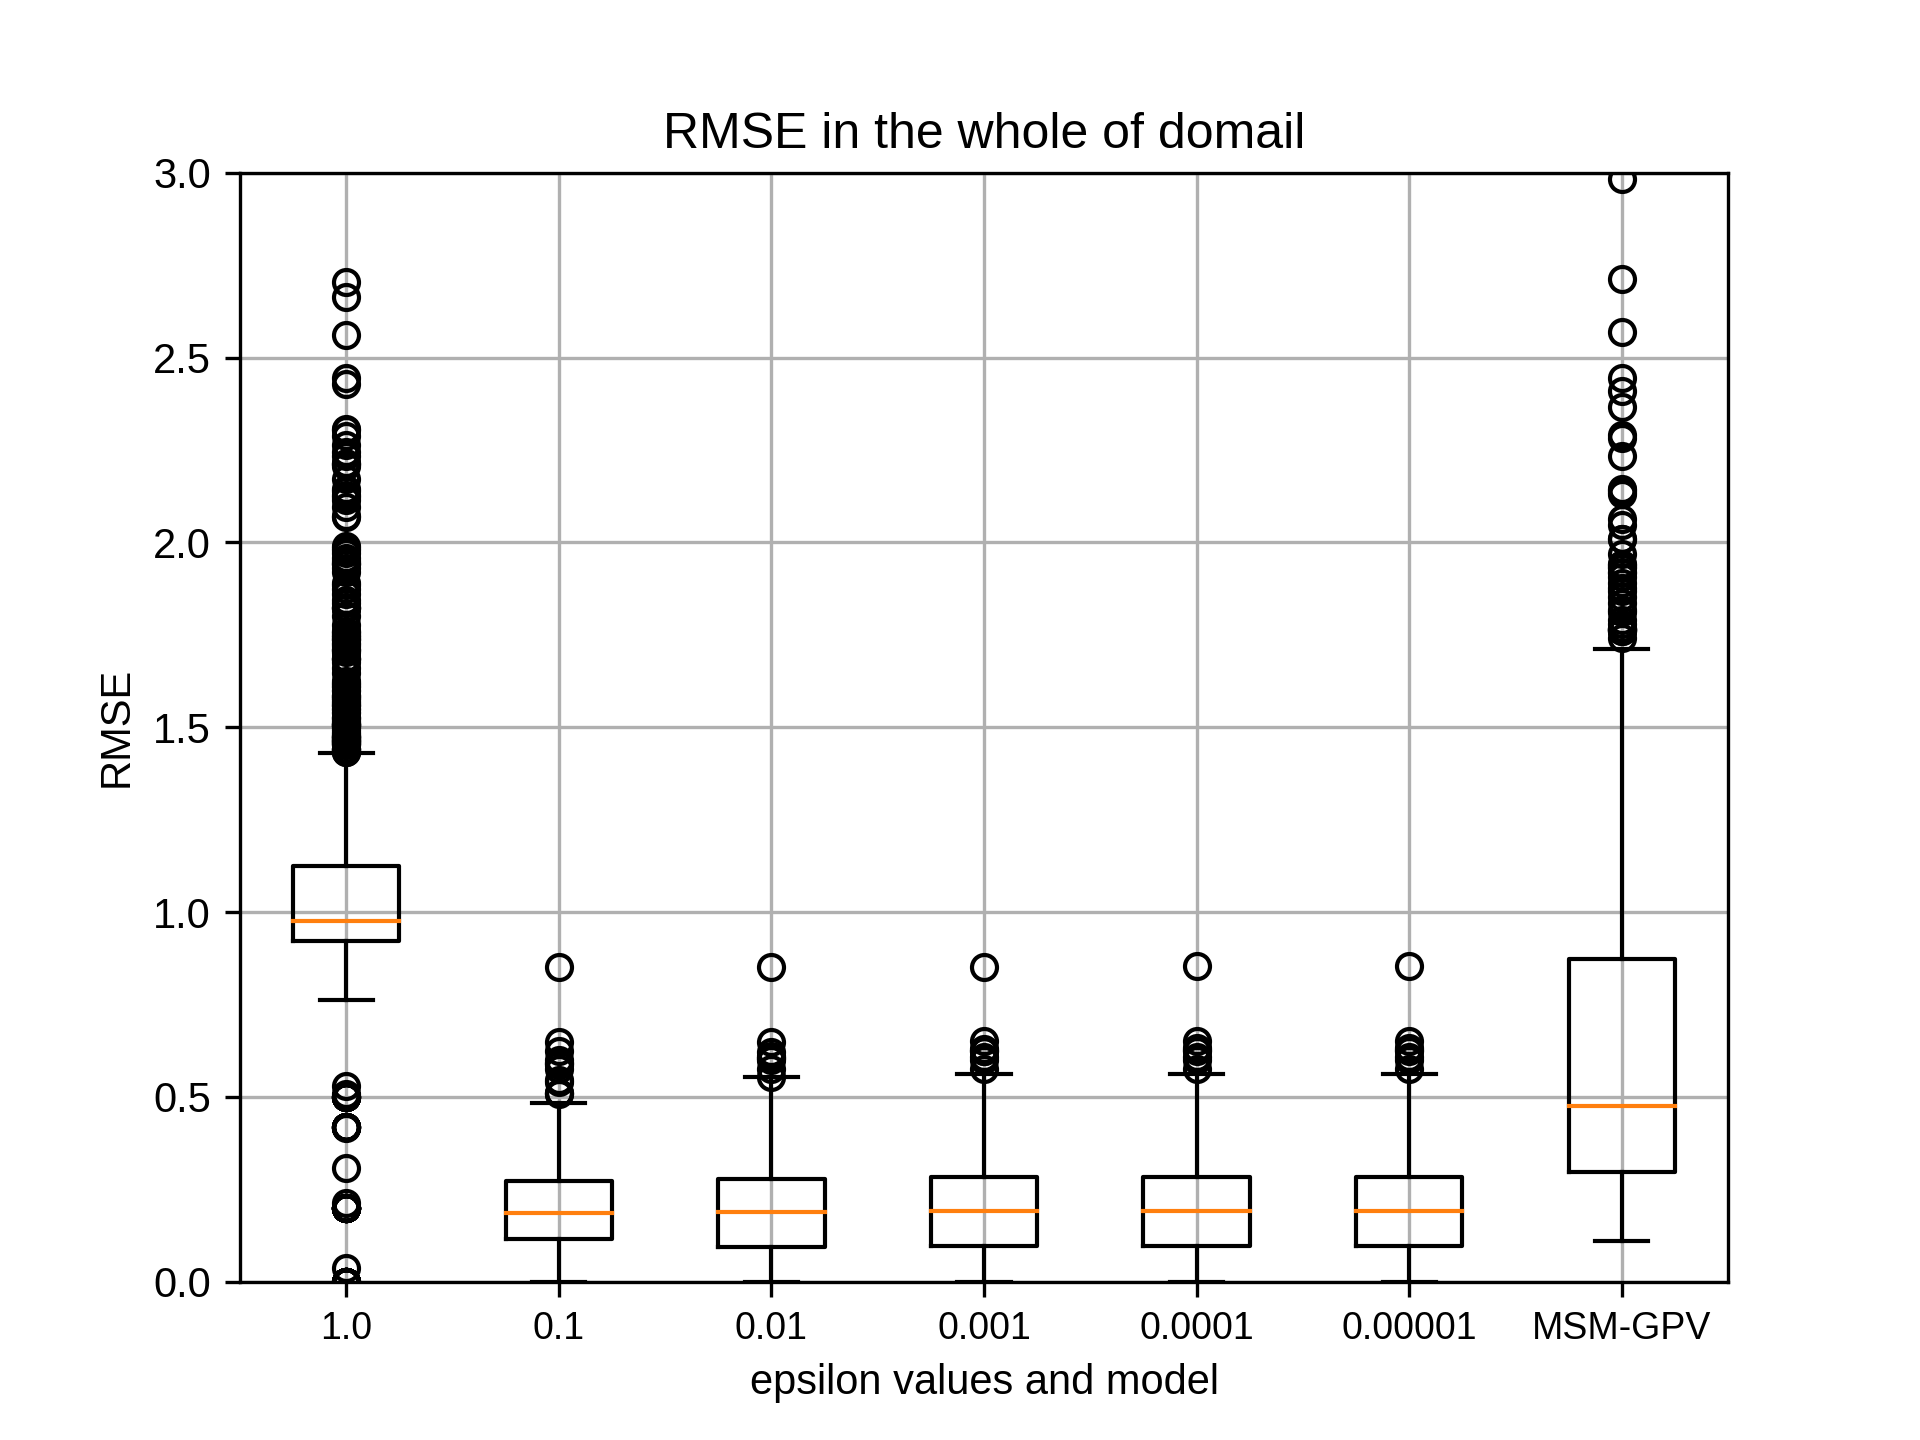
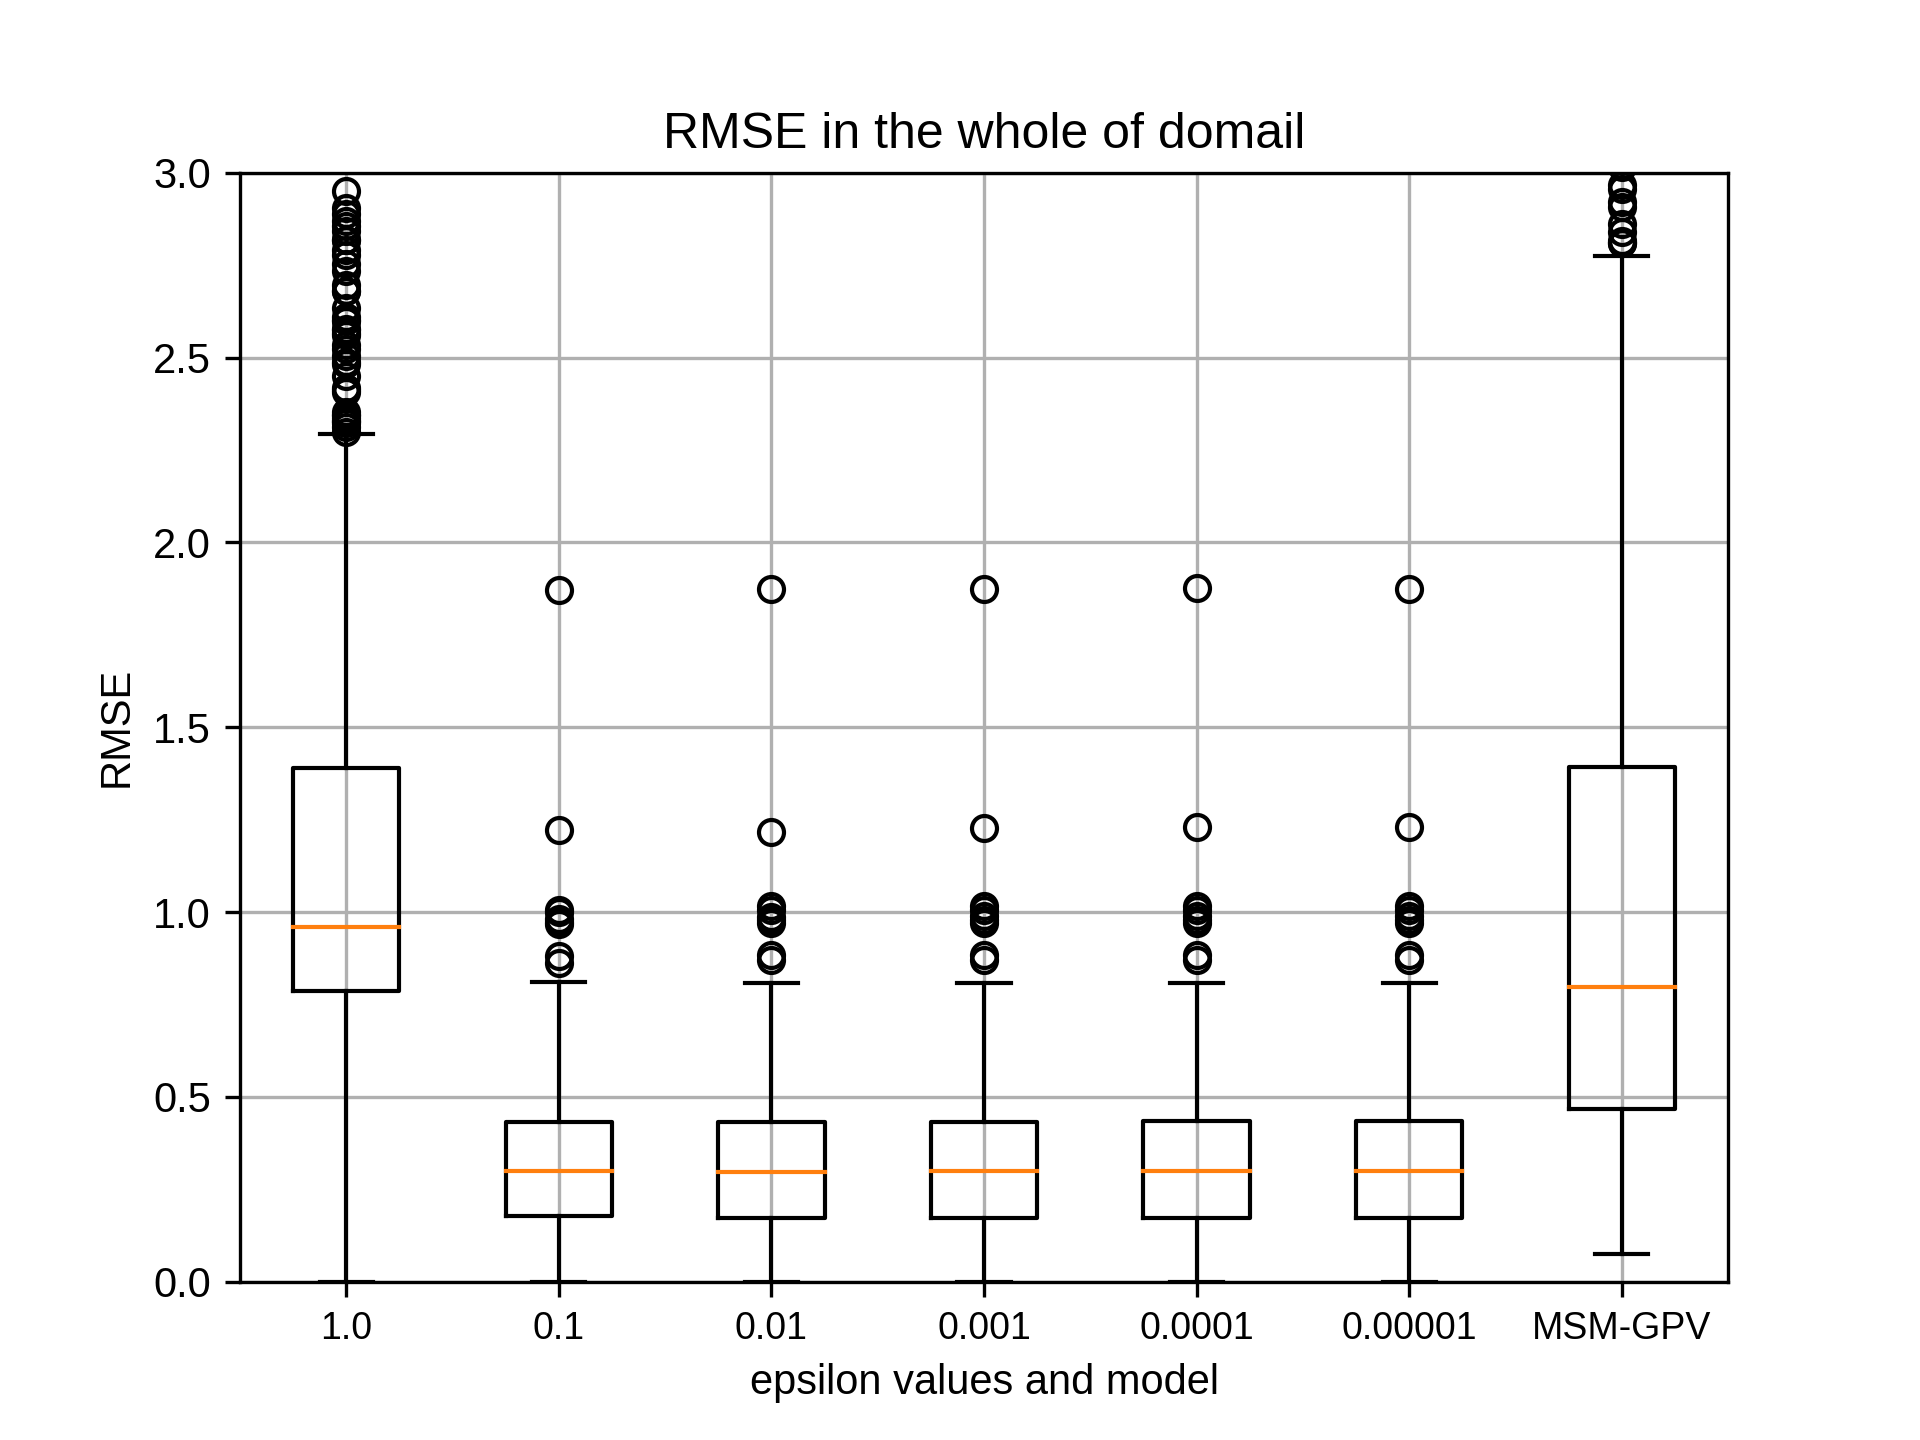
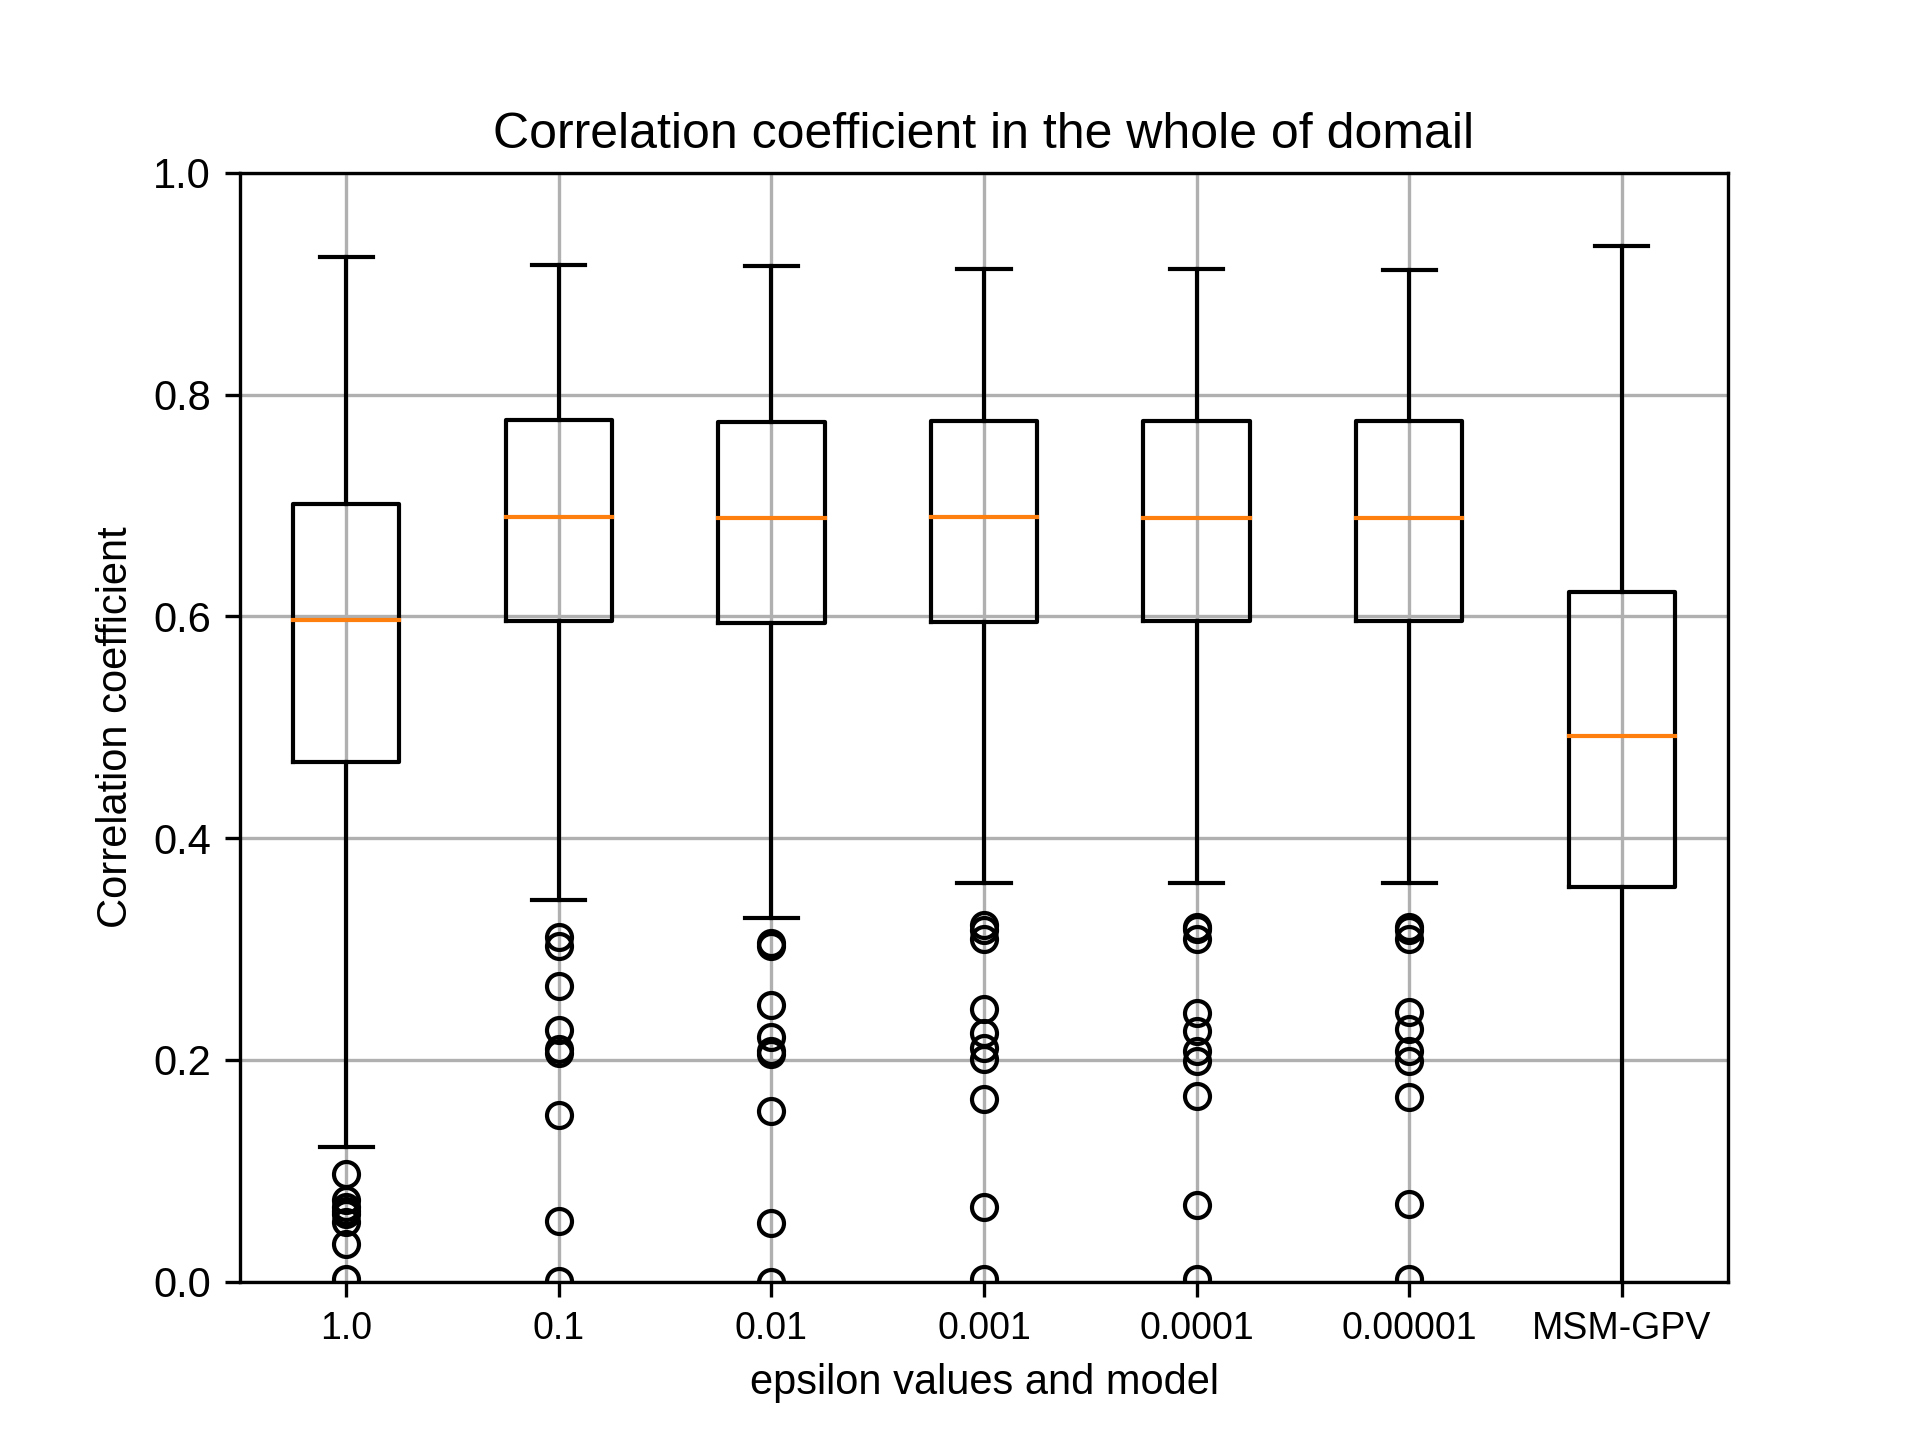
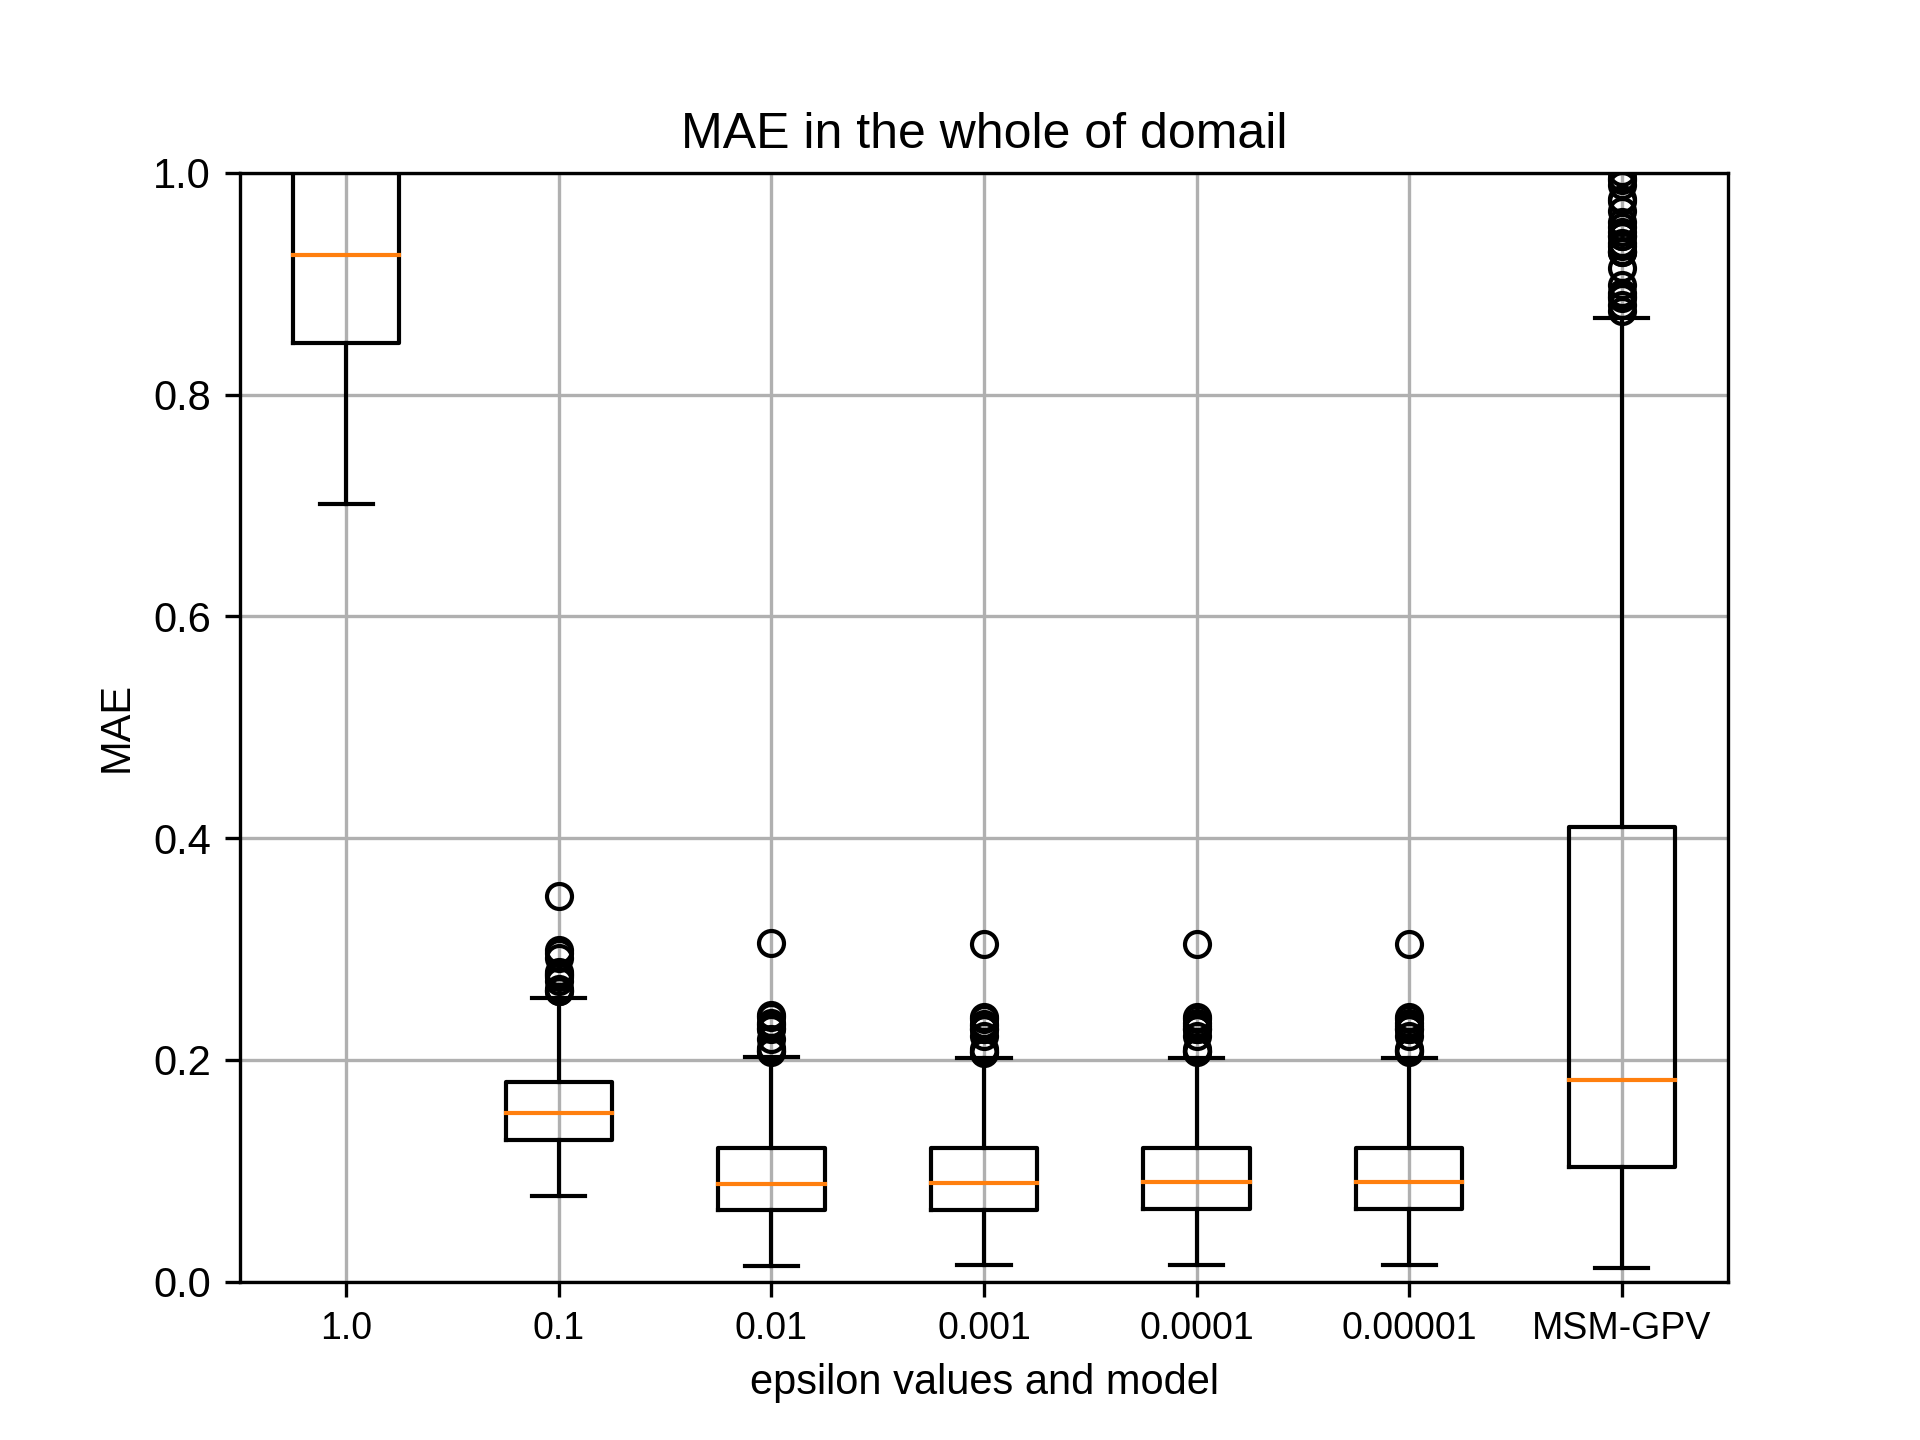
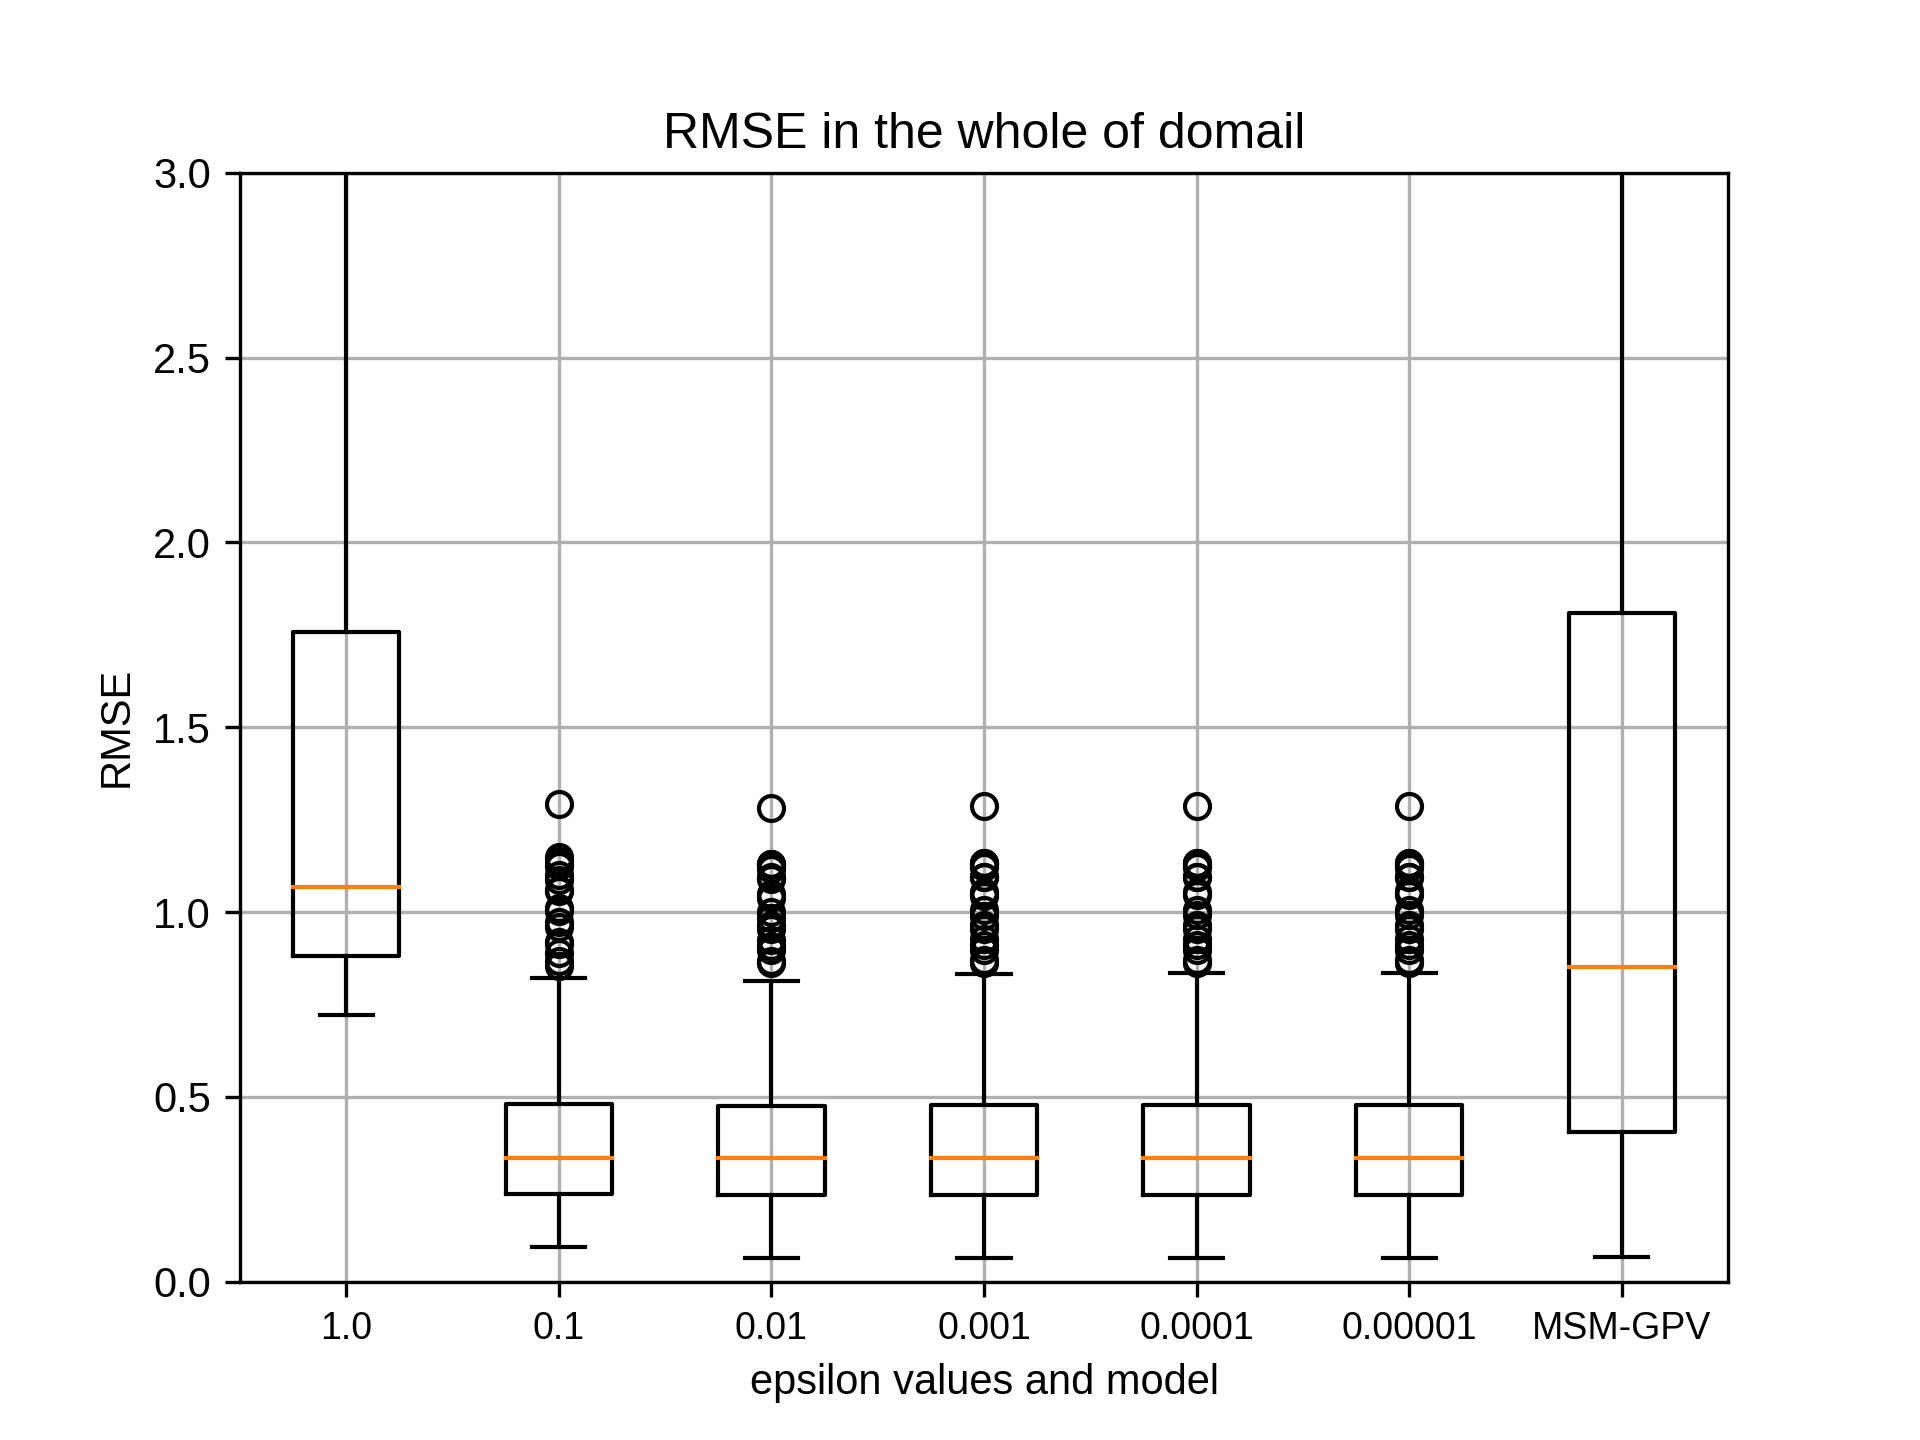
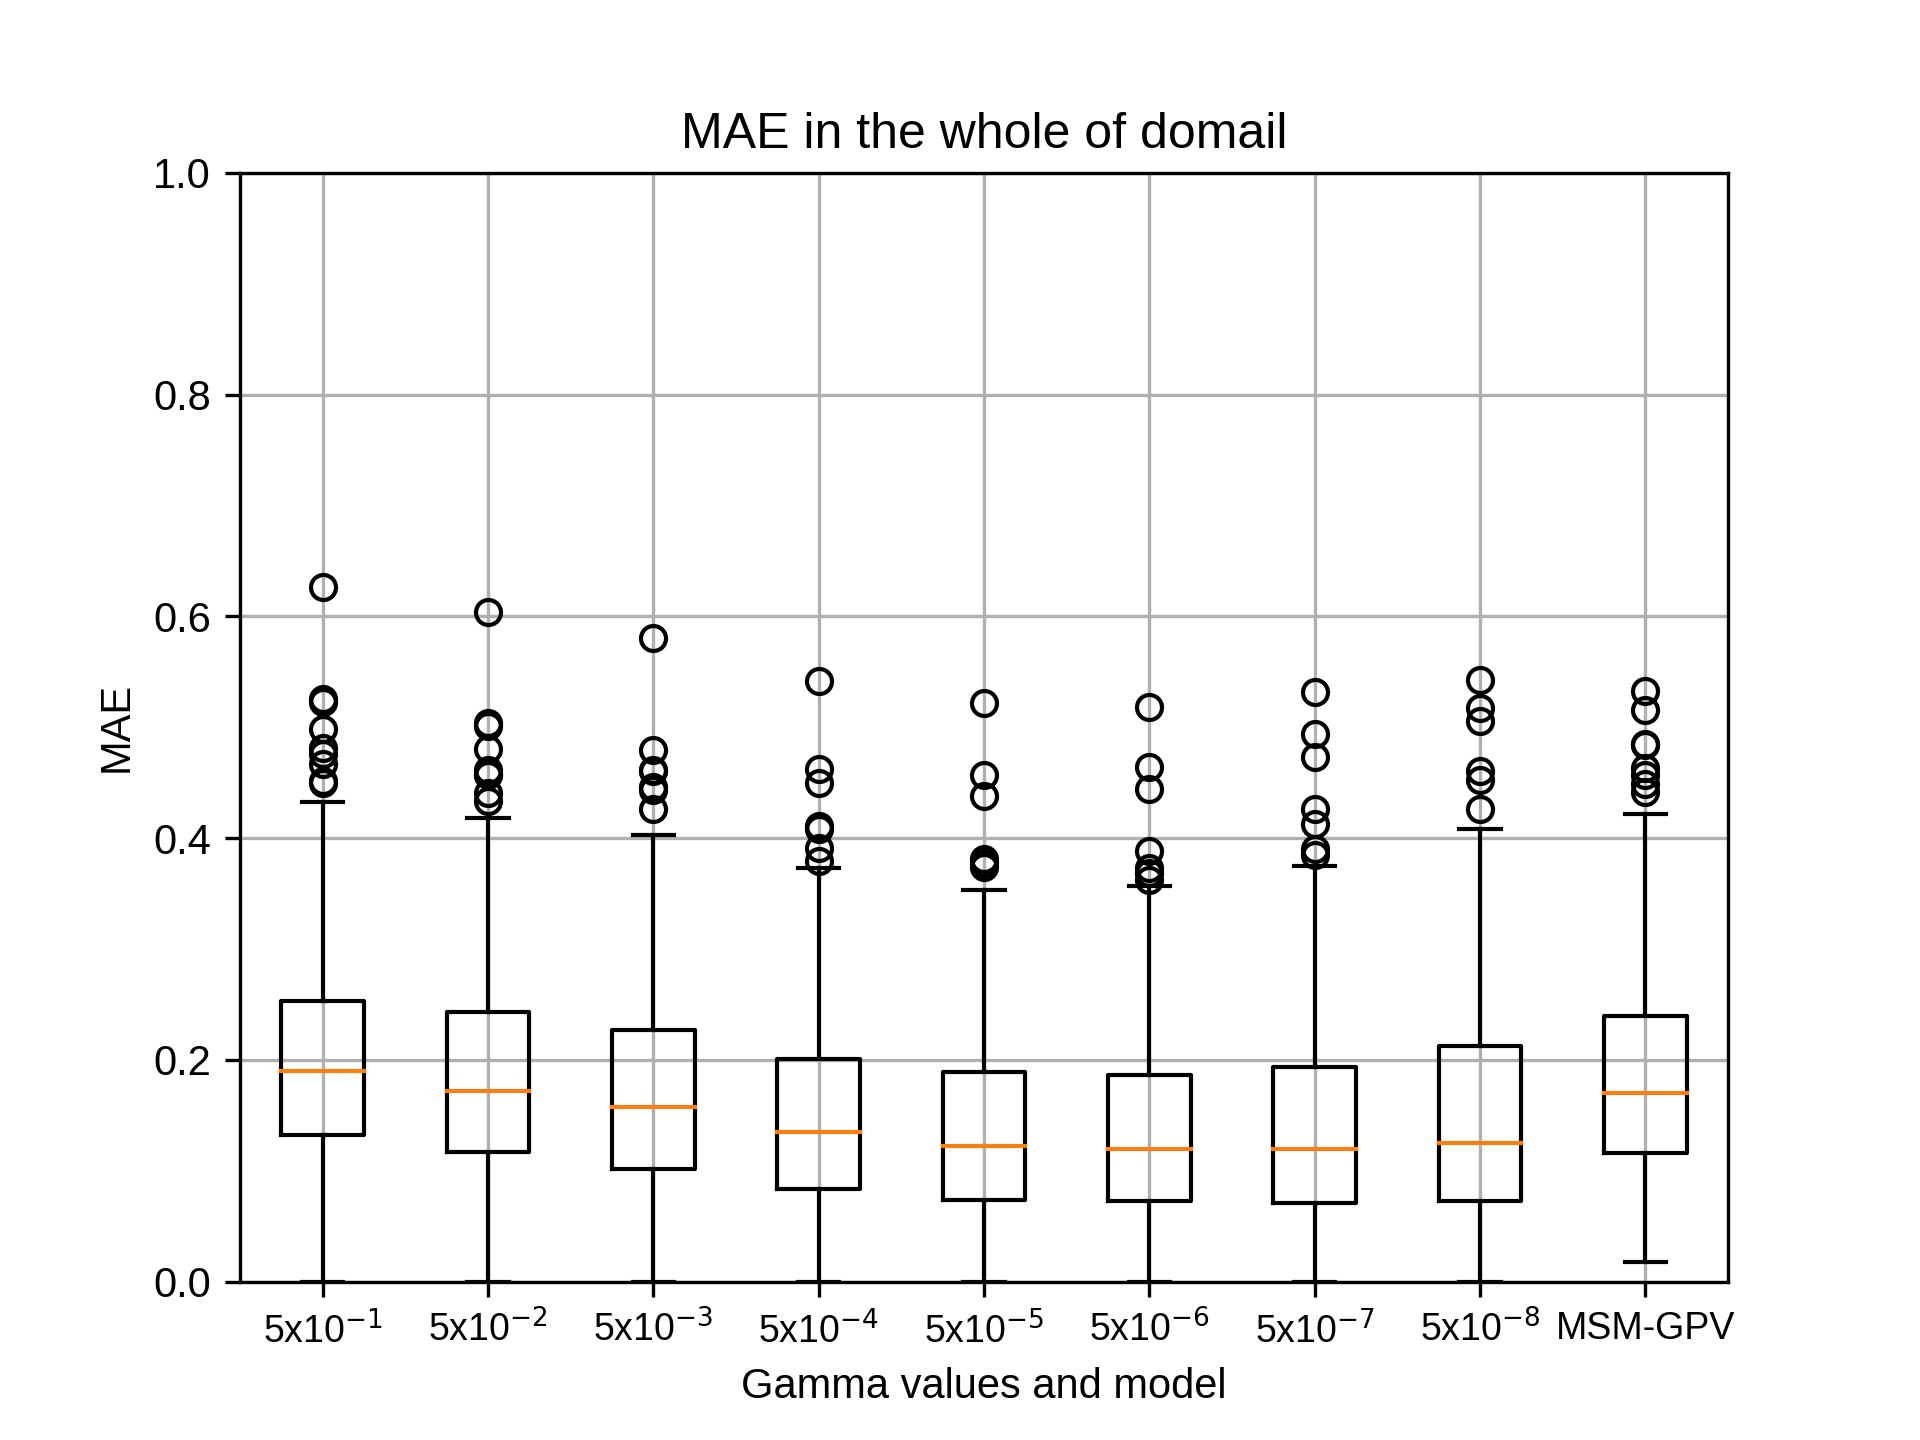
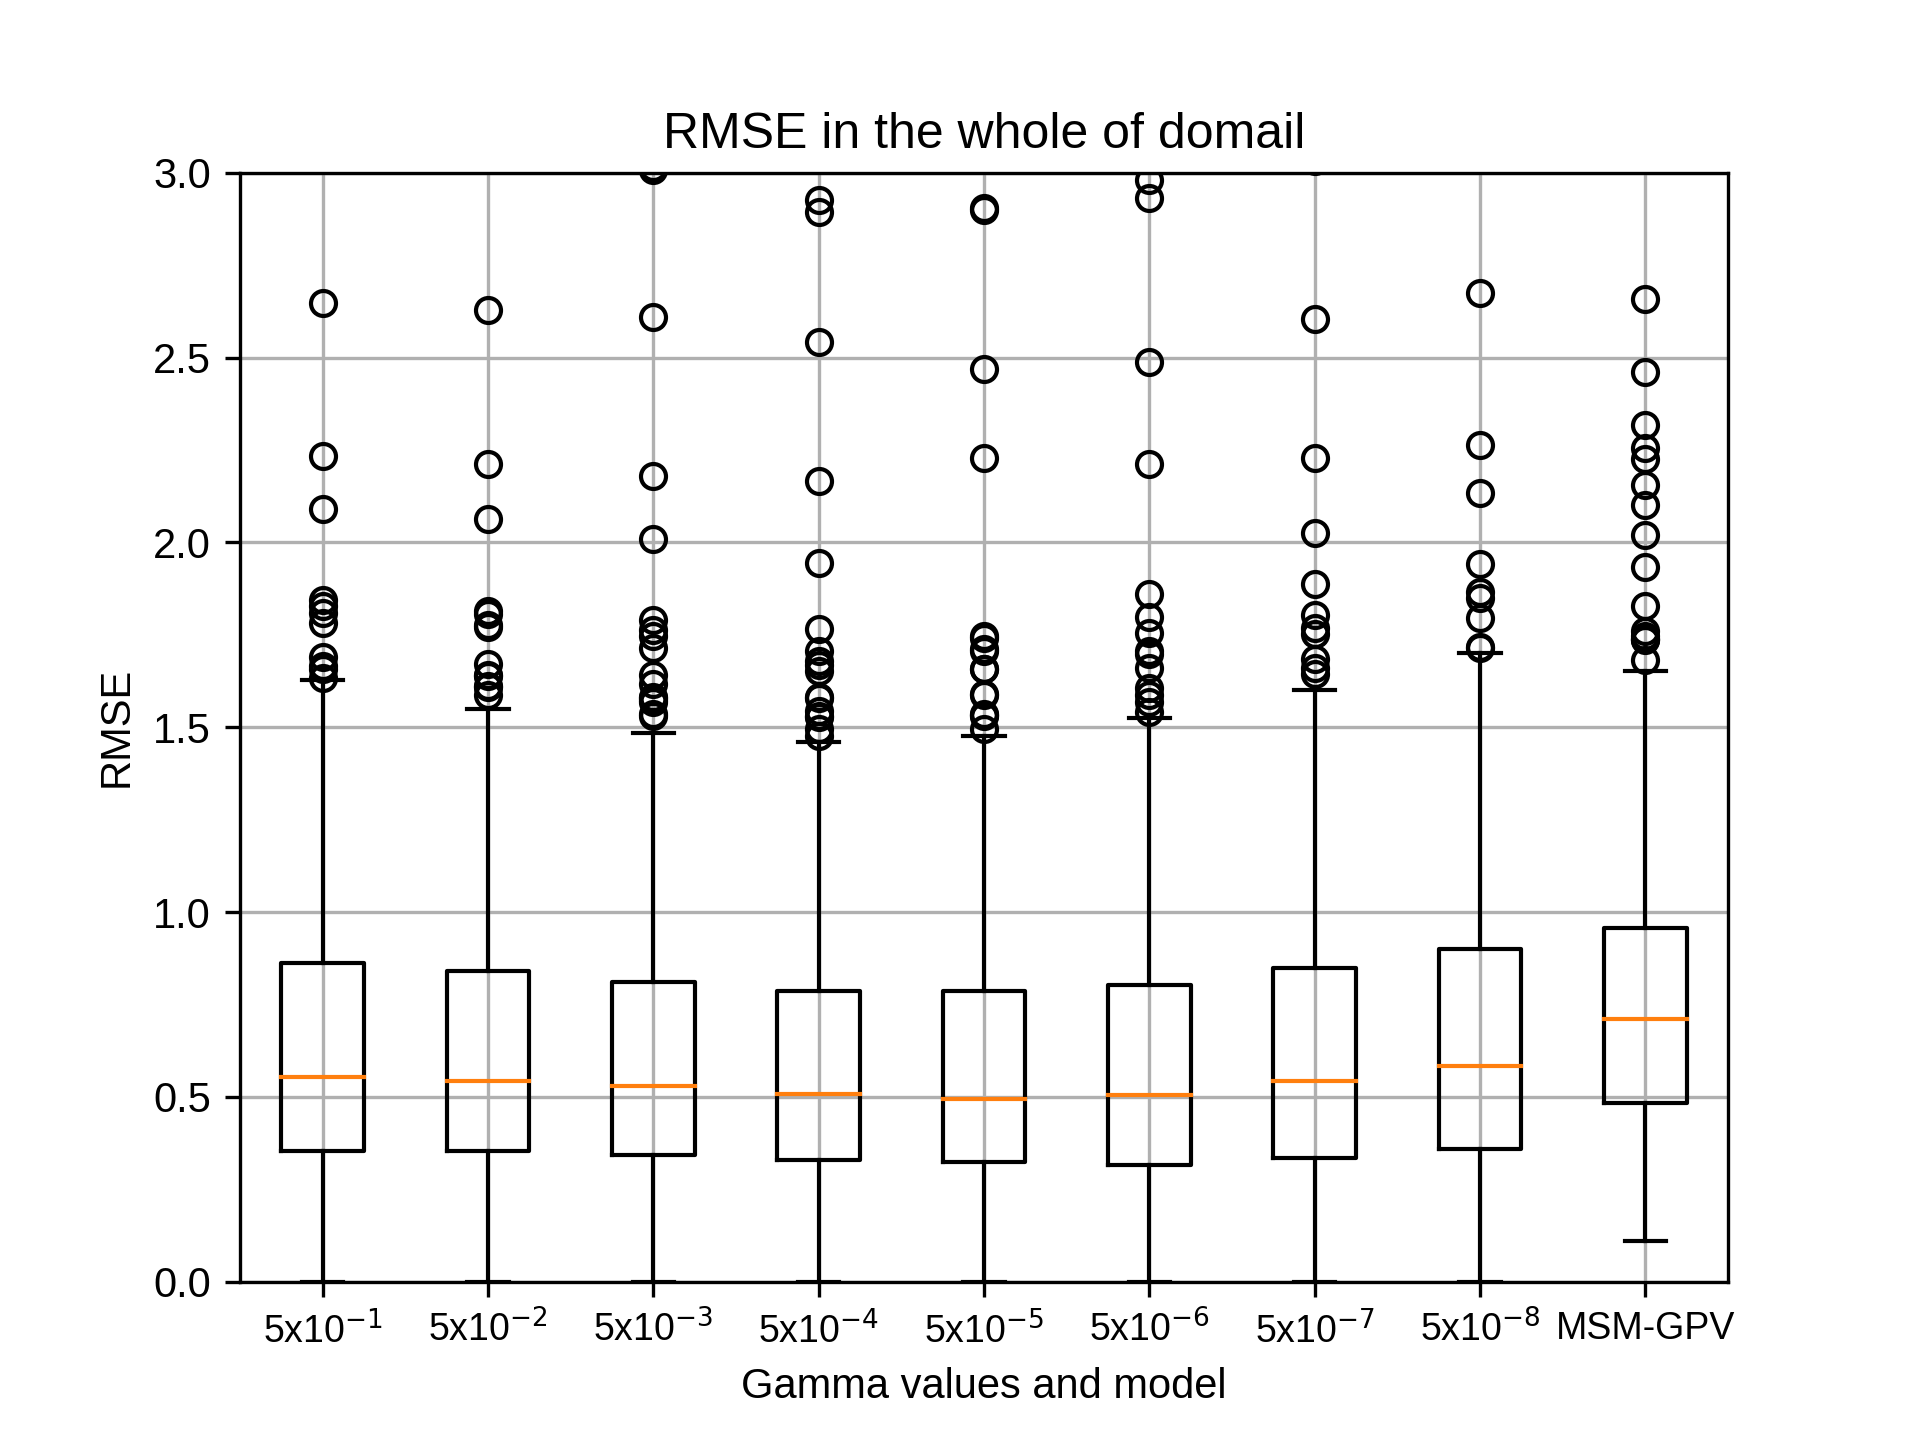
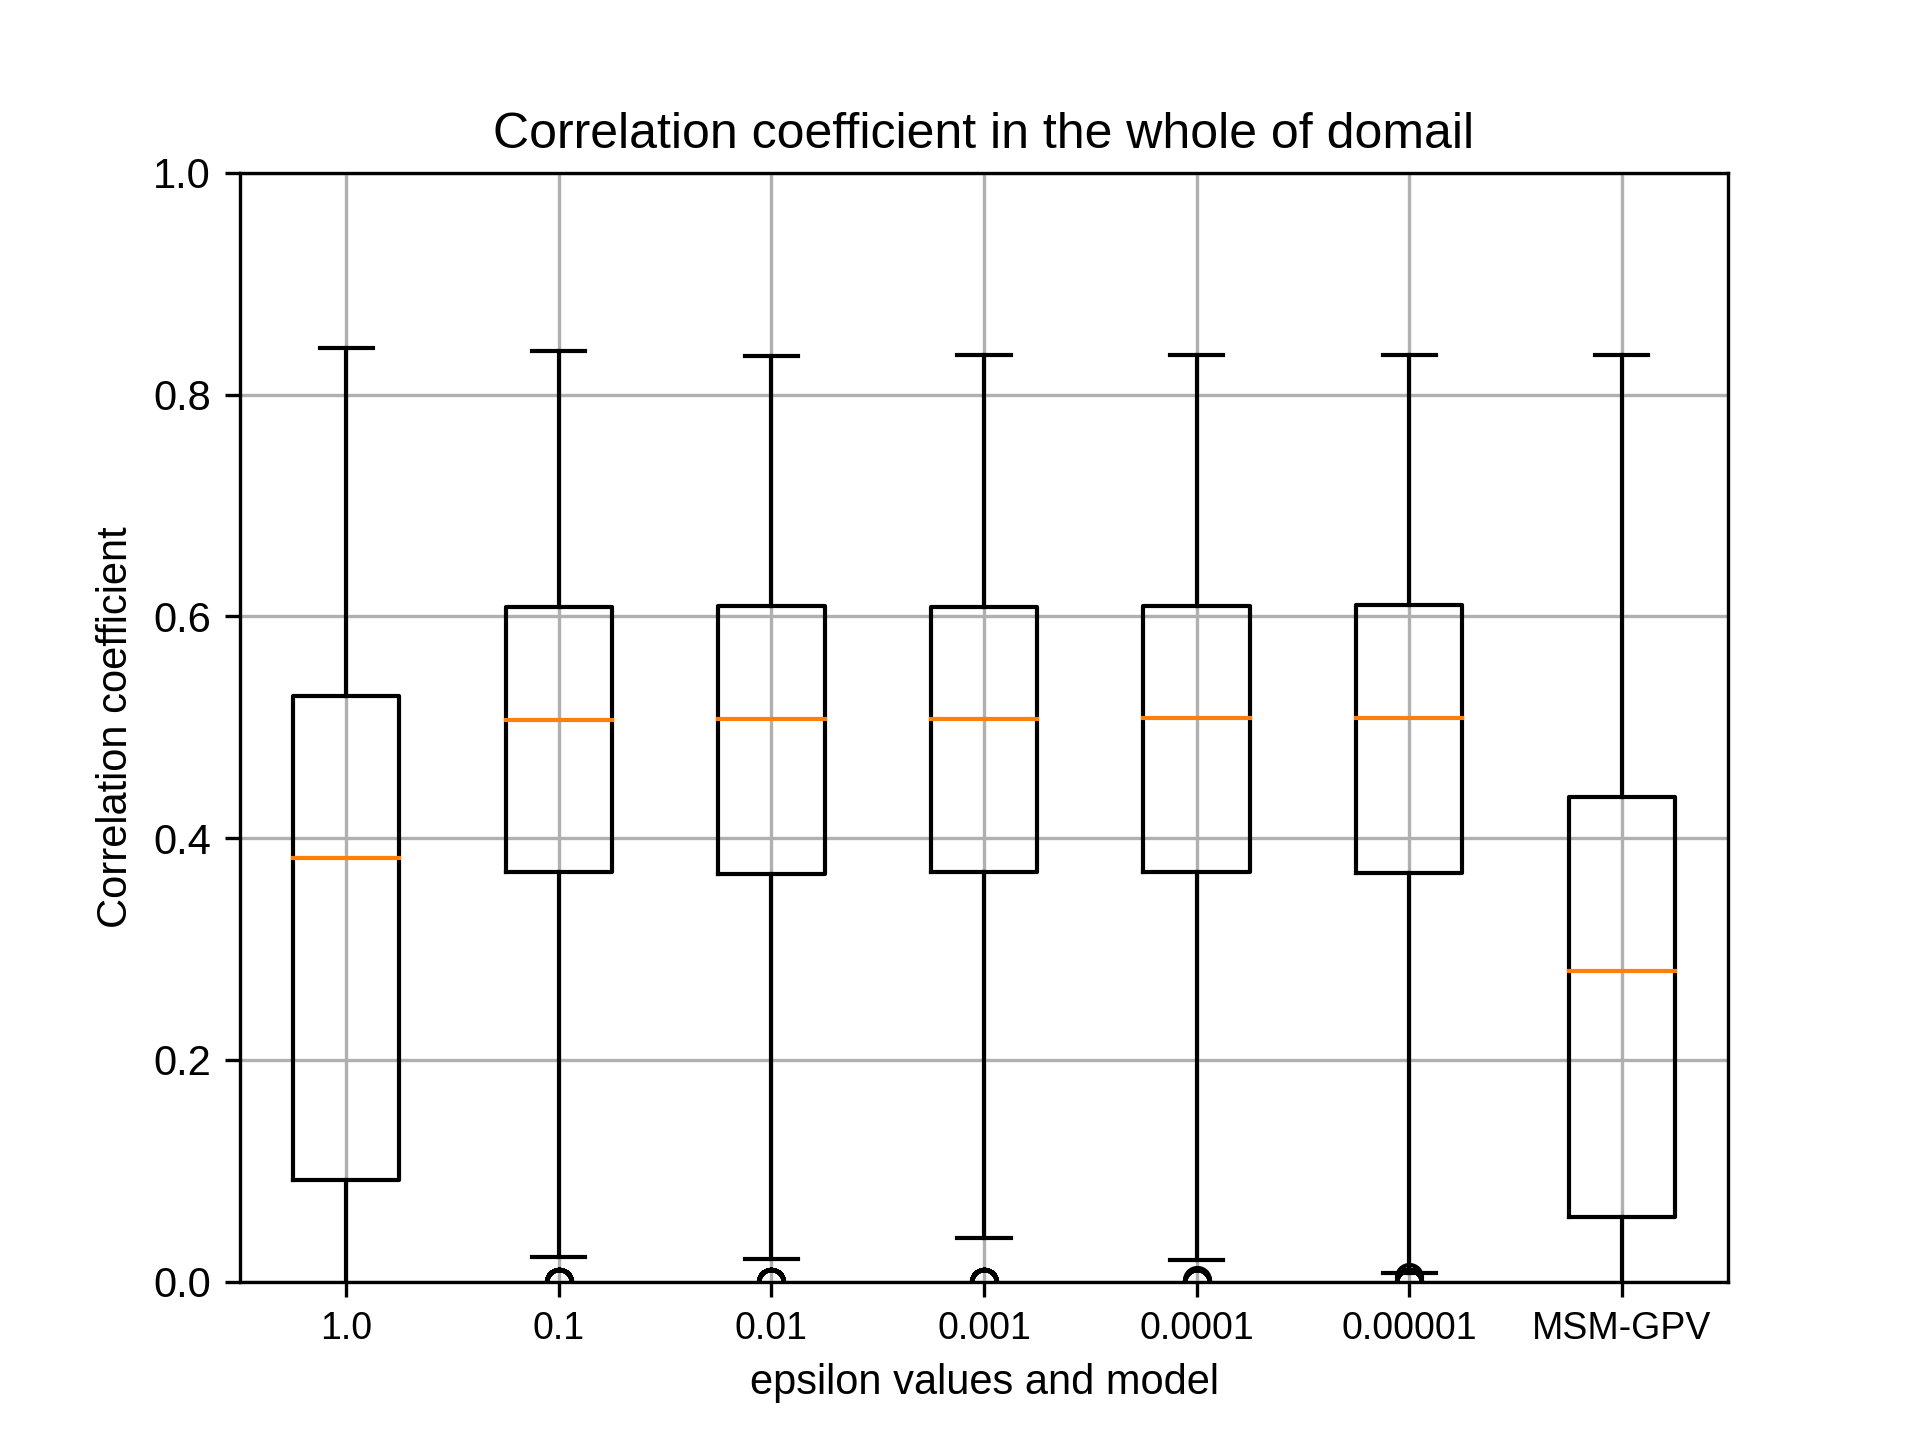
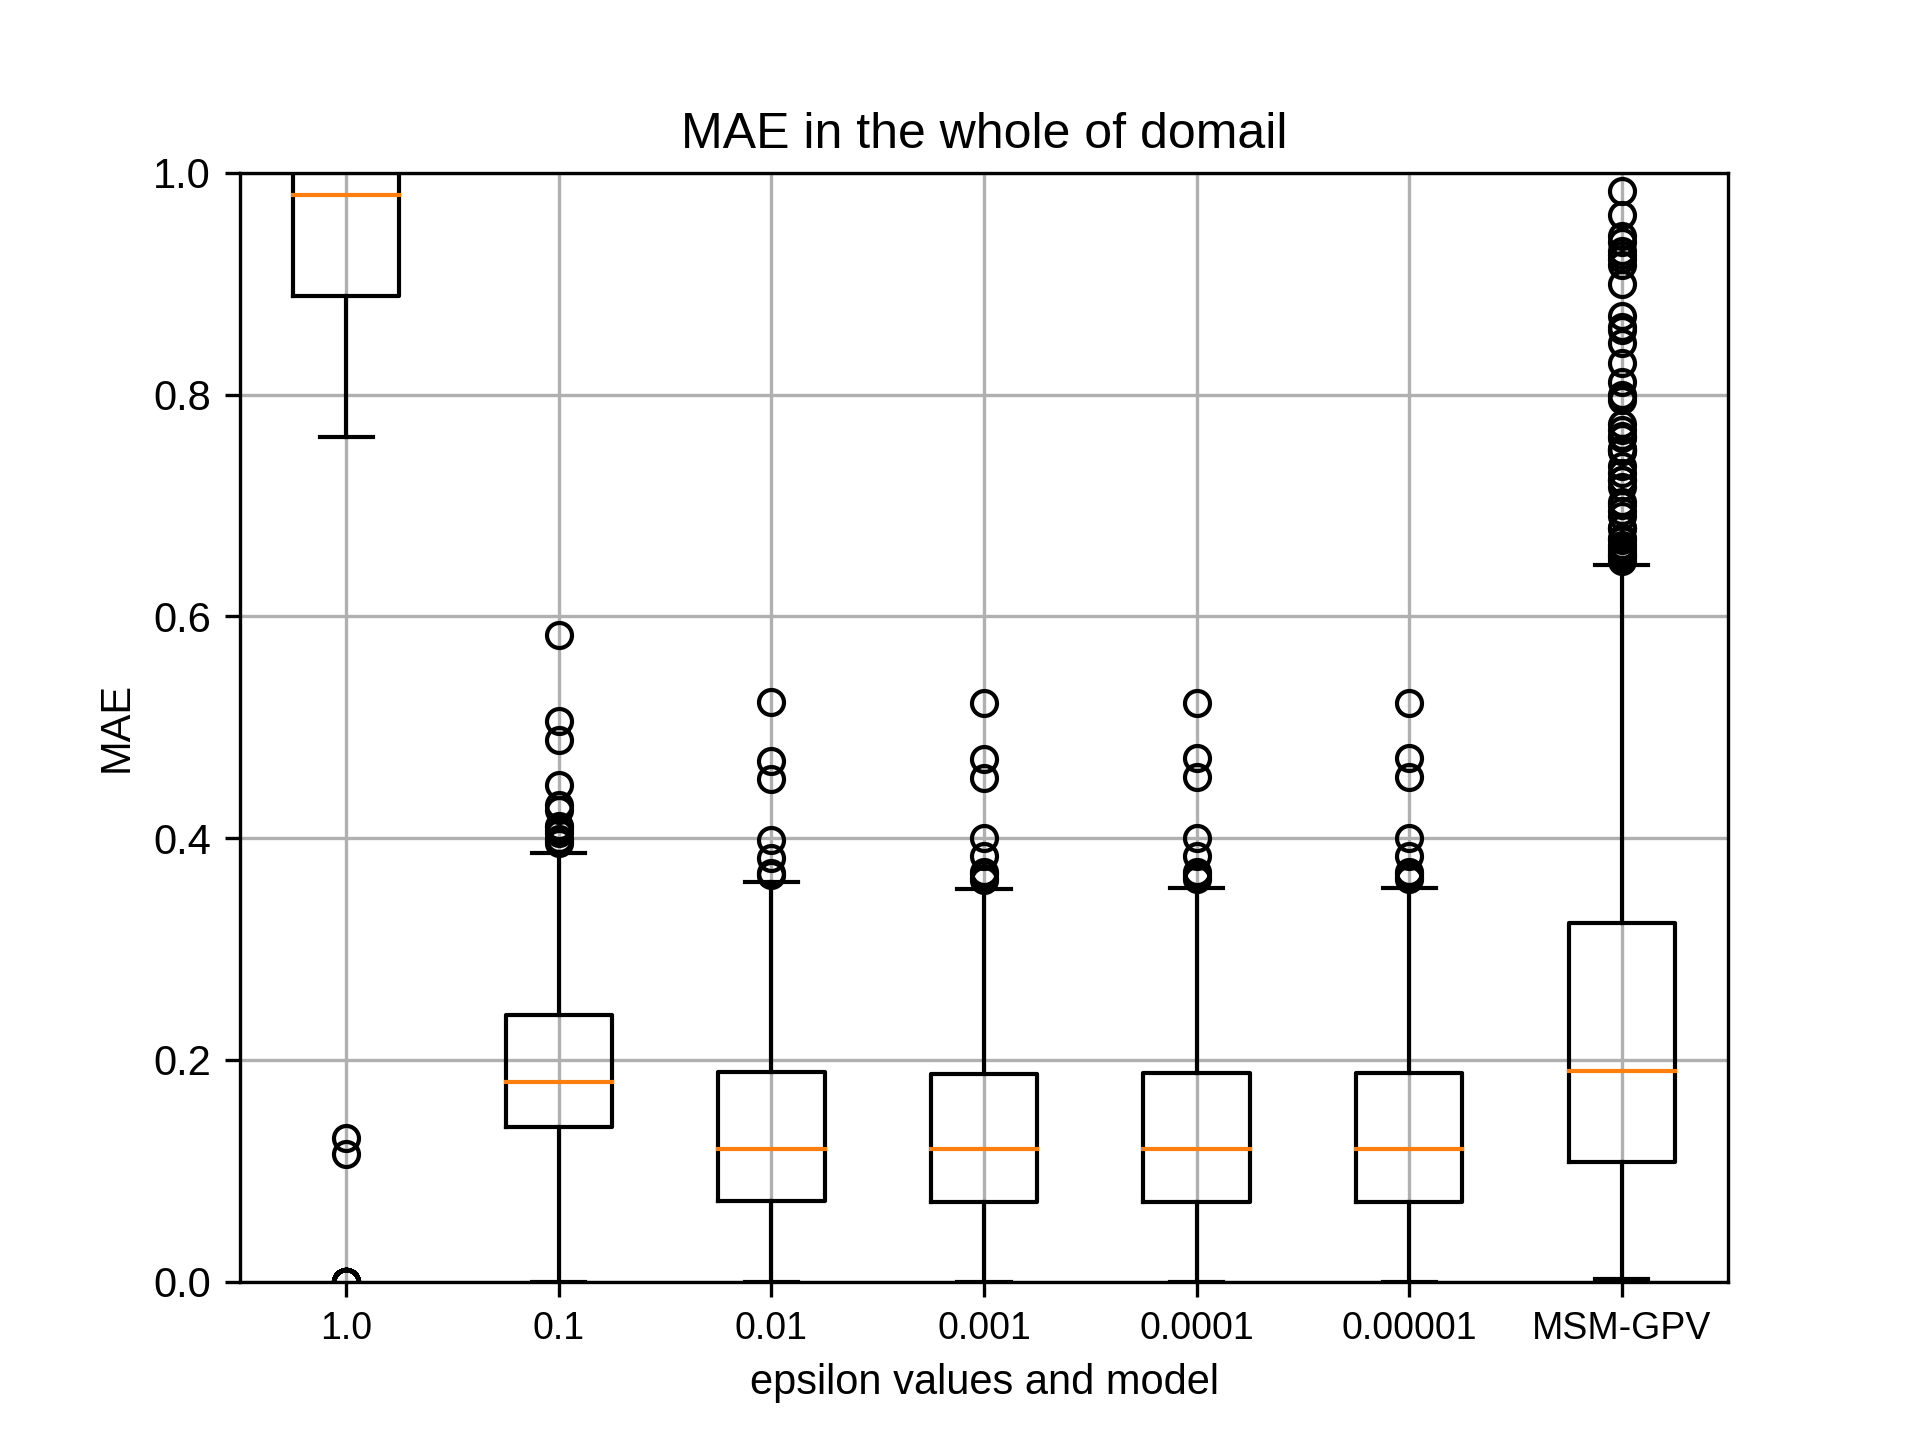
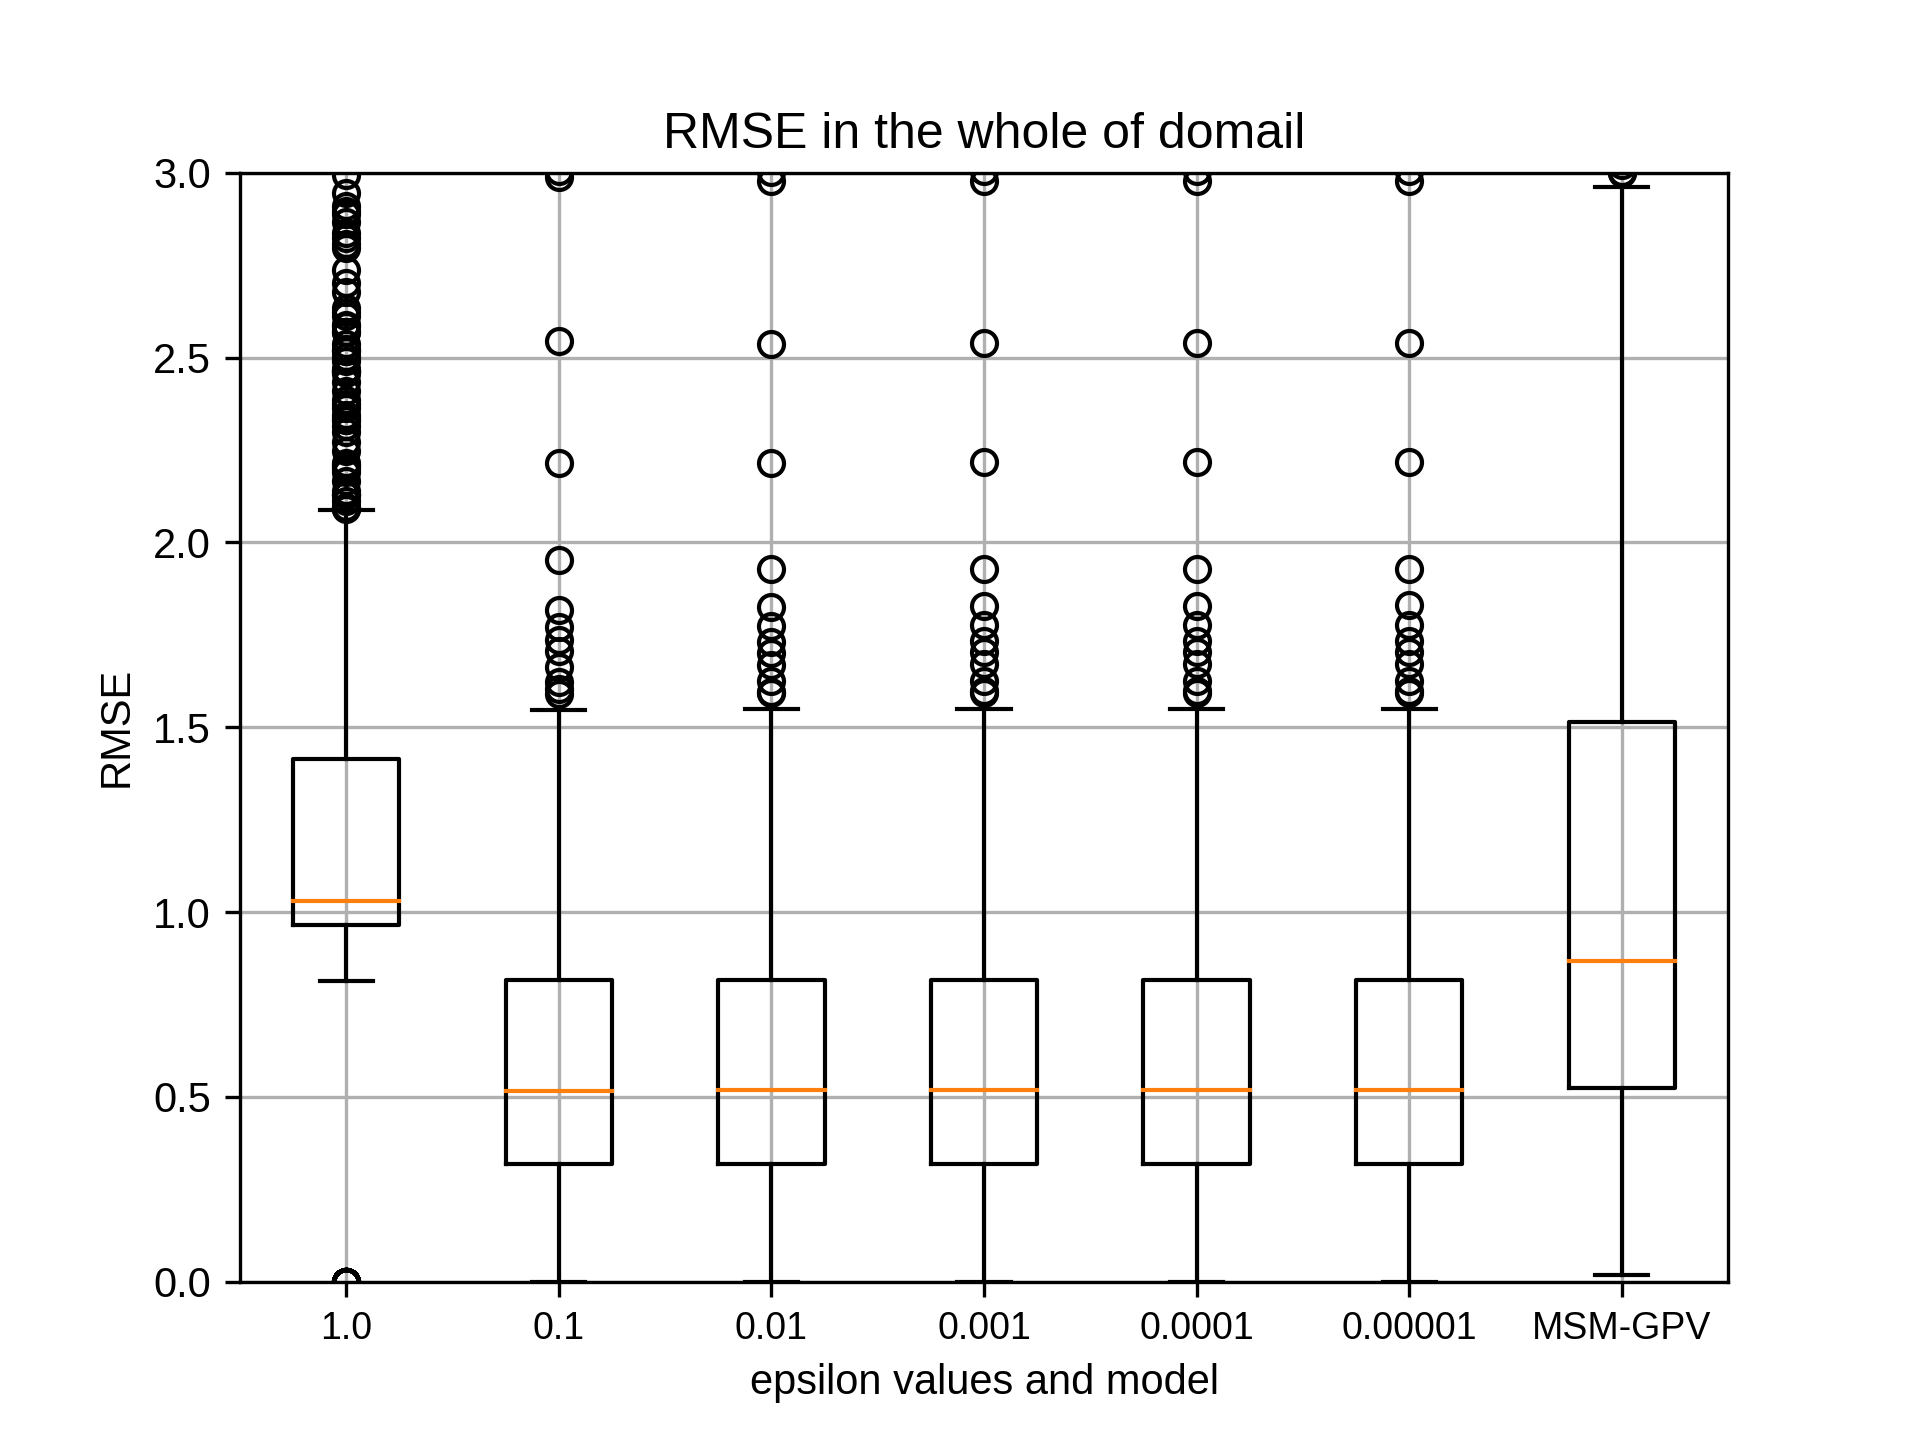
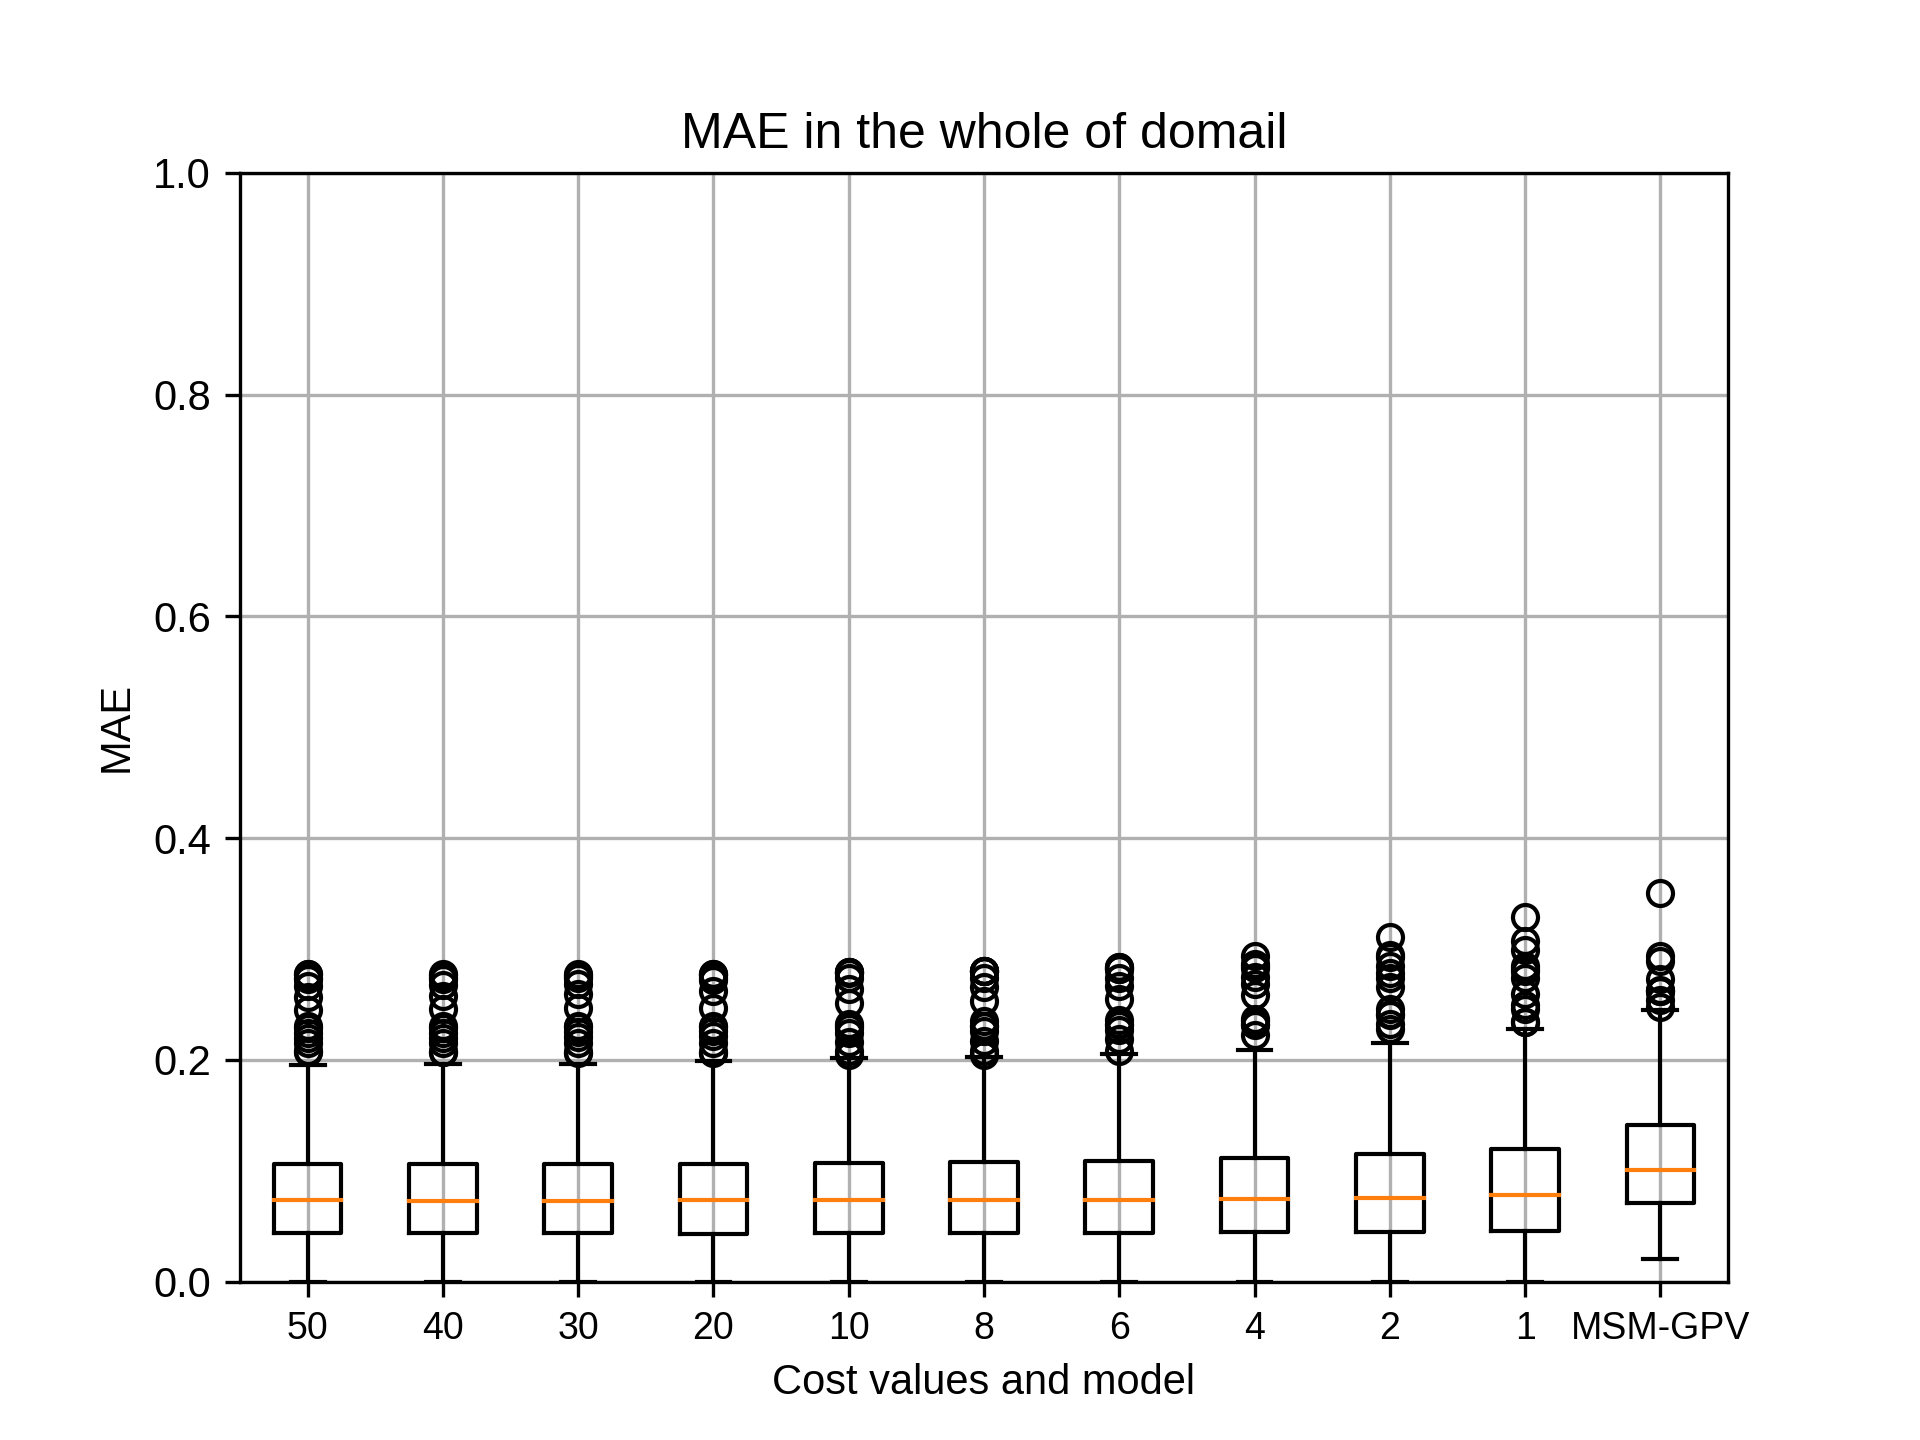
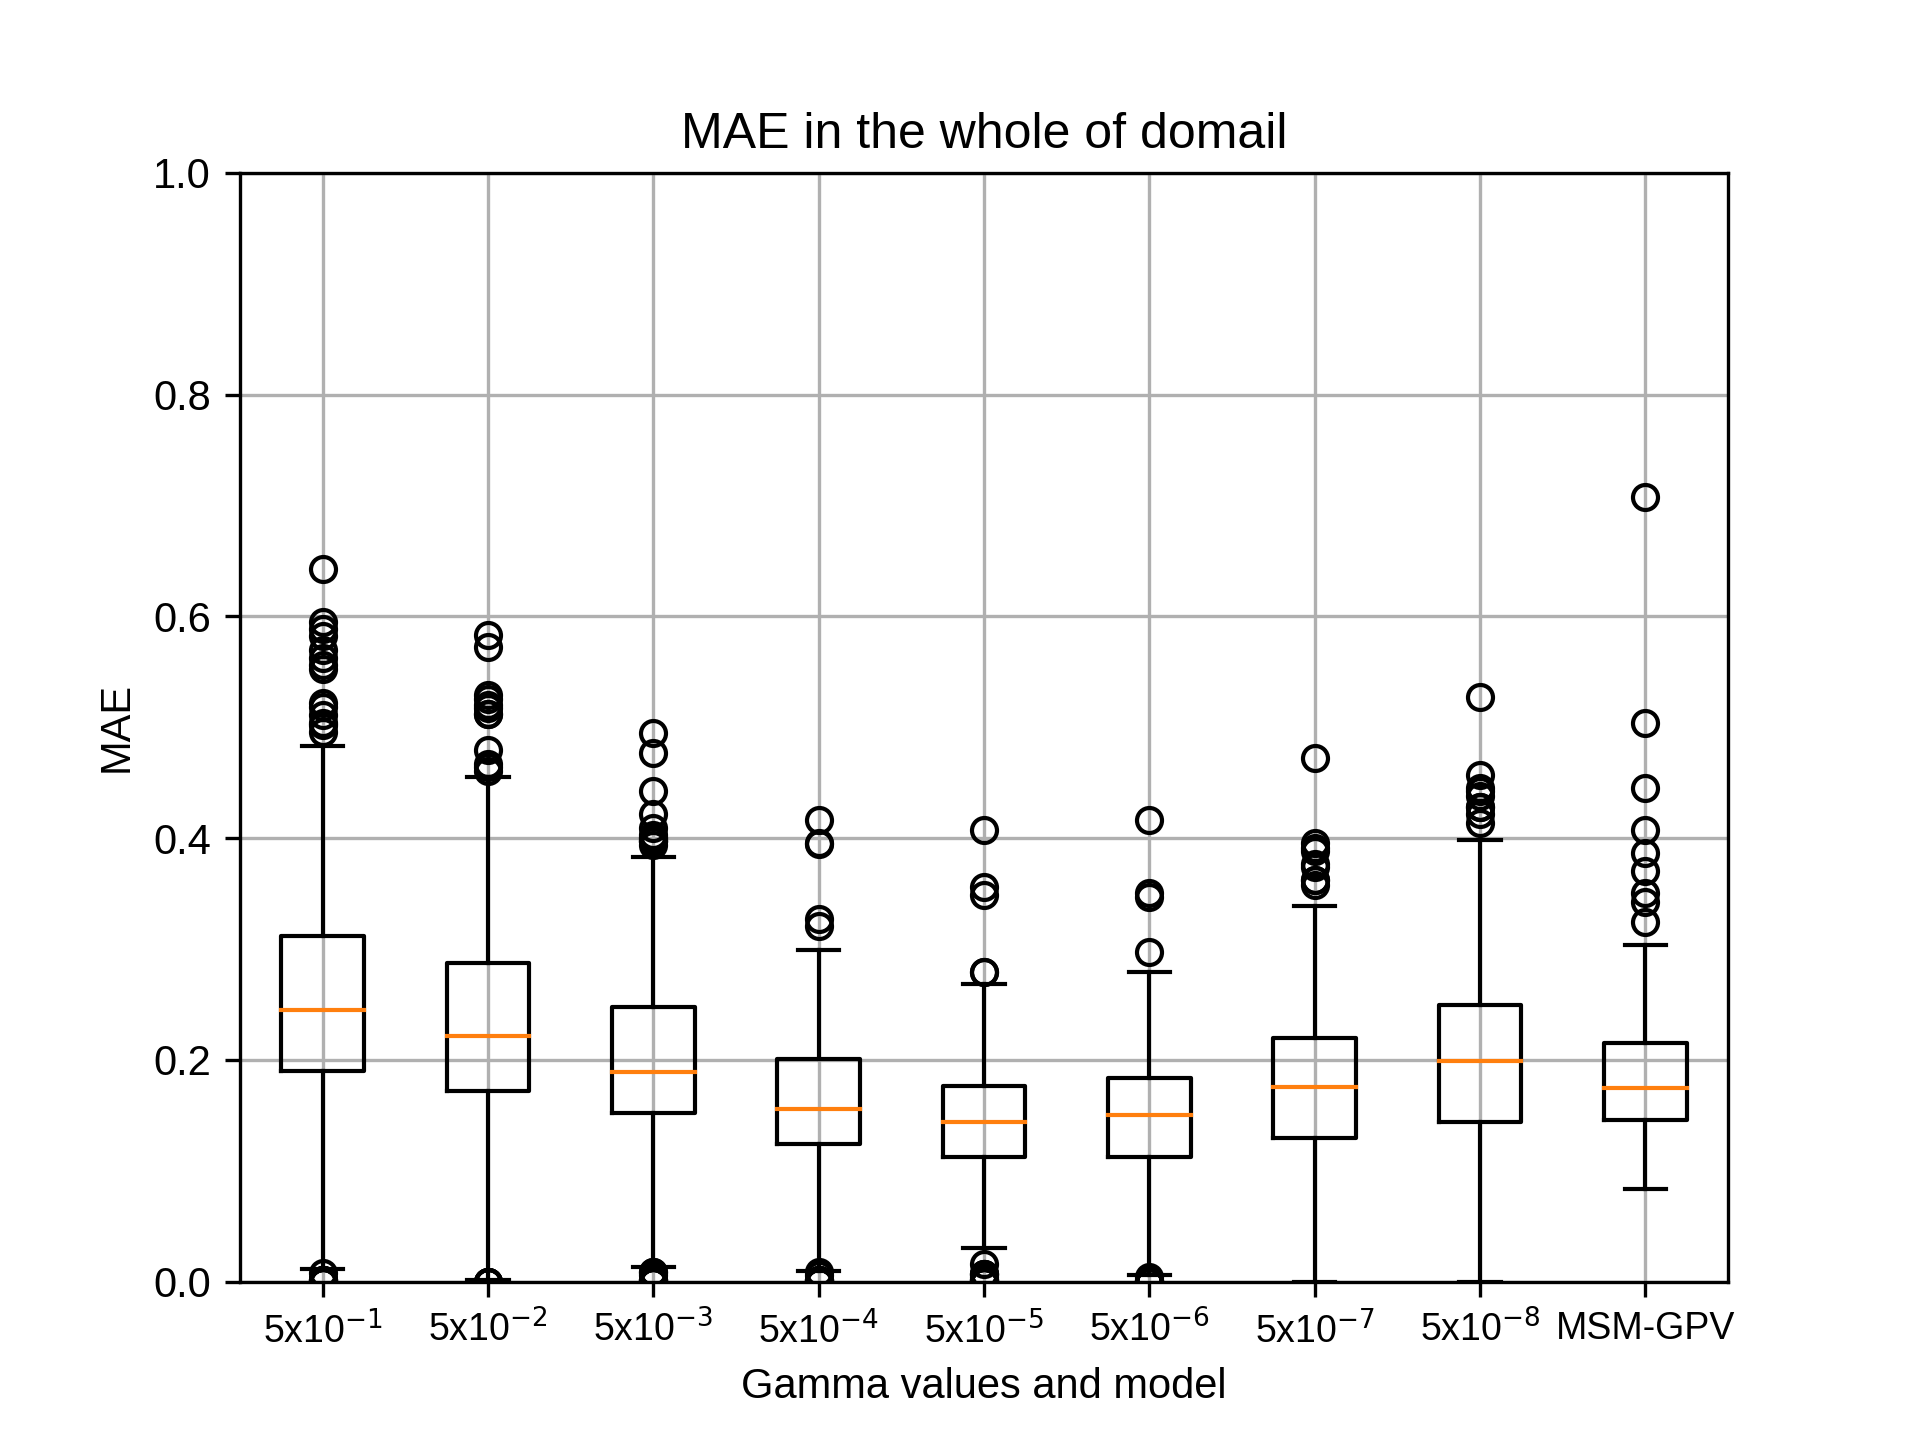
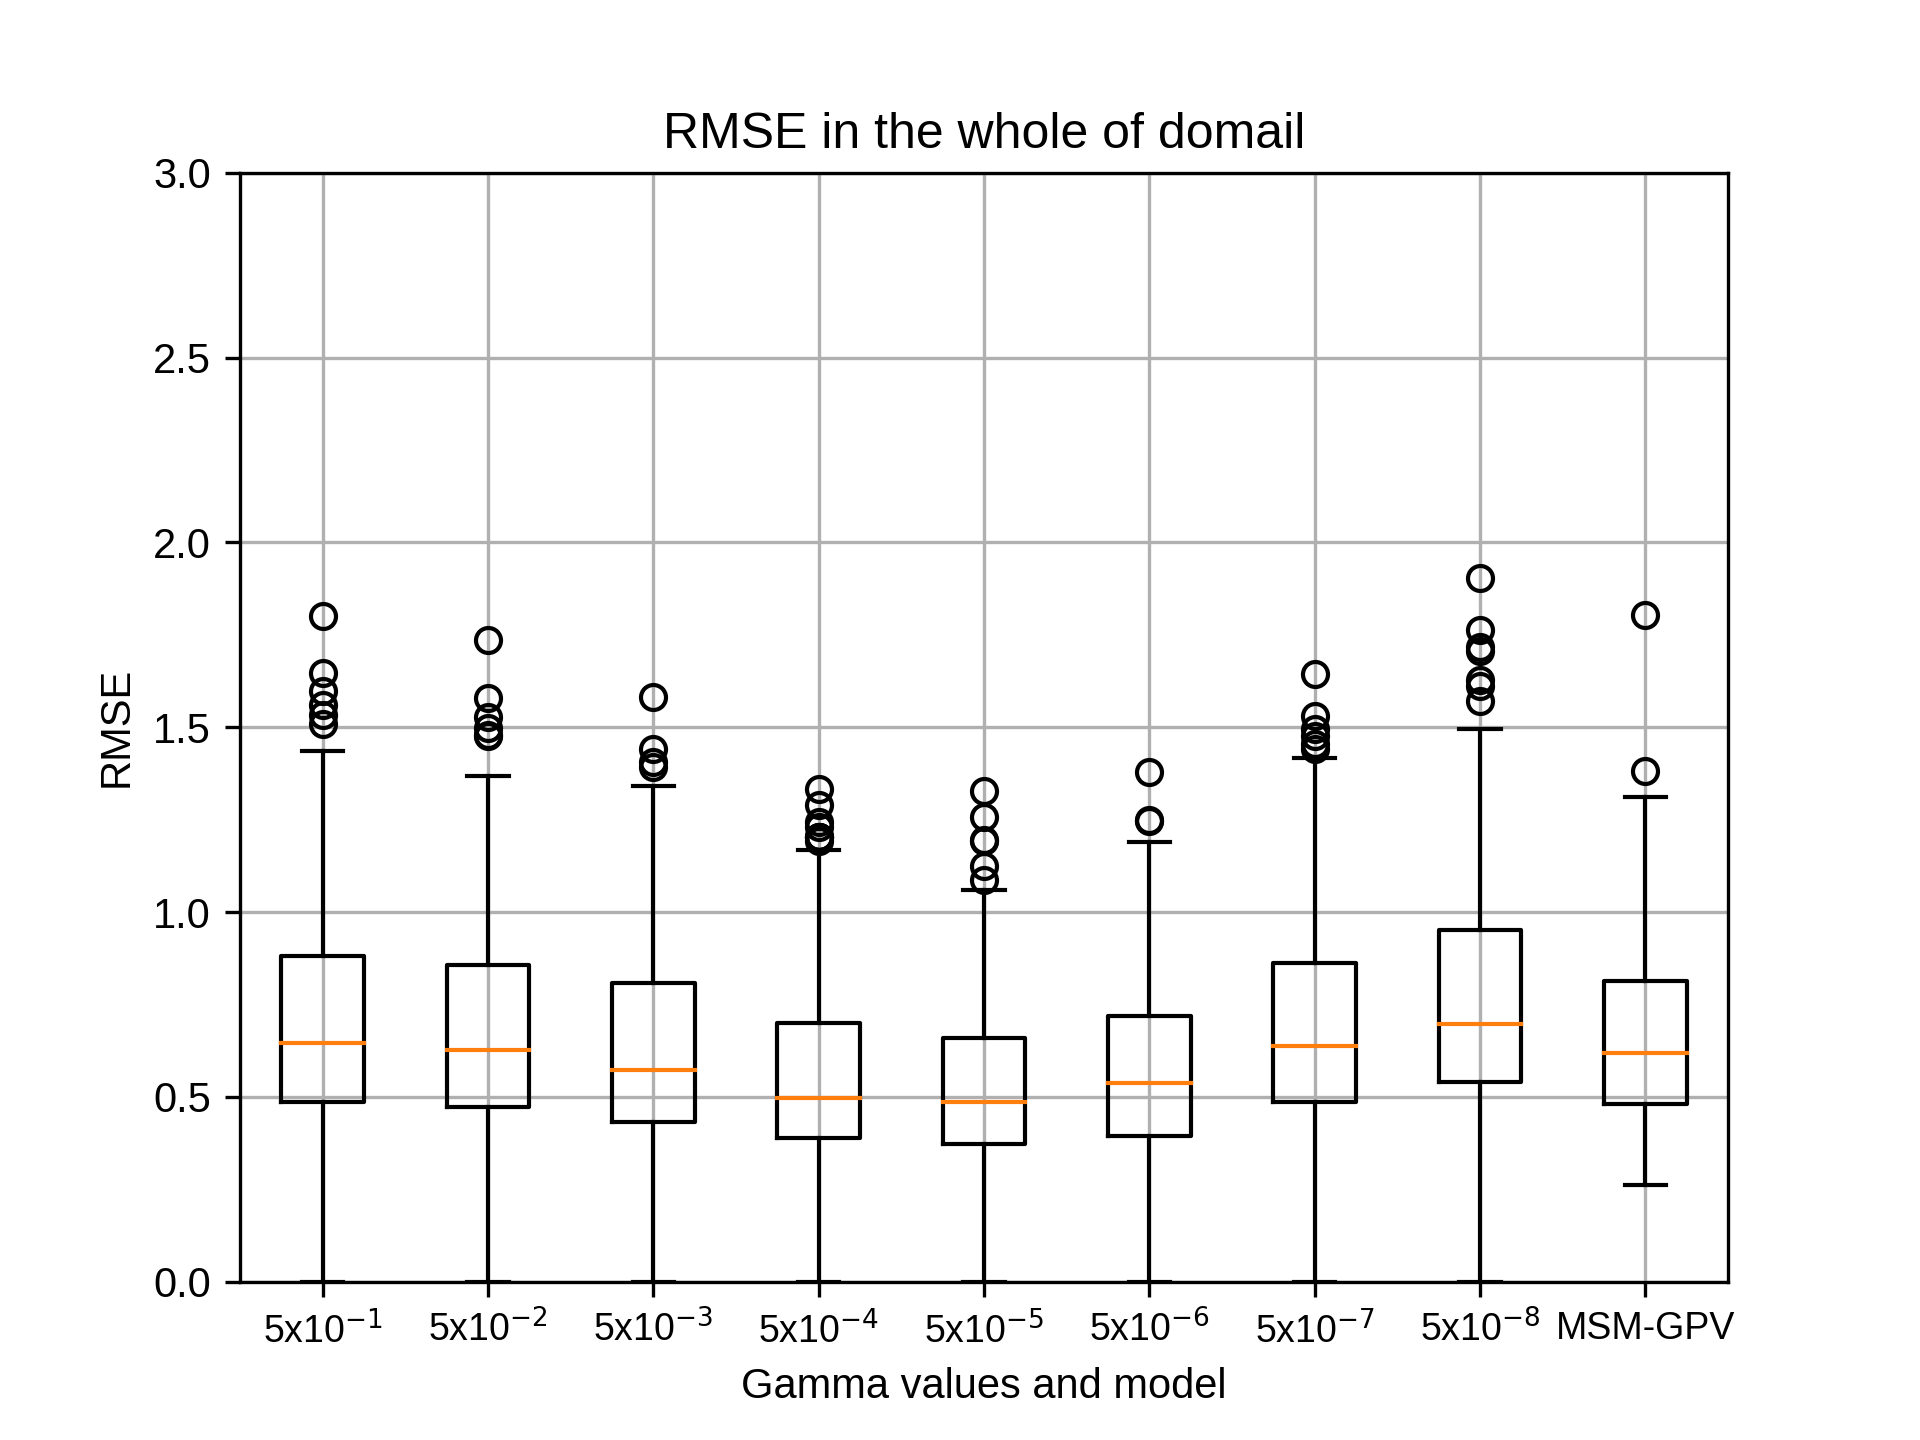
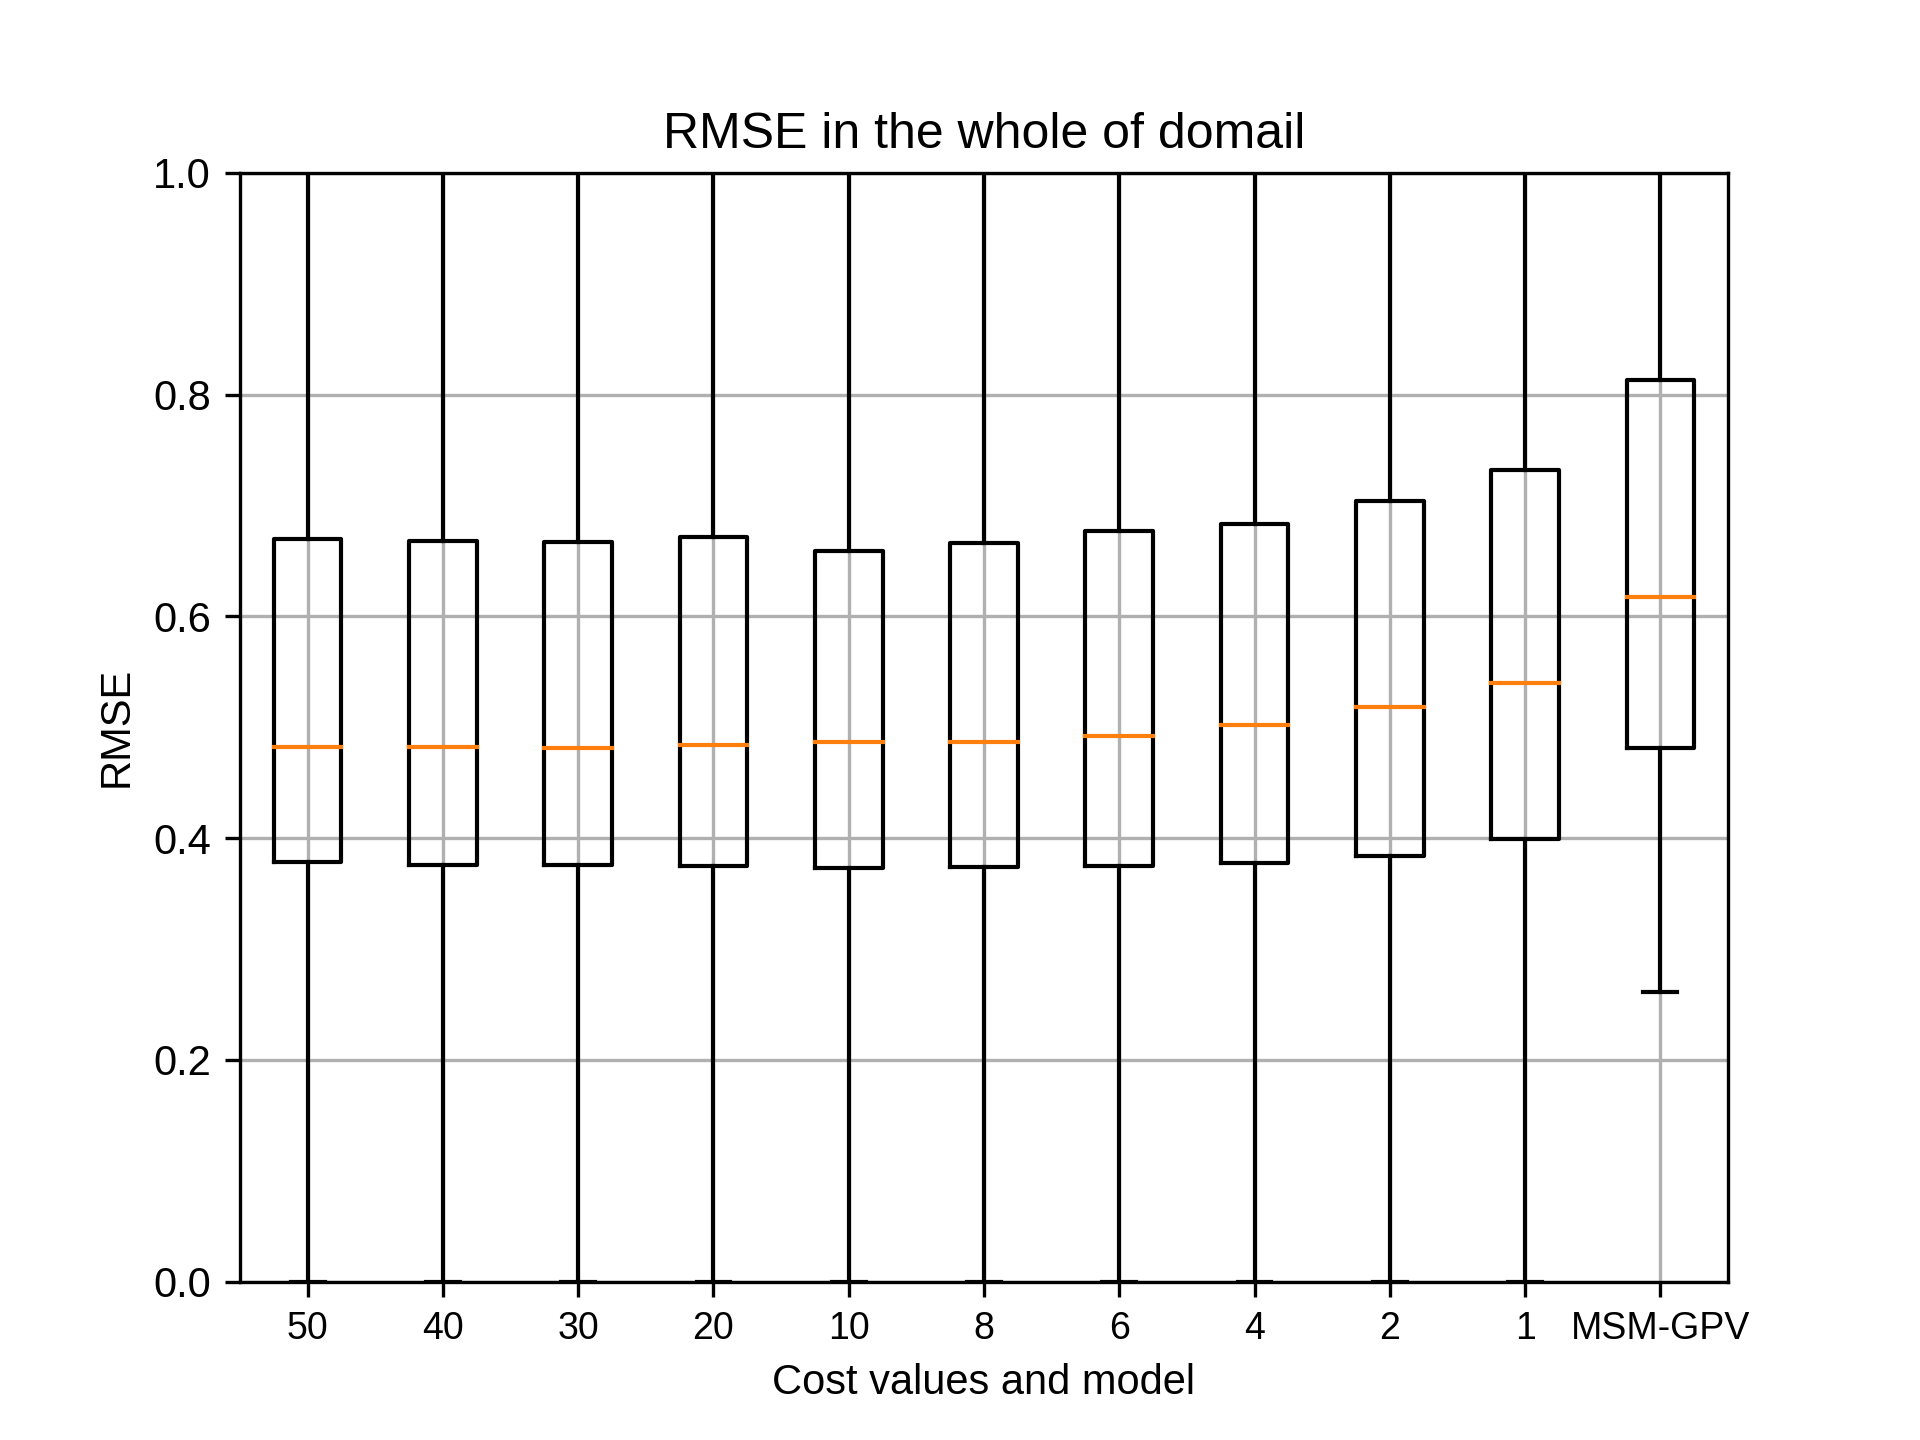
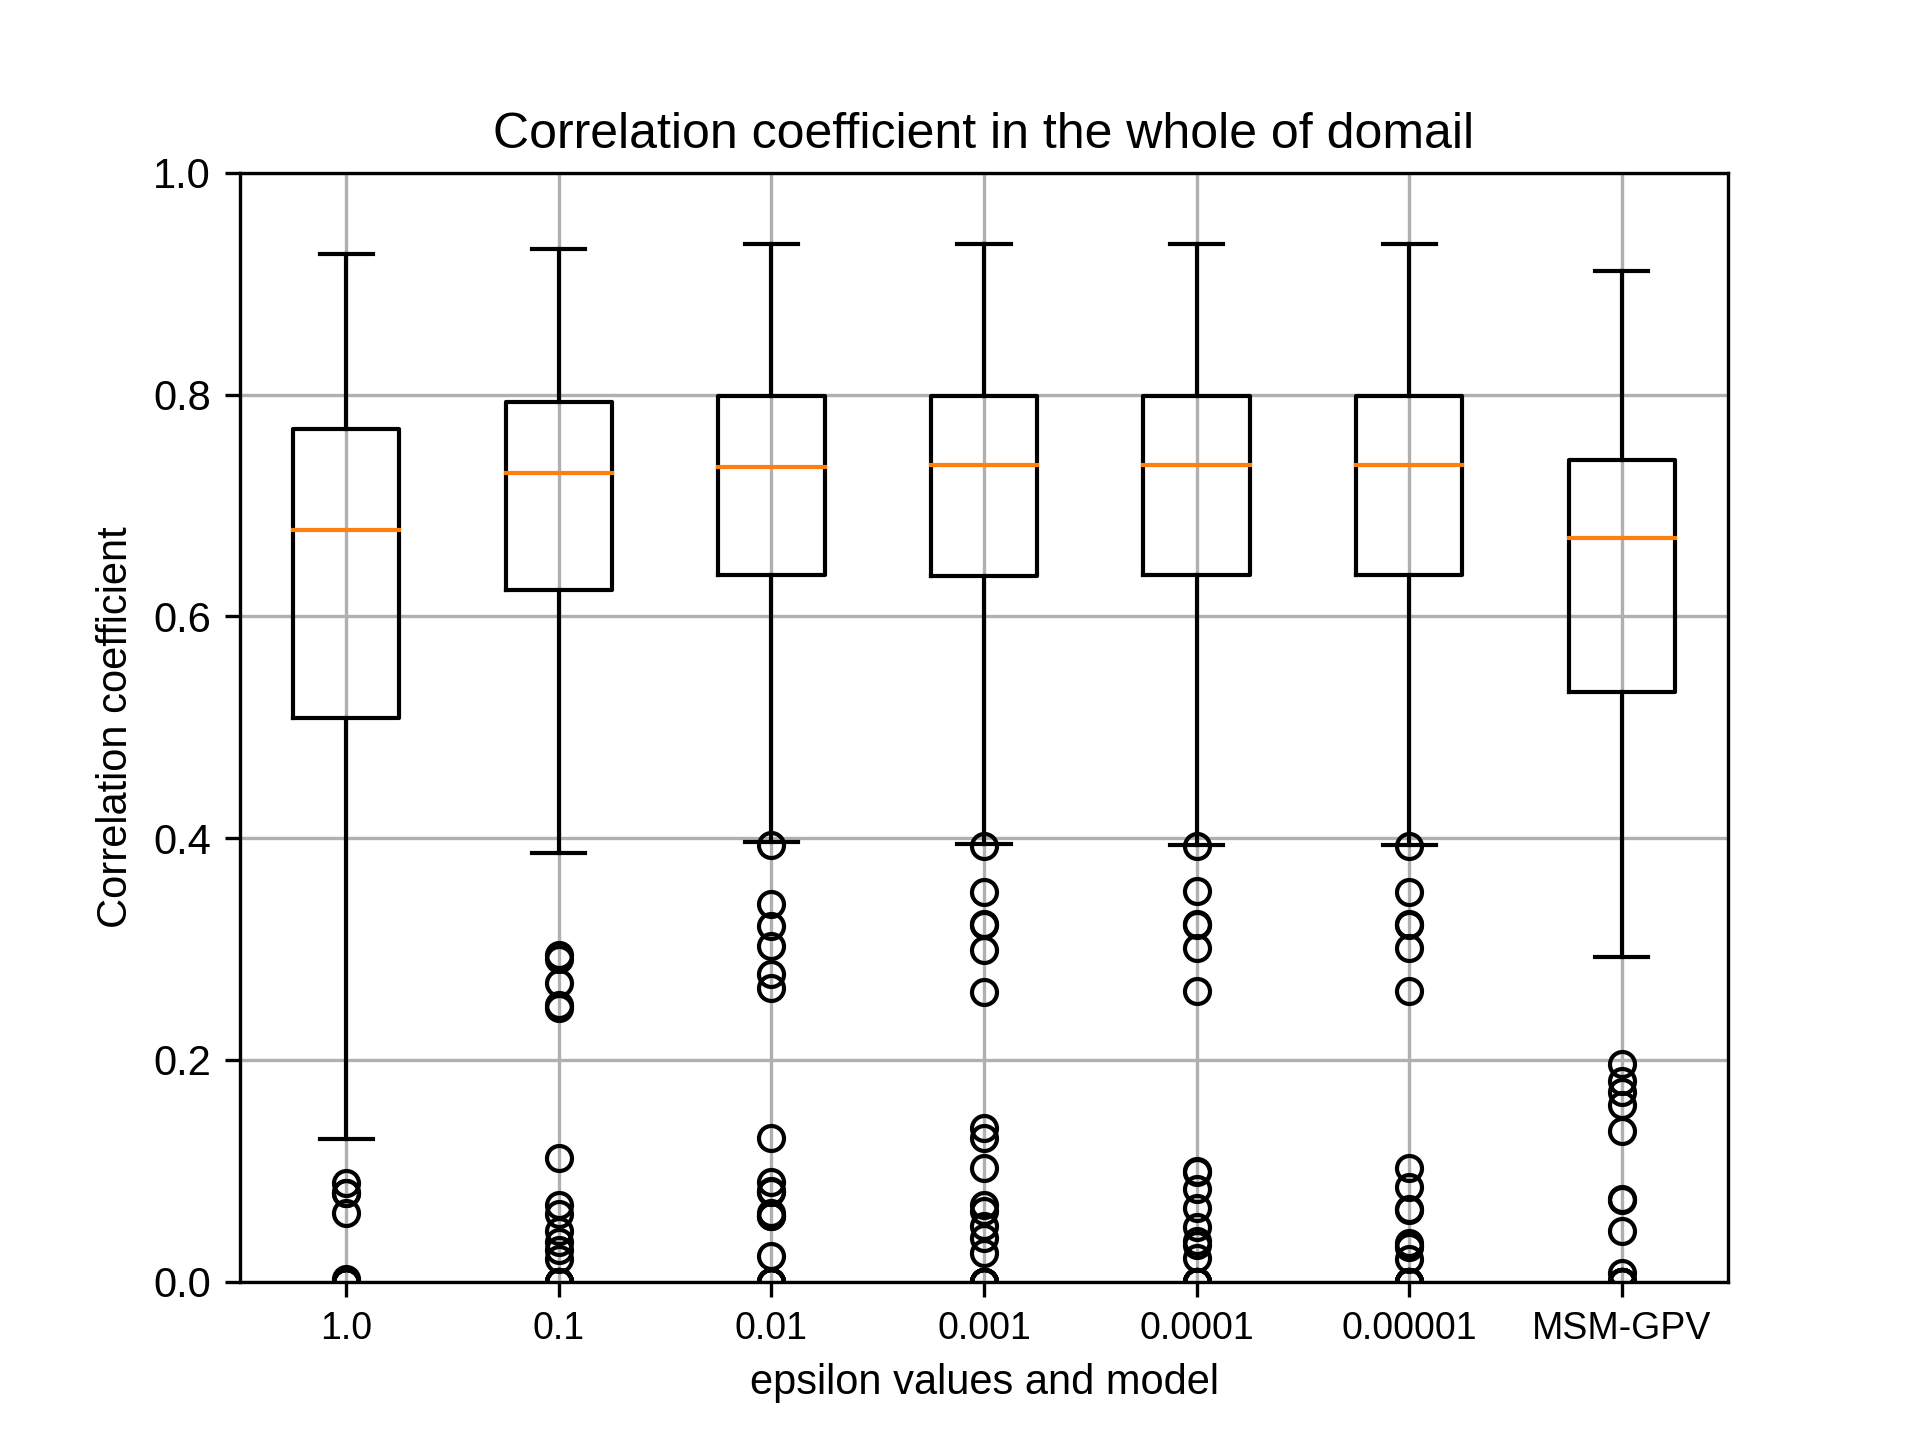
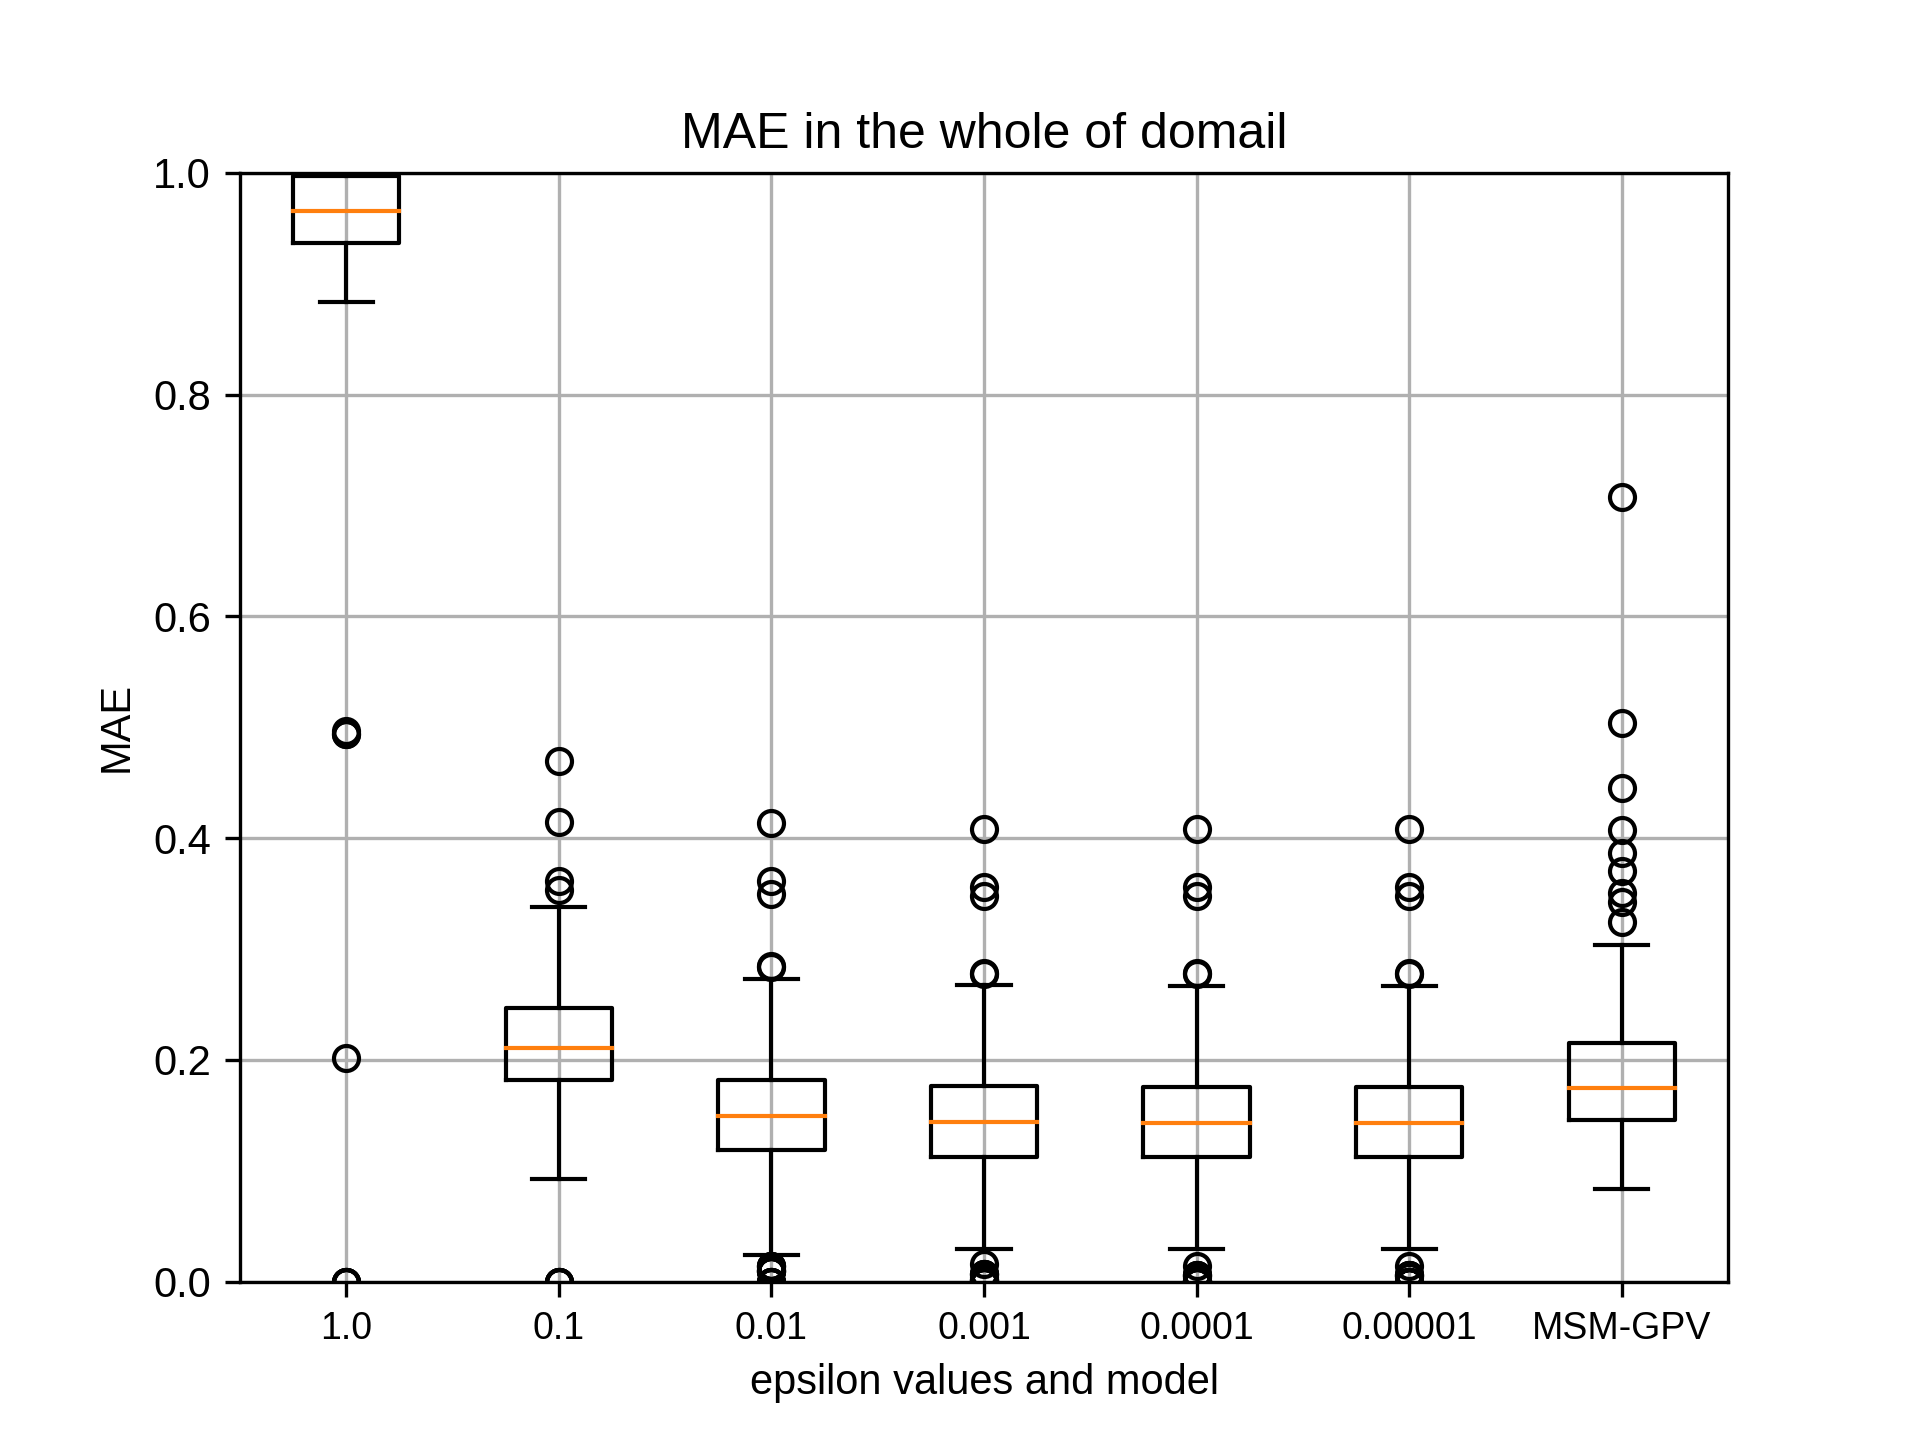
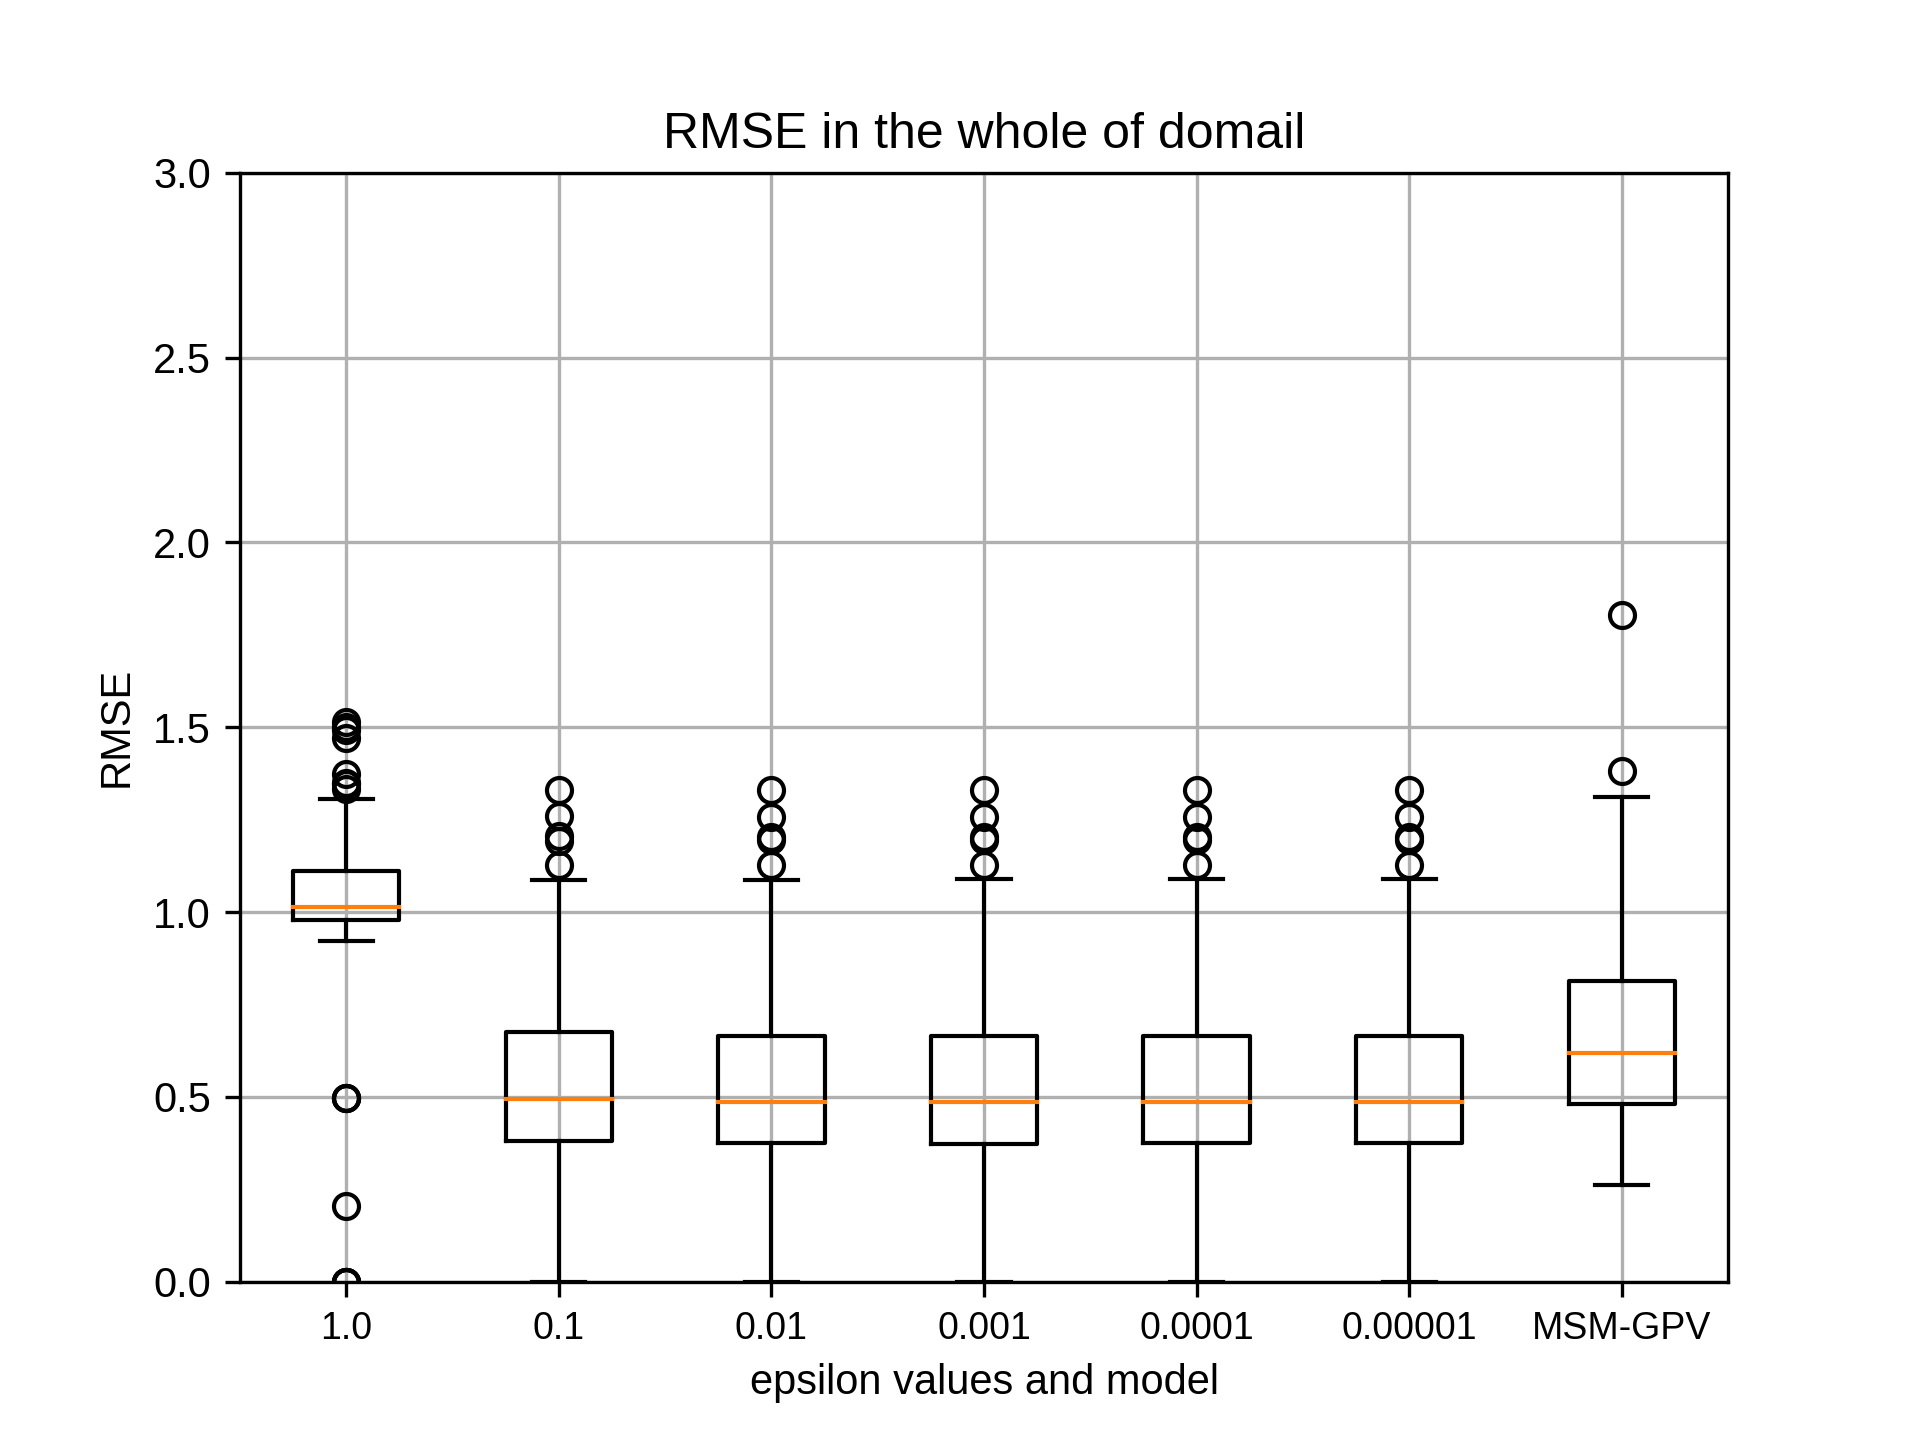
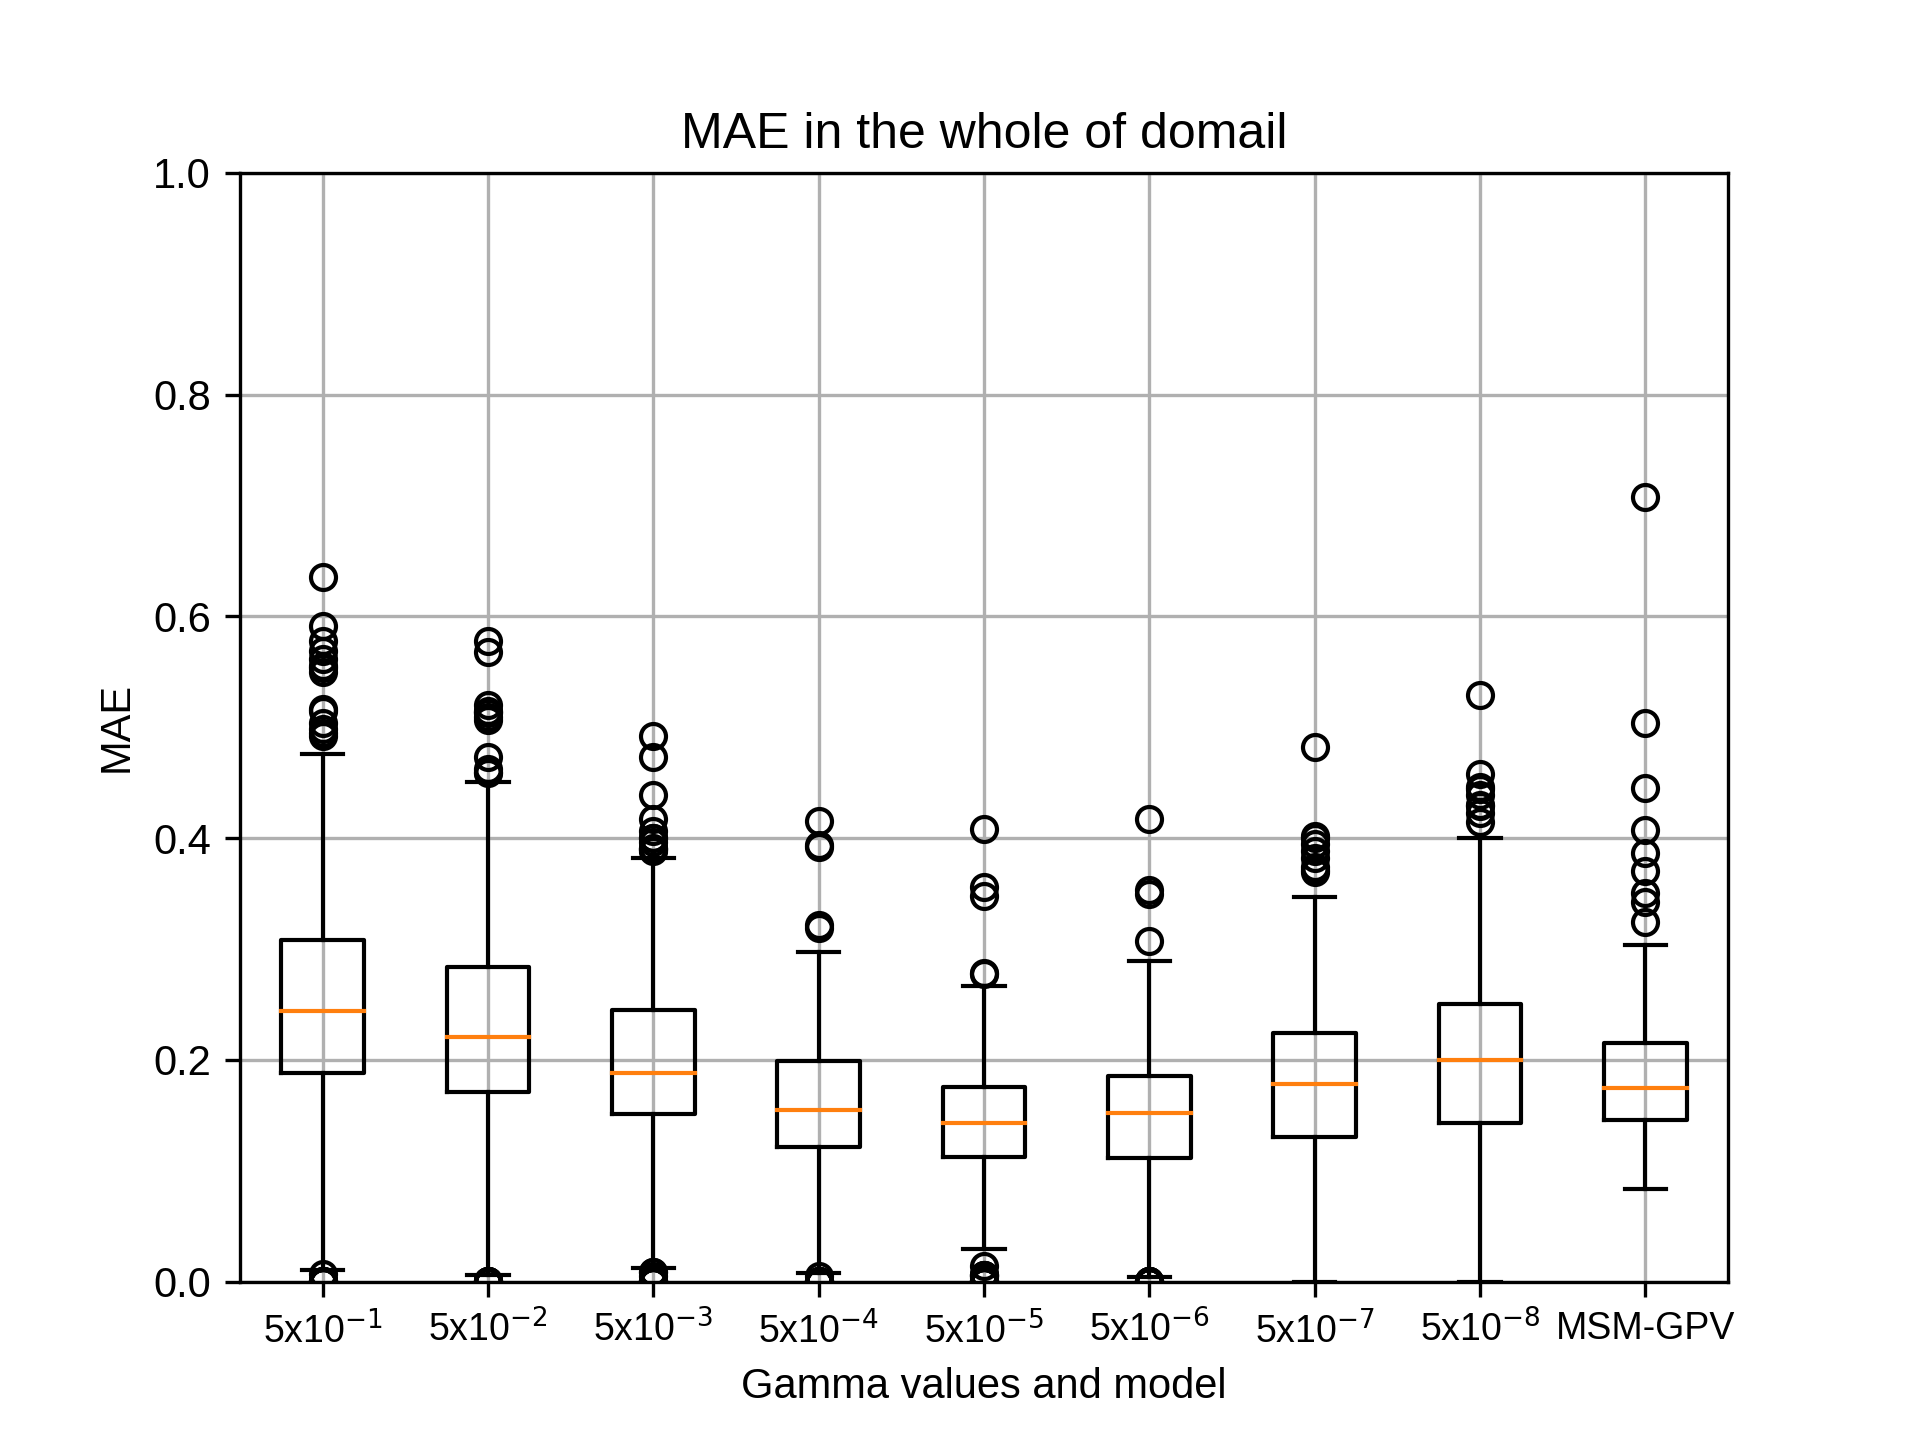
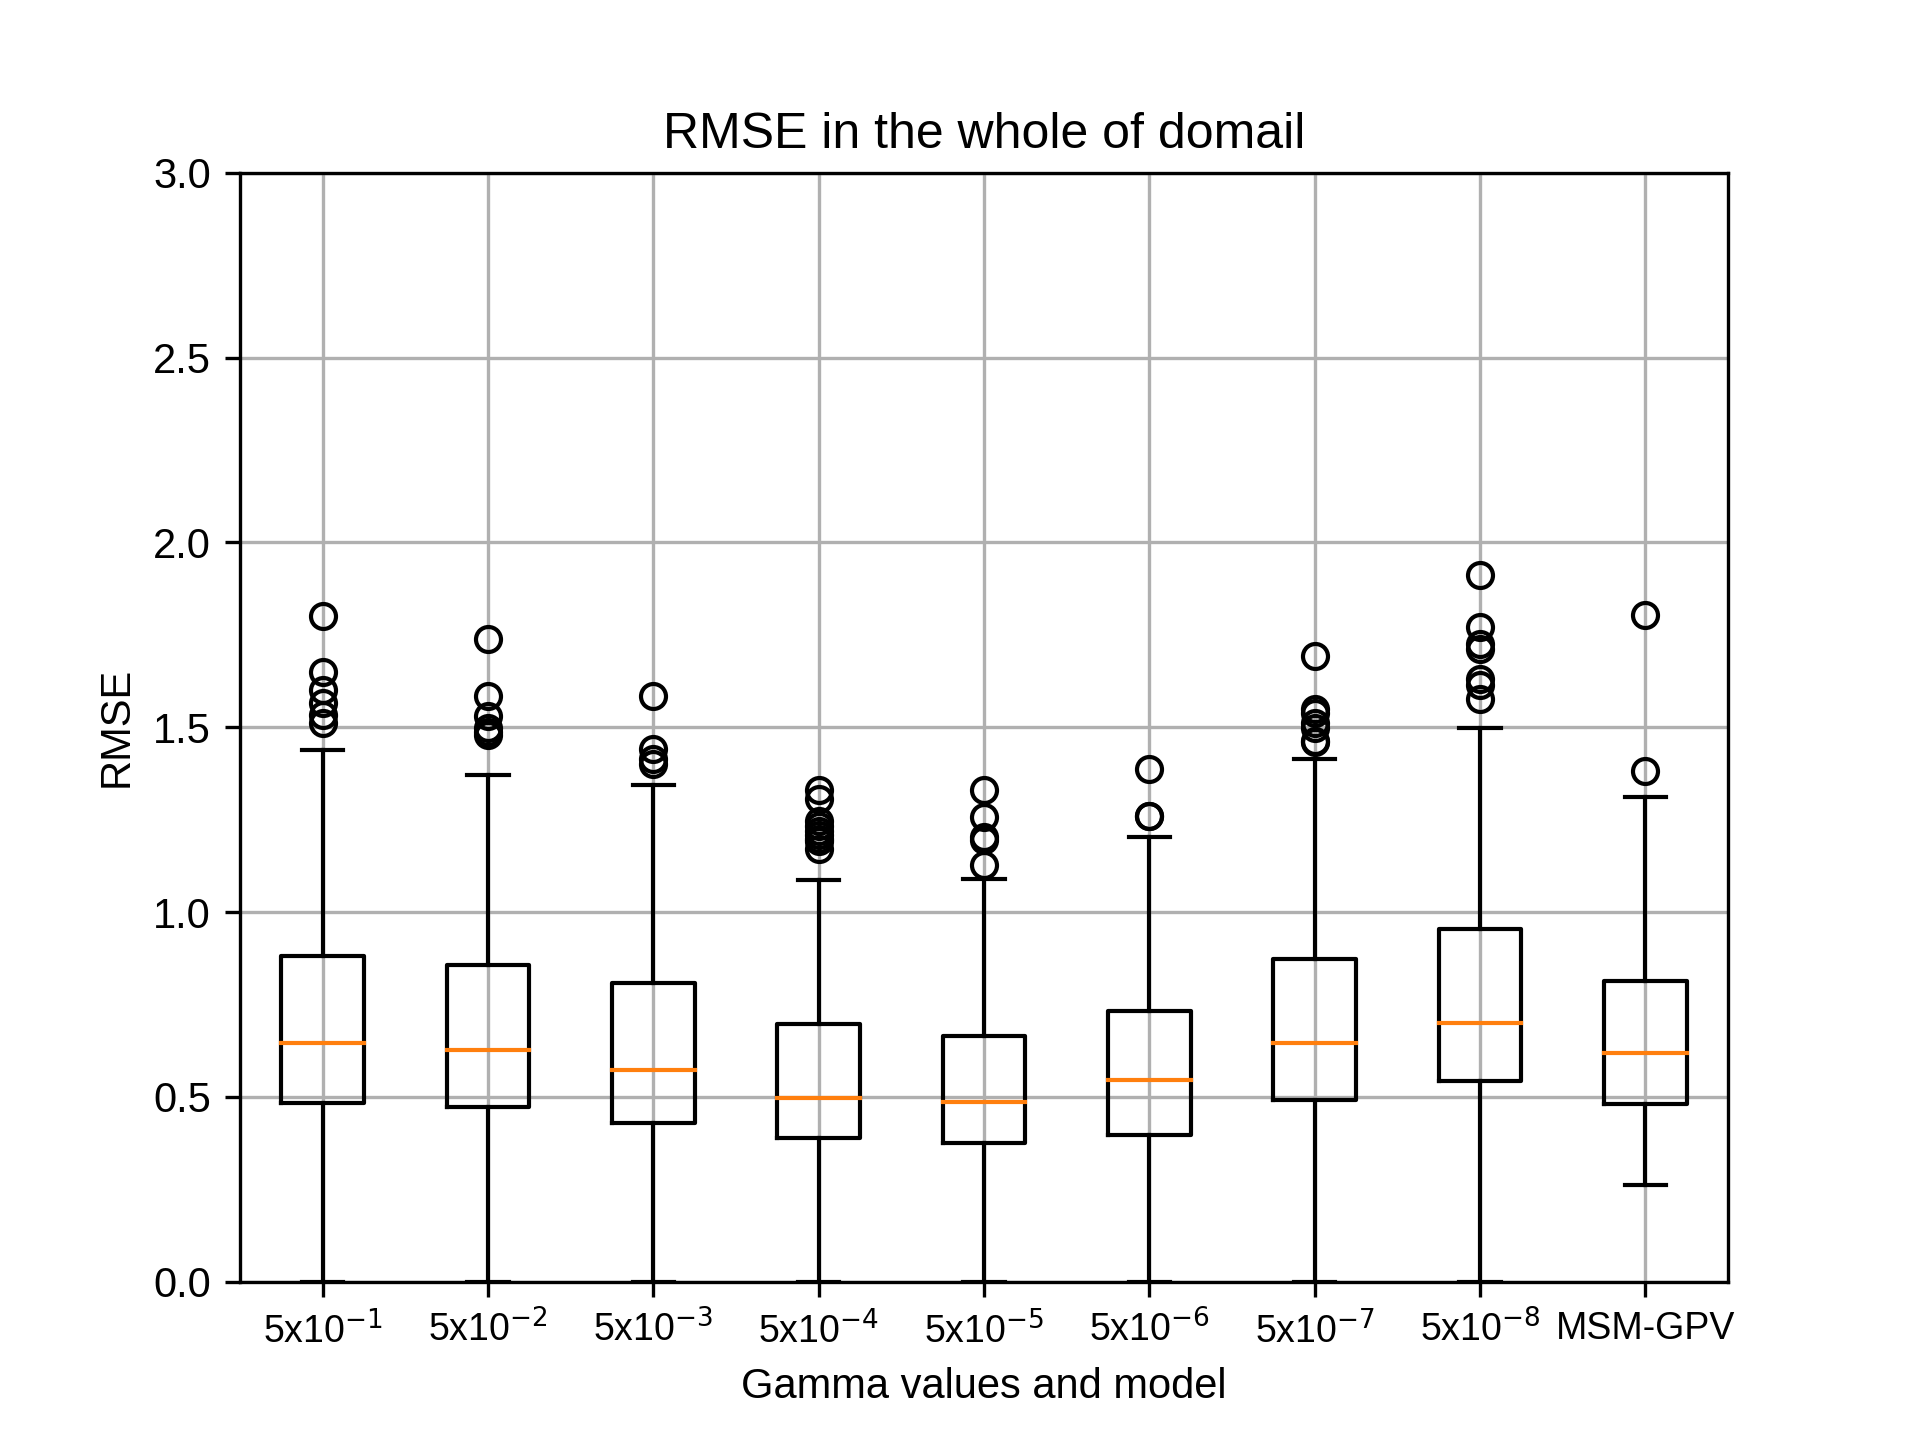
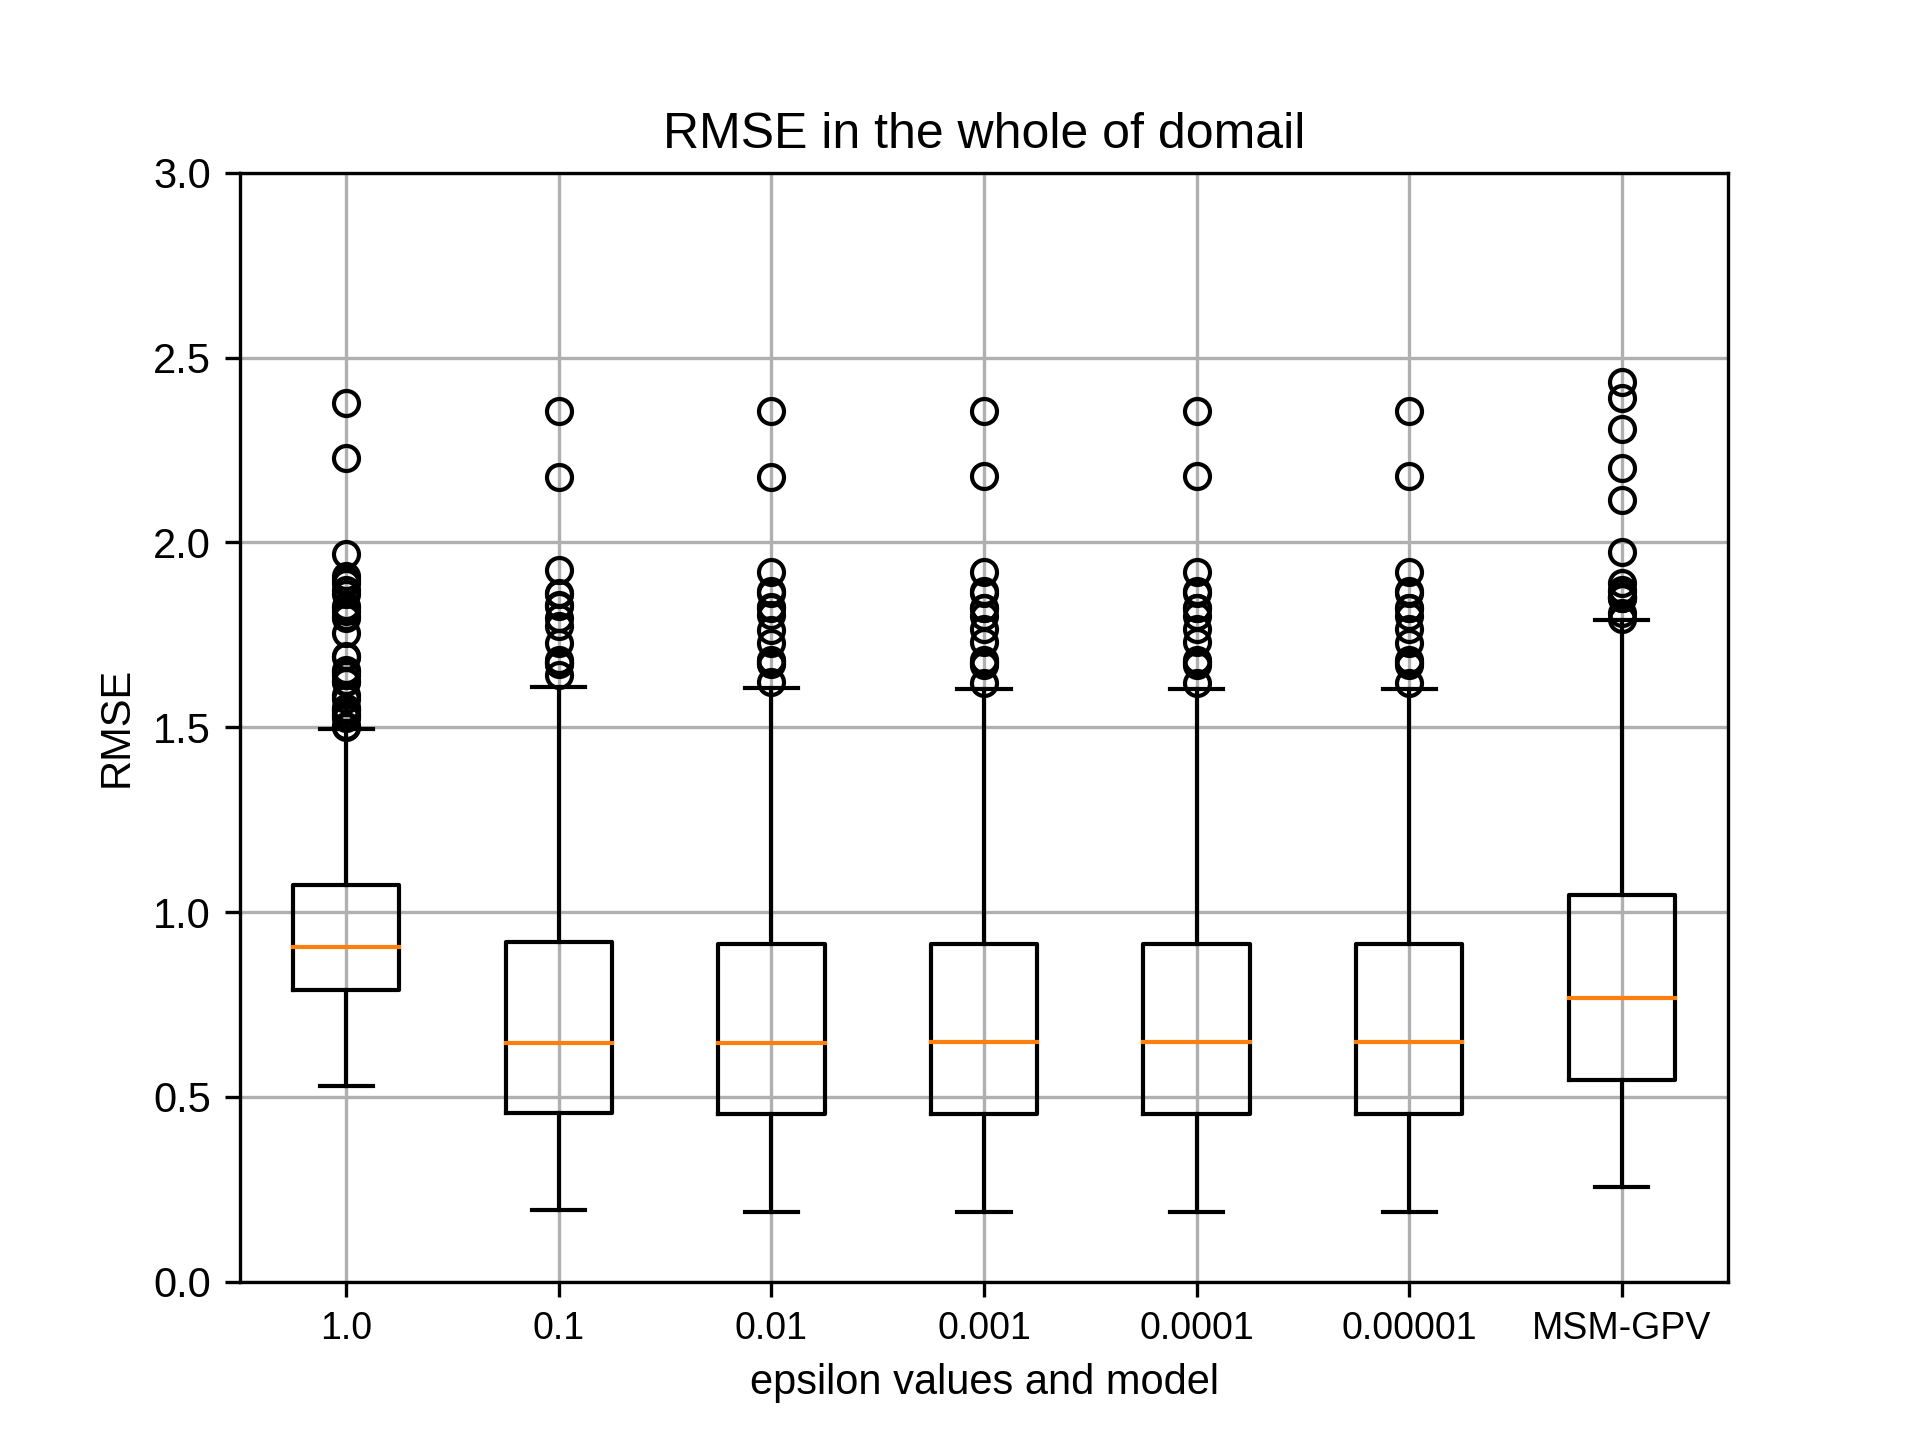
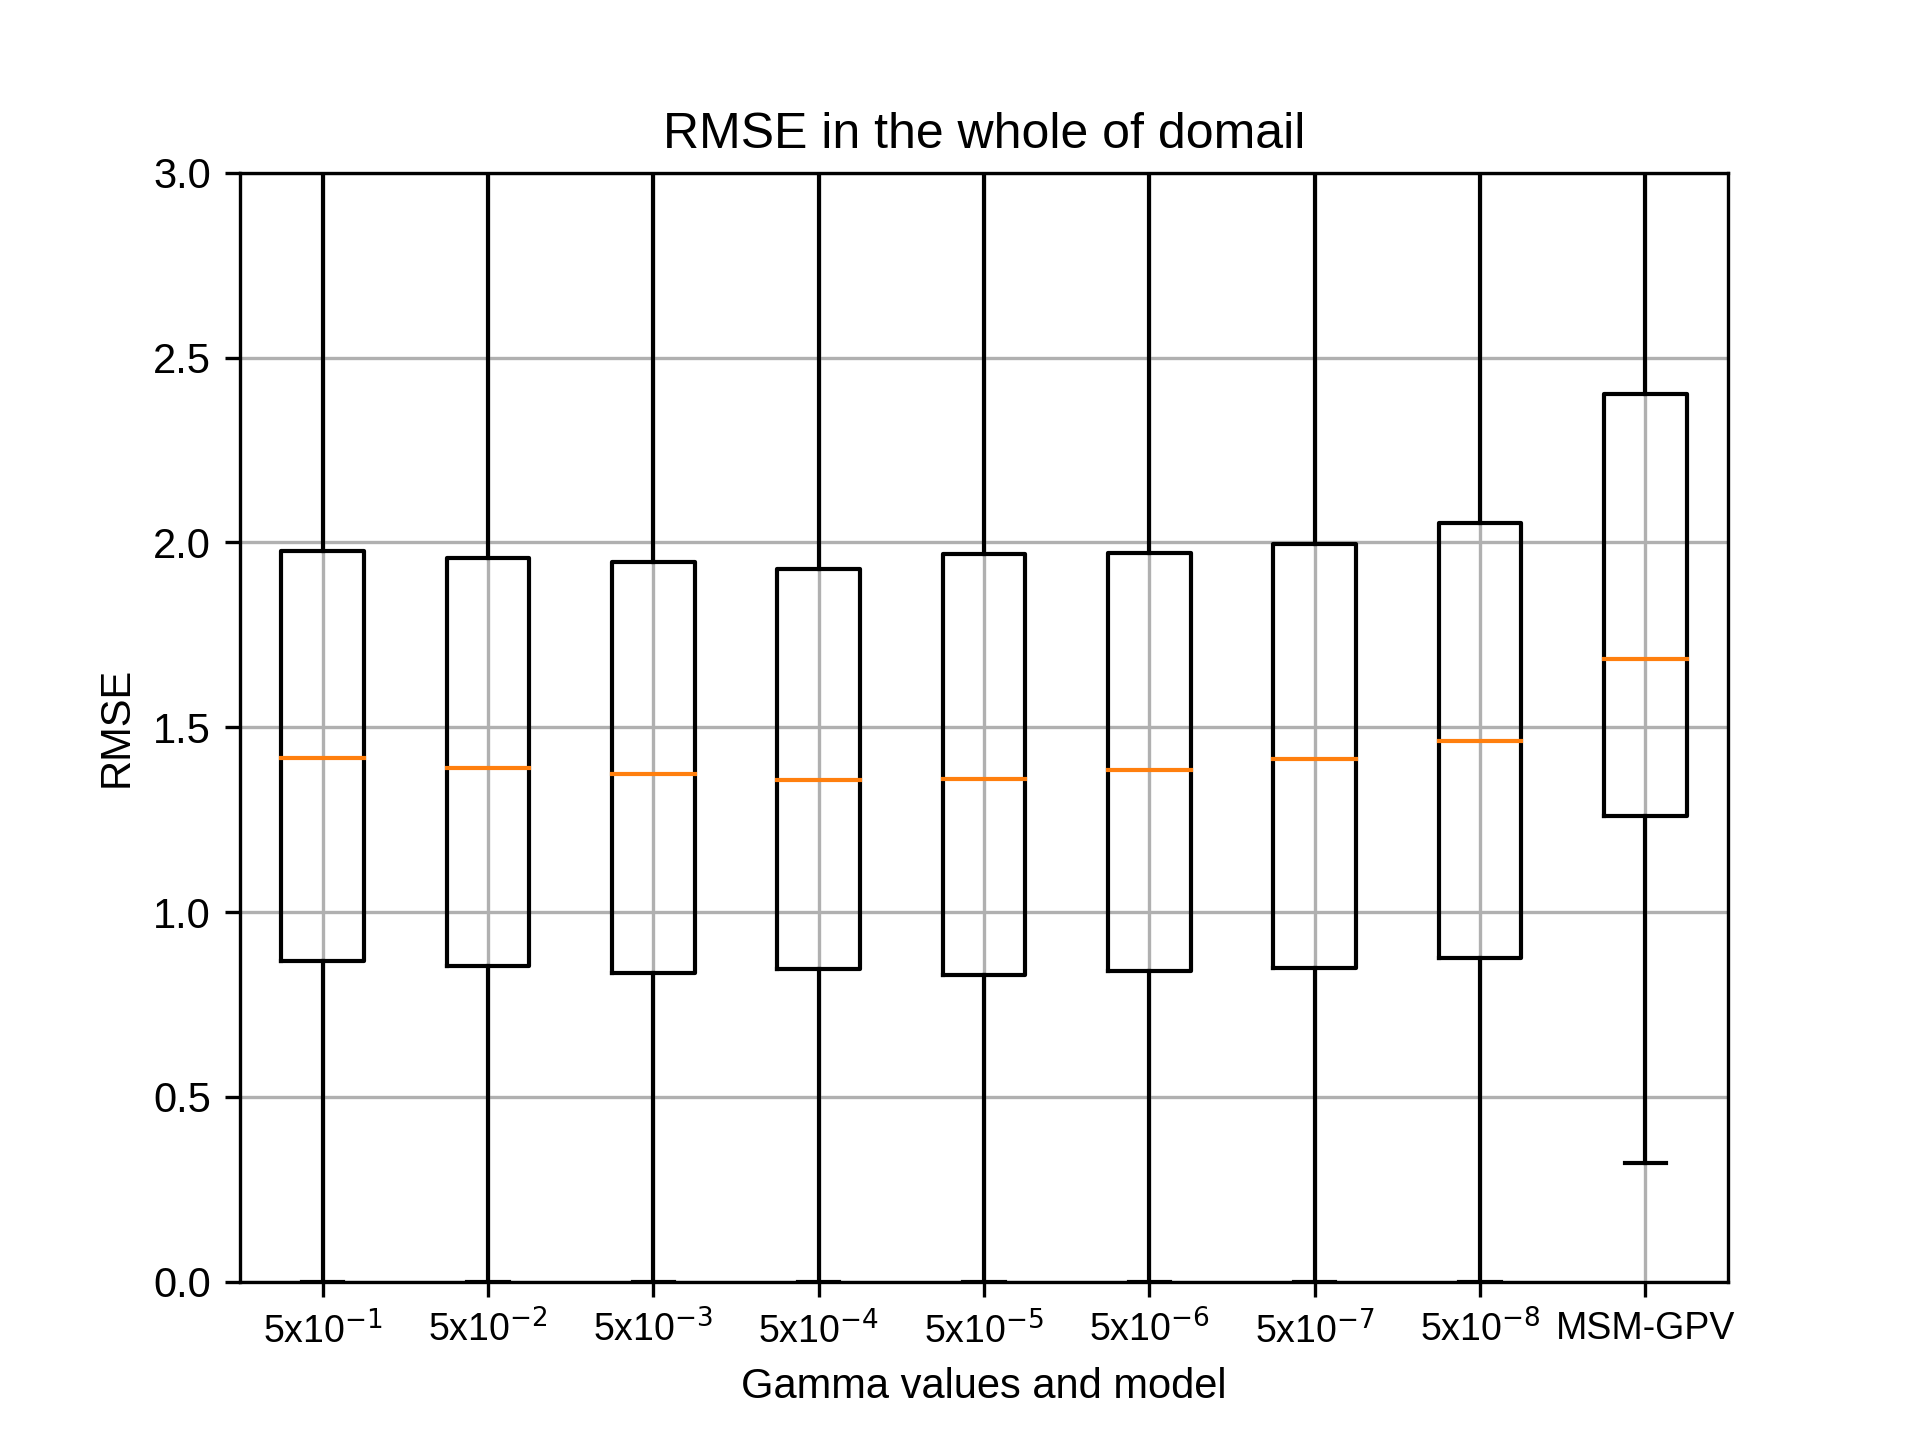
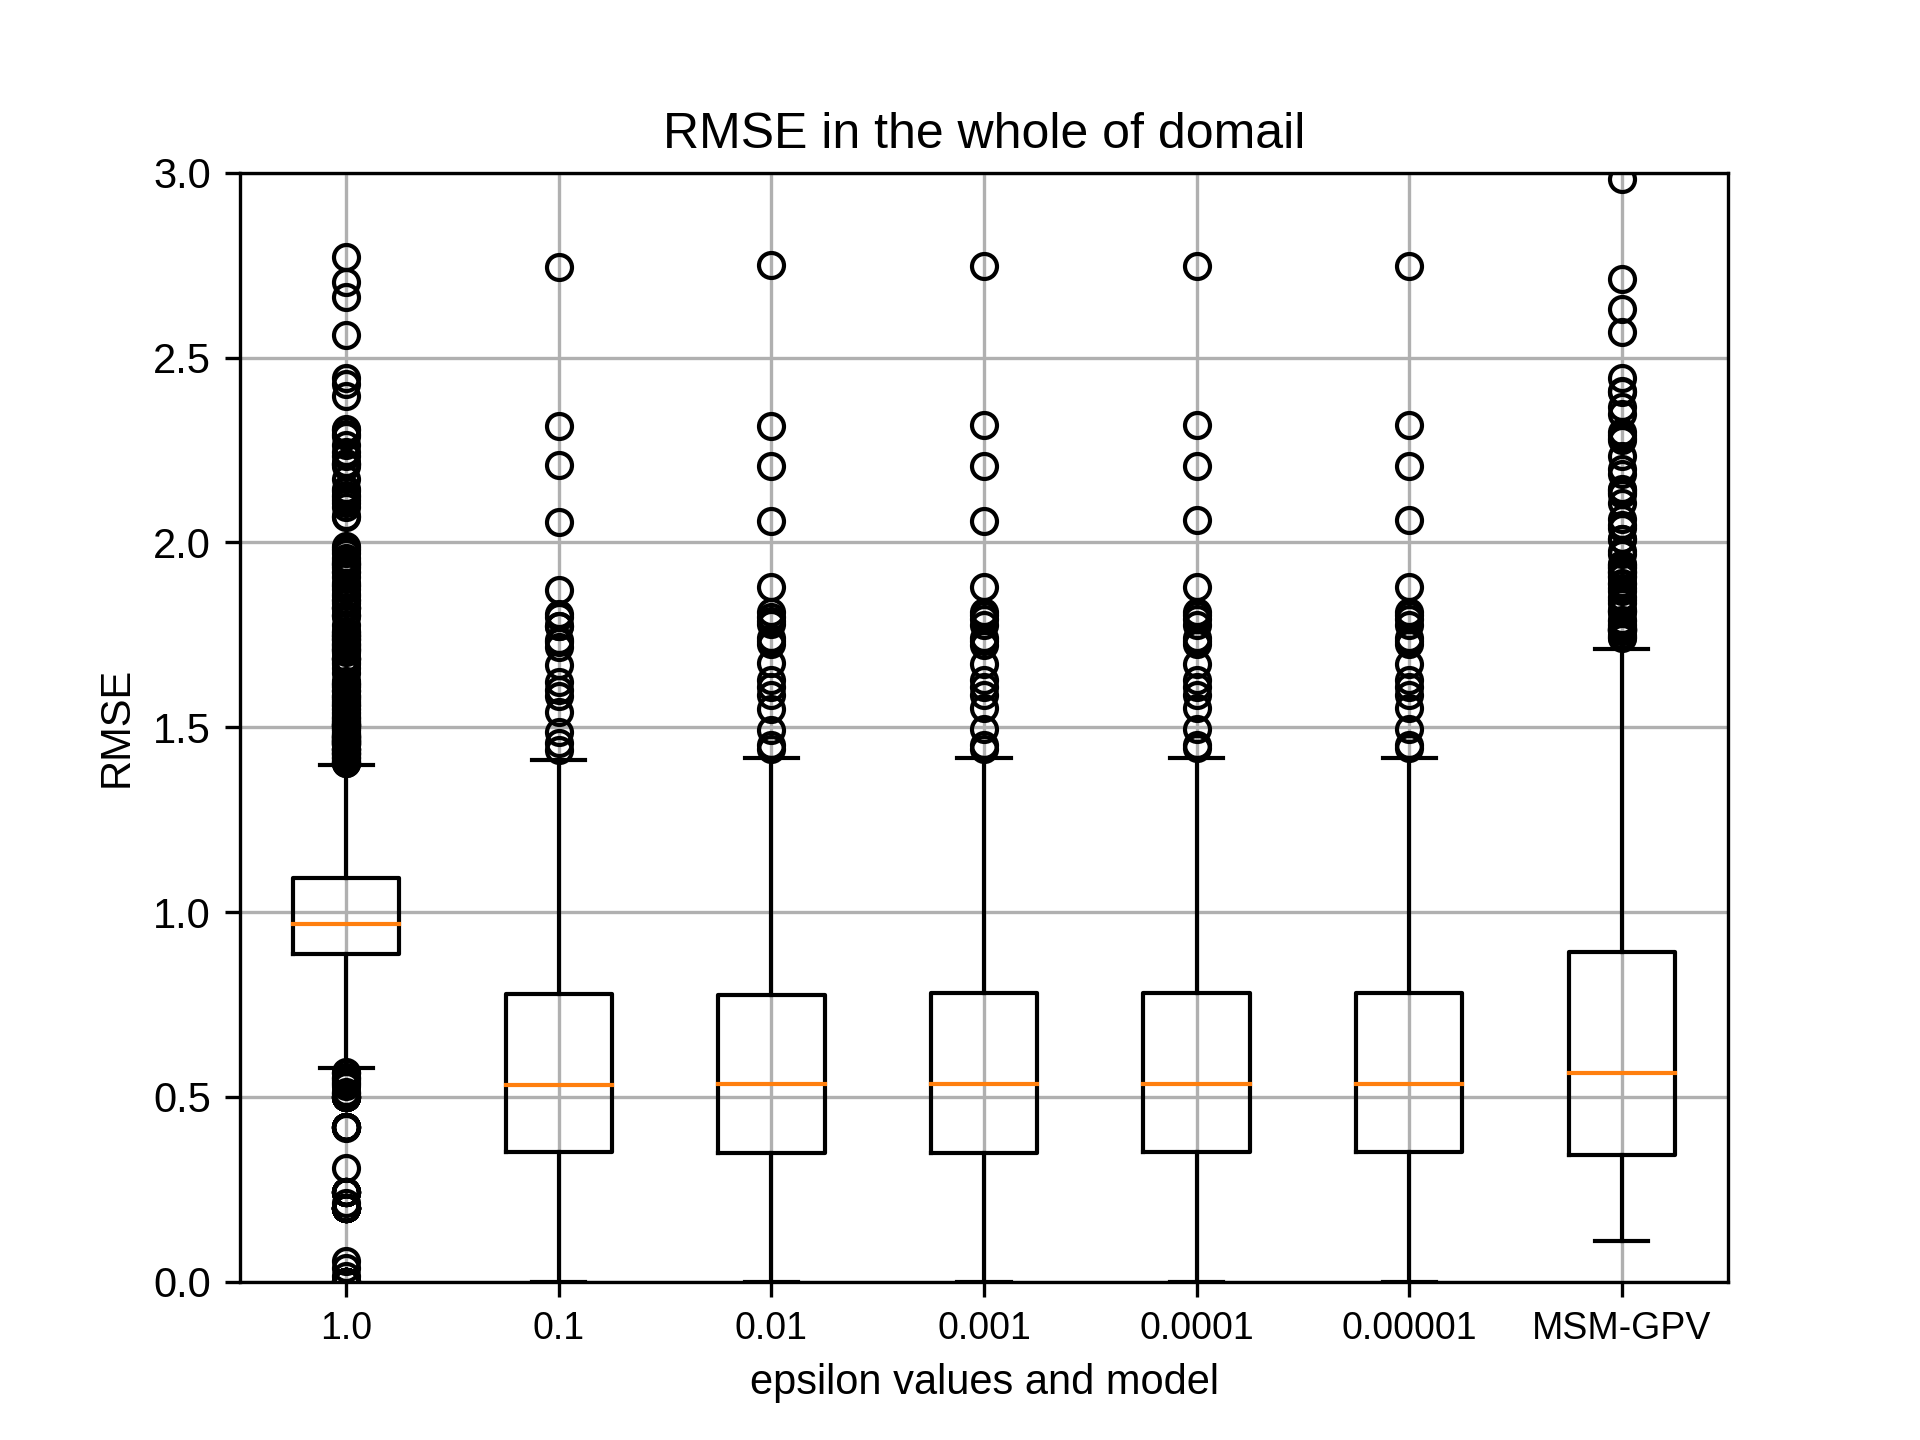
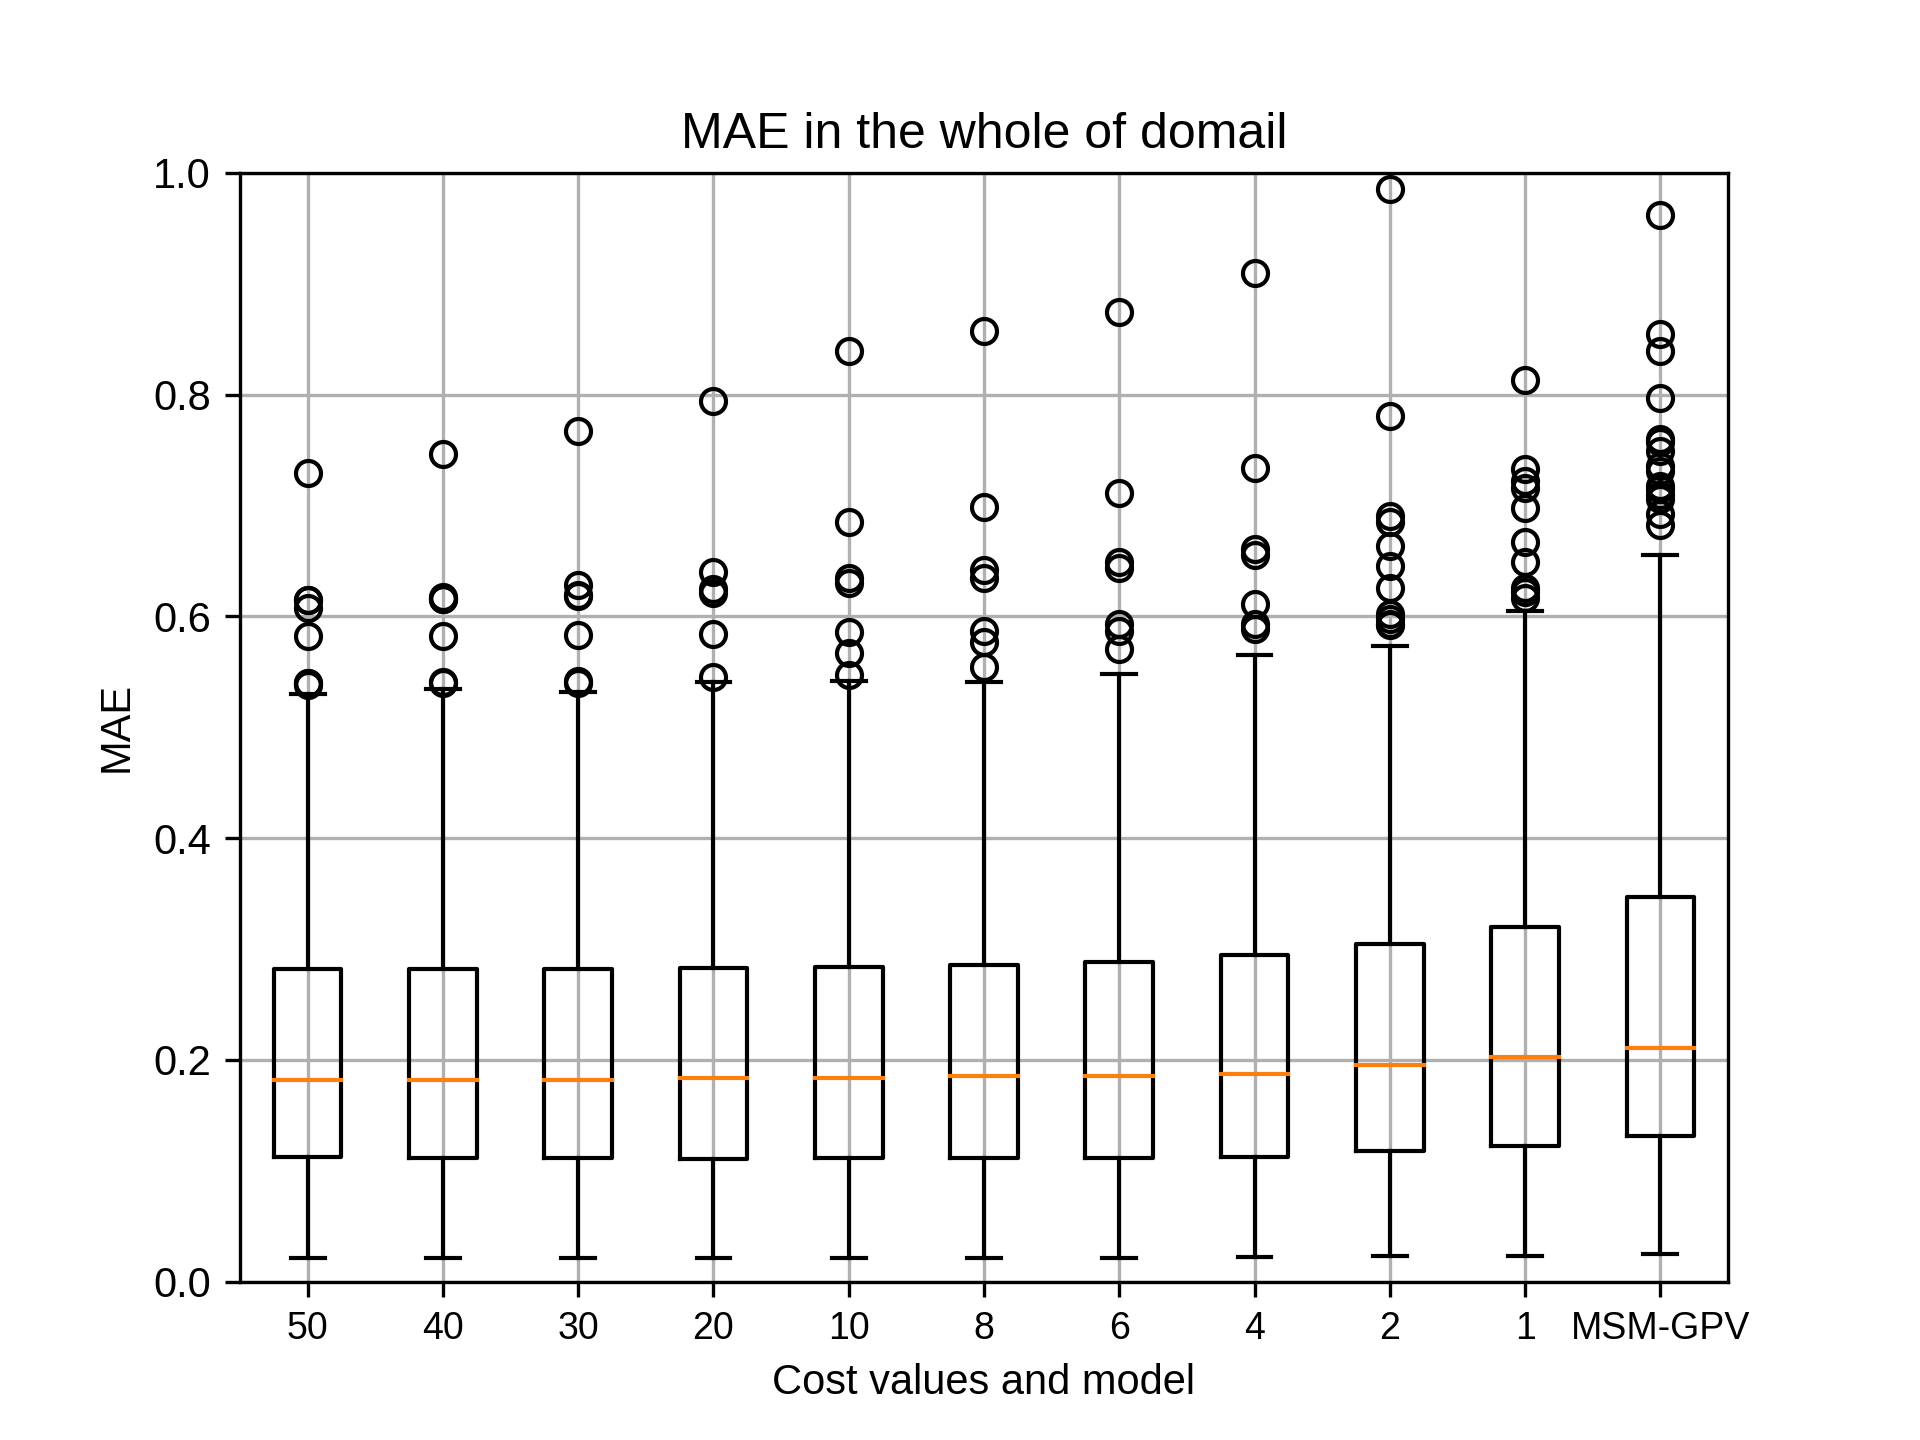
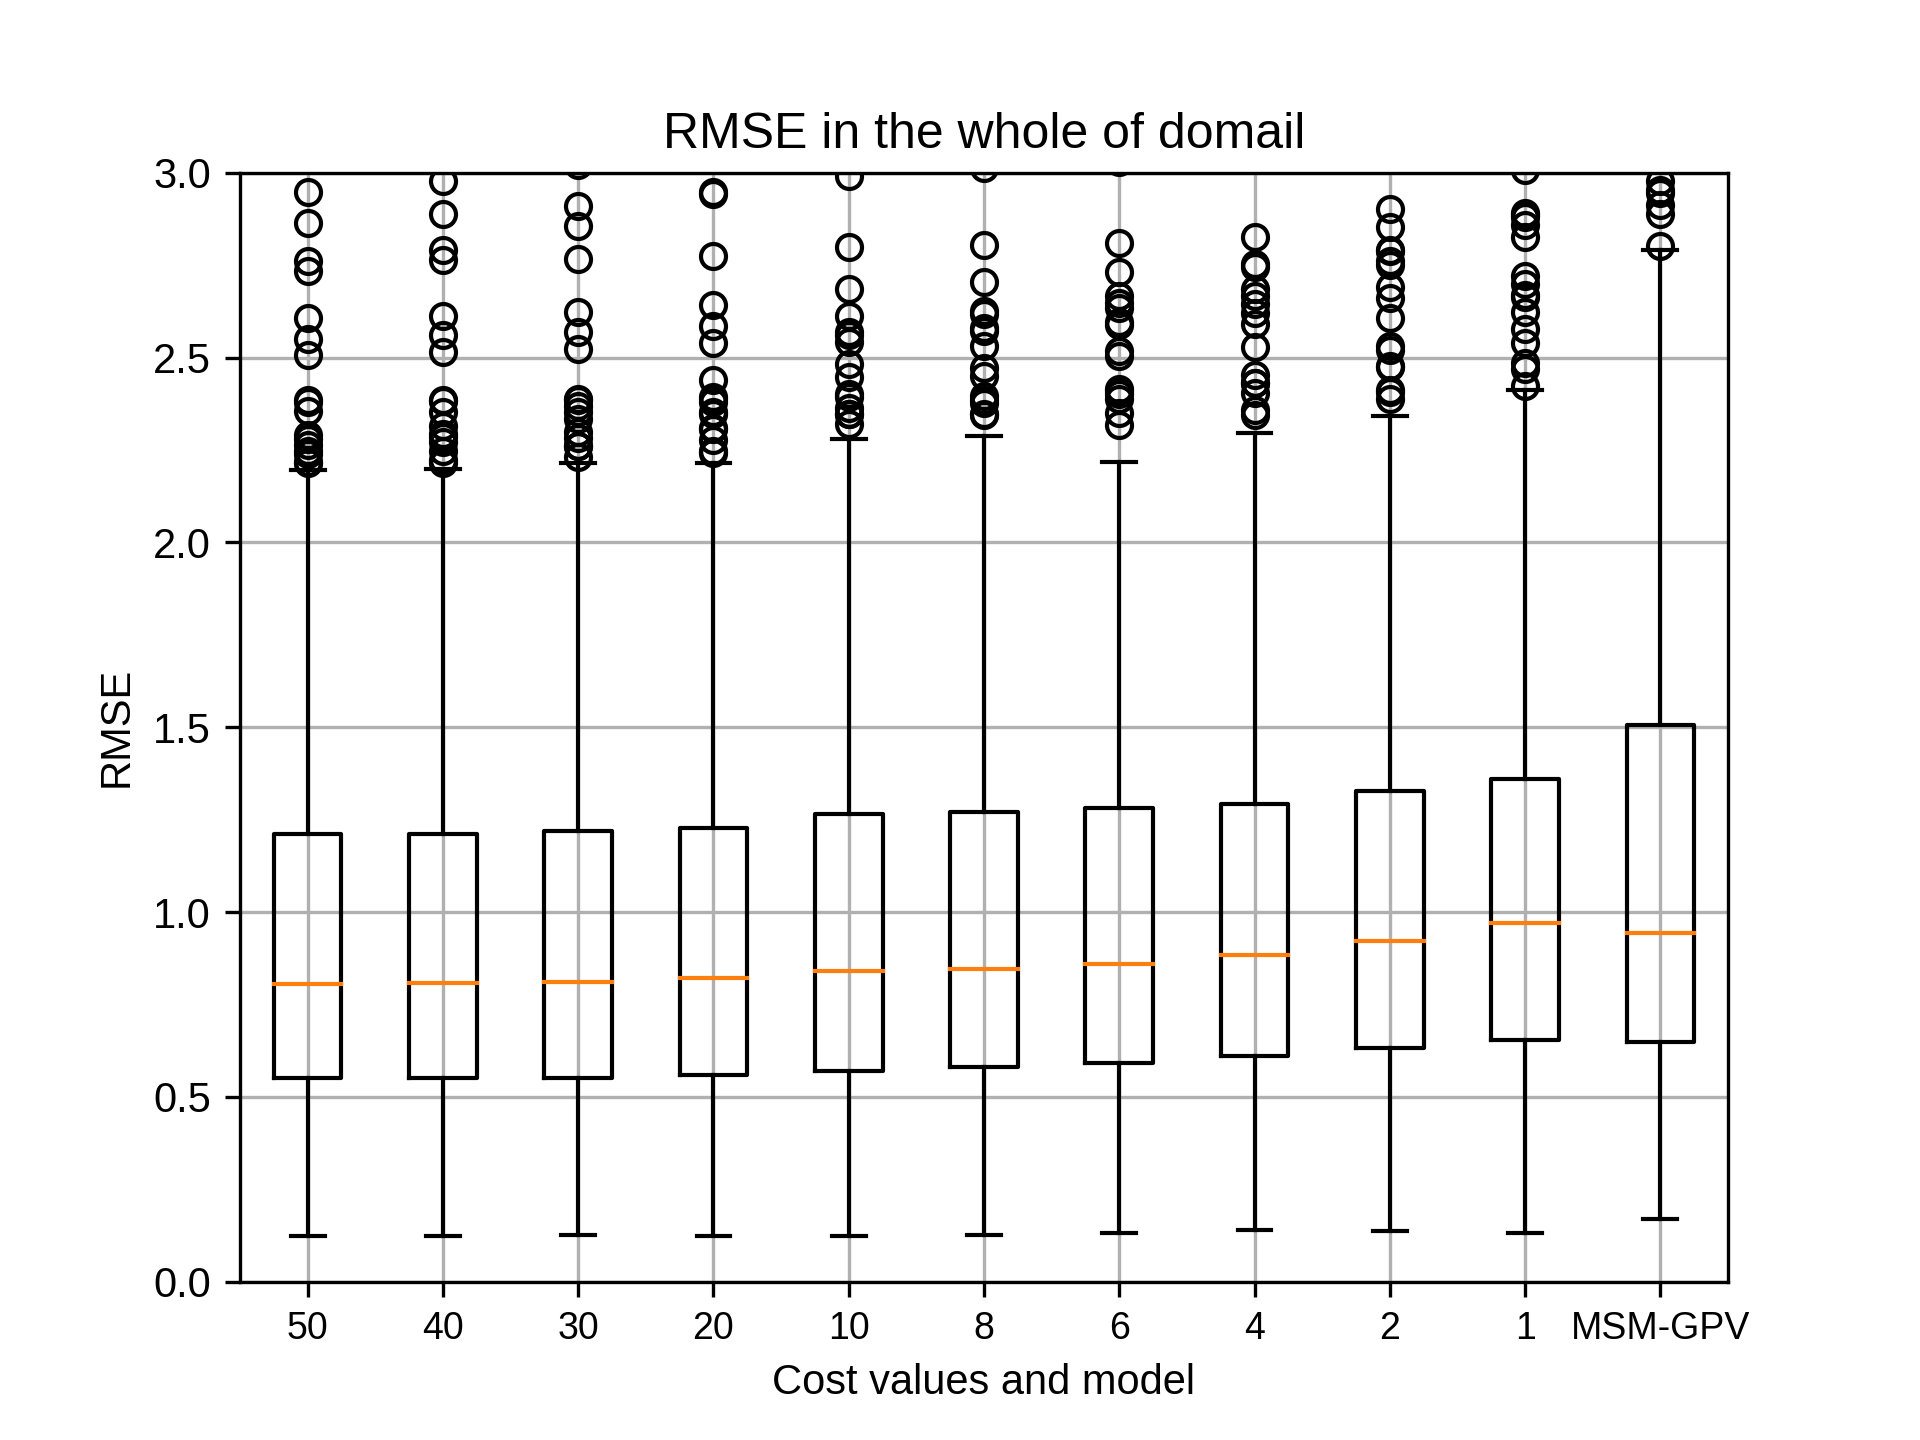
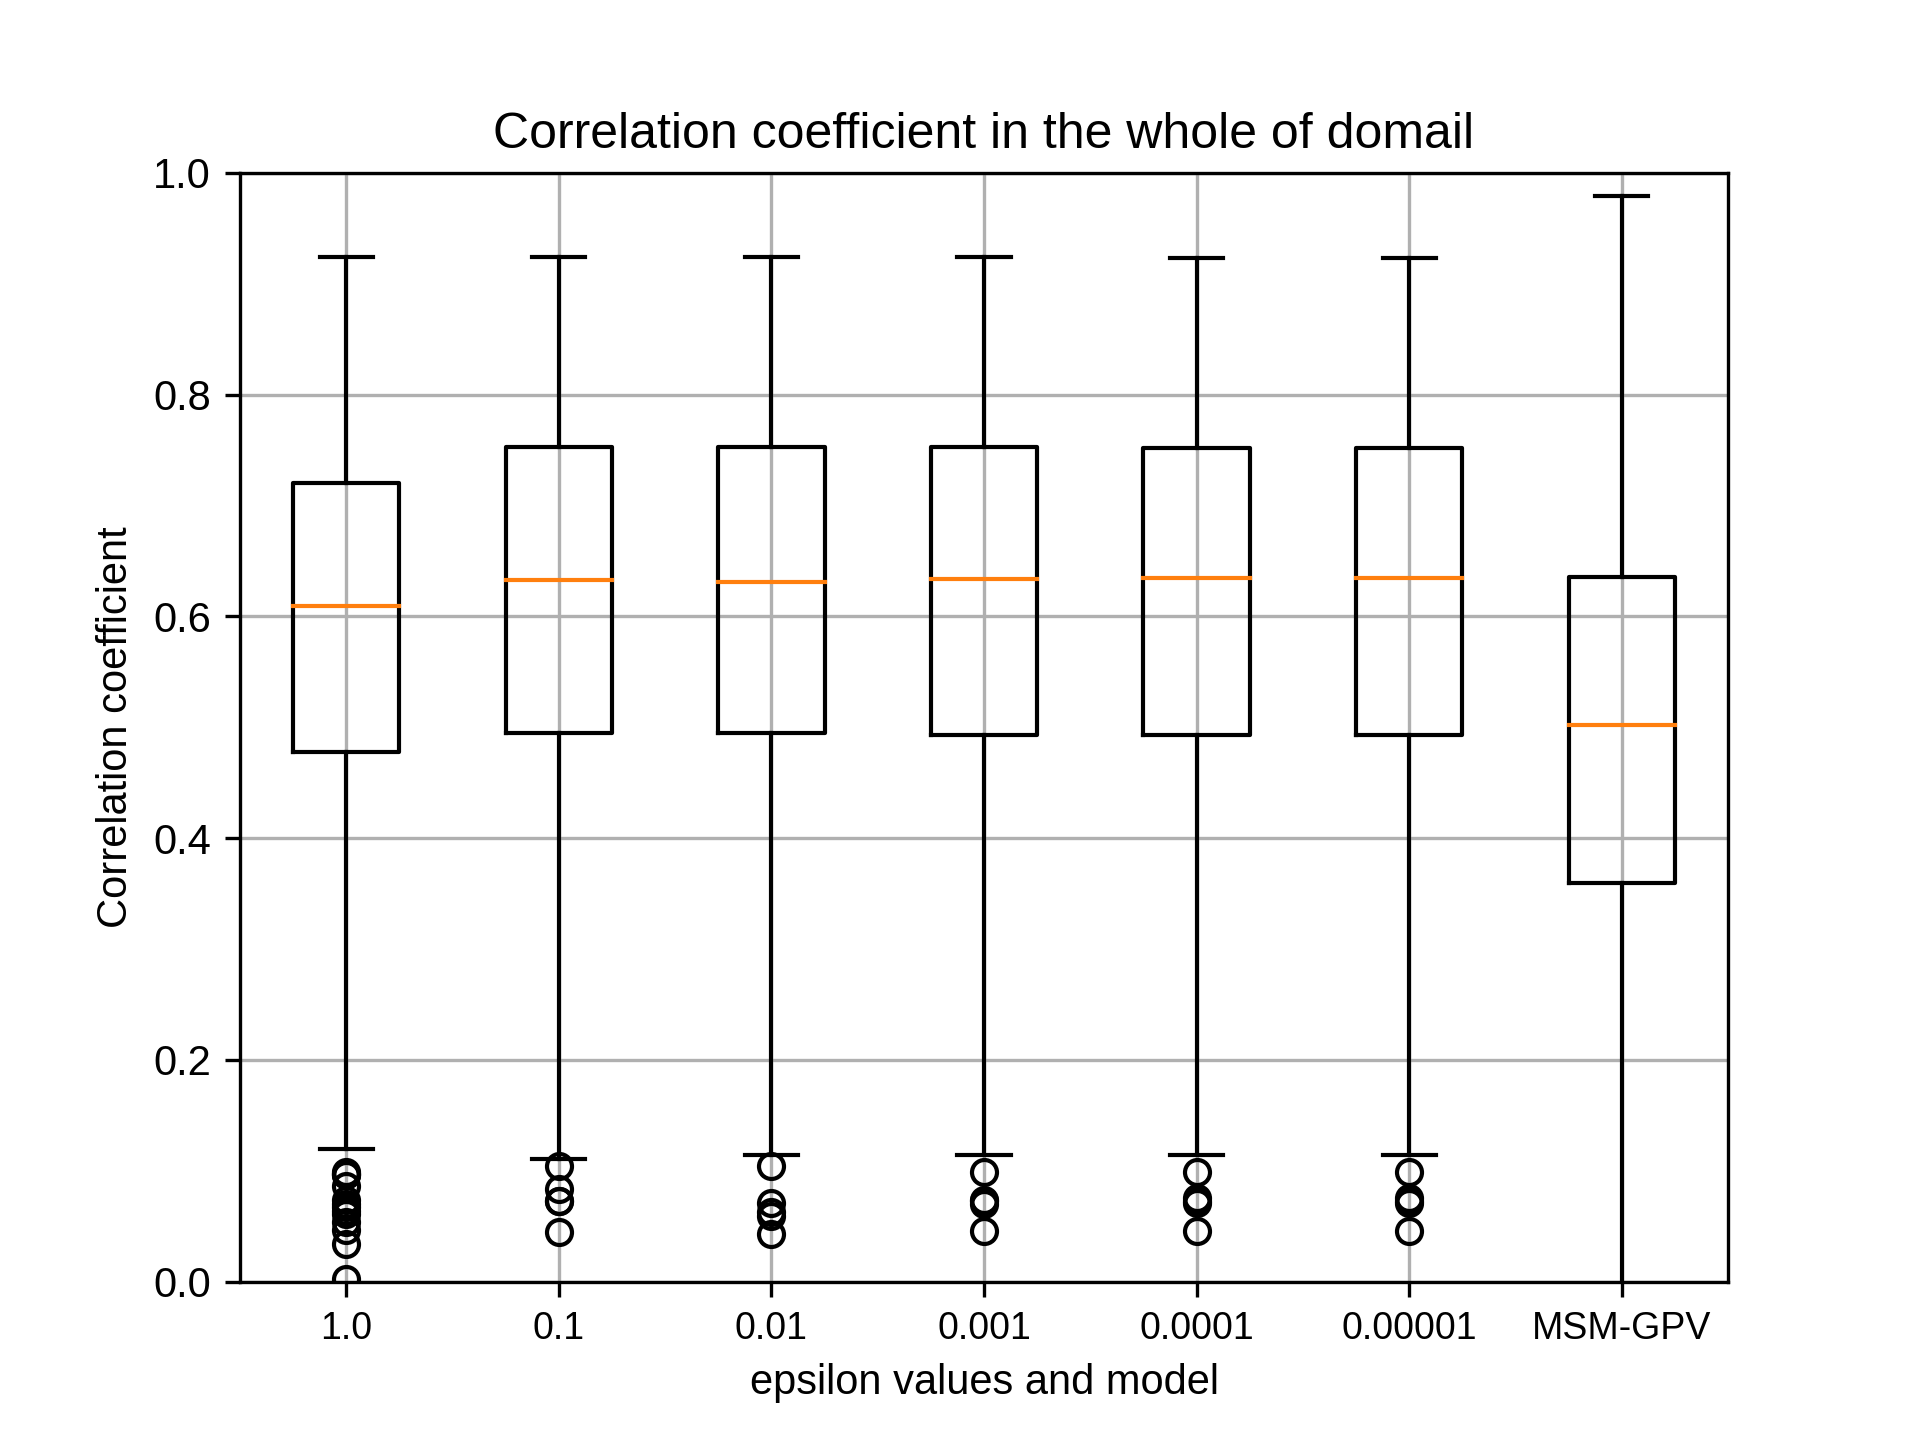
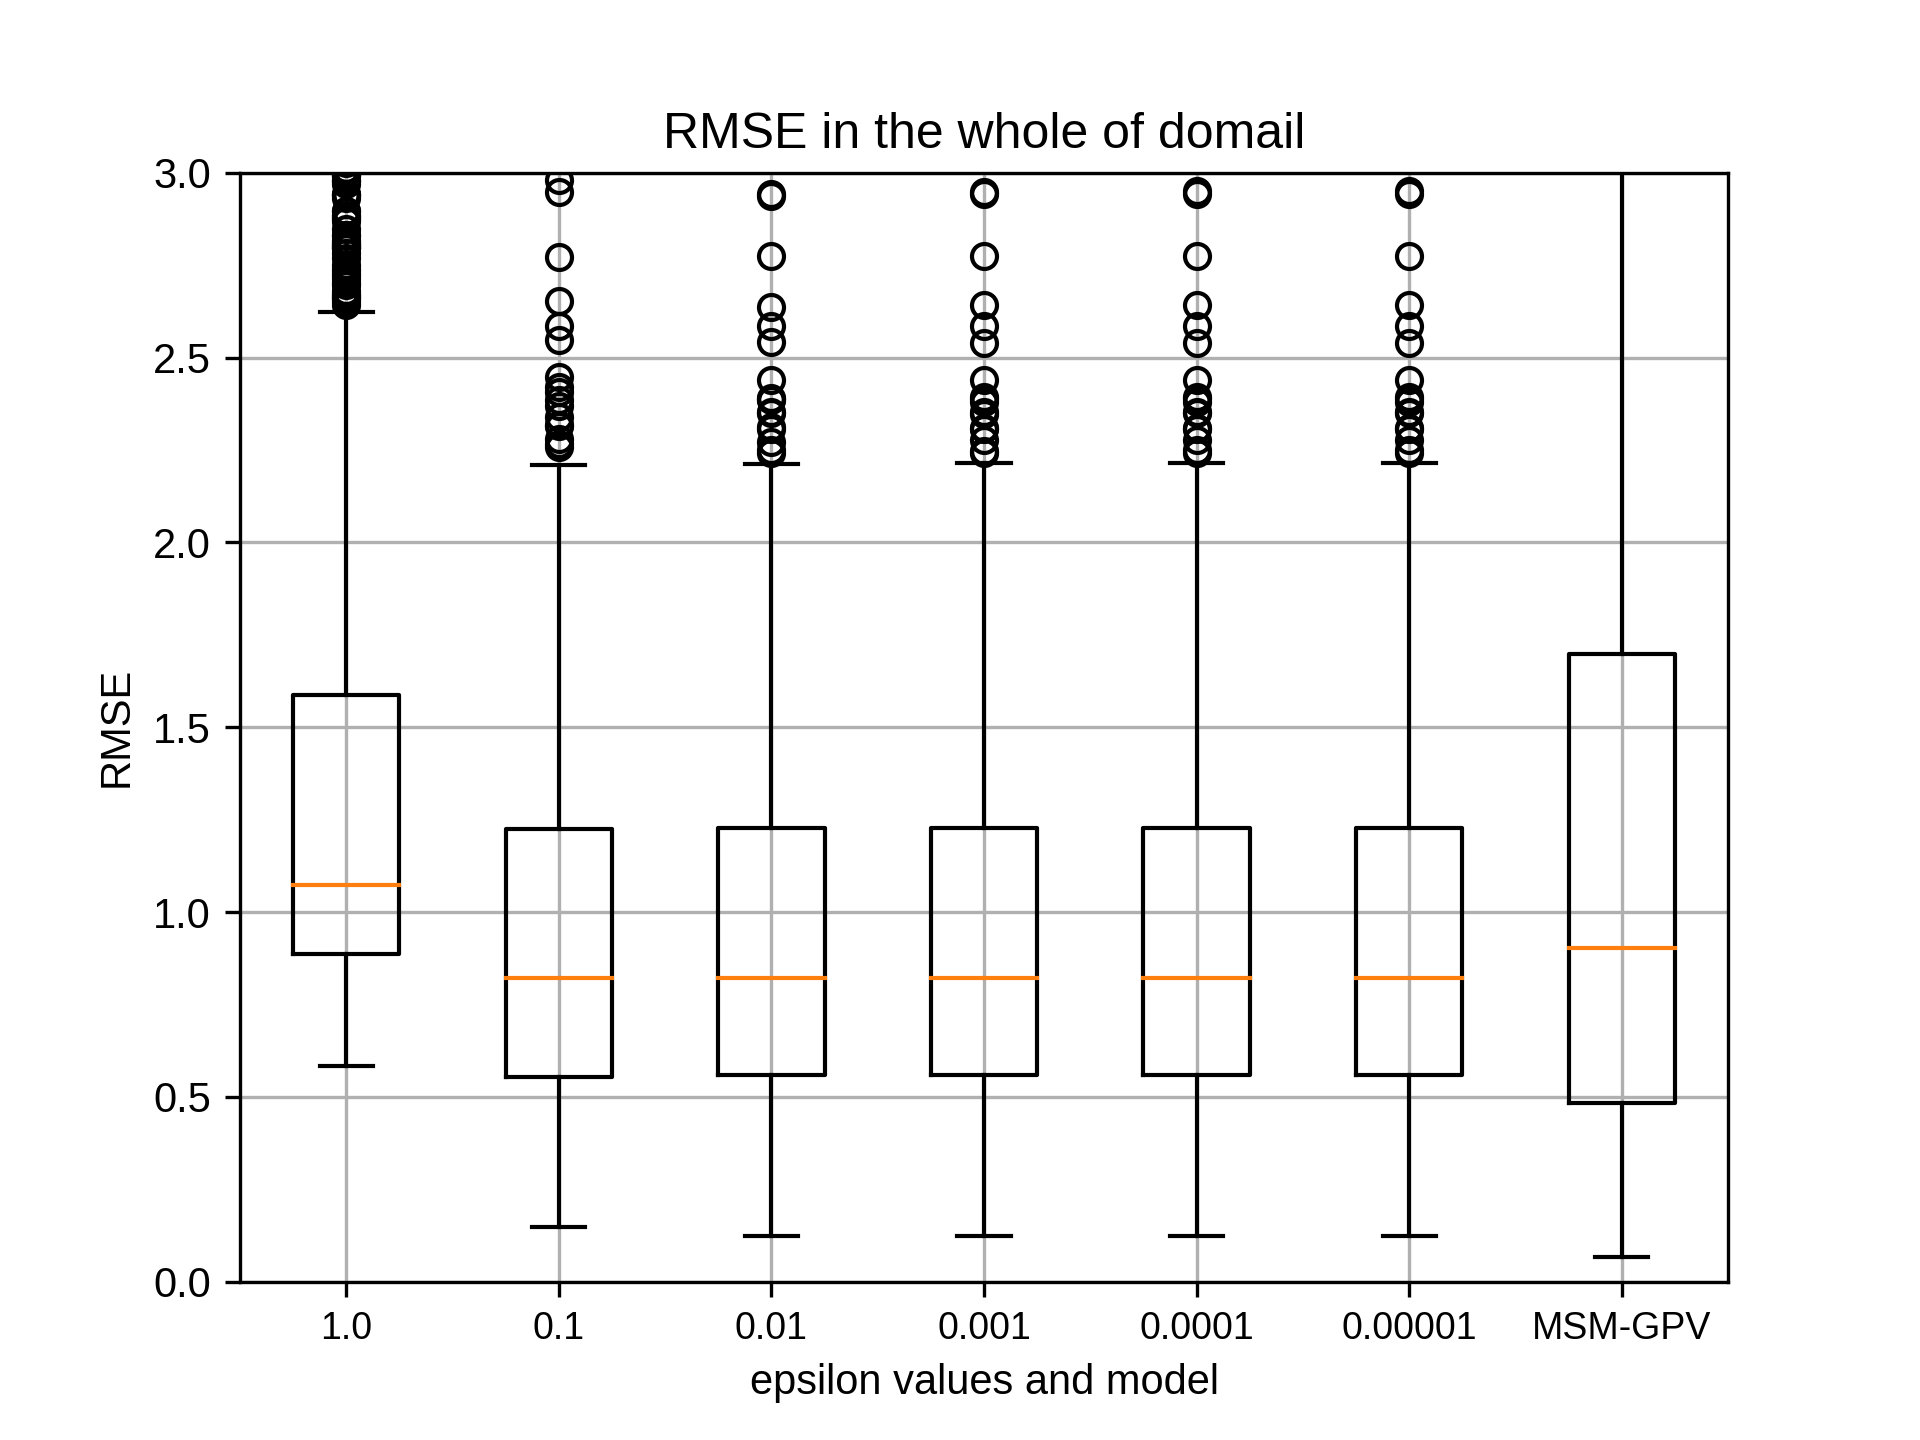
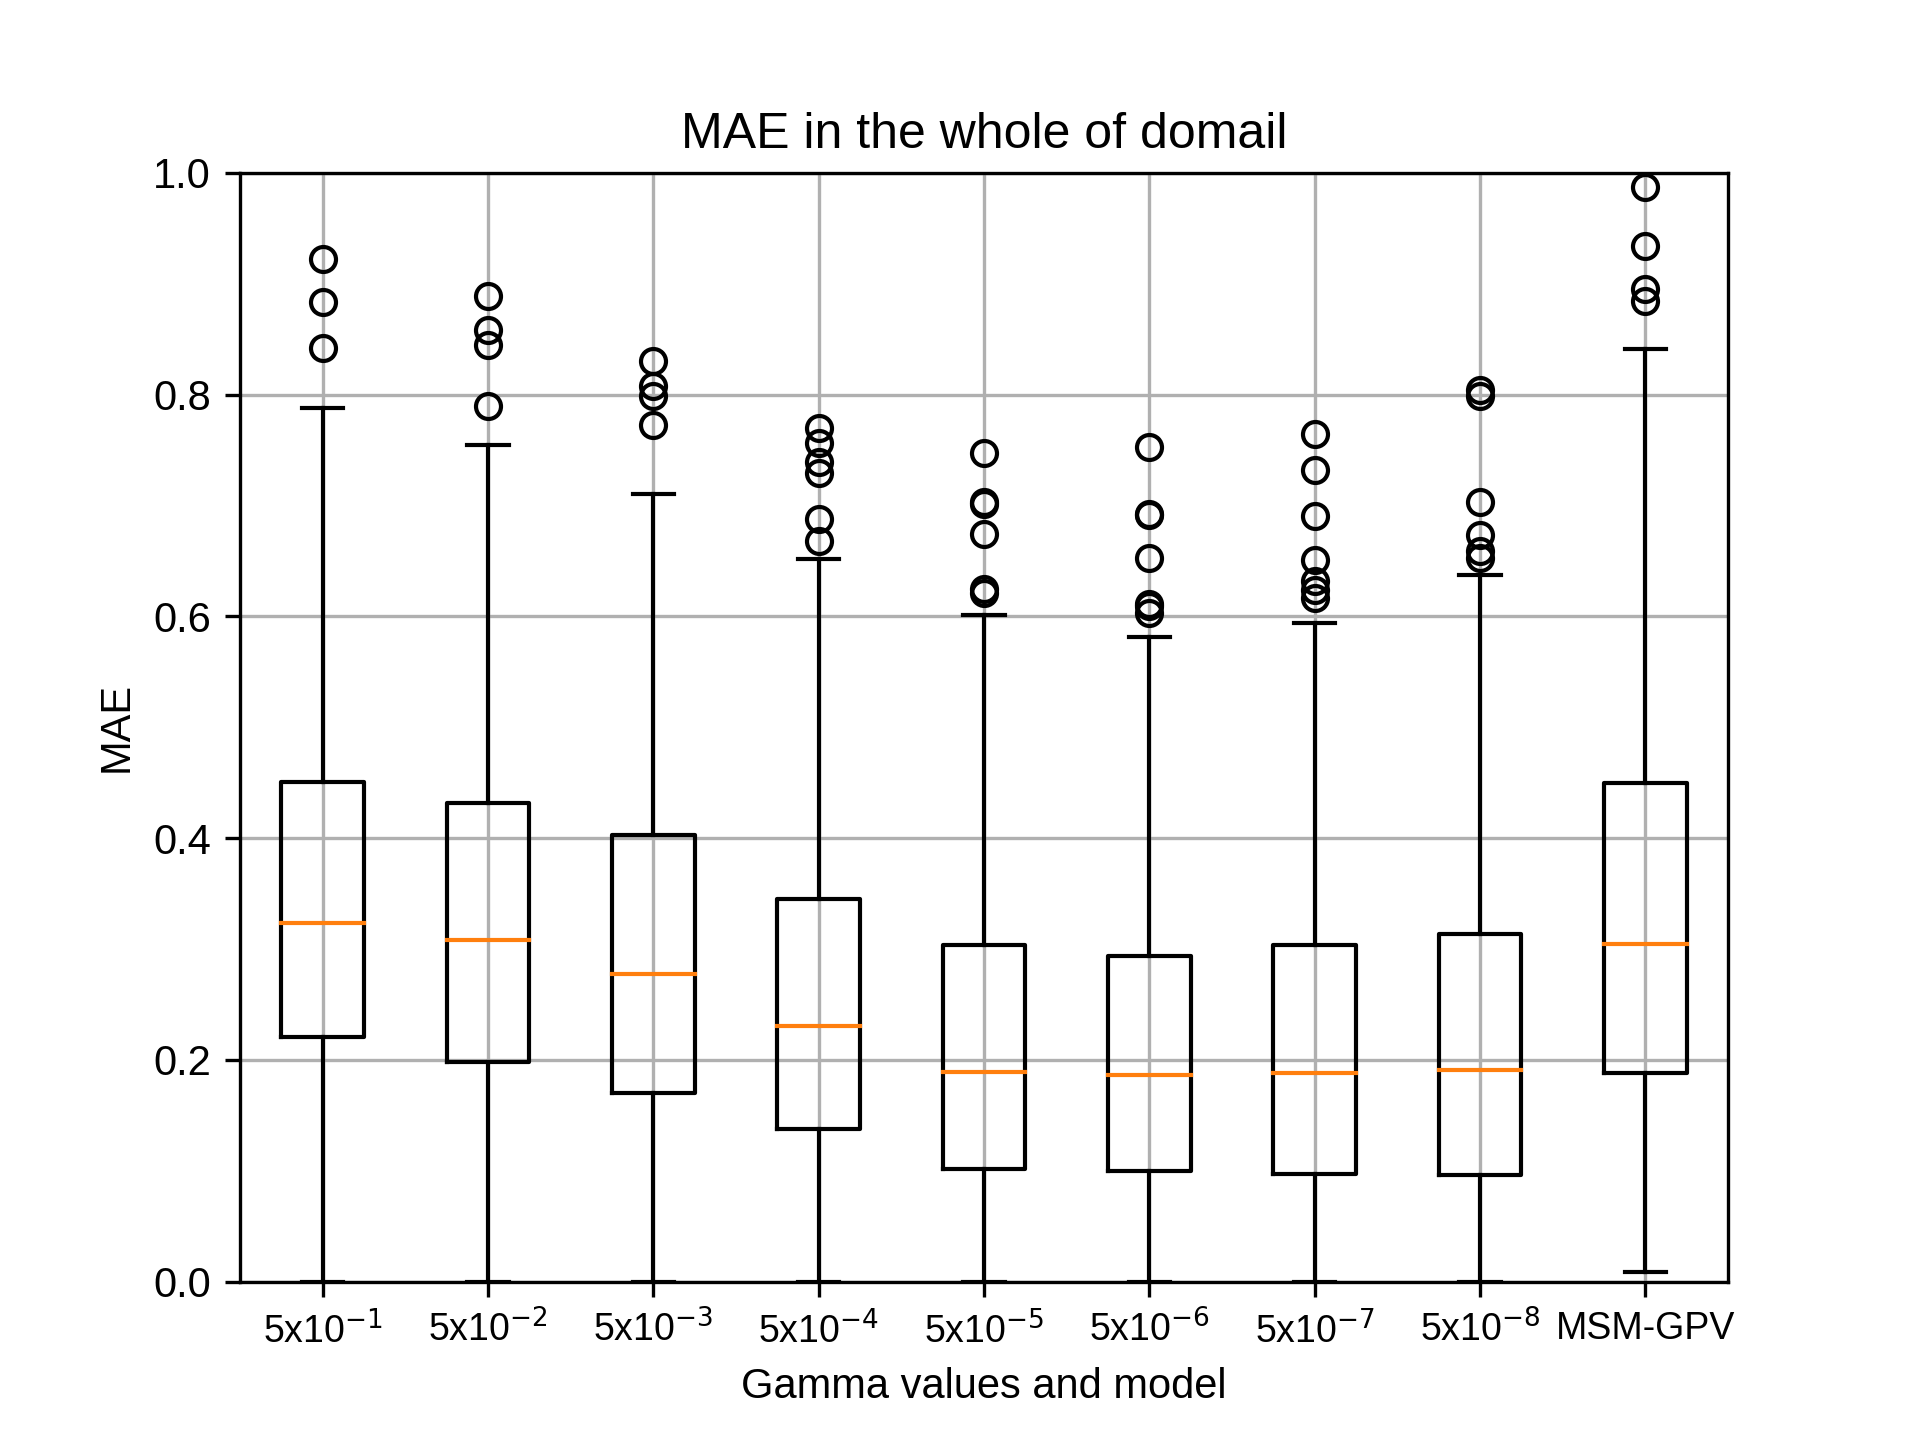
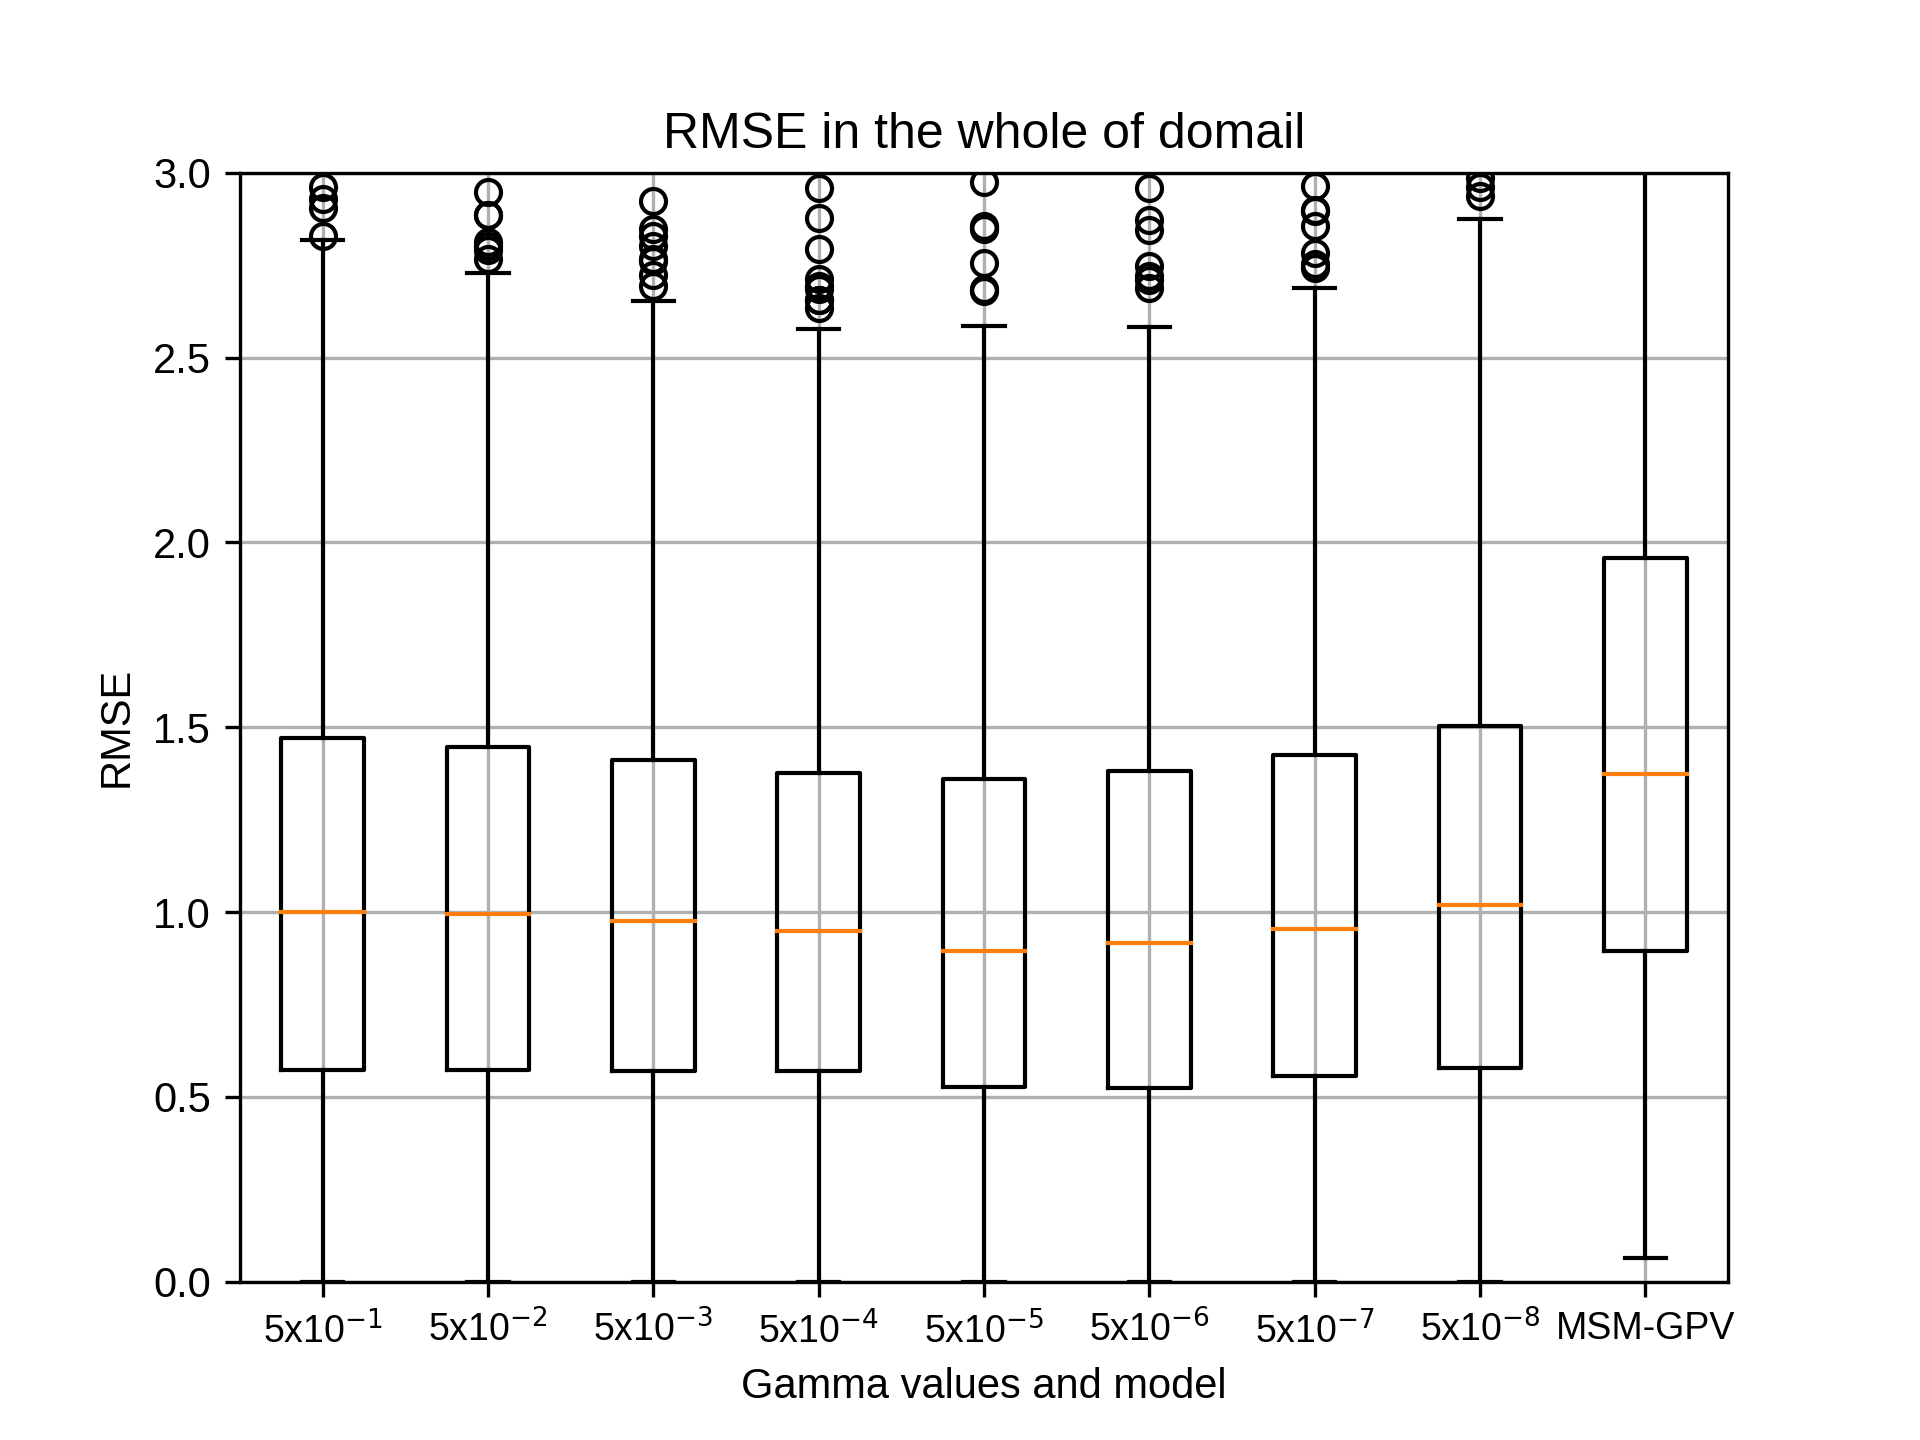
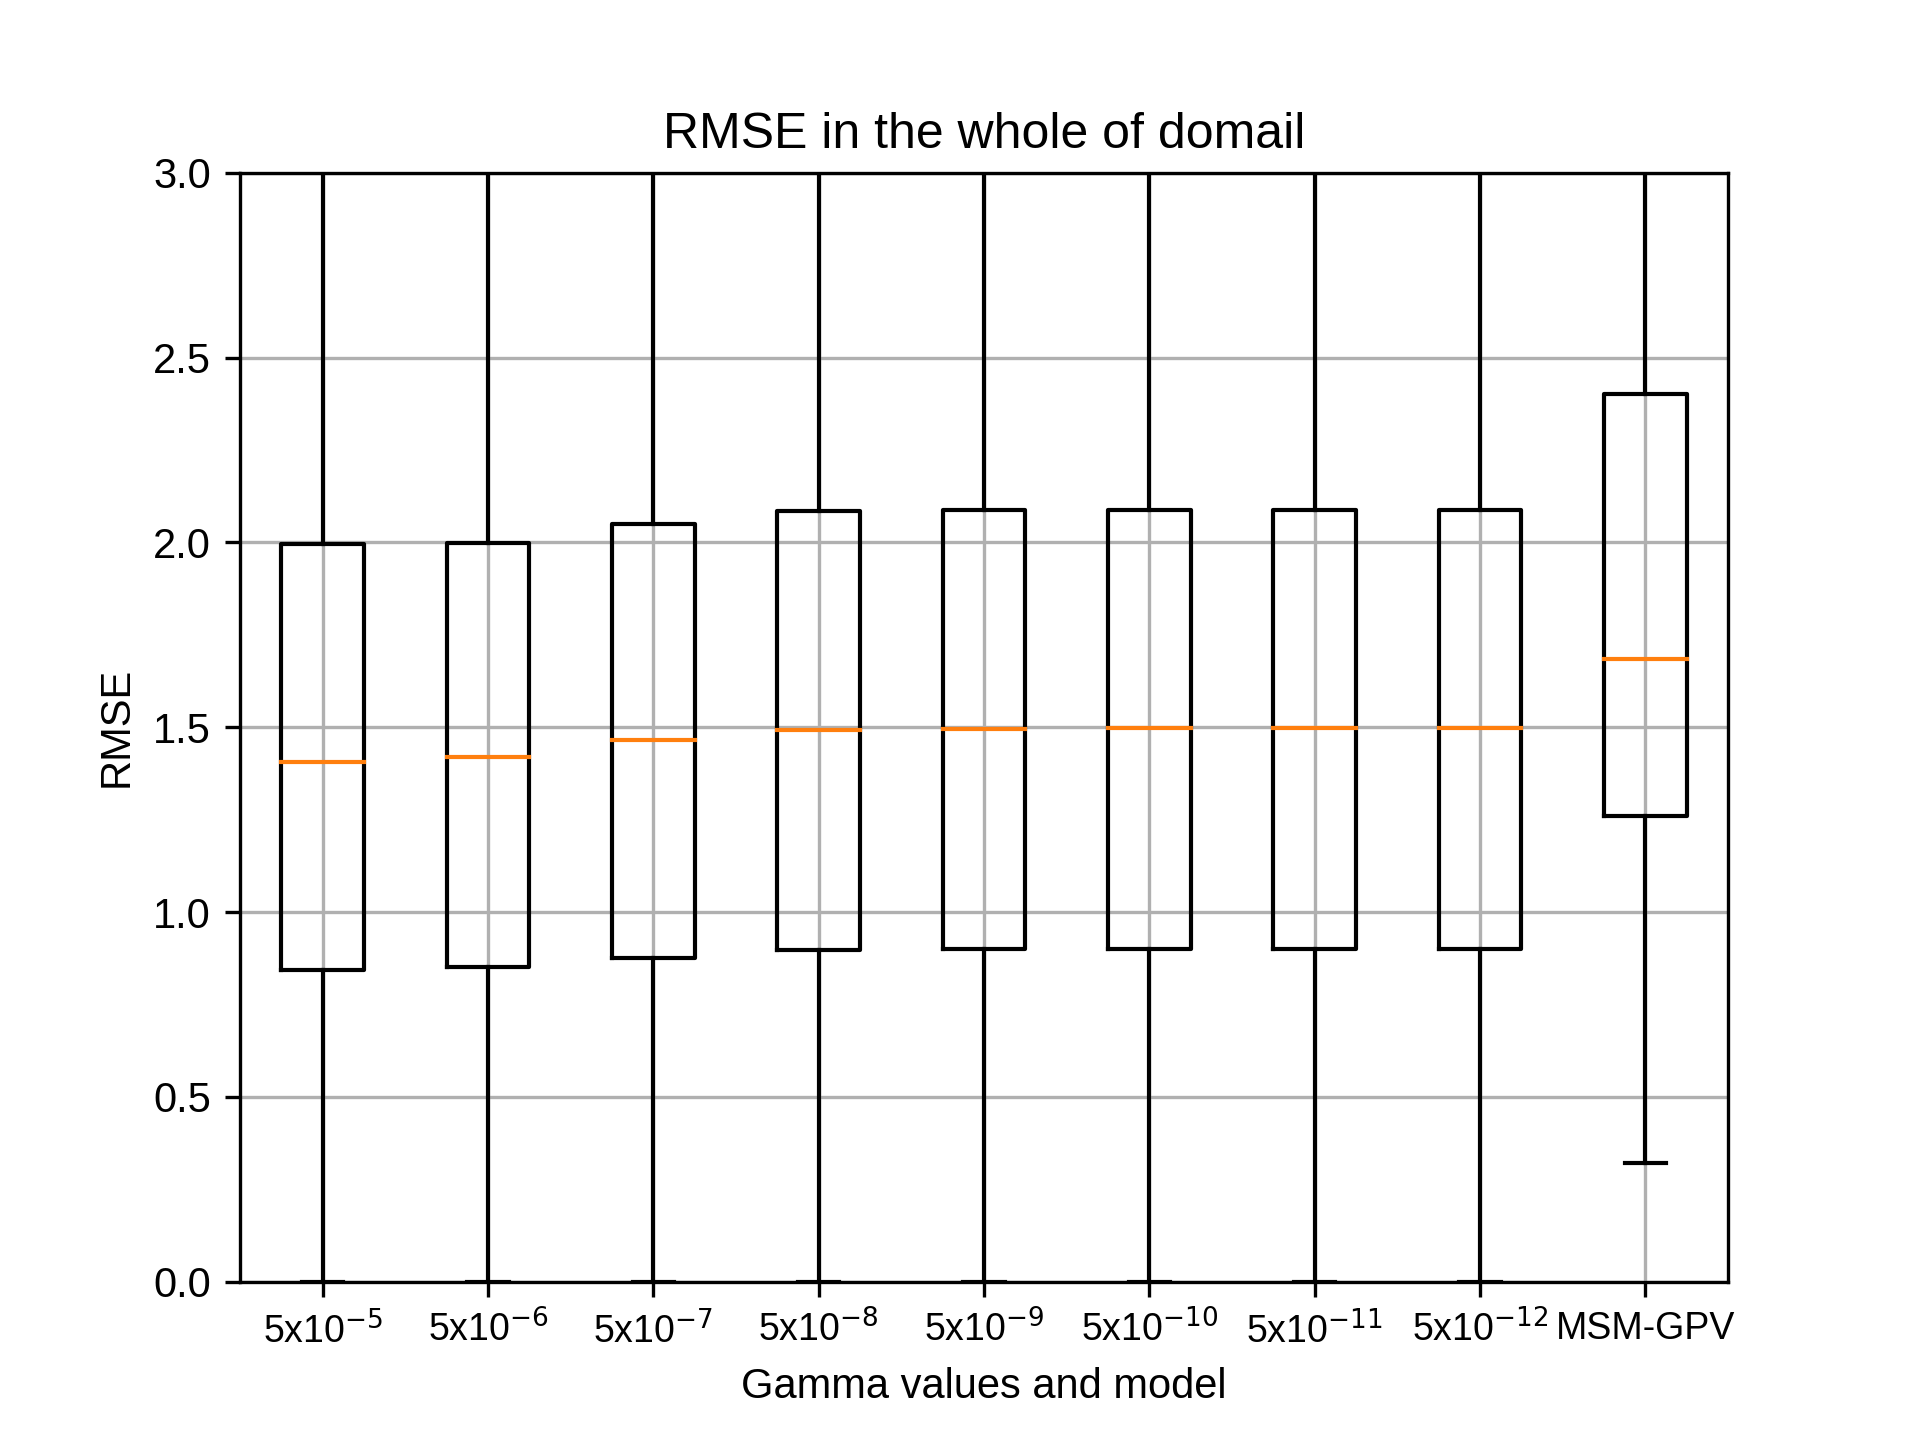
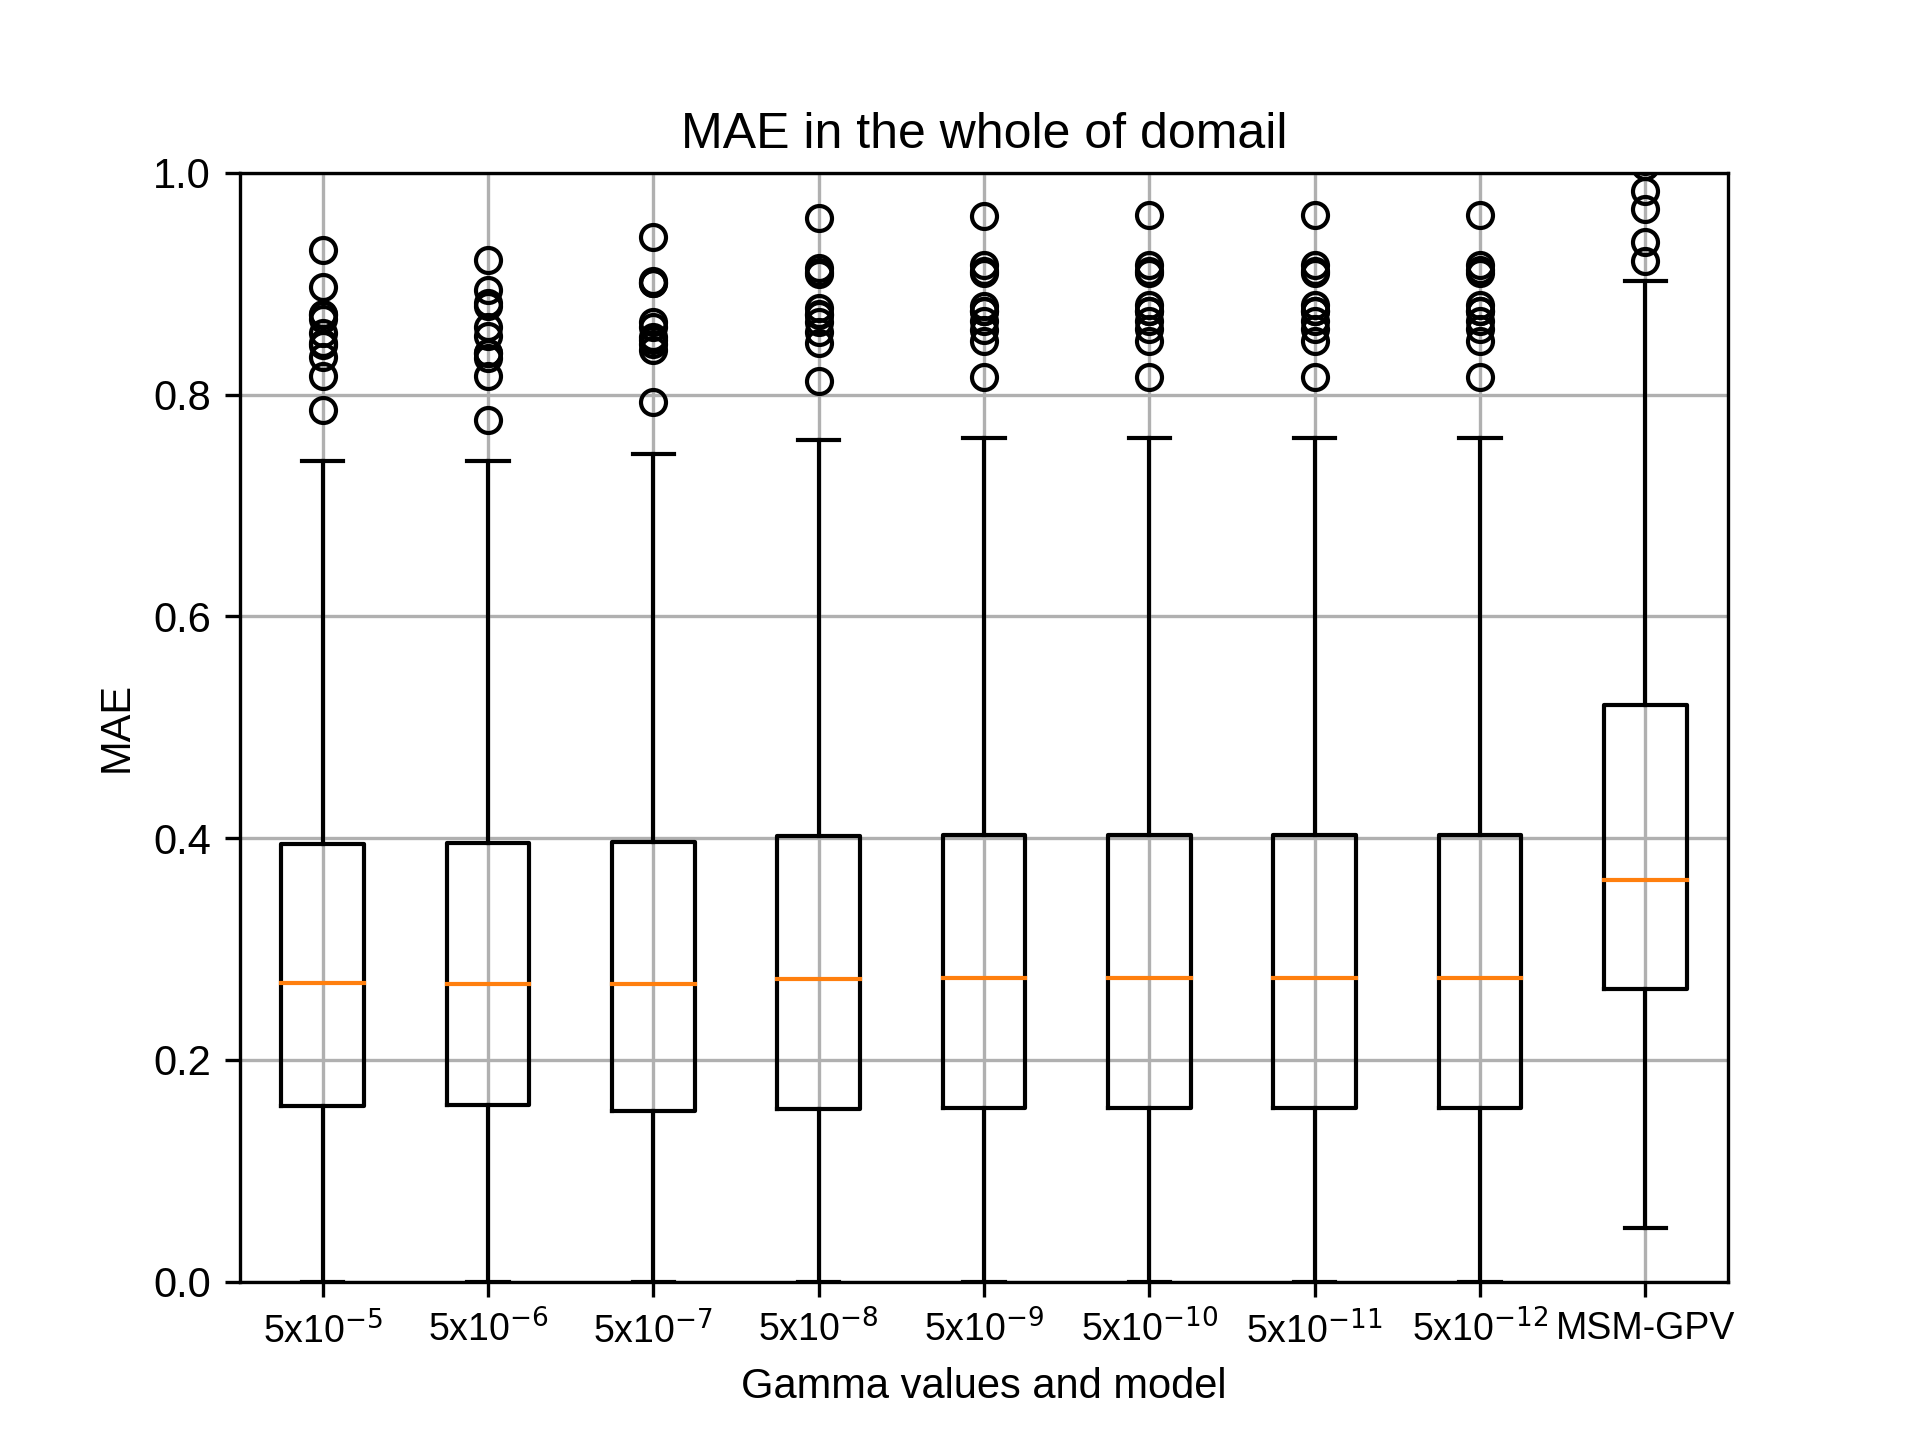
2007~2018年の7月の結果は添付のエクセルファイルのとおりです。
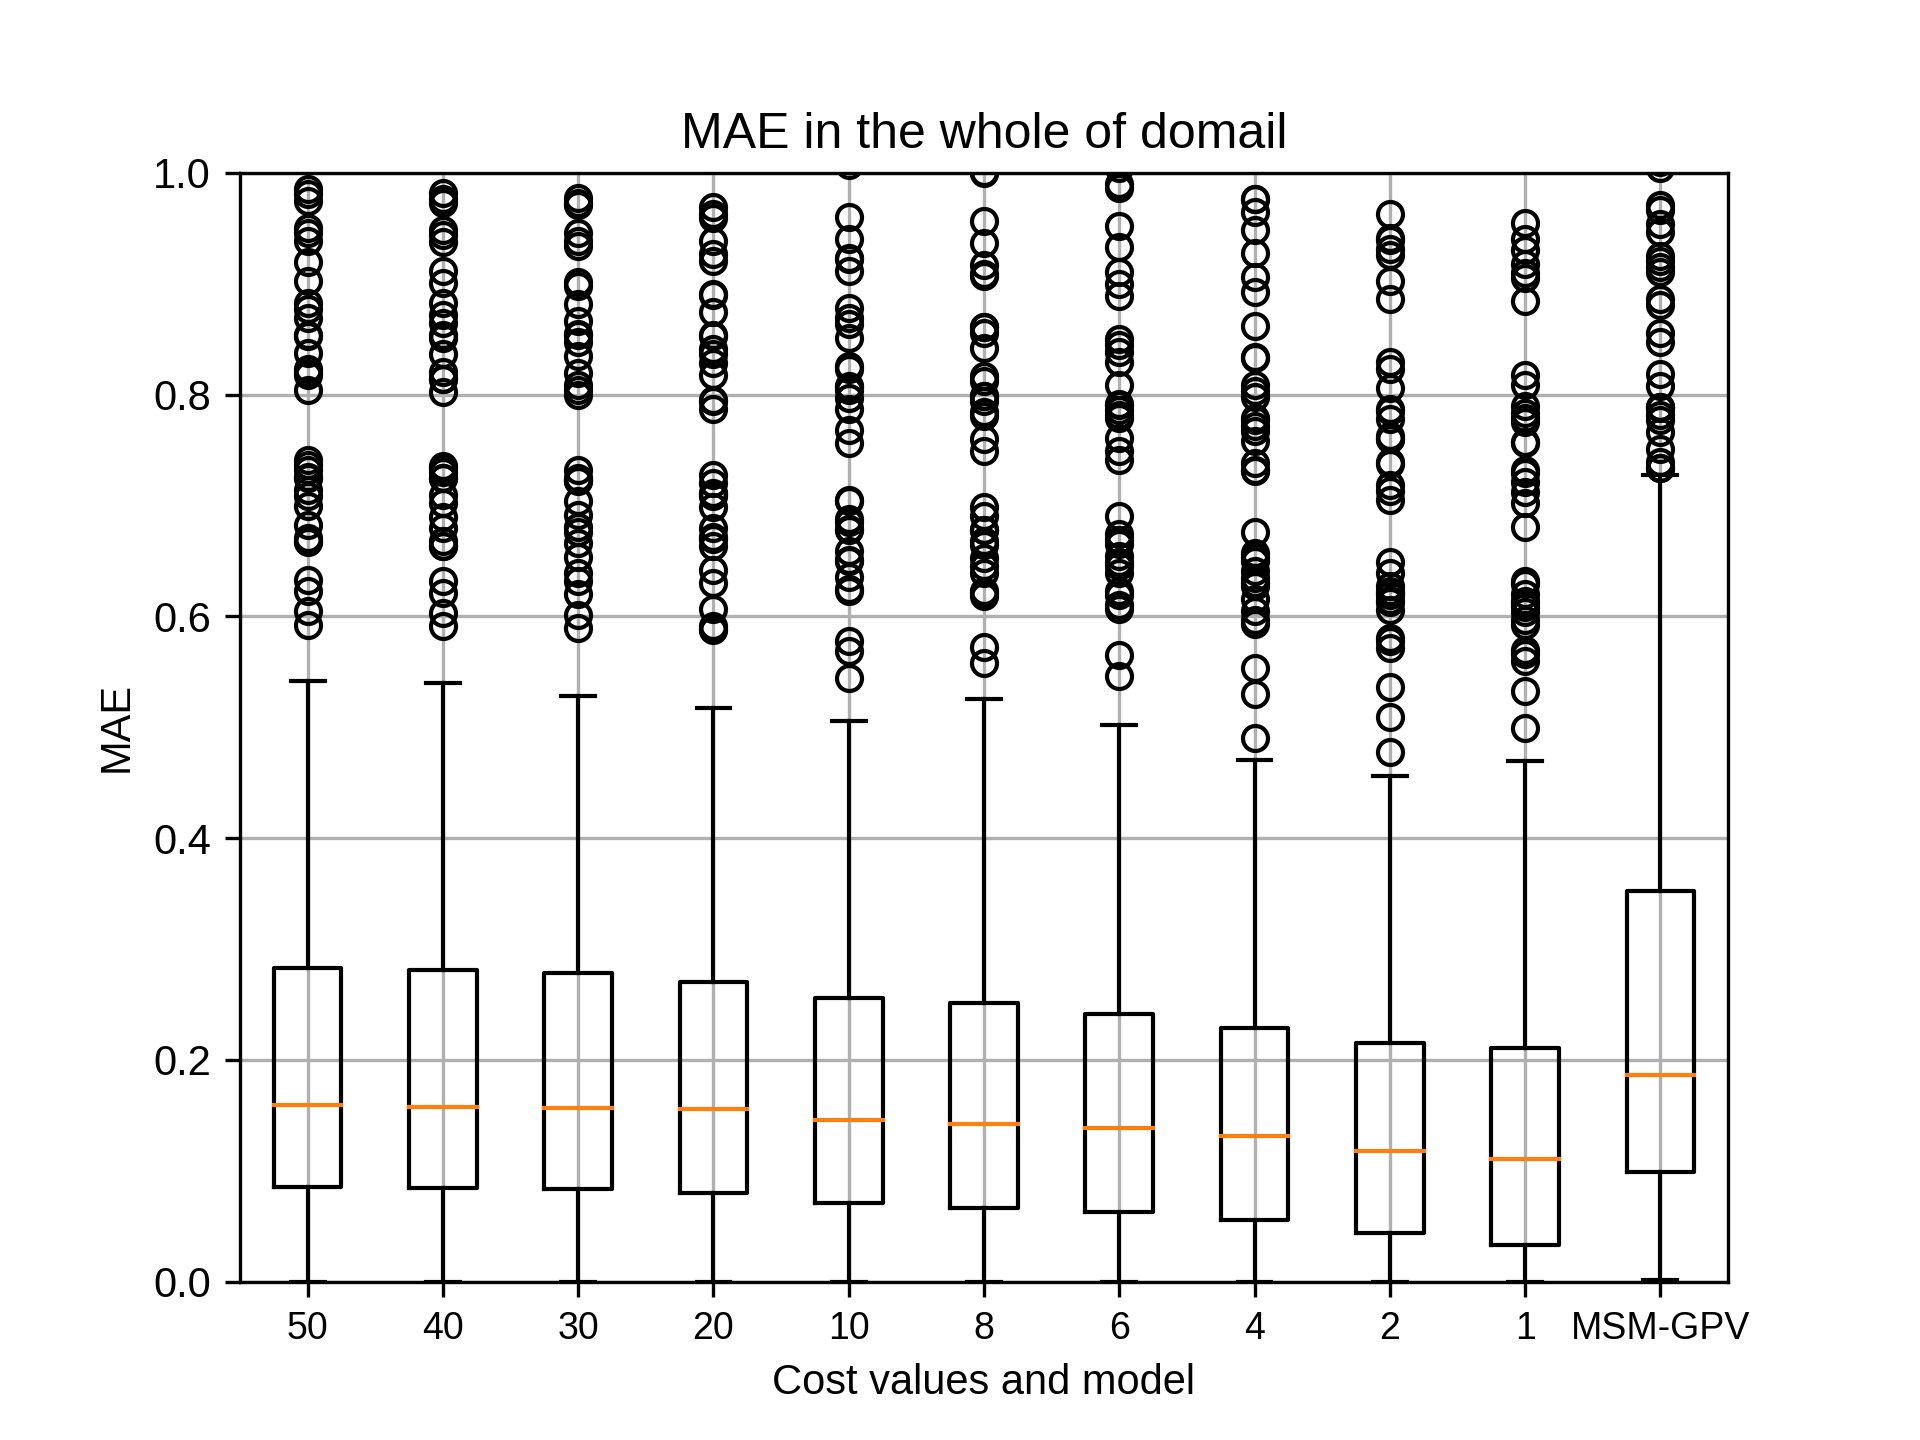
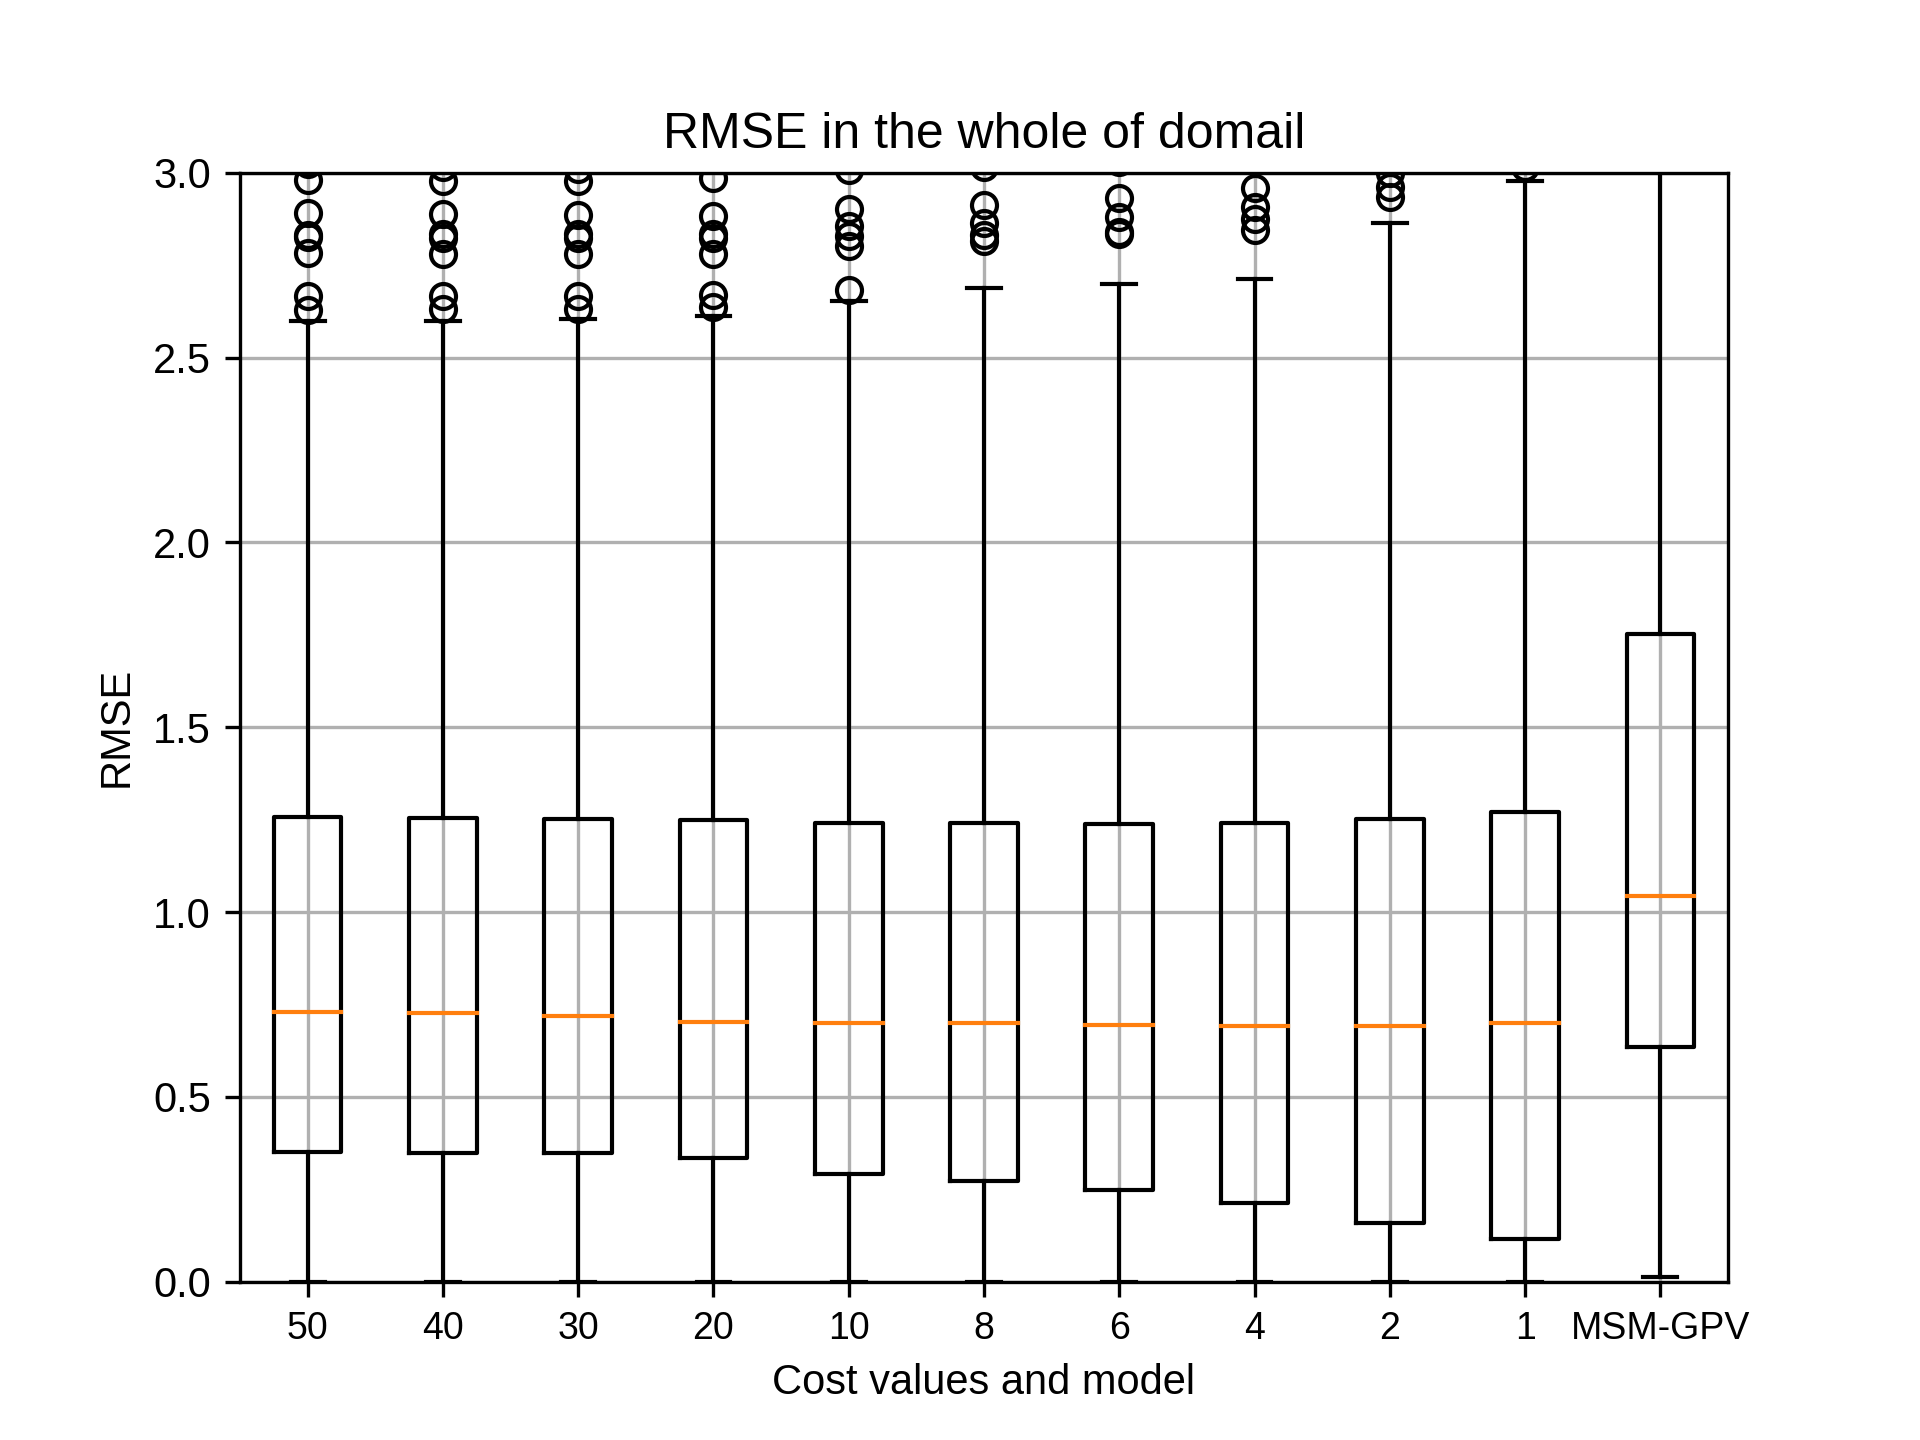
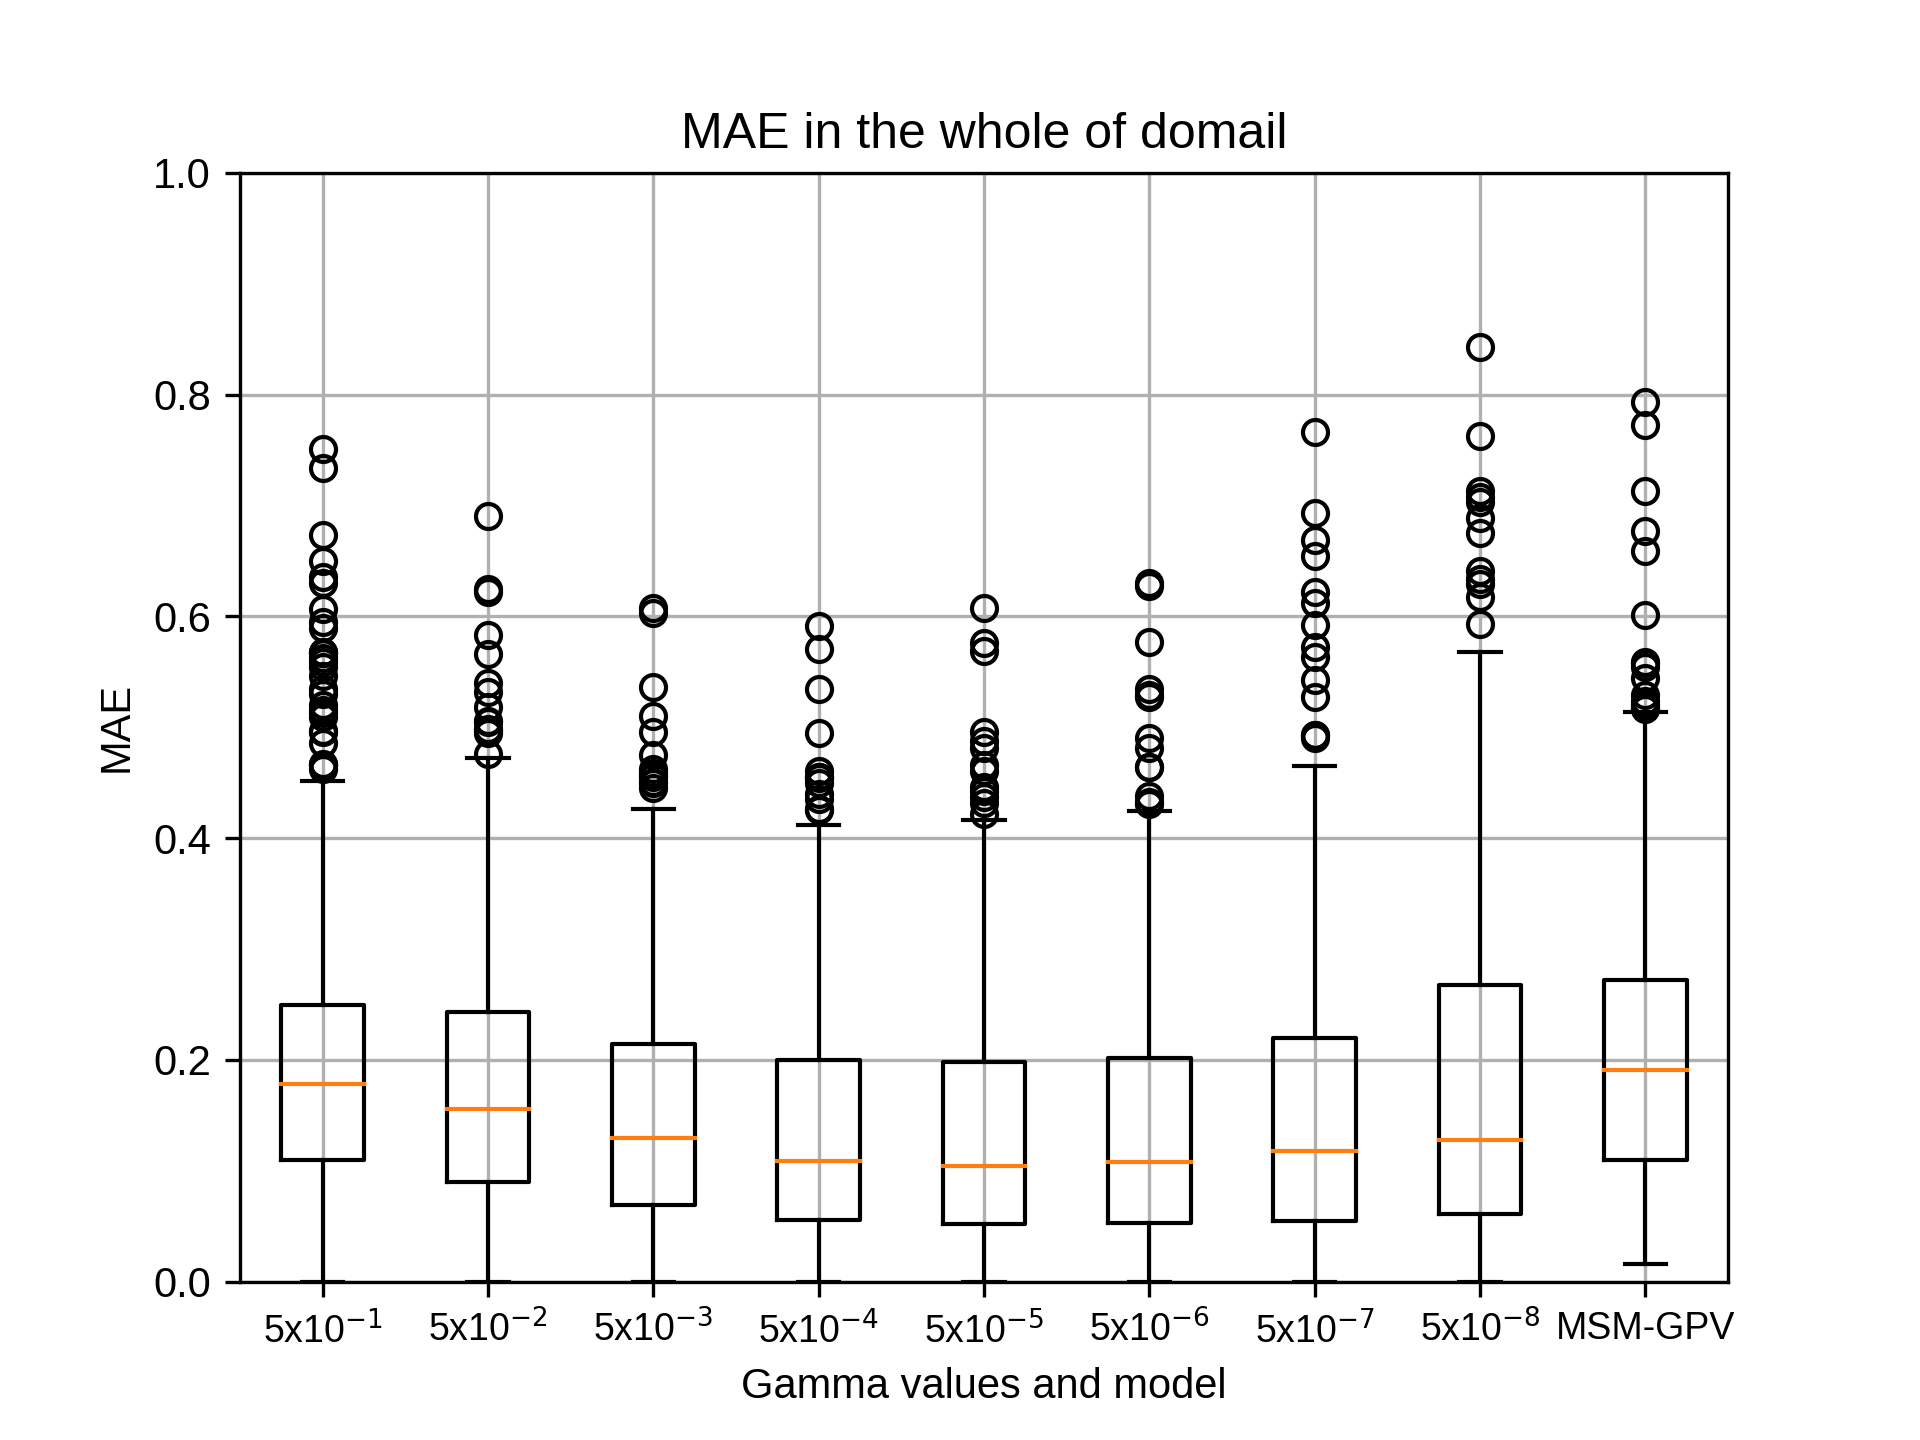
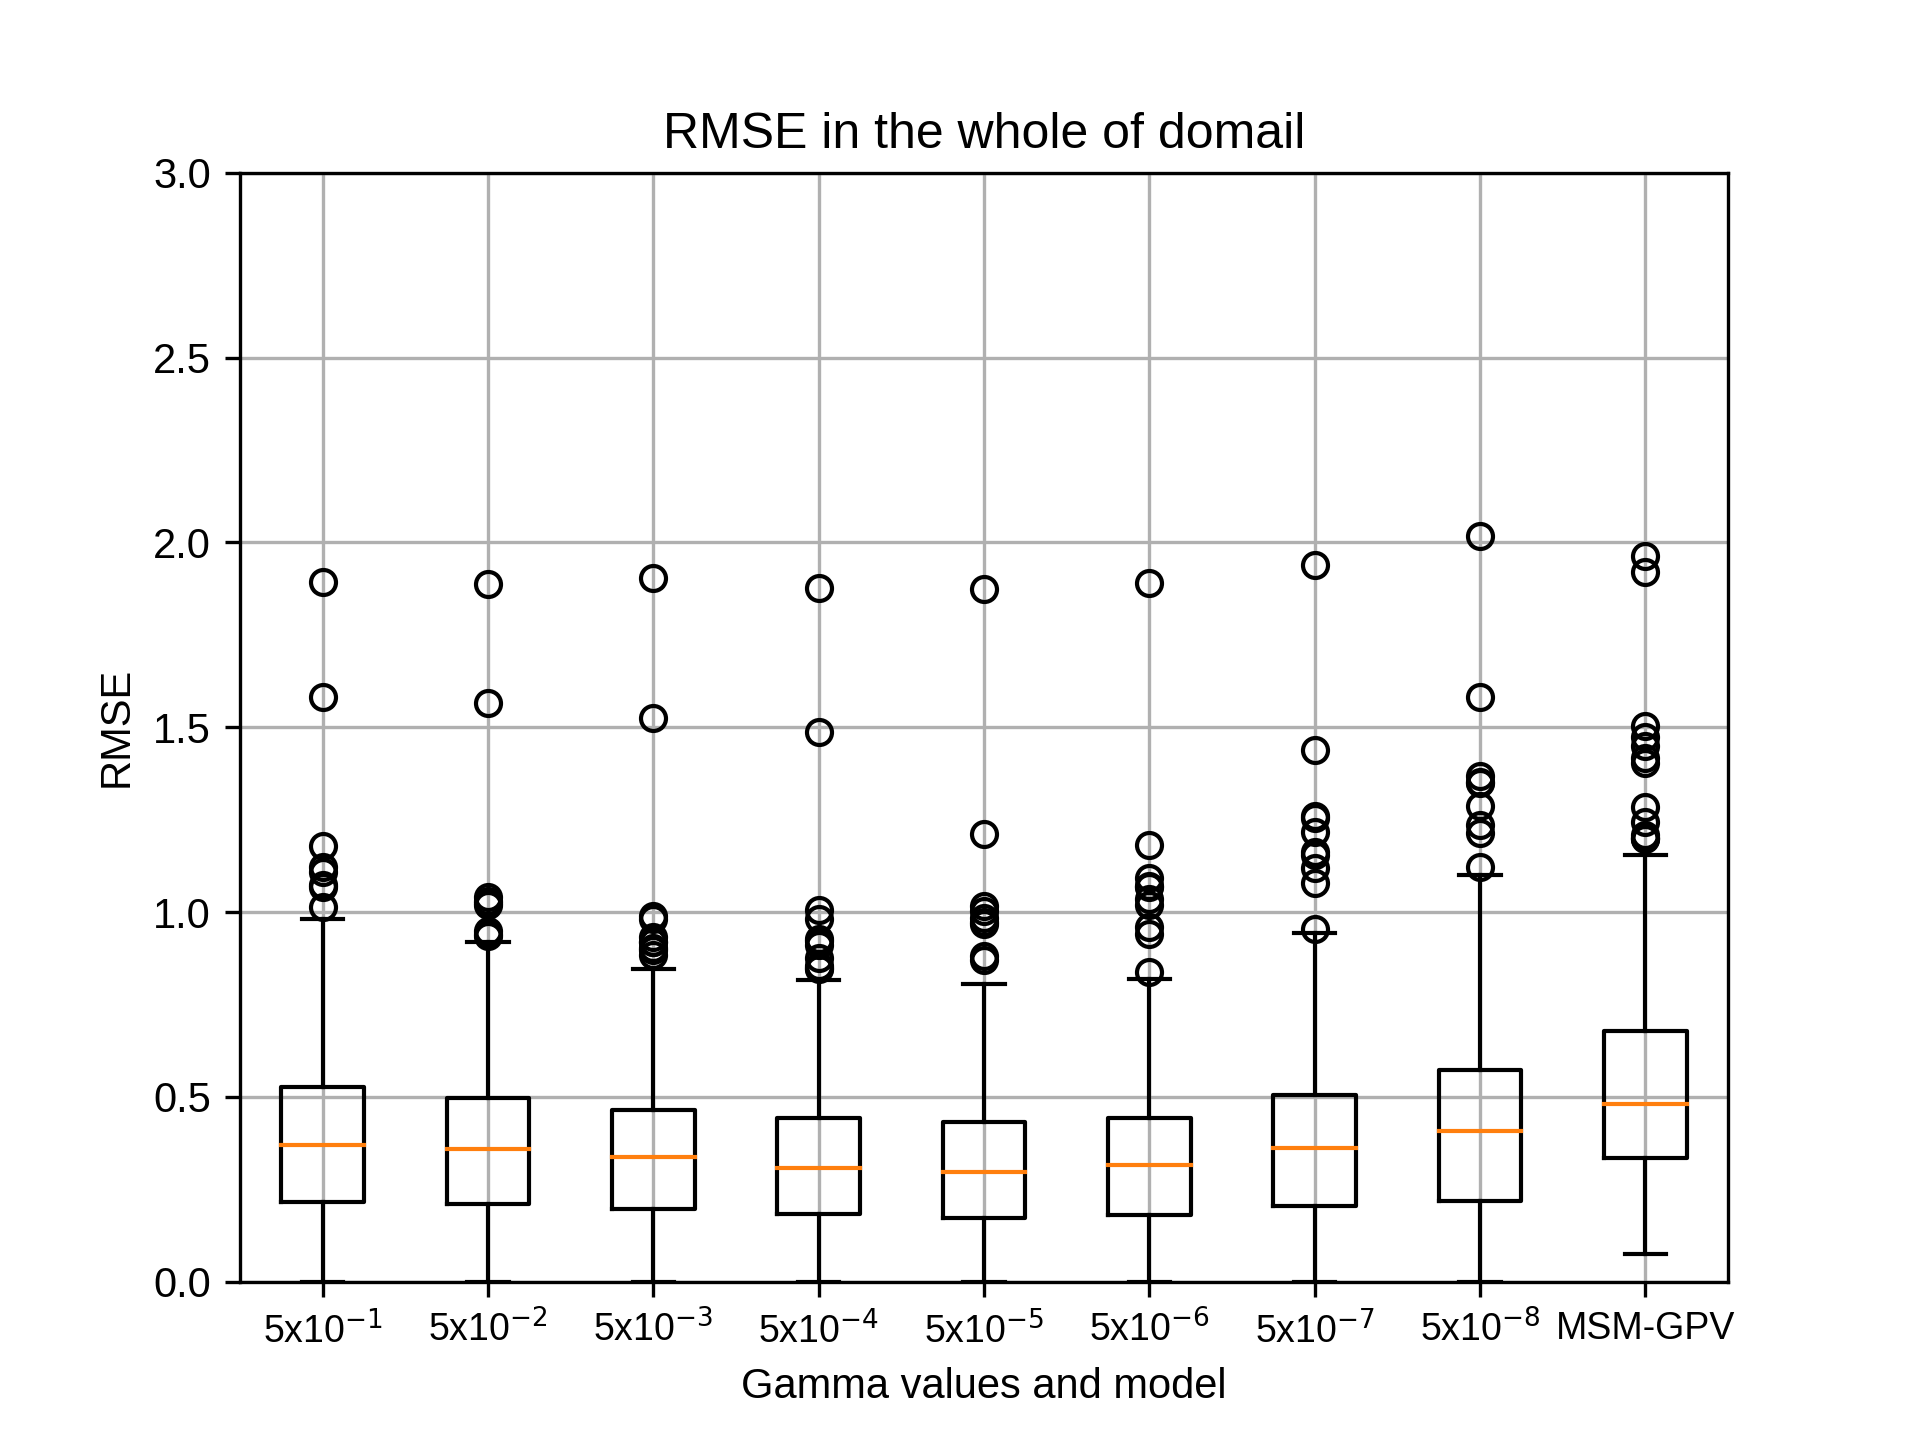
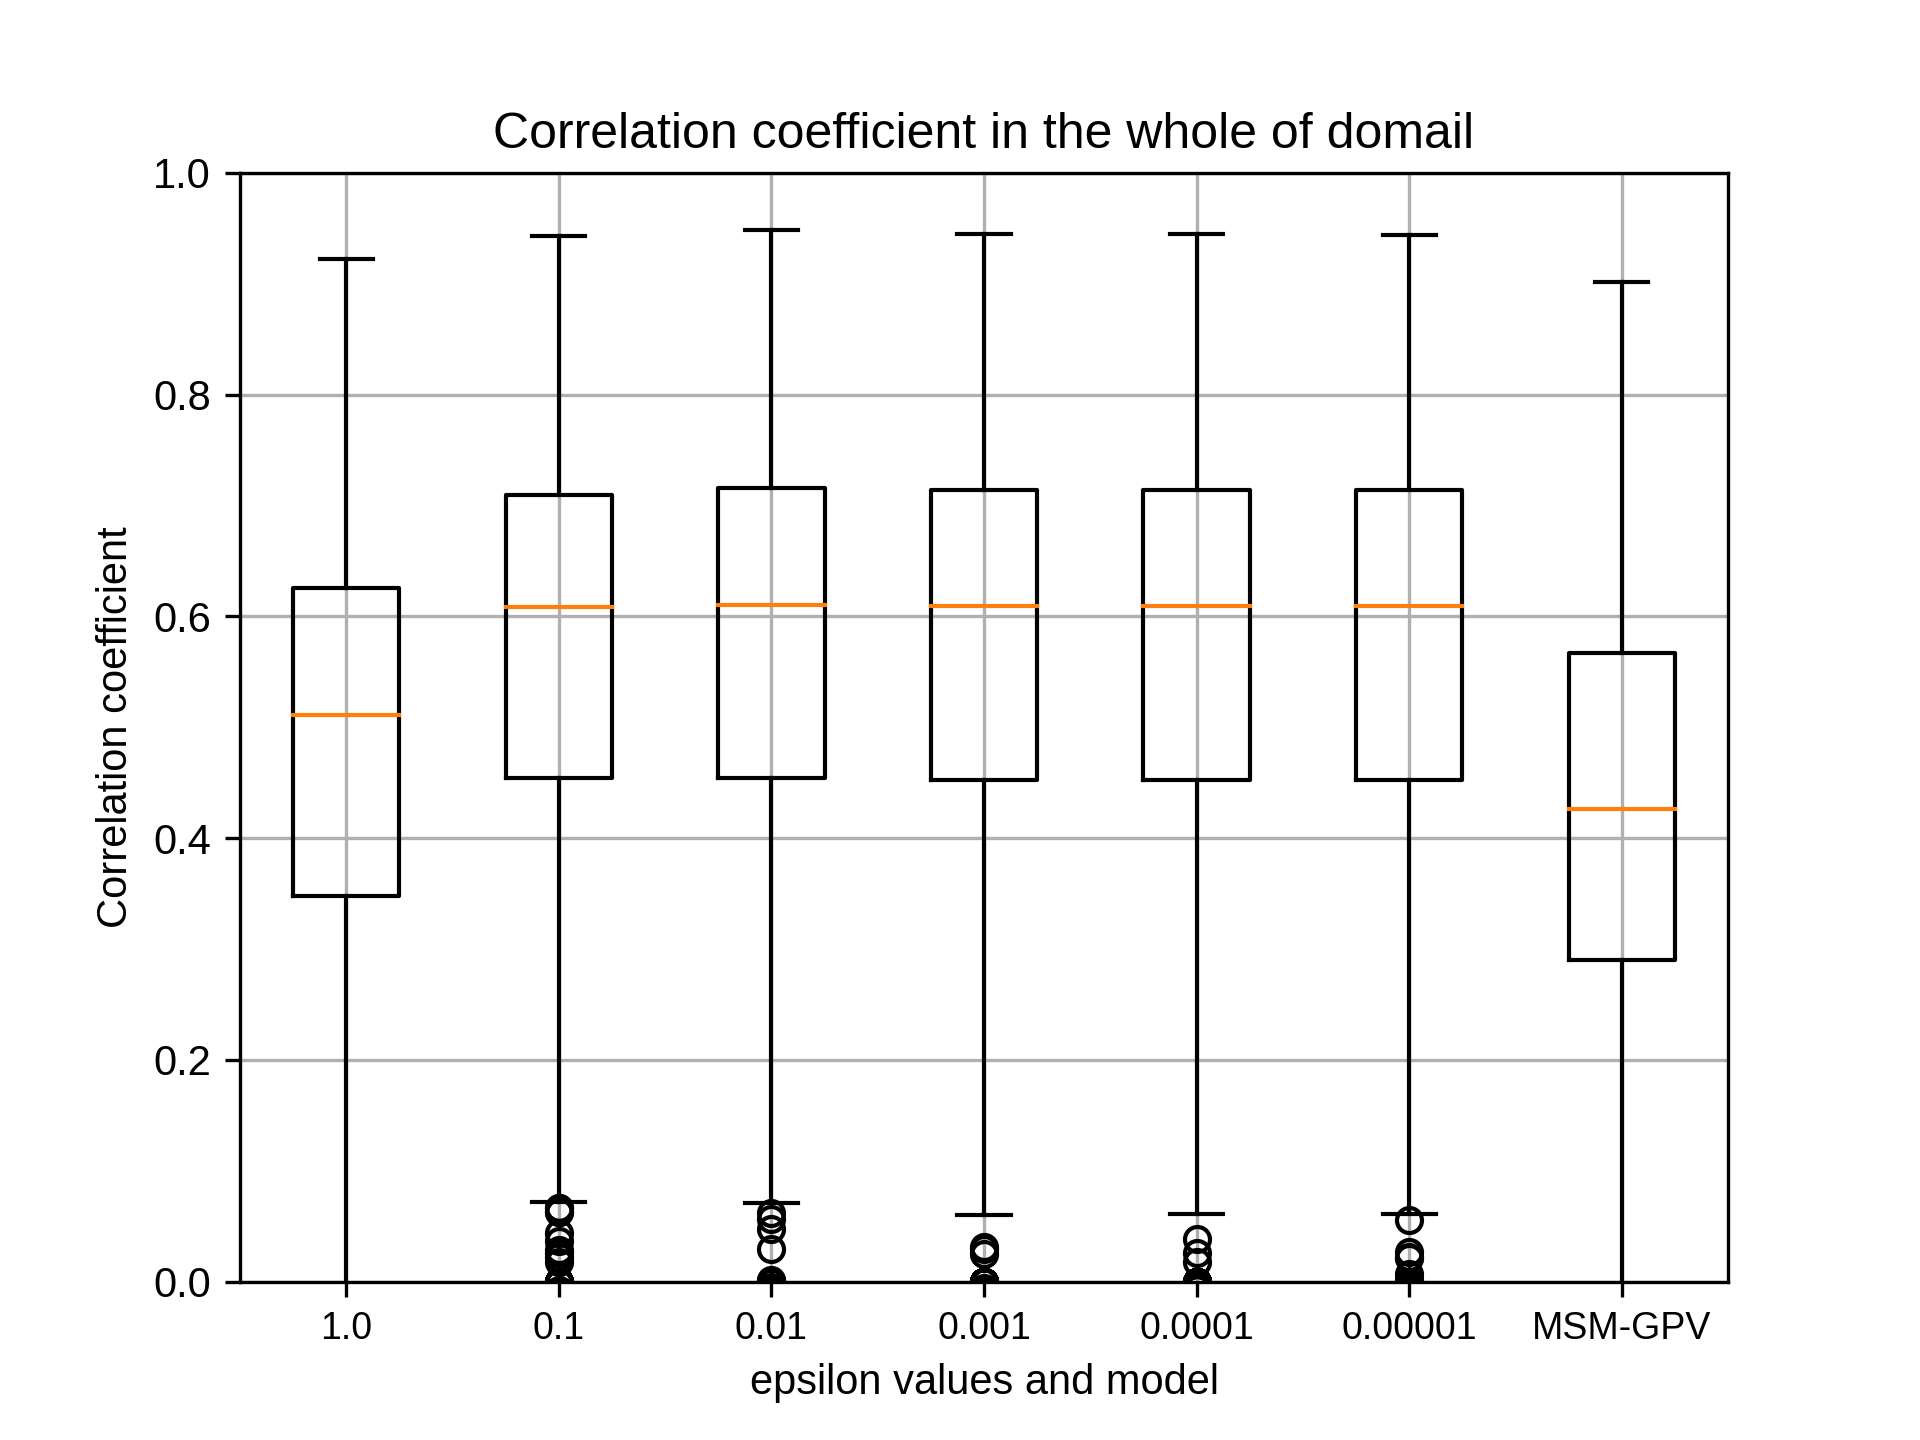
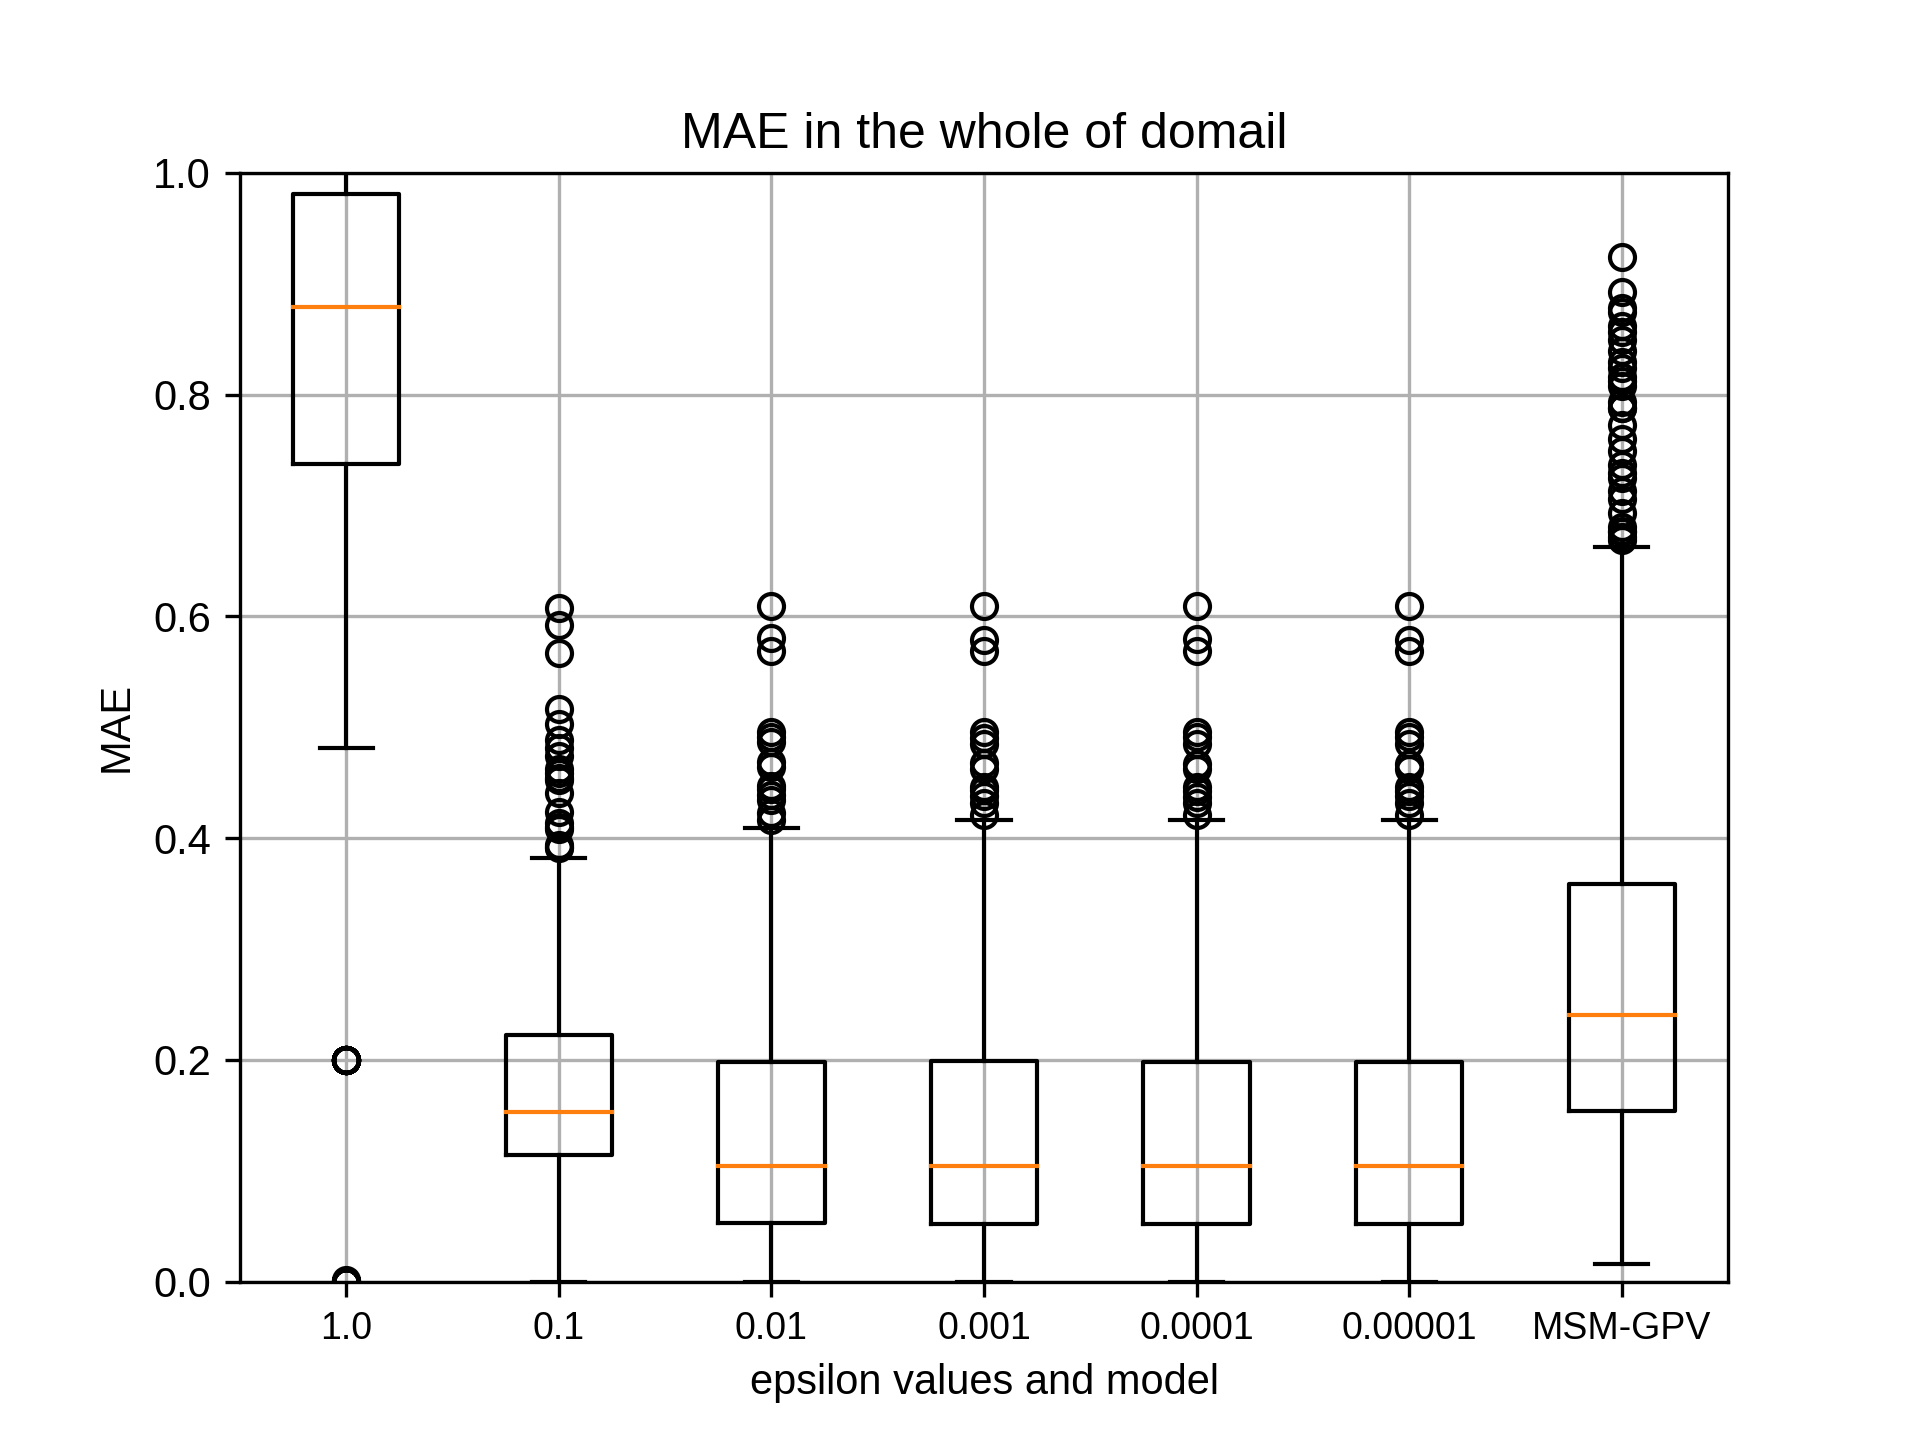
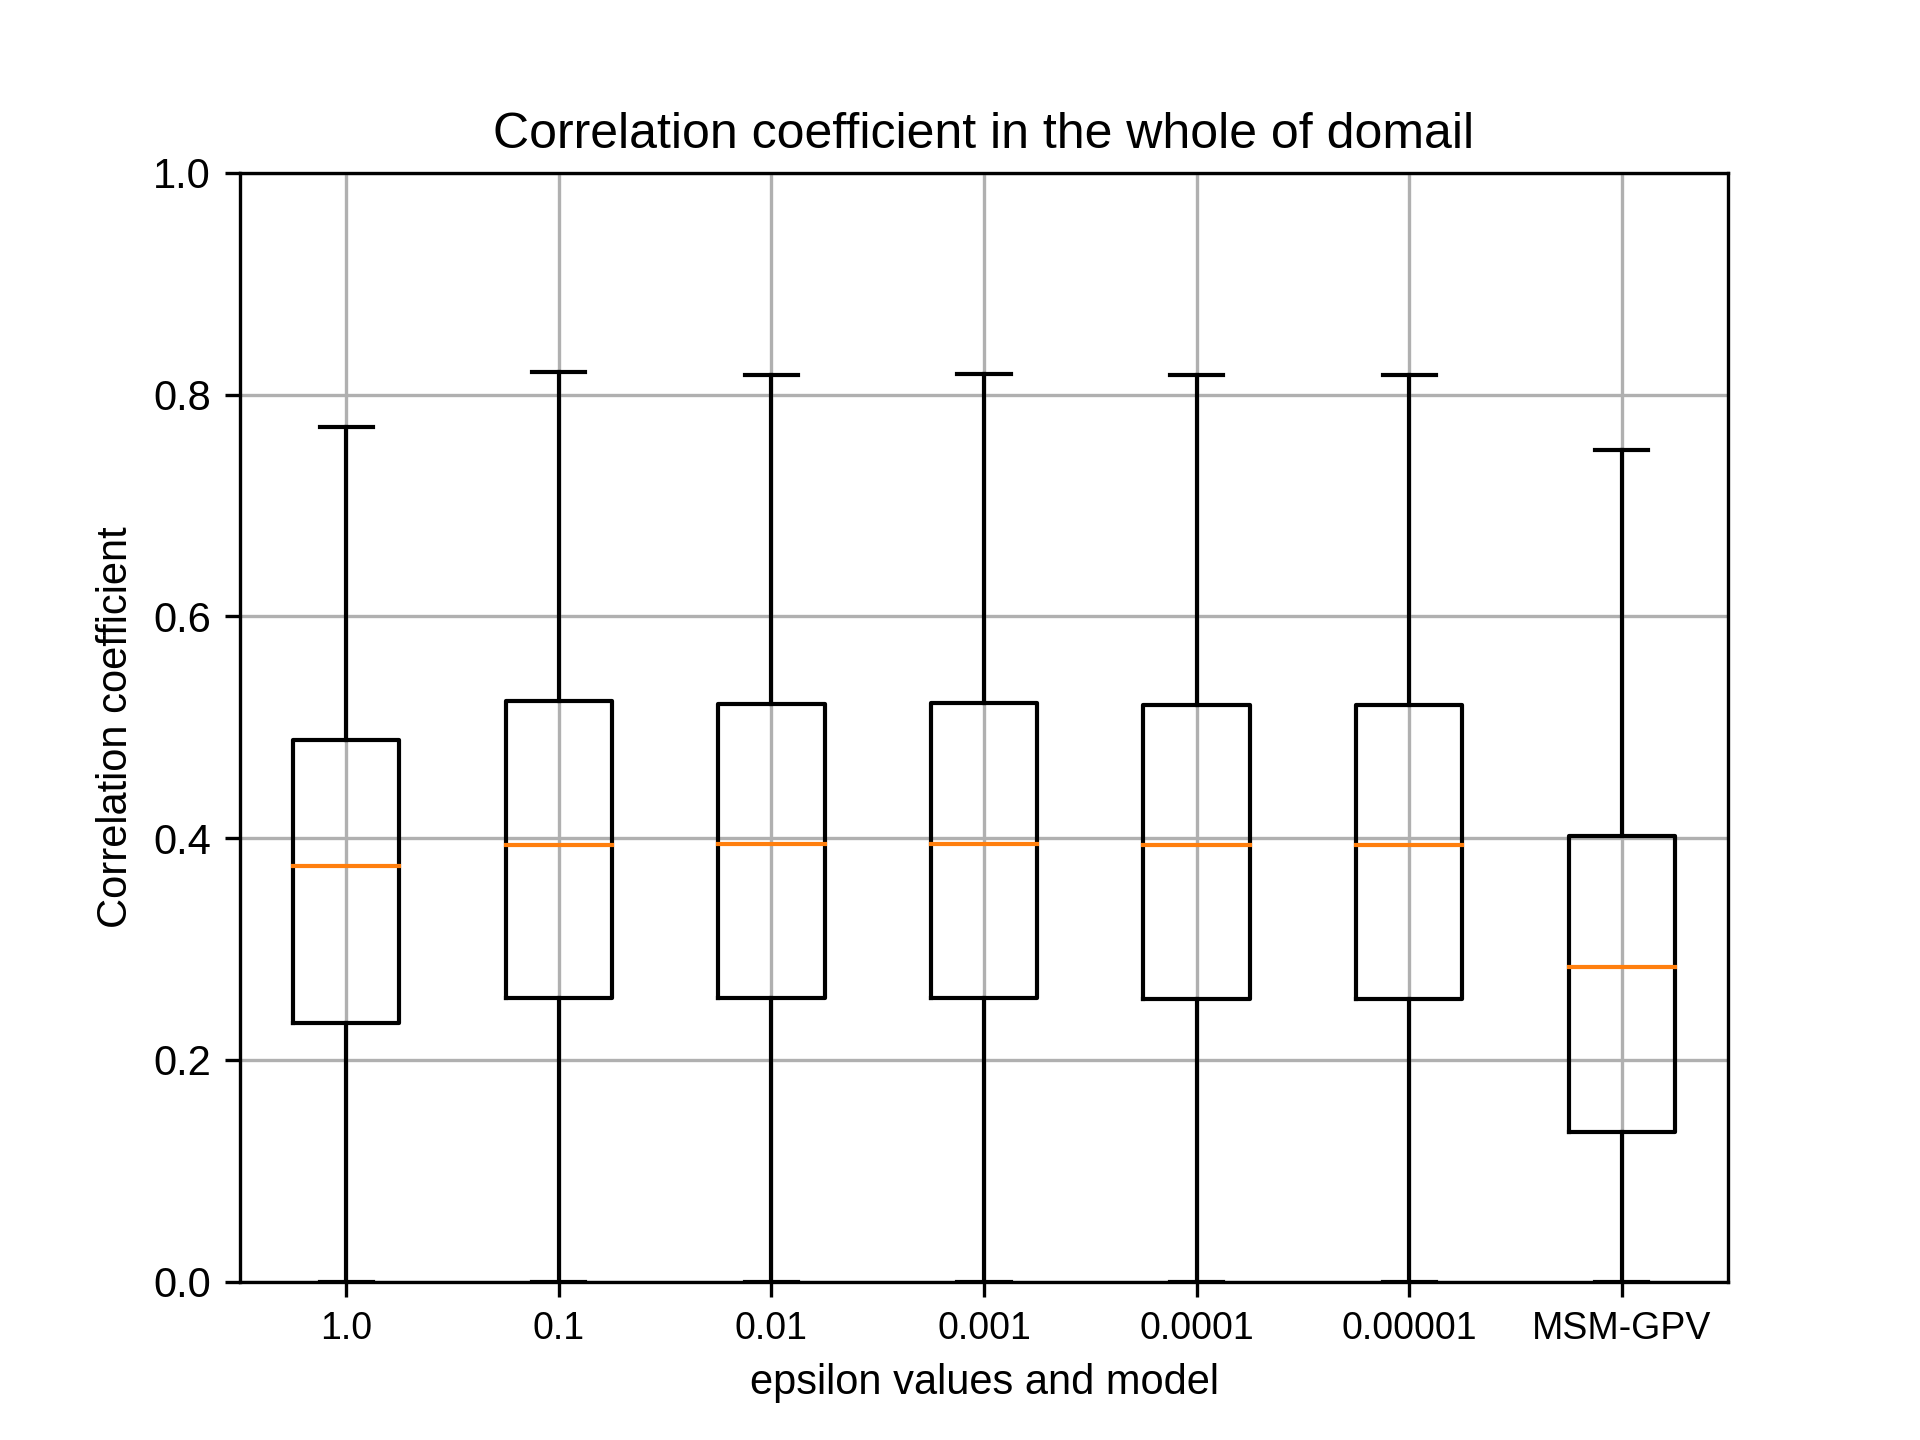
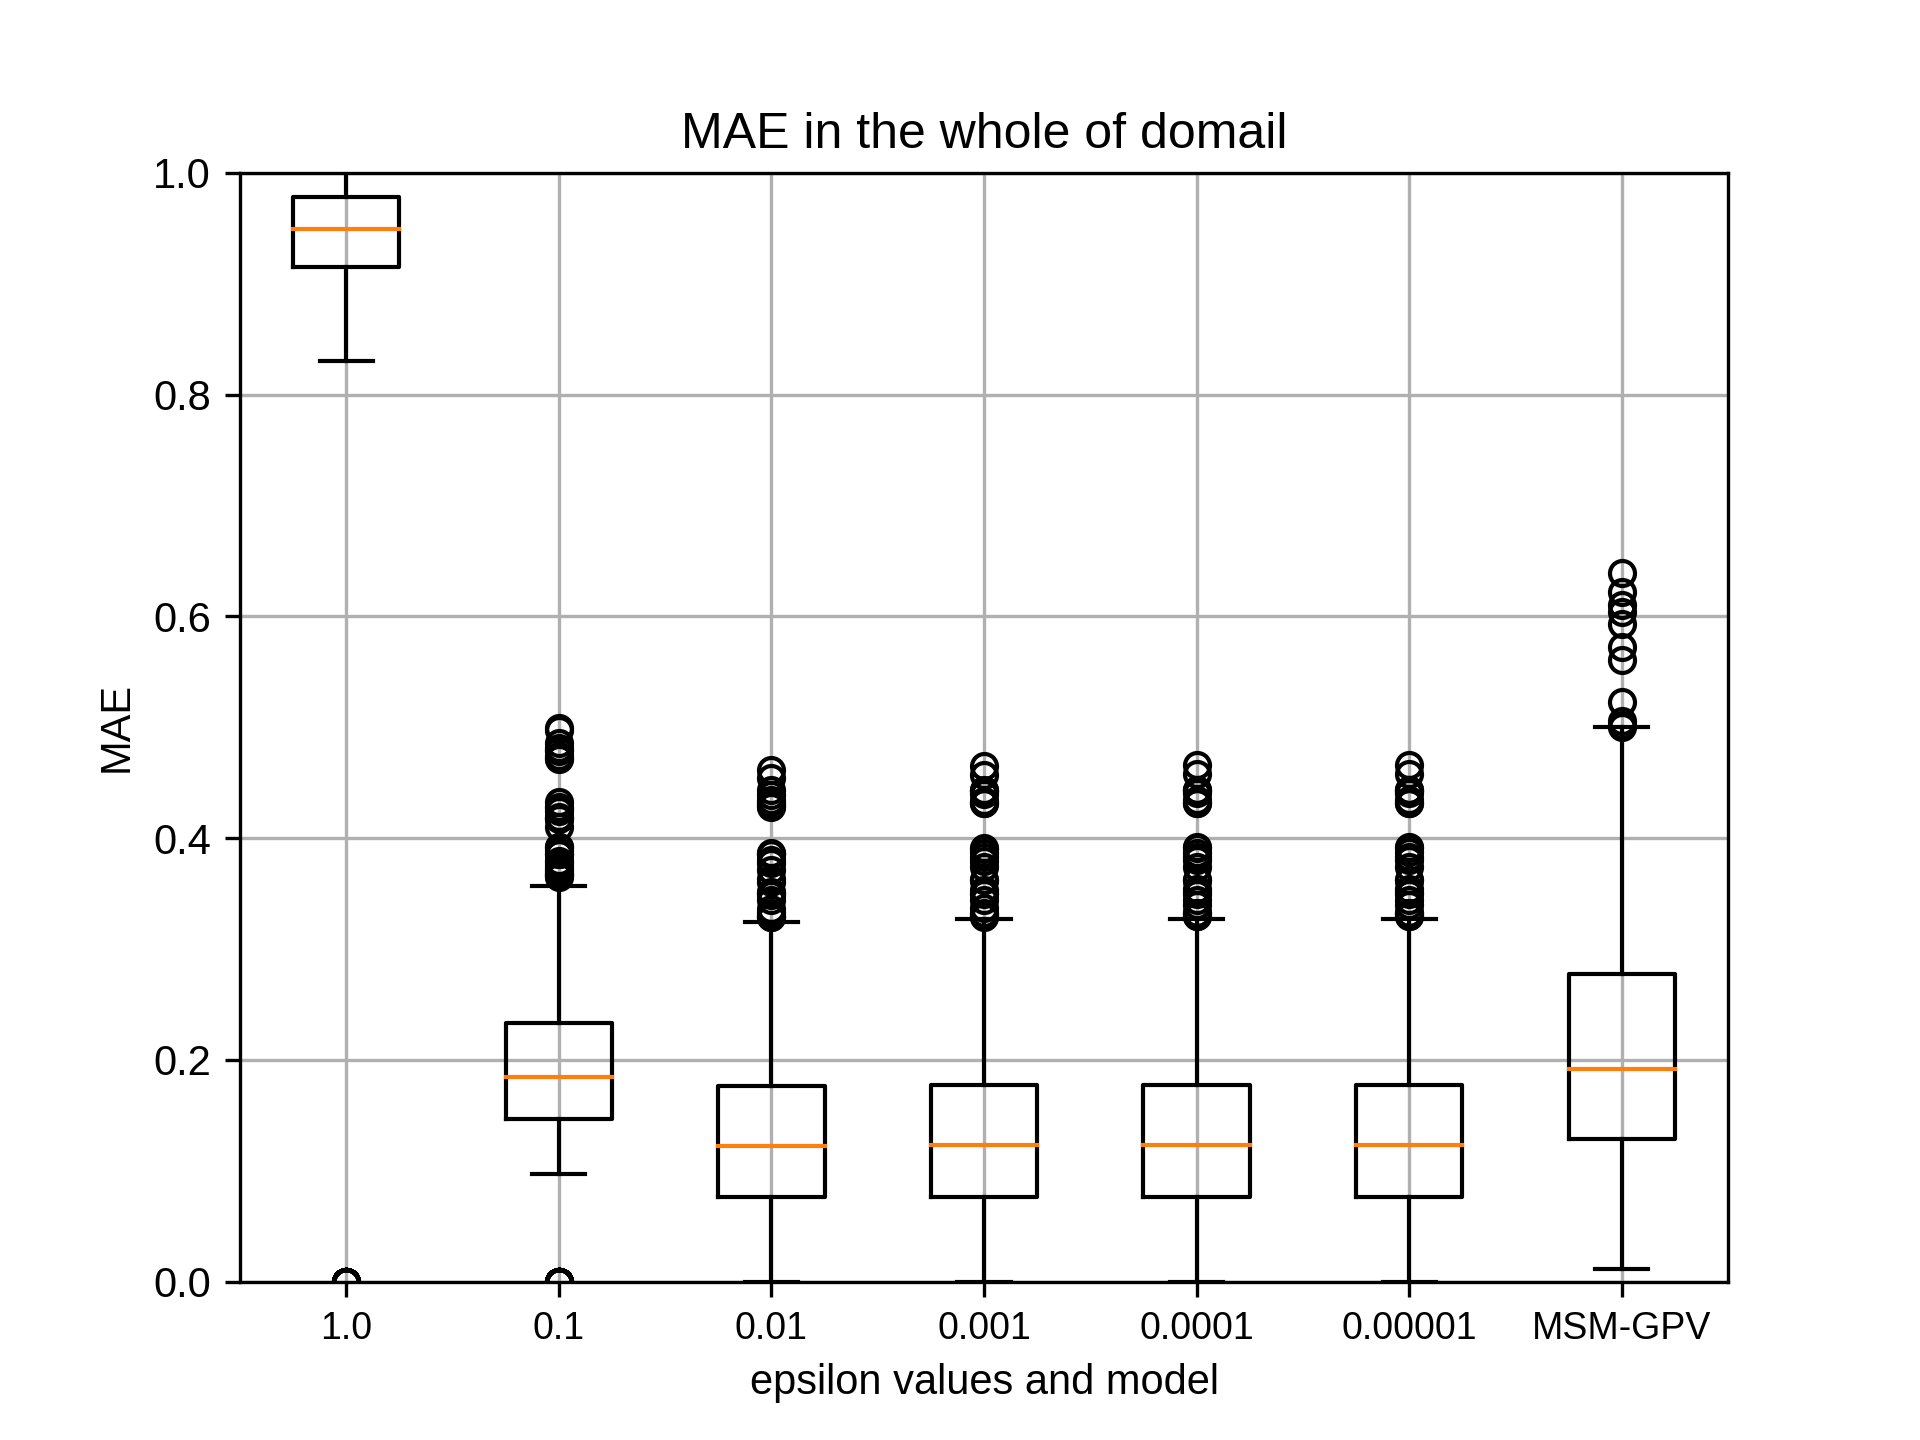
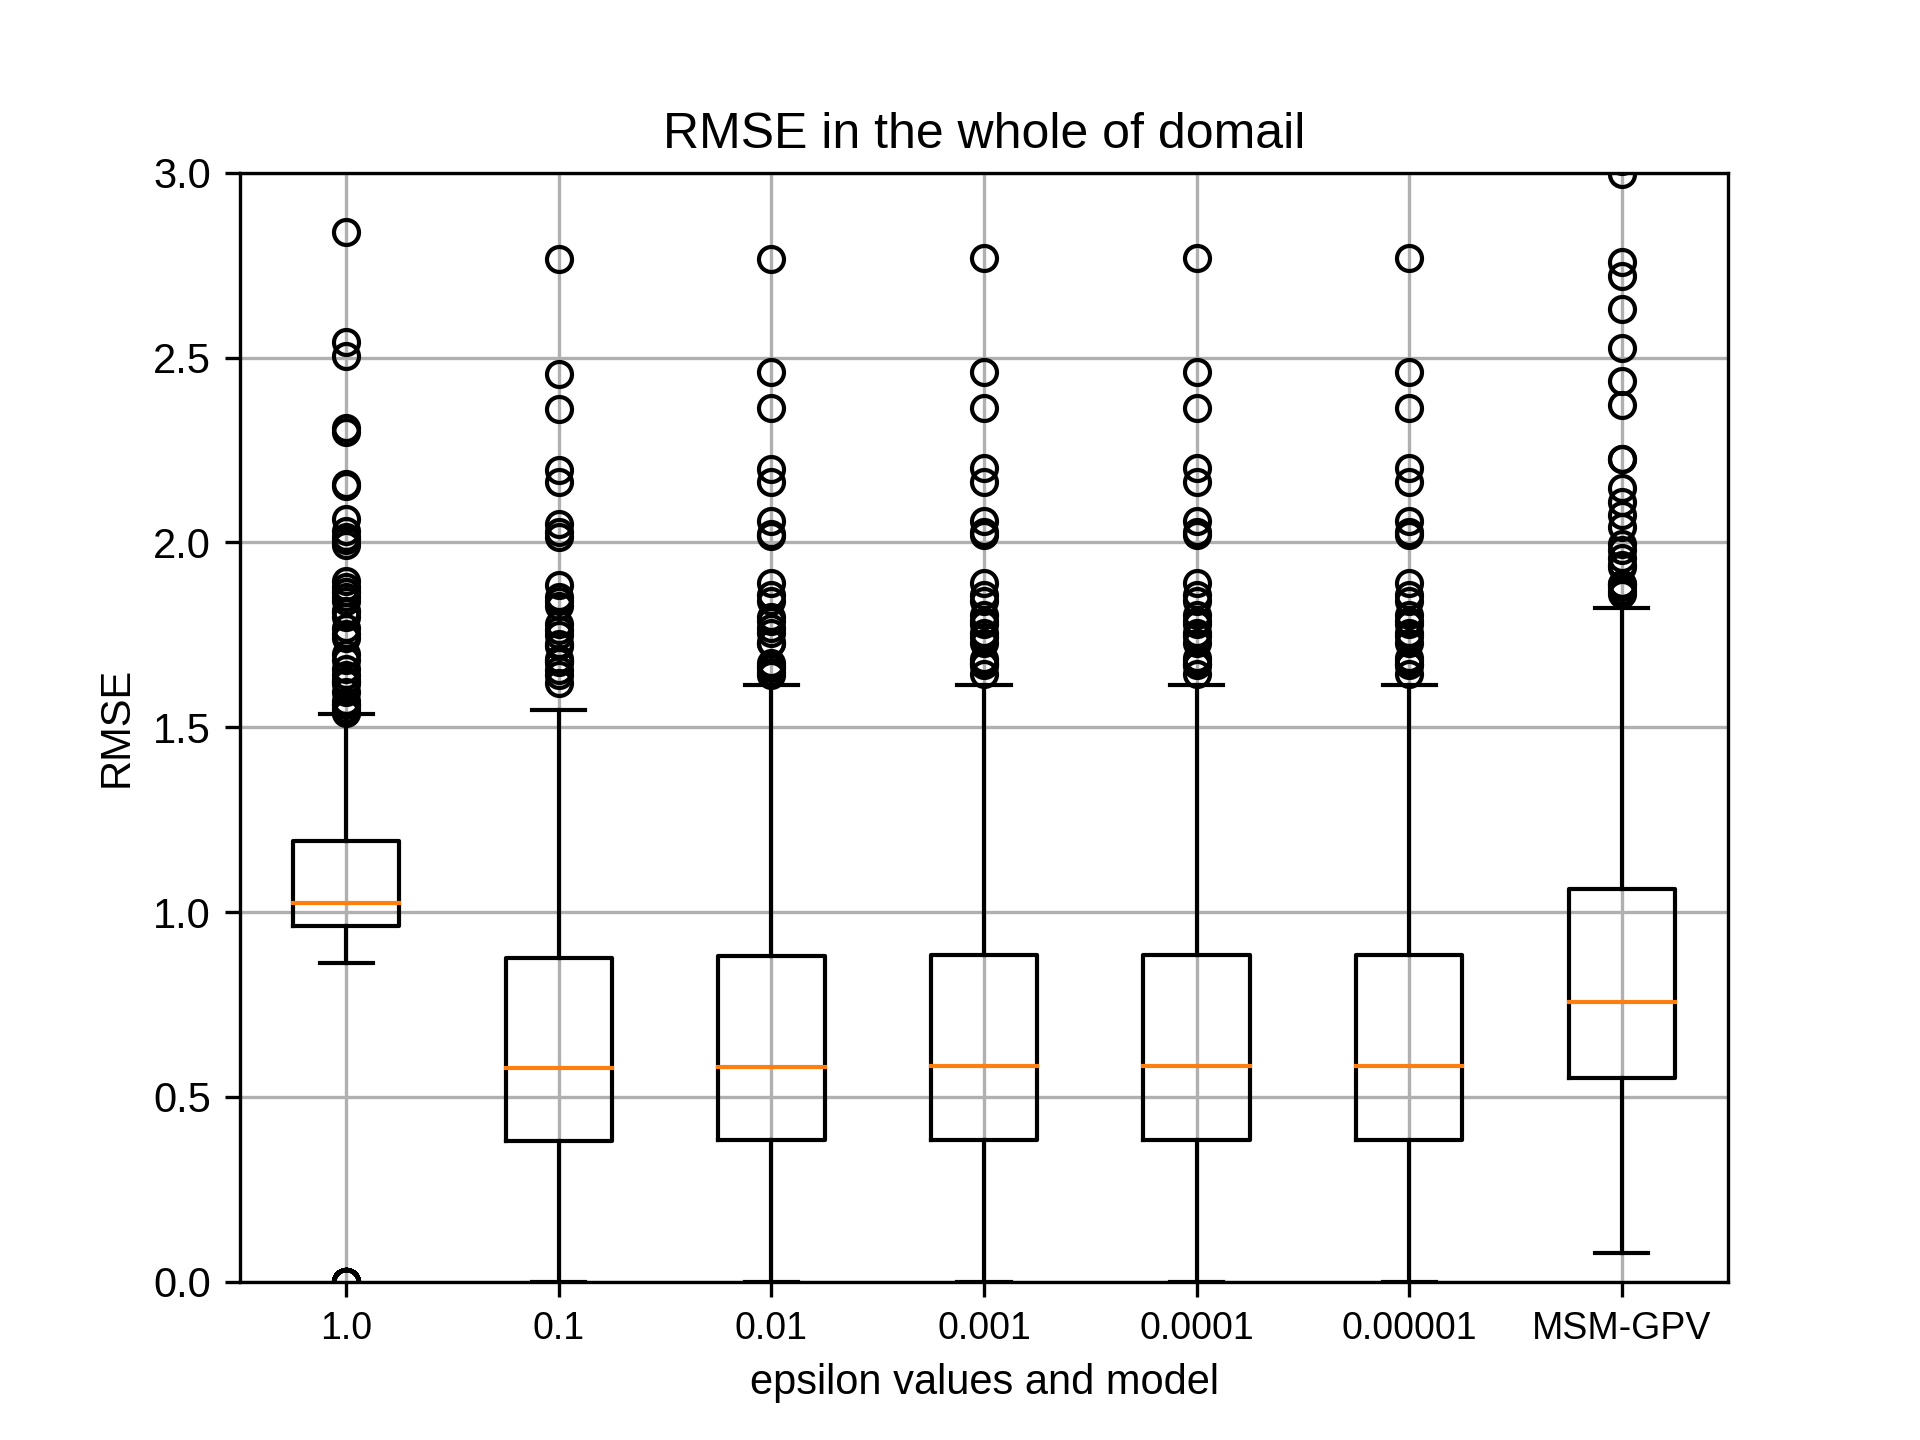
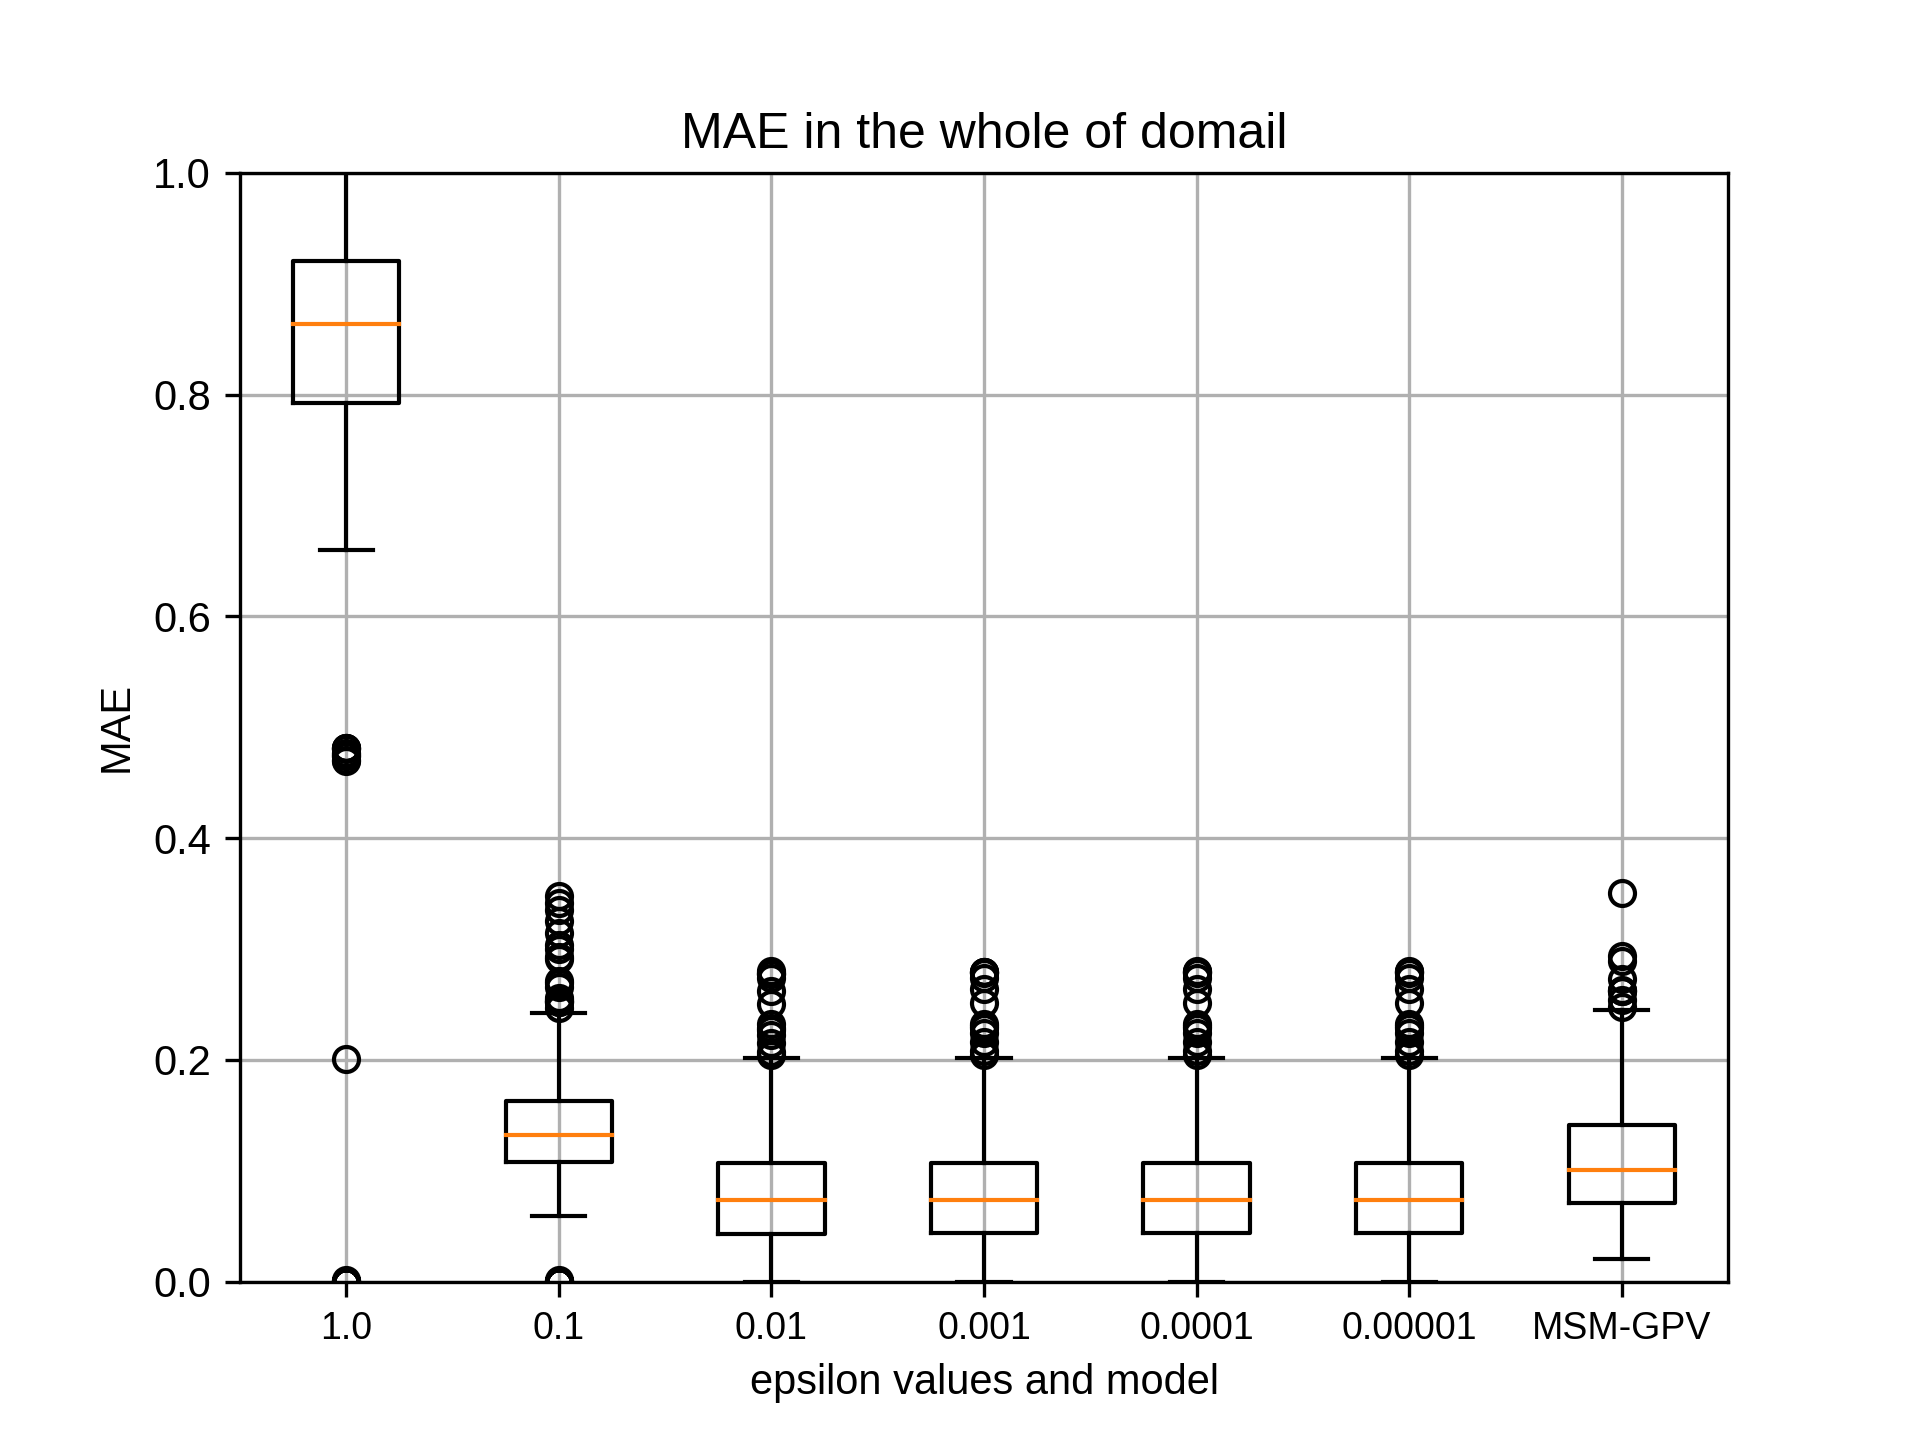
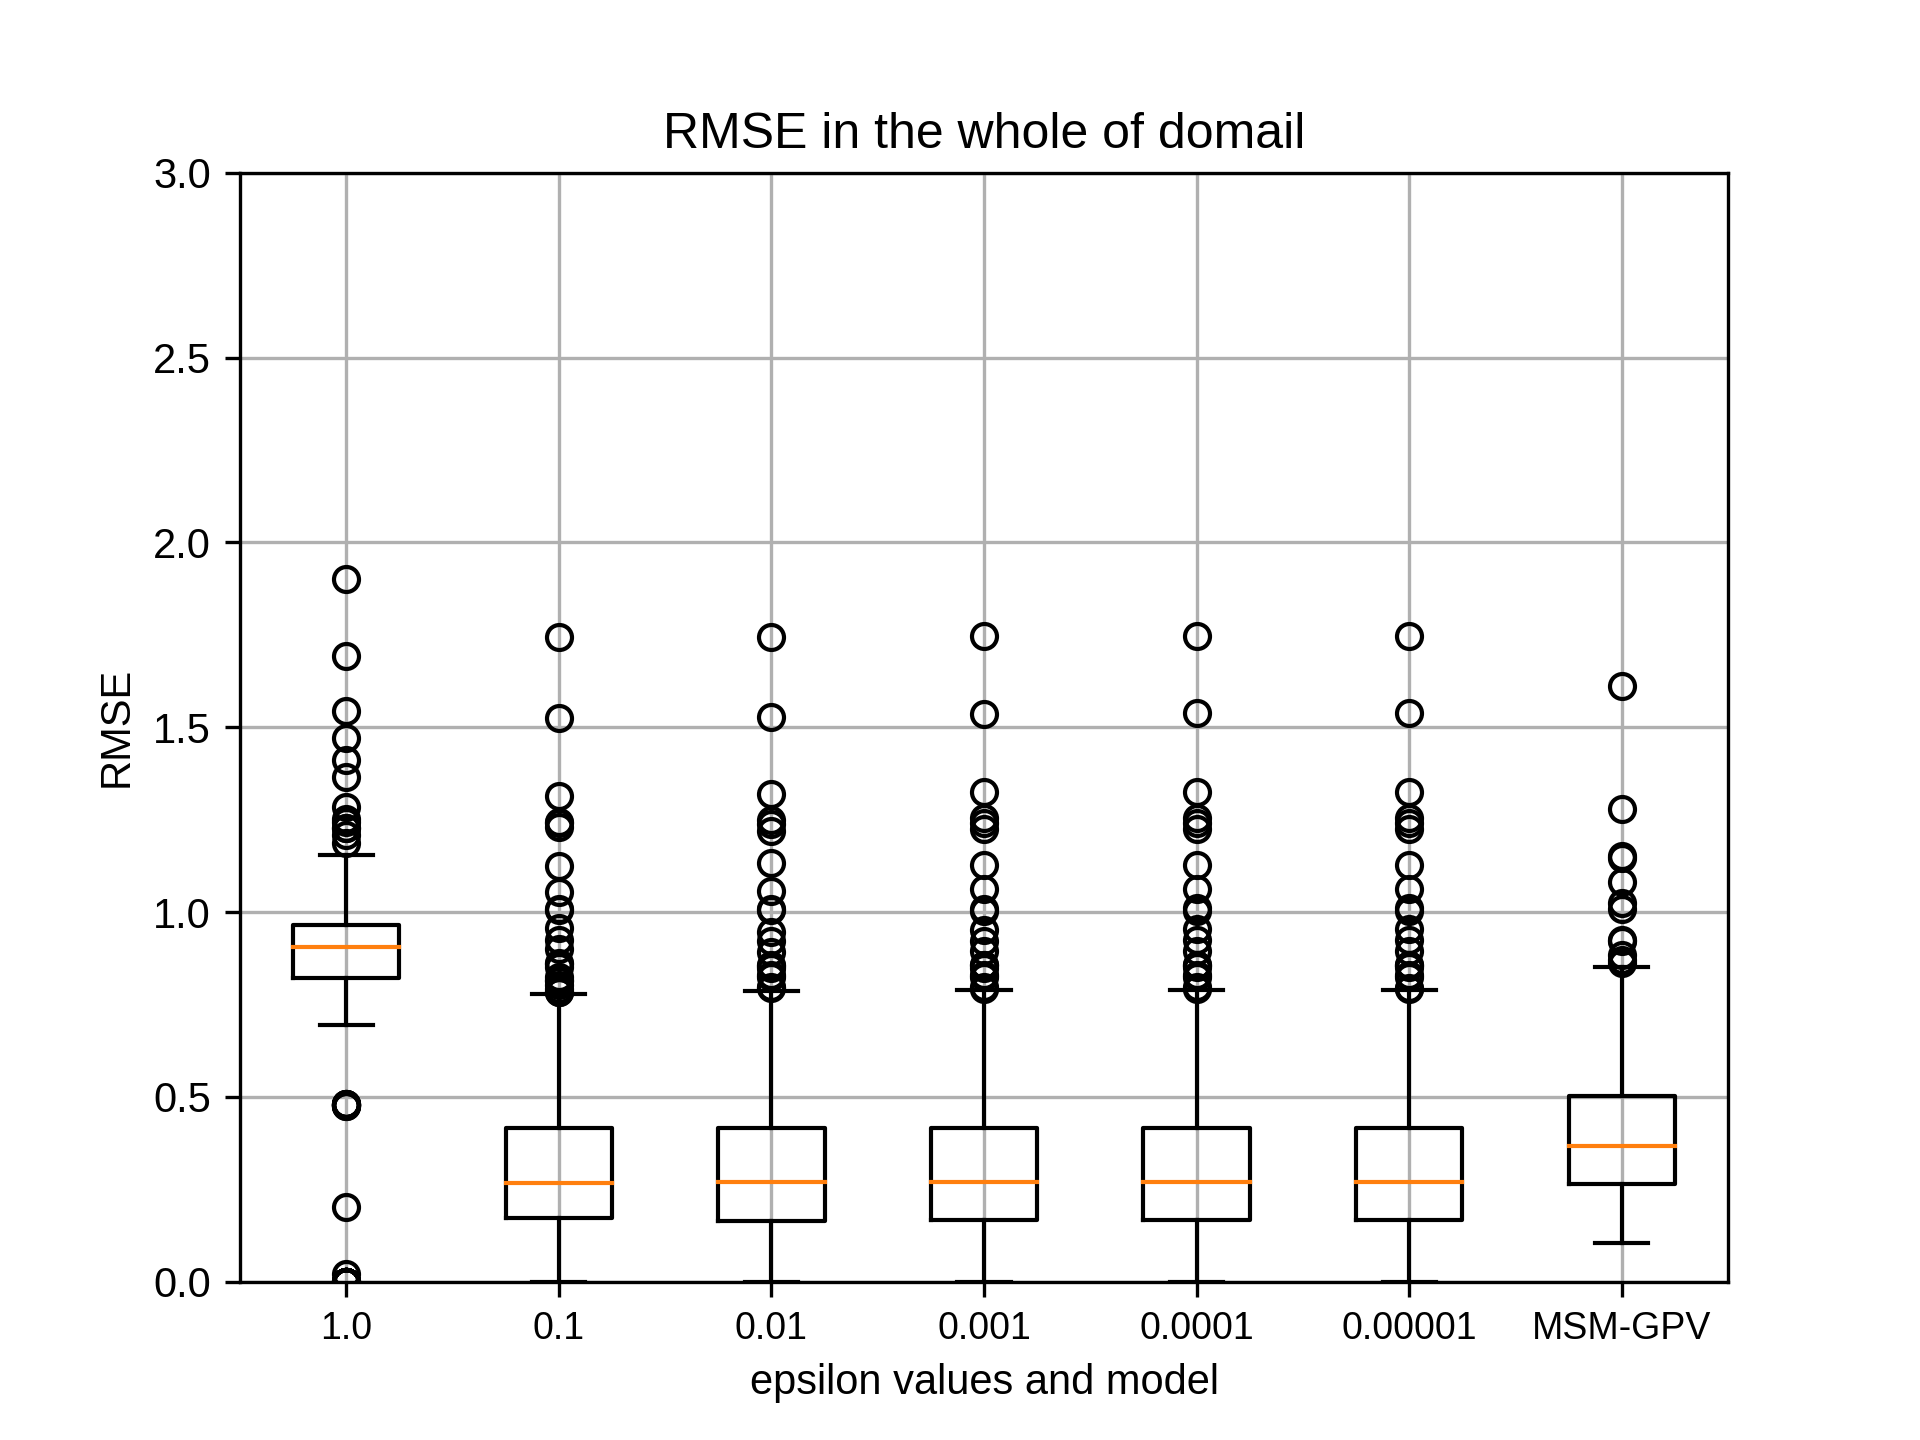
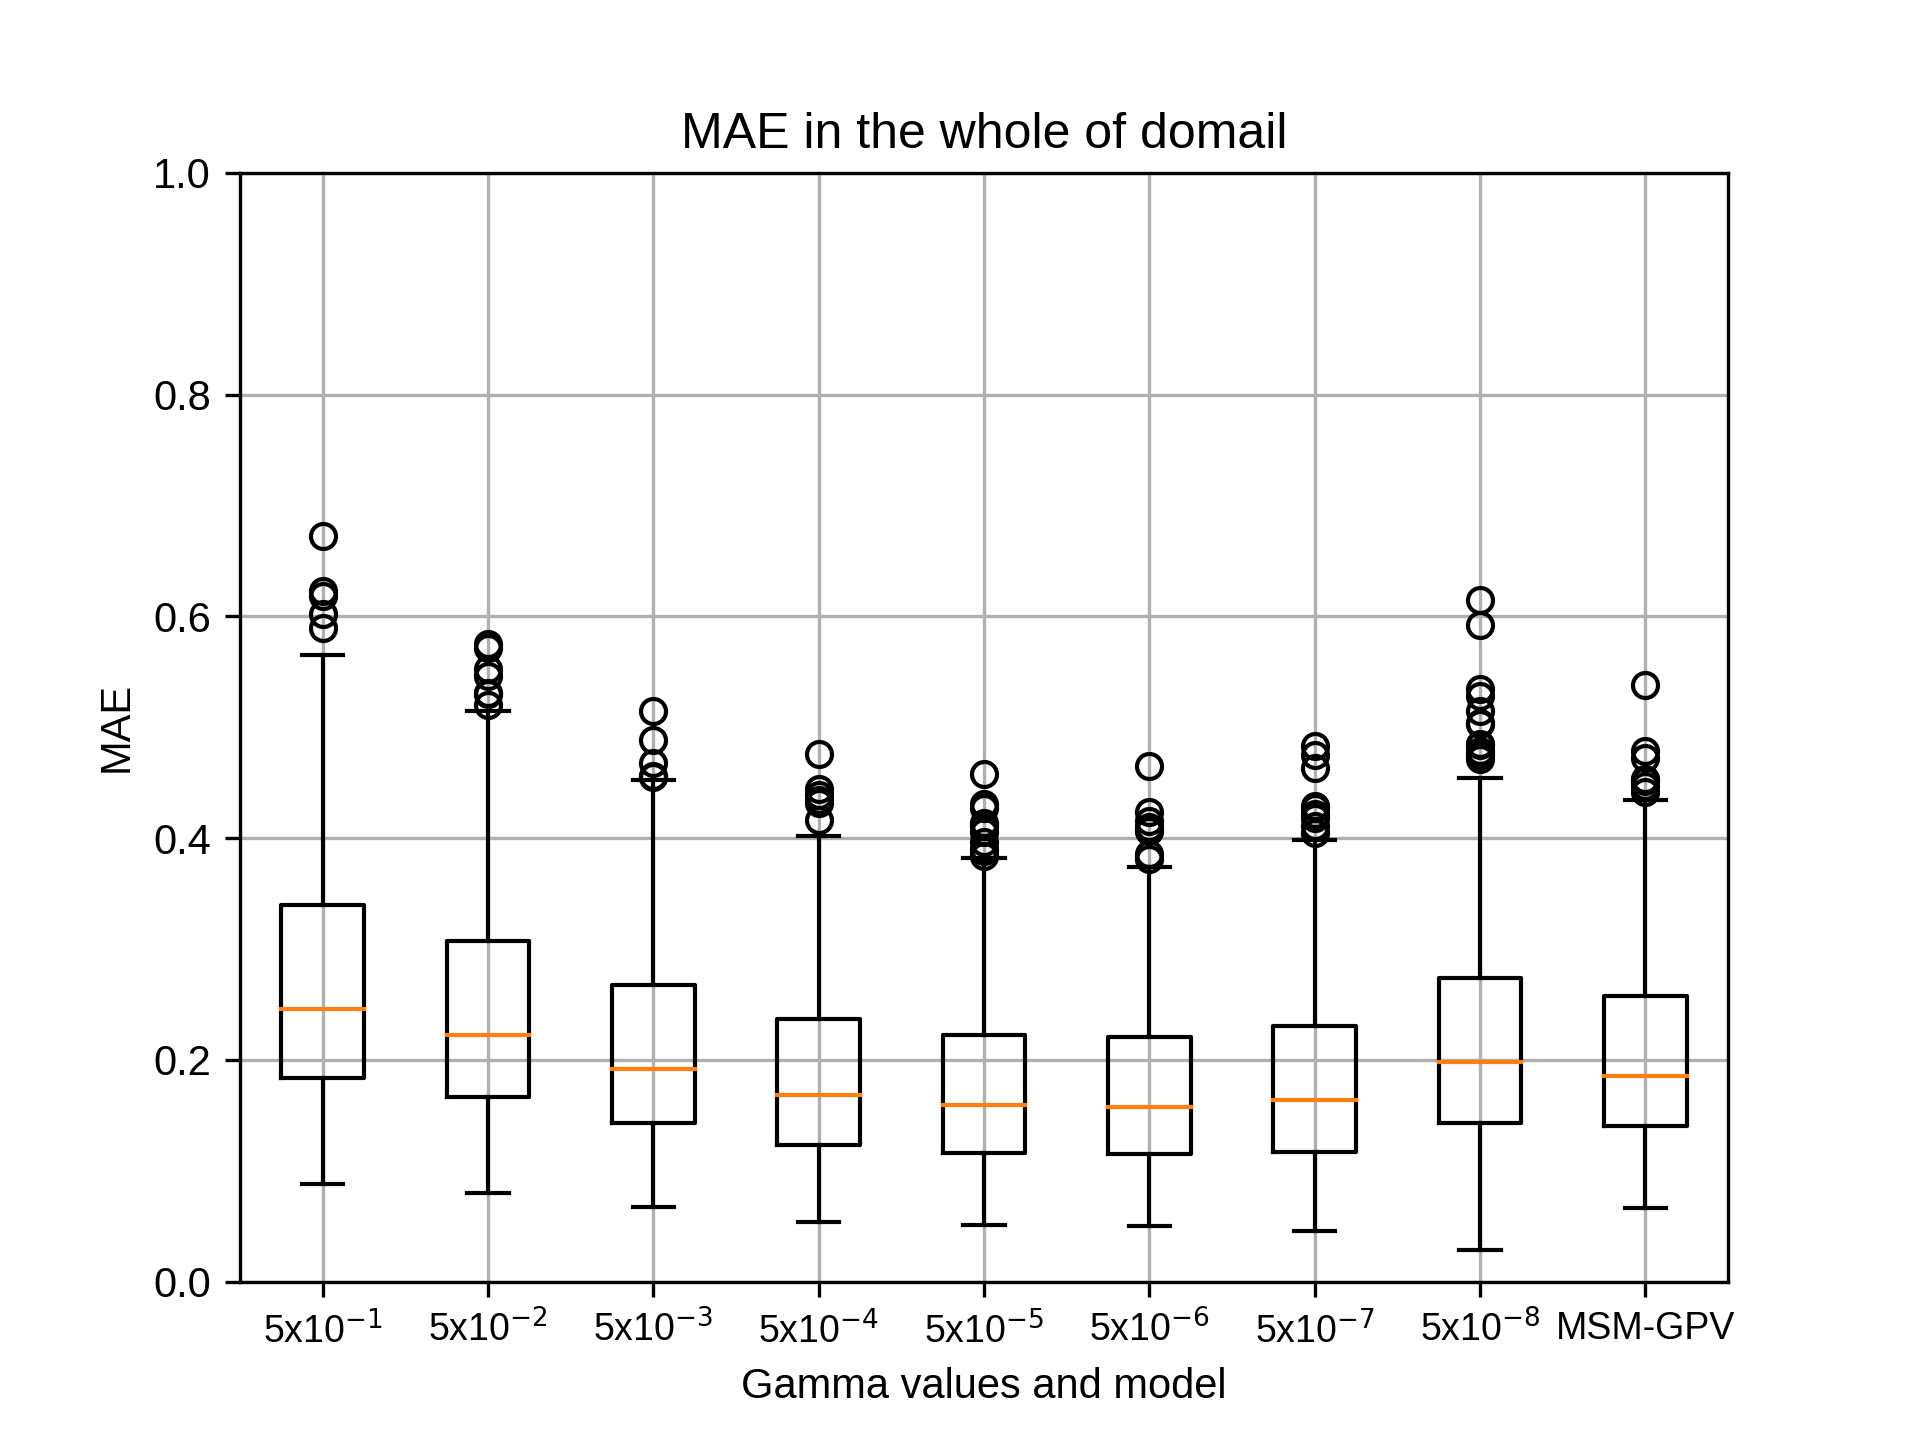
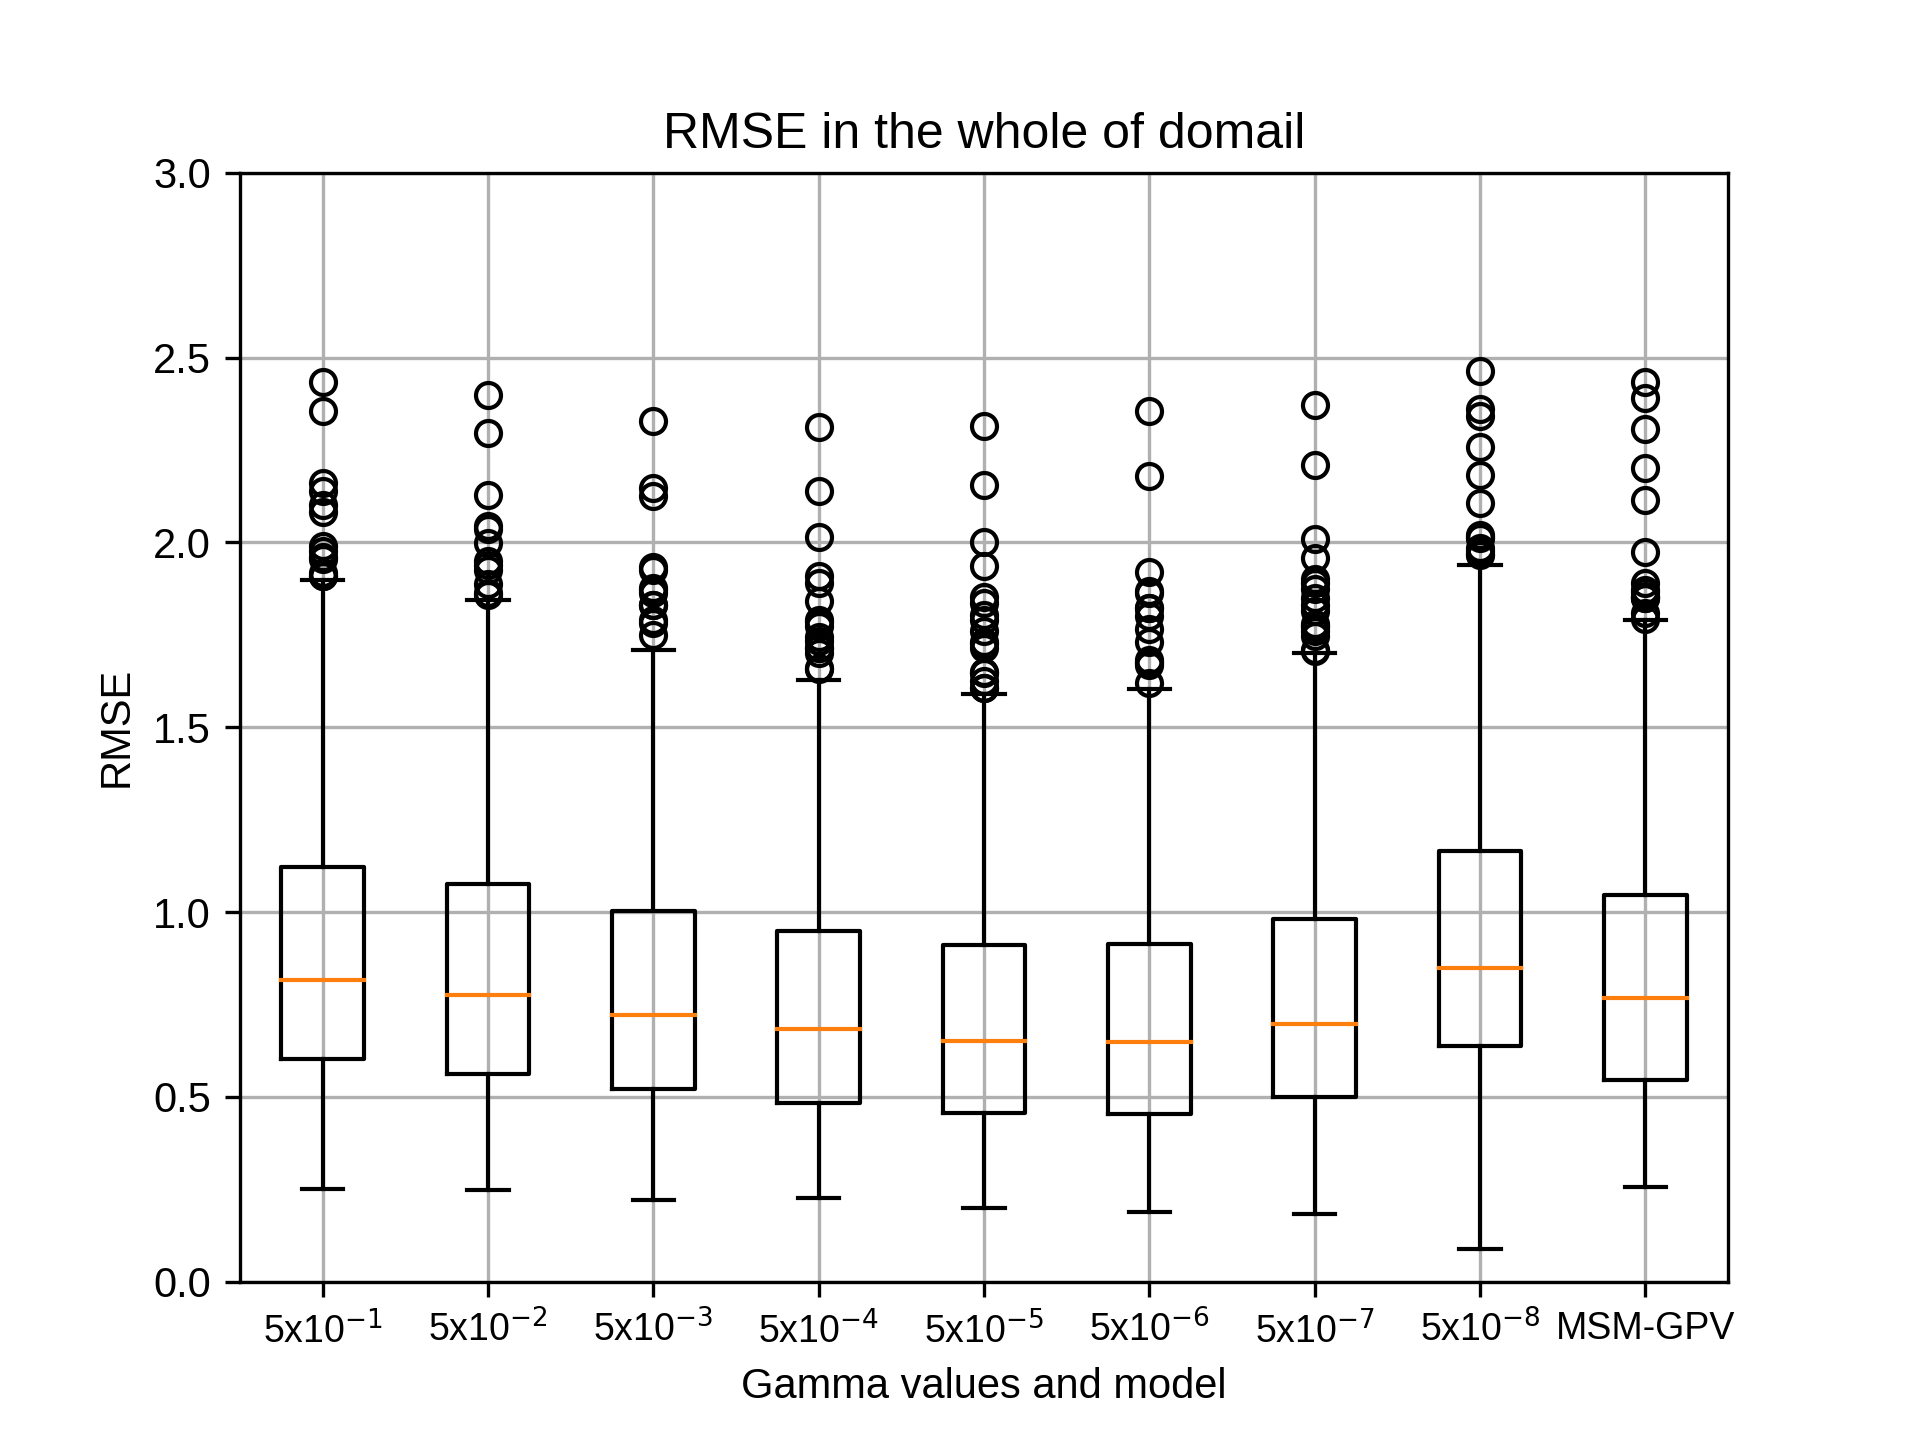
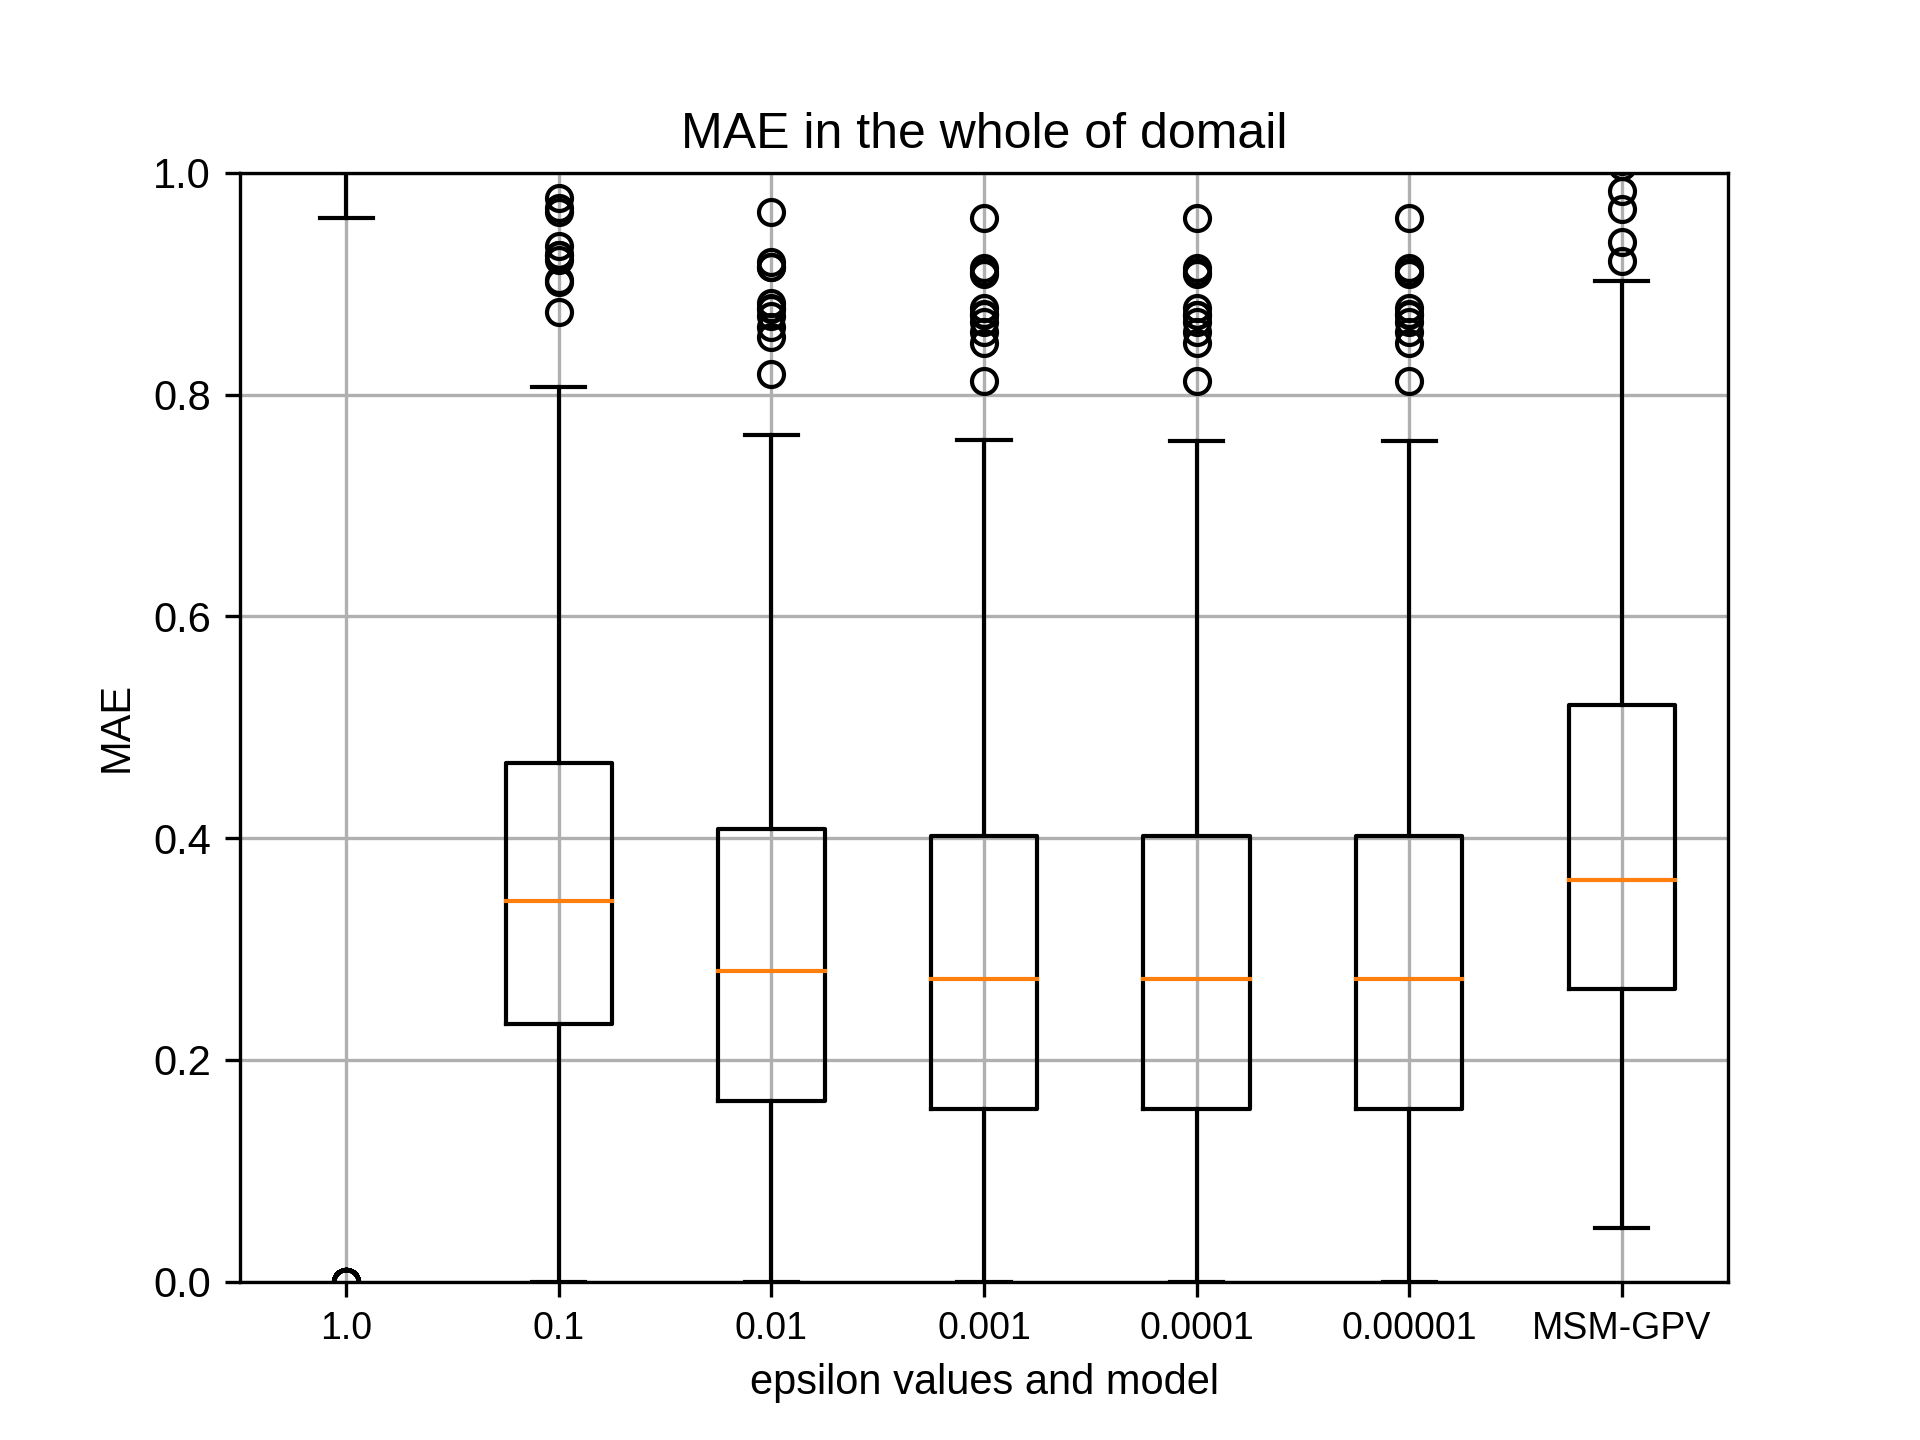
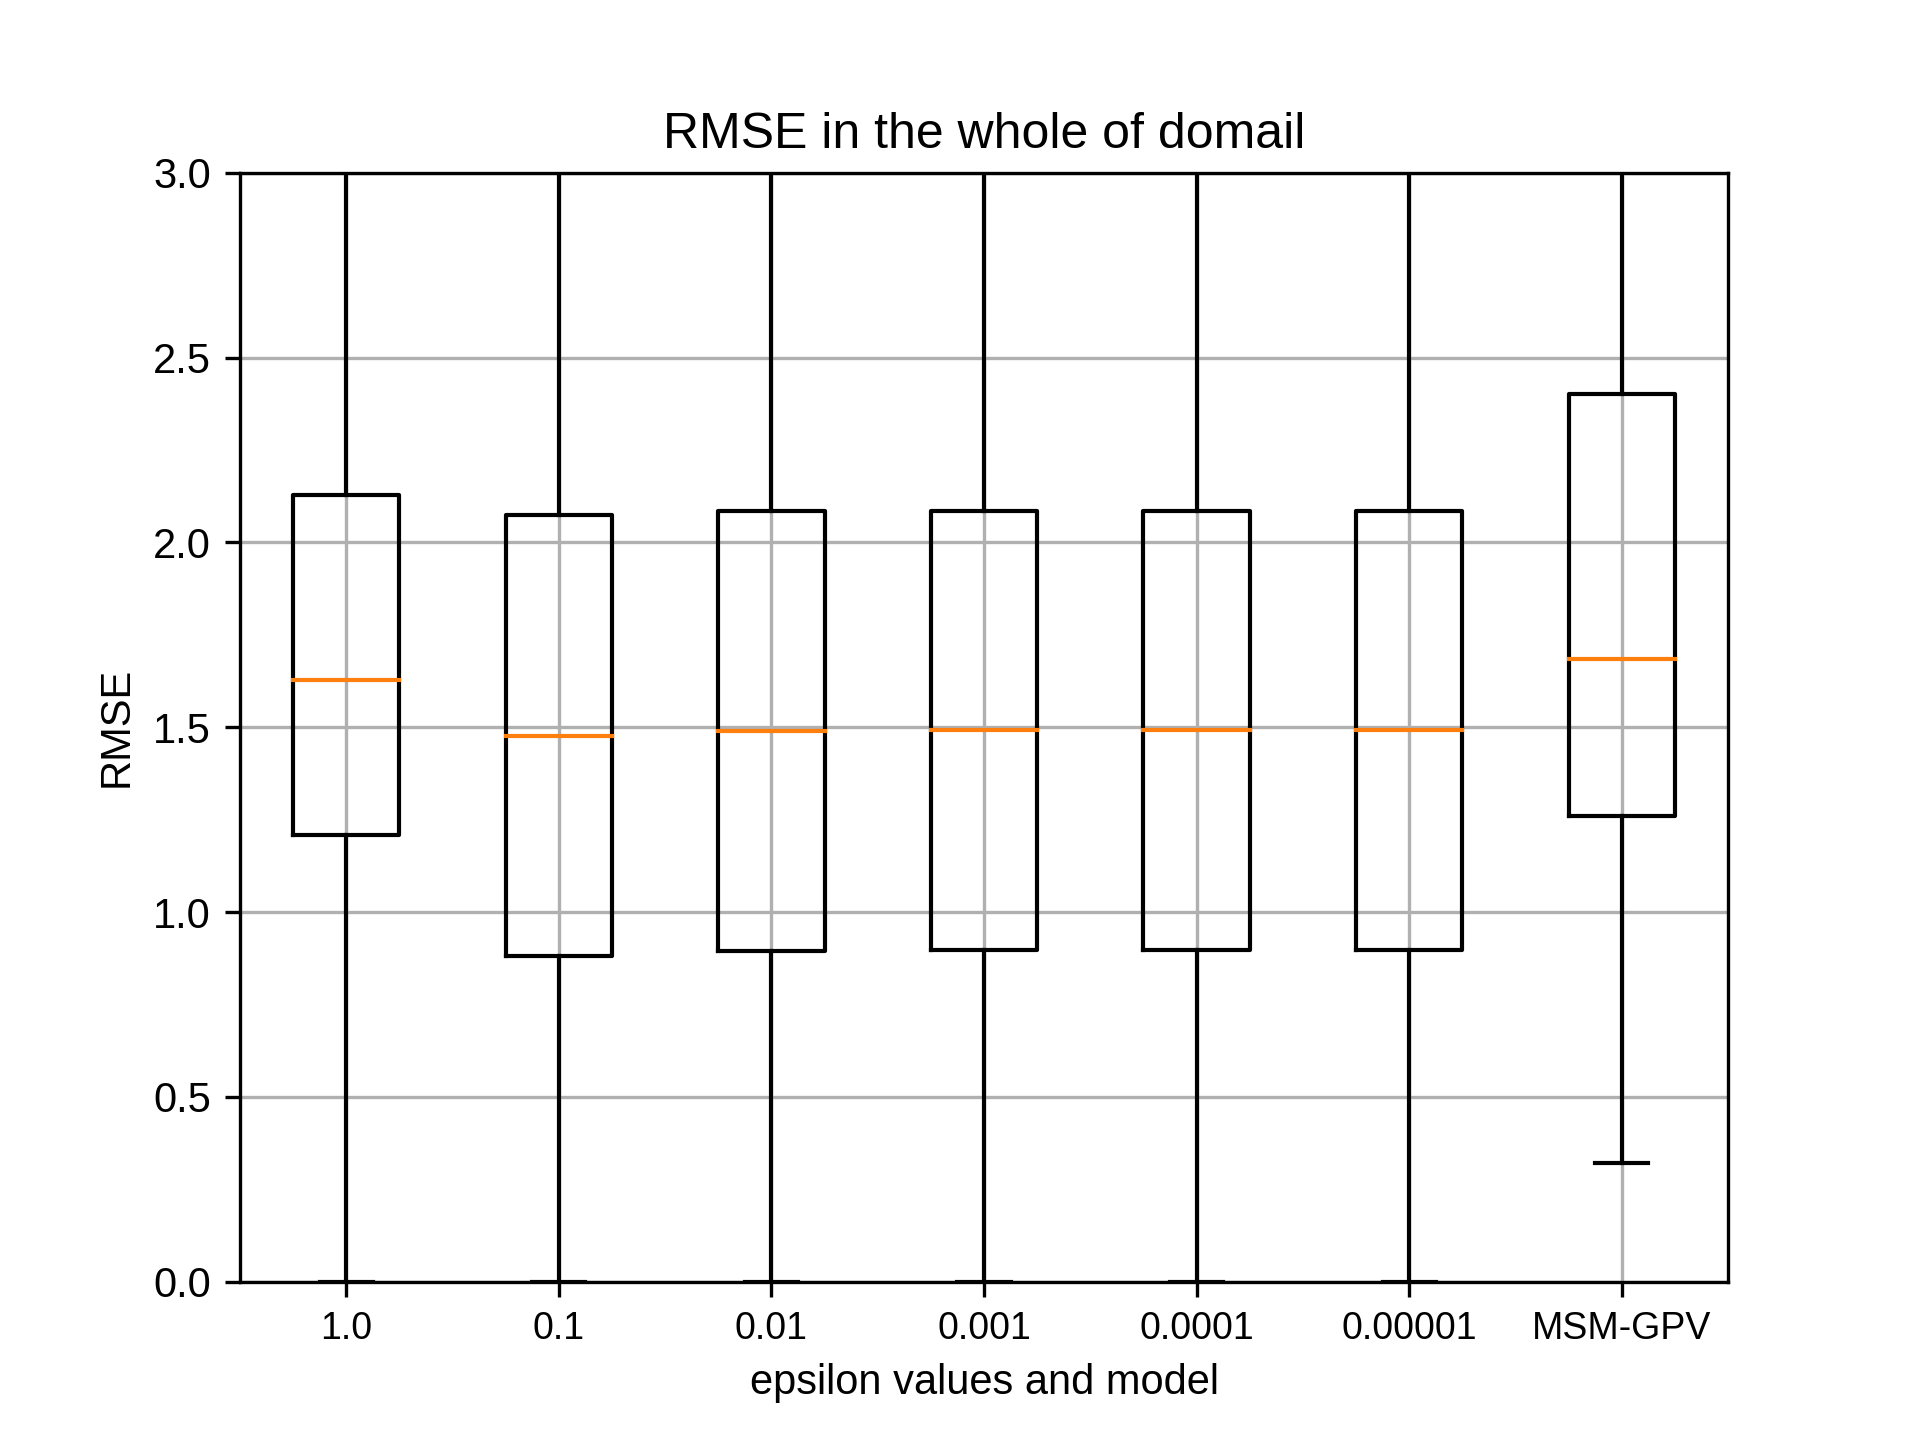
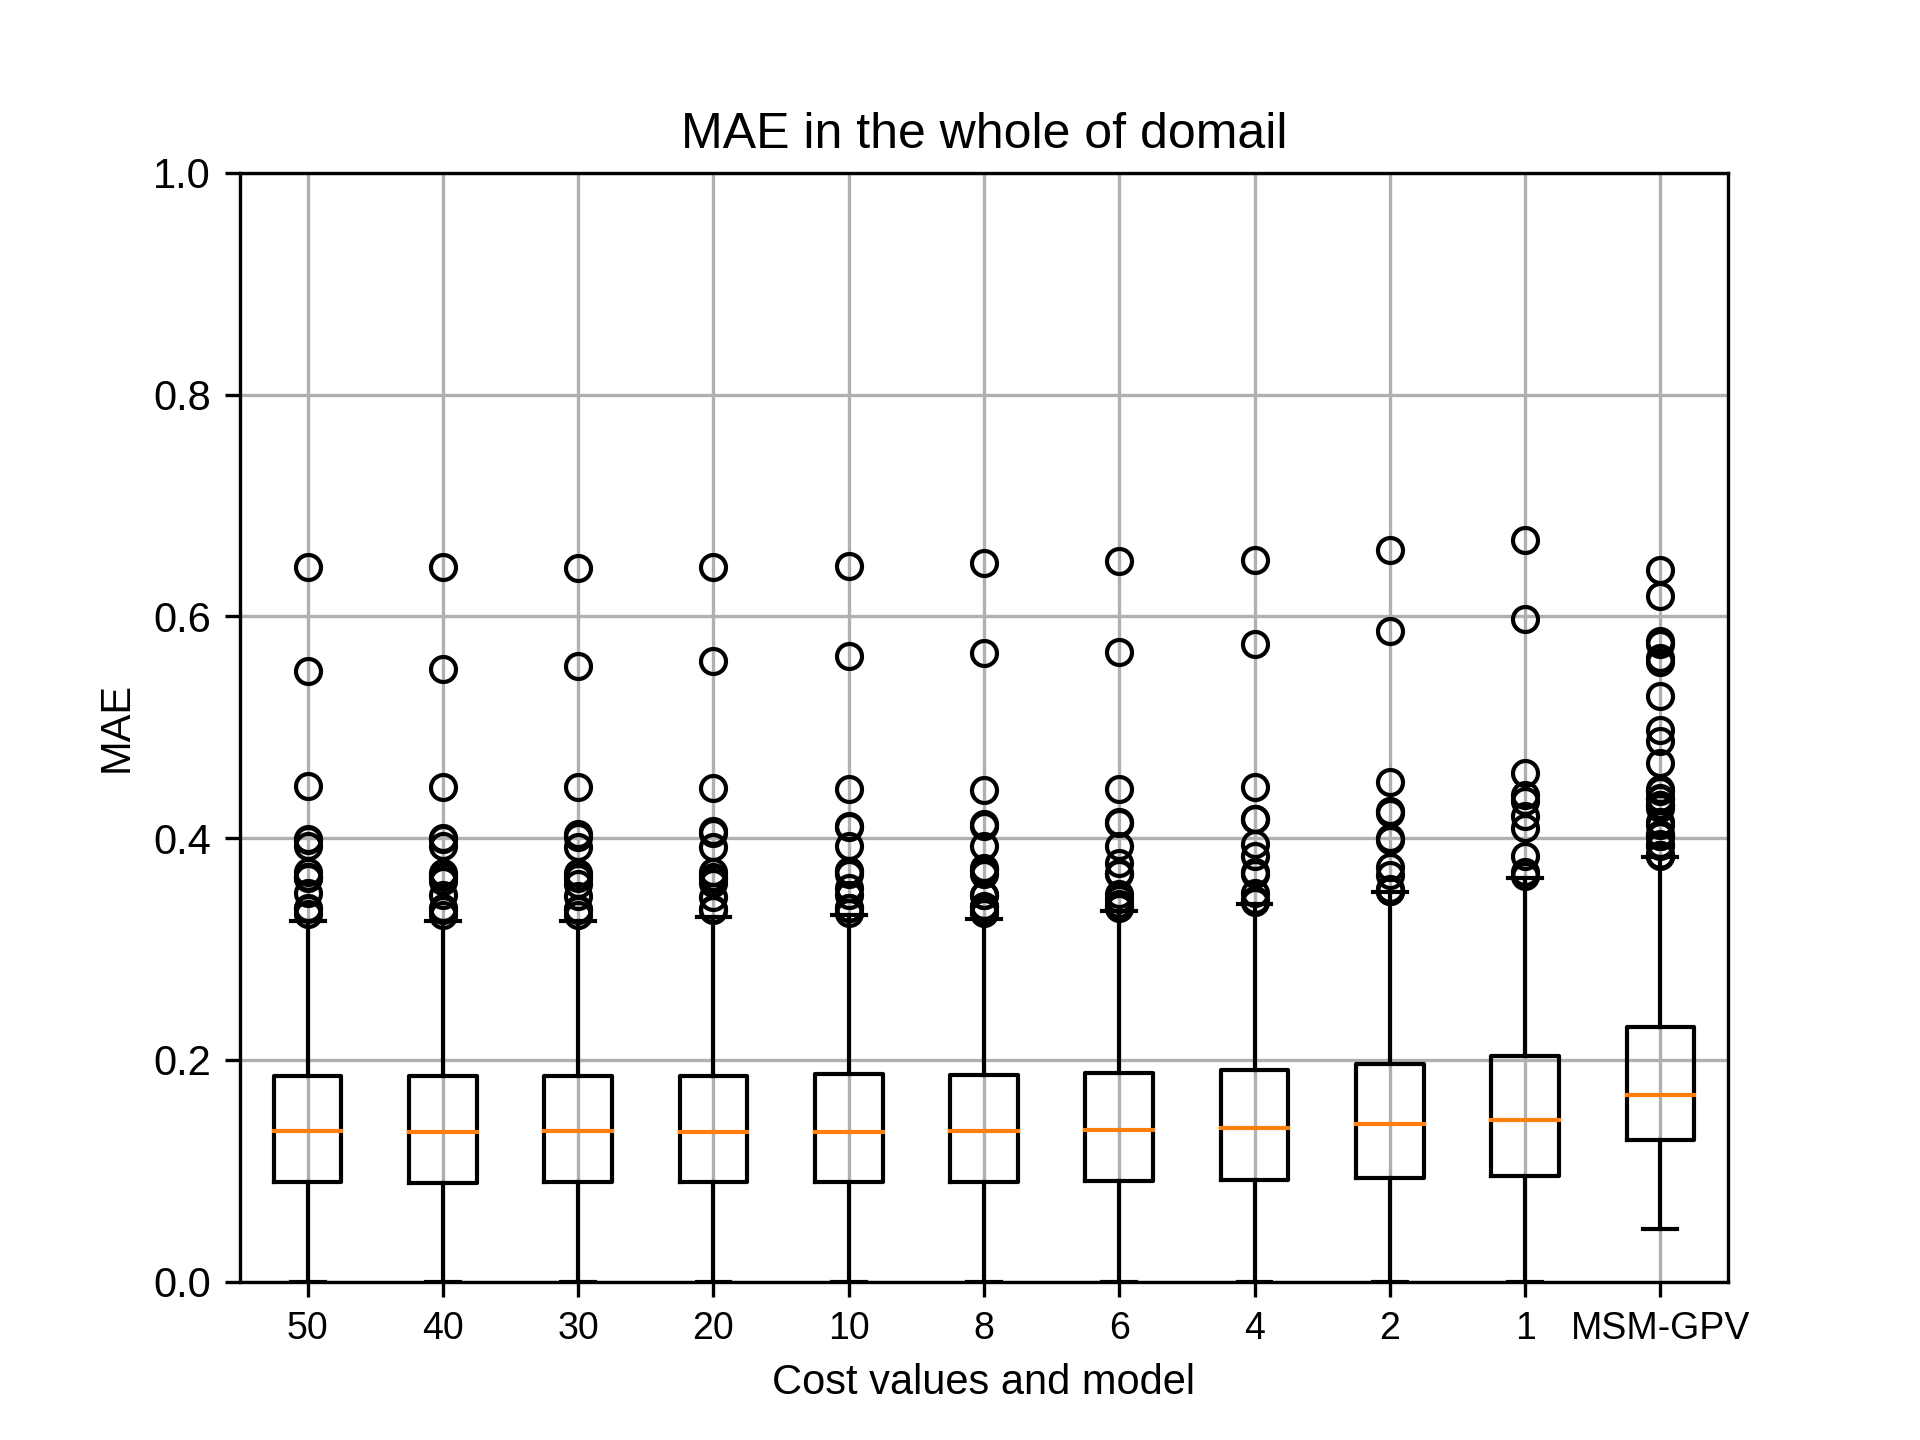
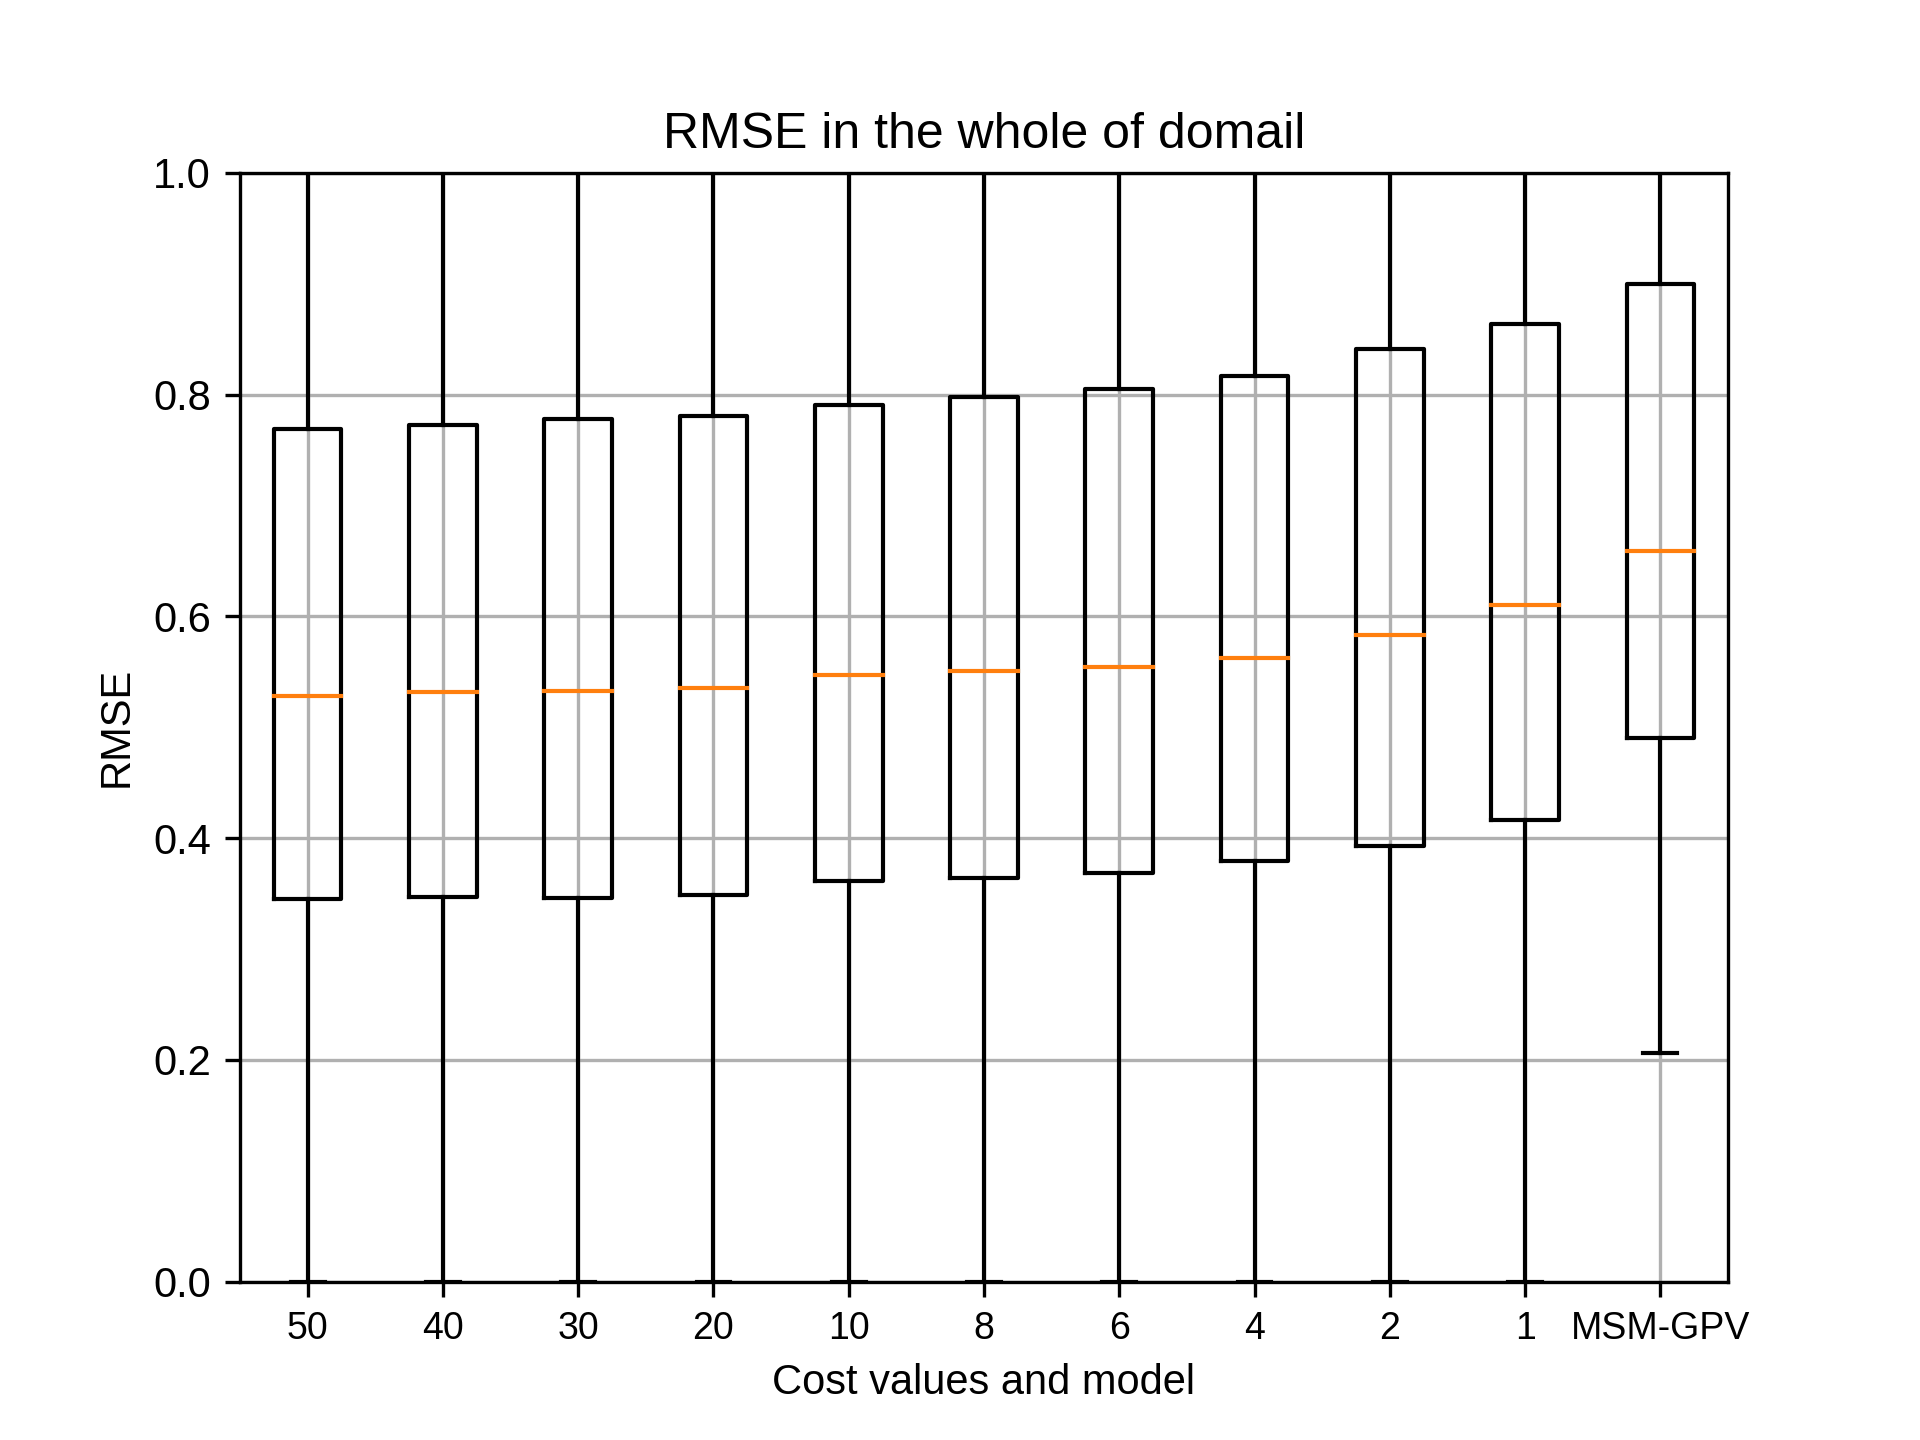
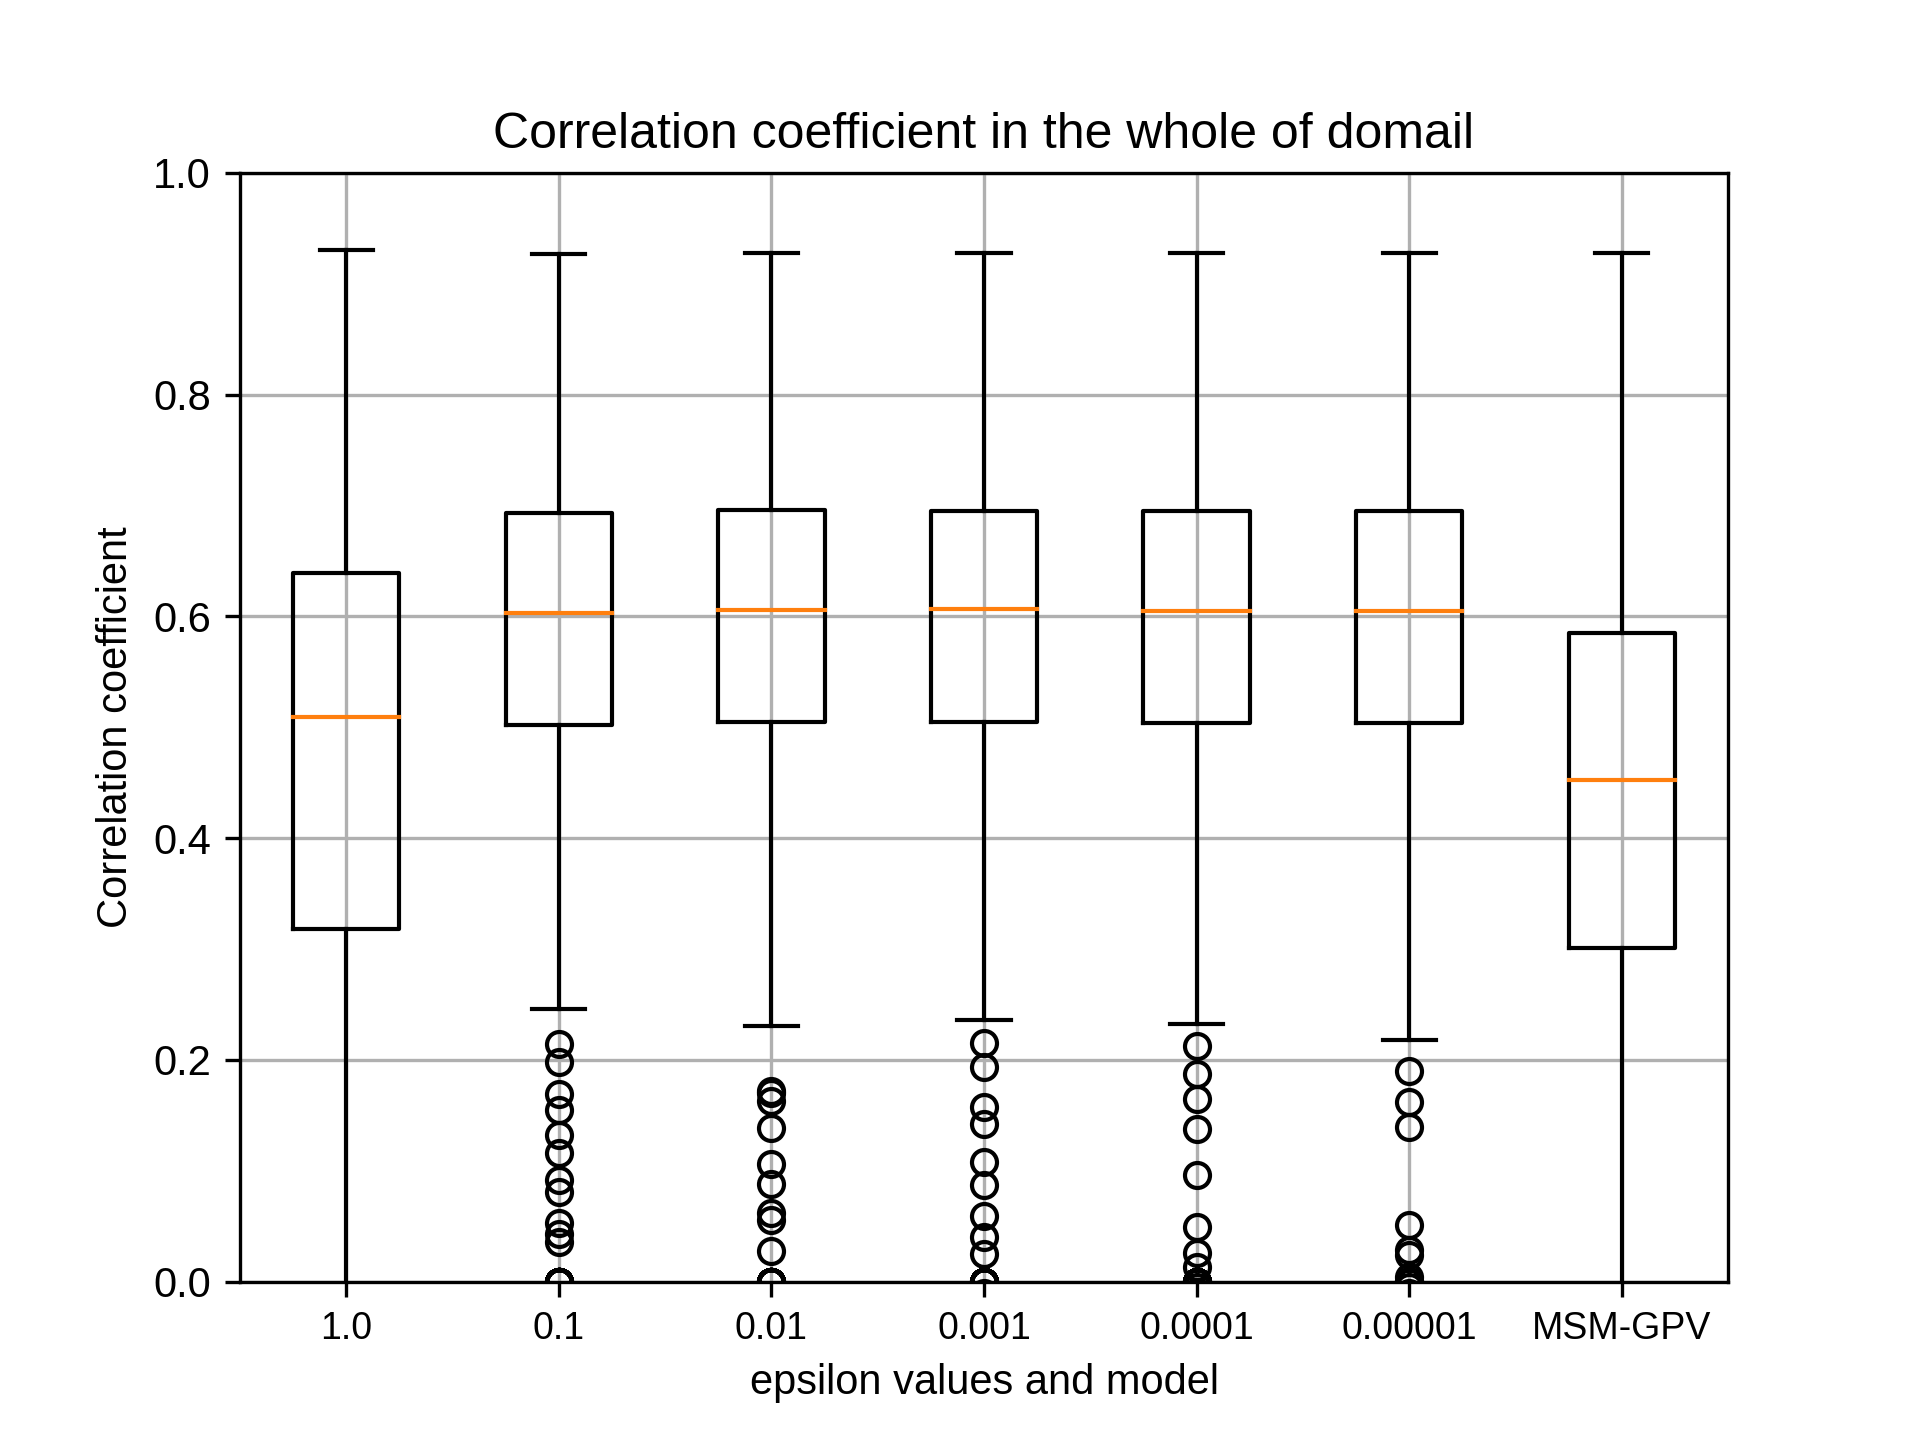
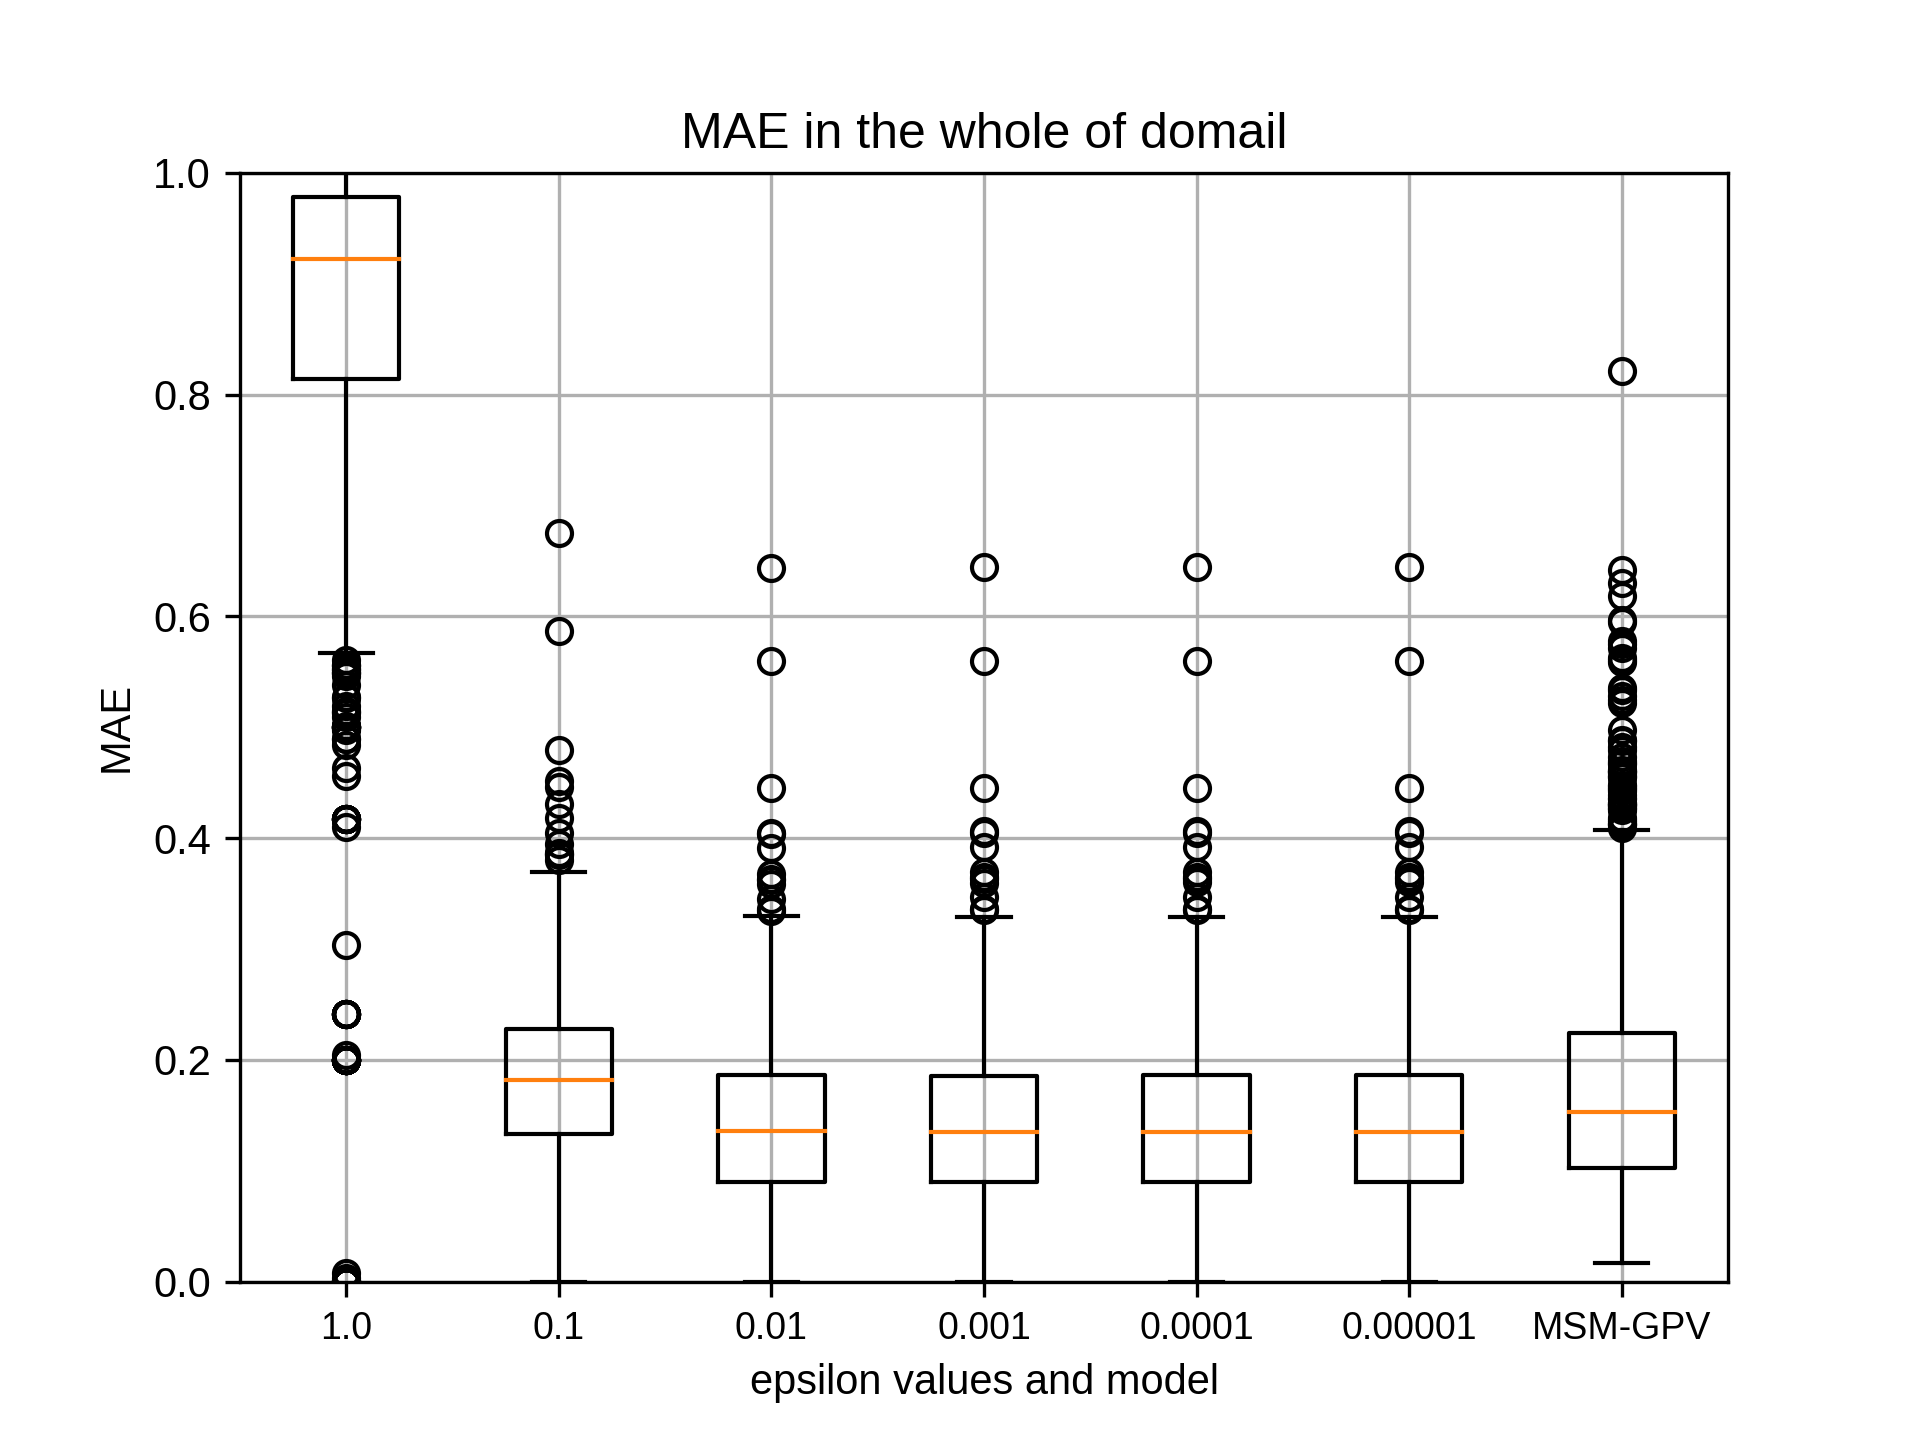
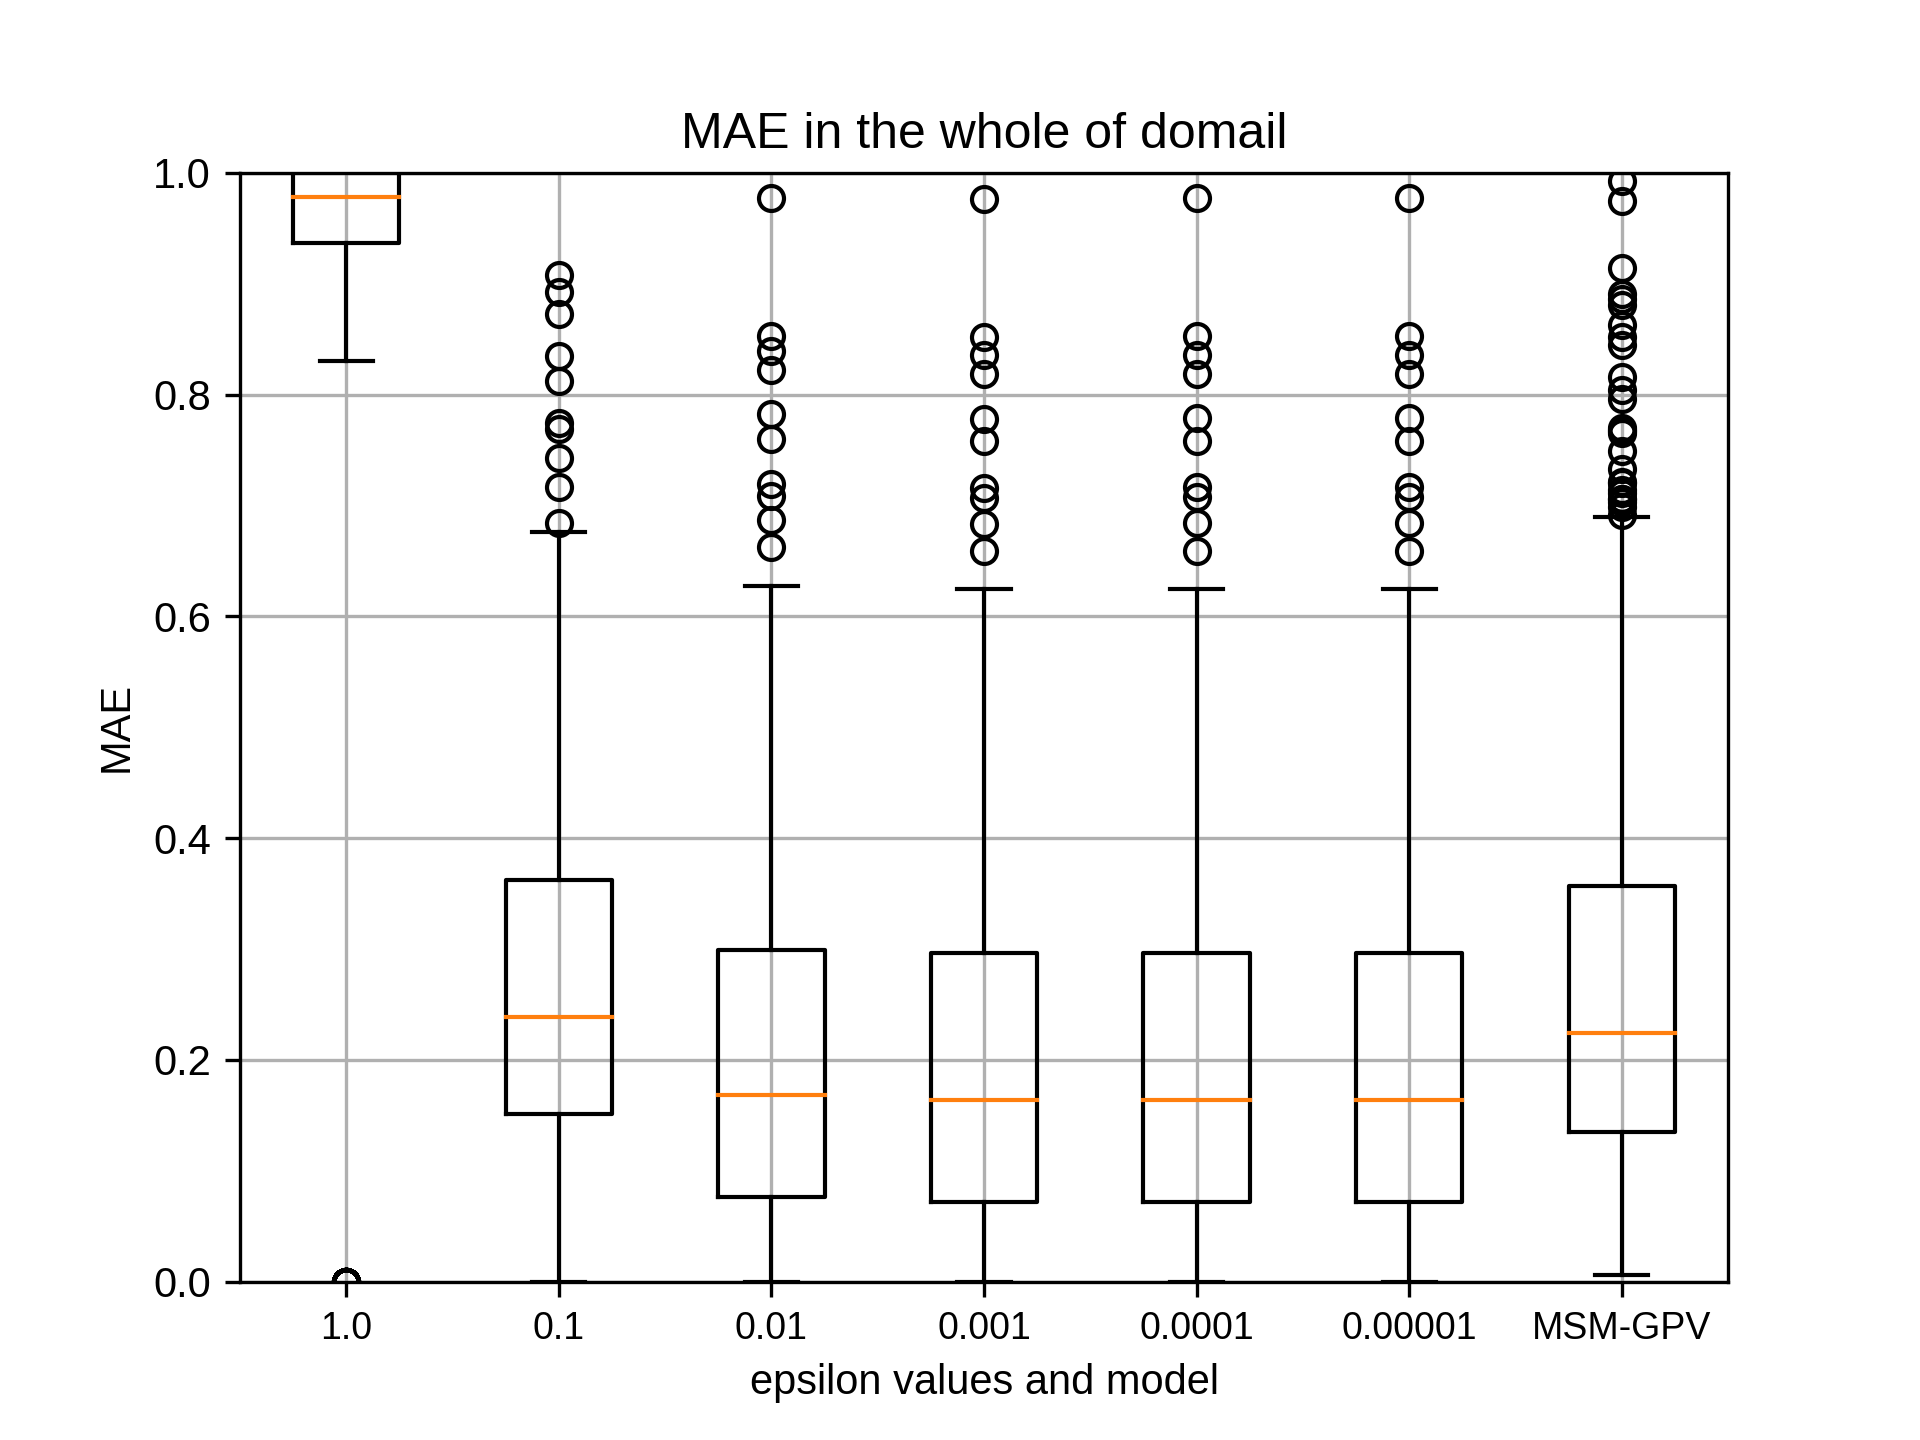
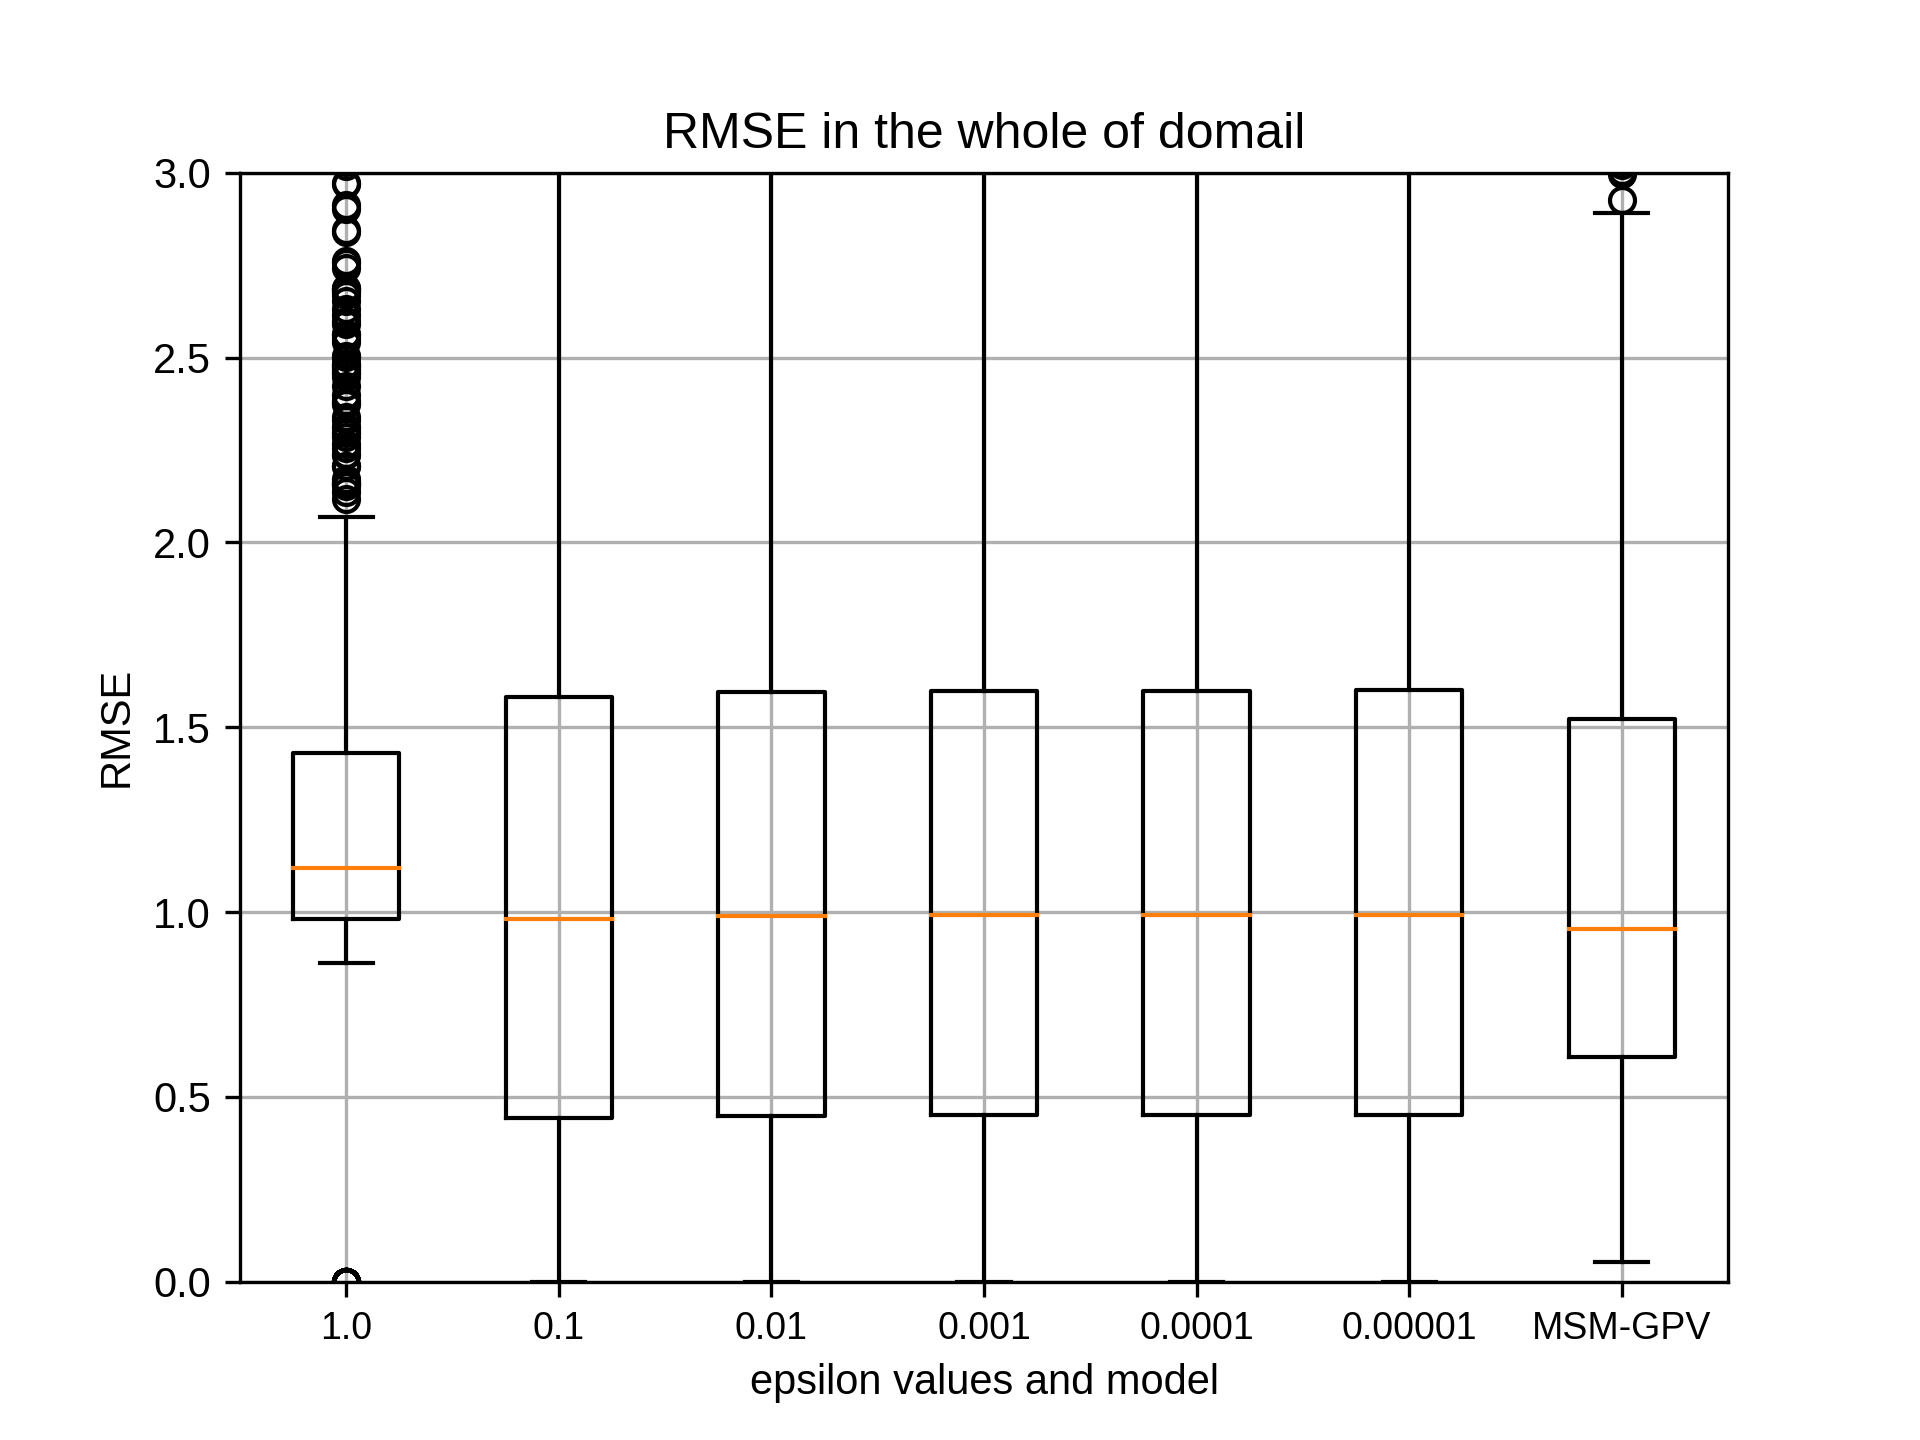
epsilonは変化させても相関係数の中央値はほとんど変わりませんでした。
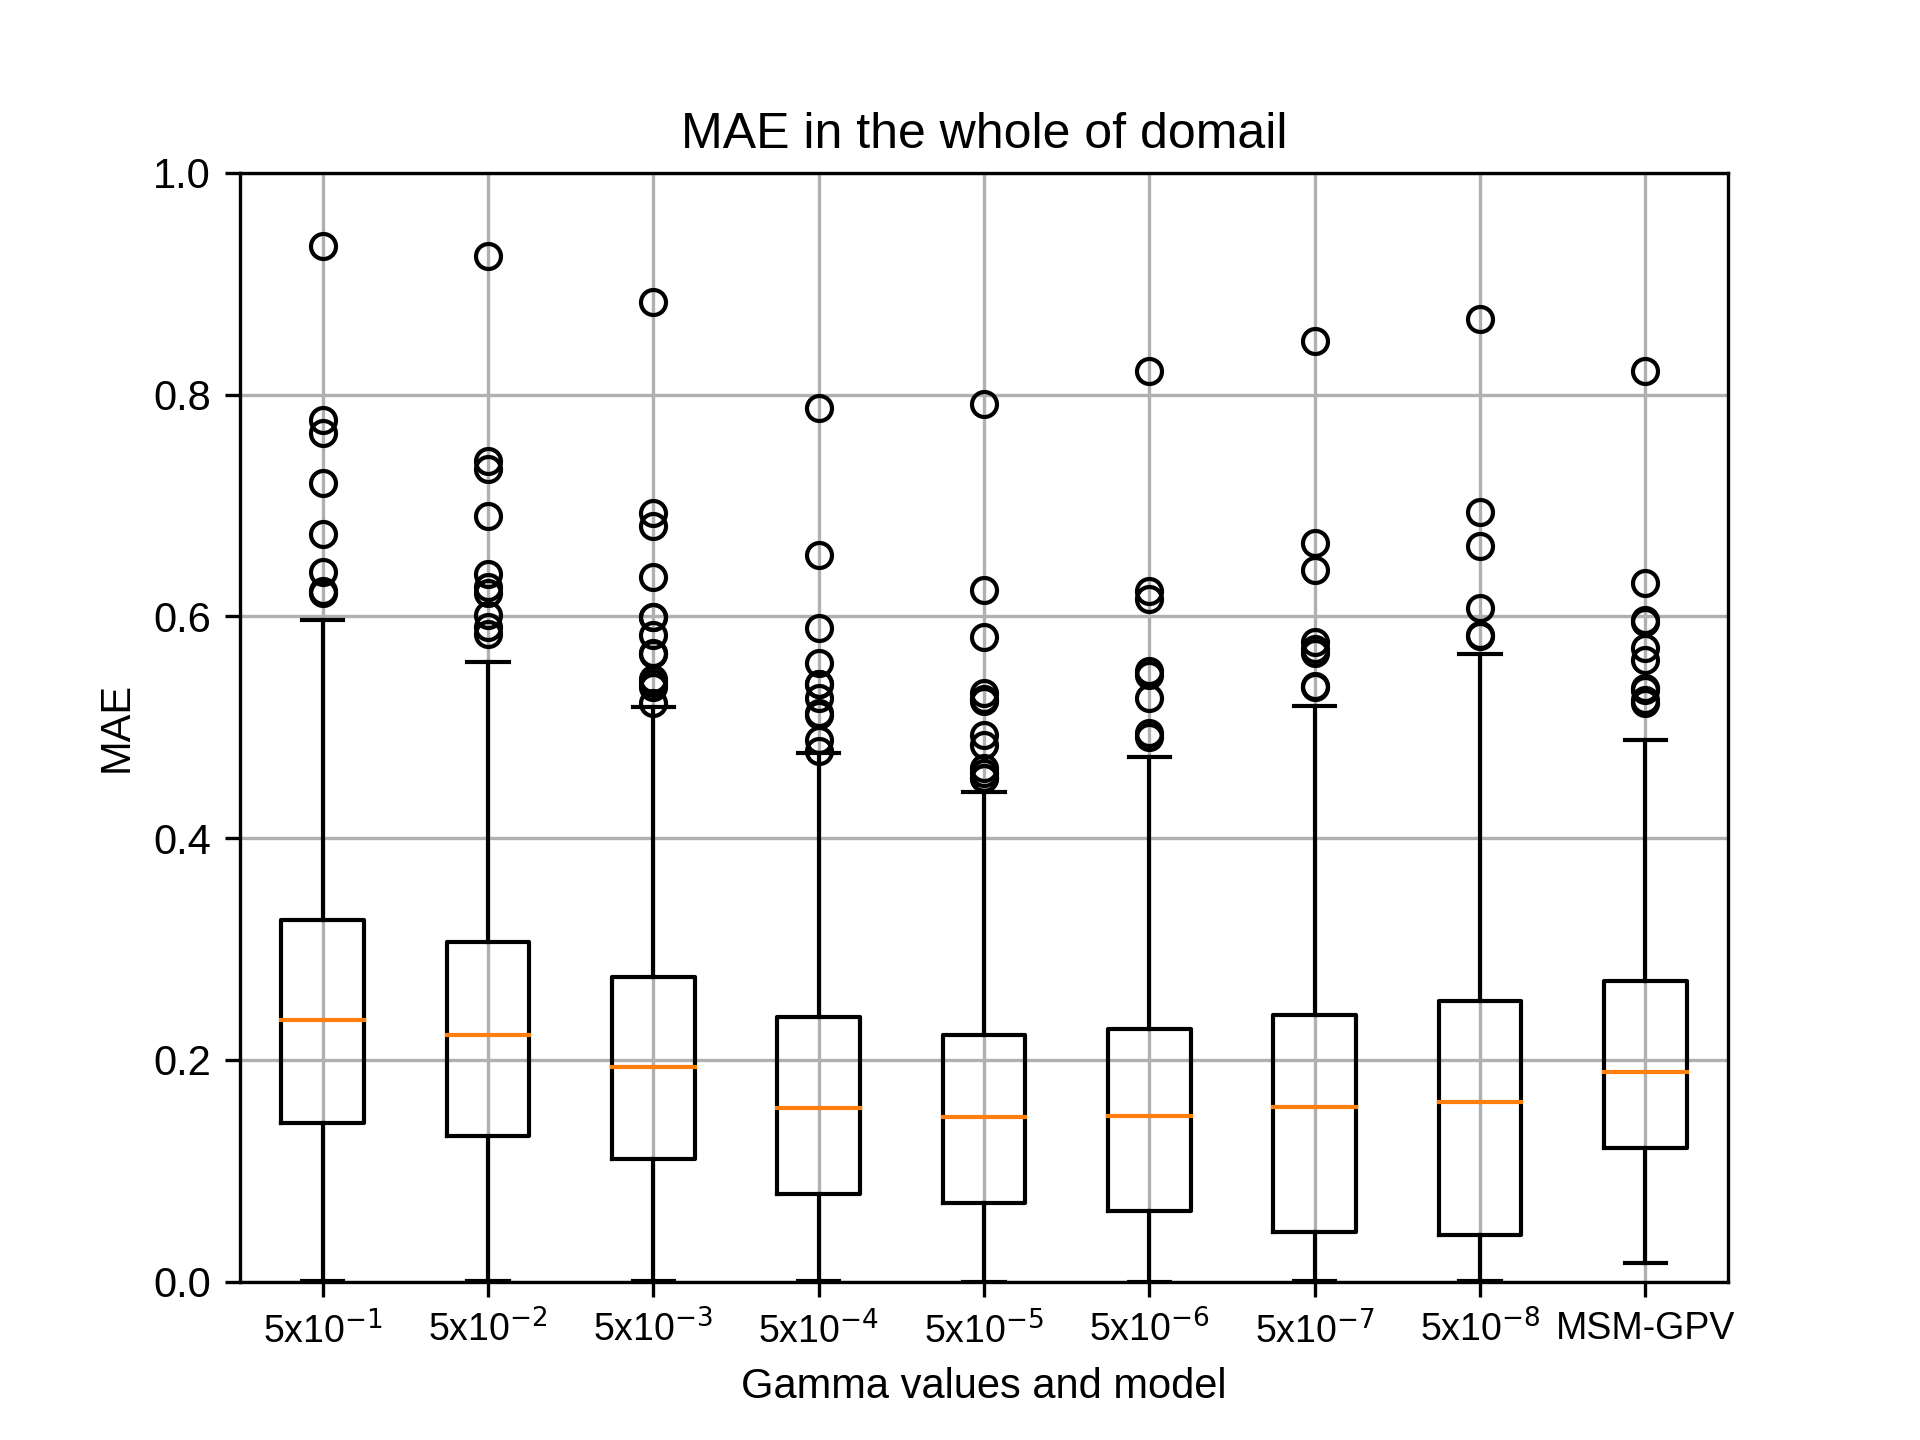
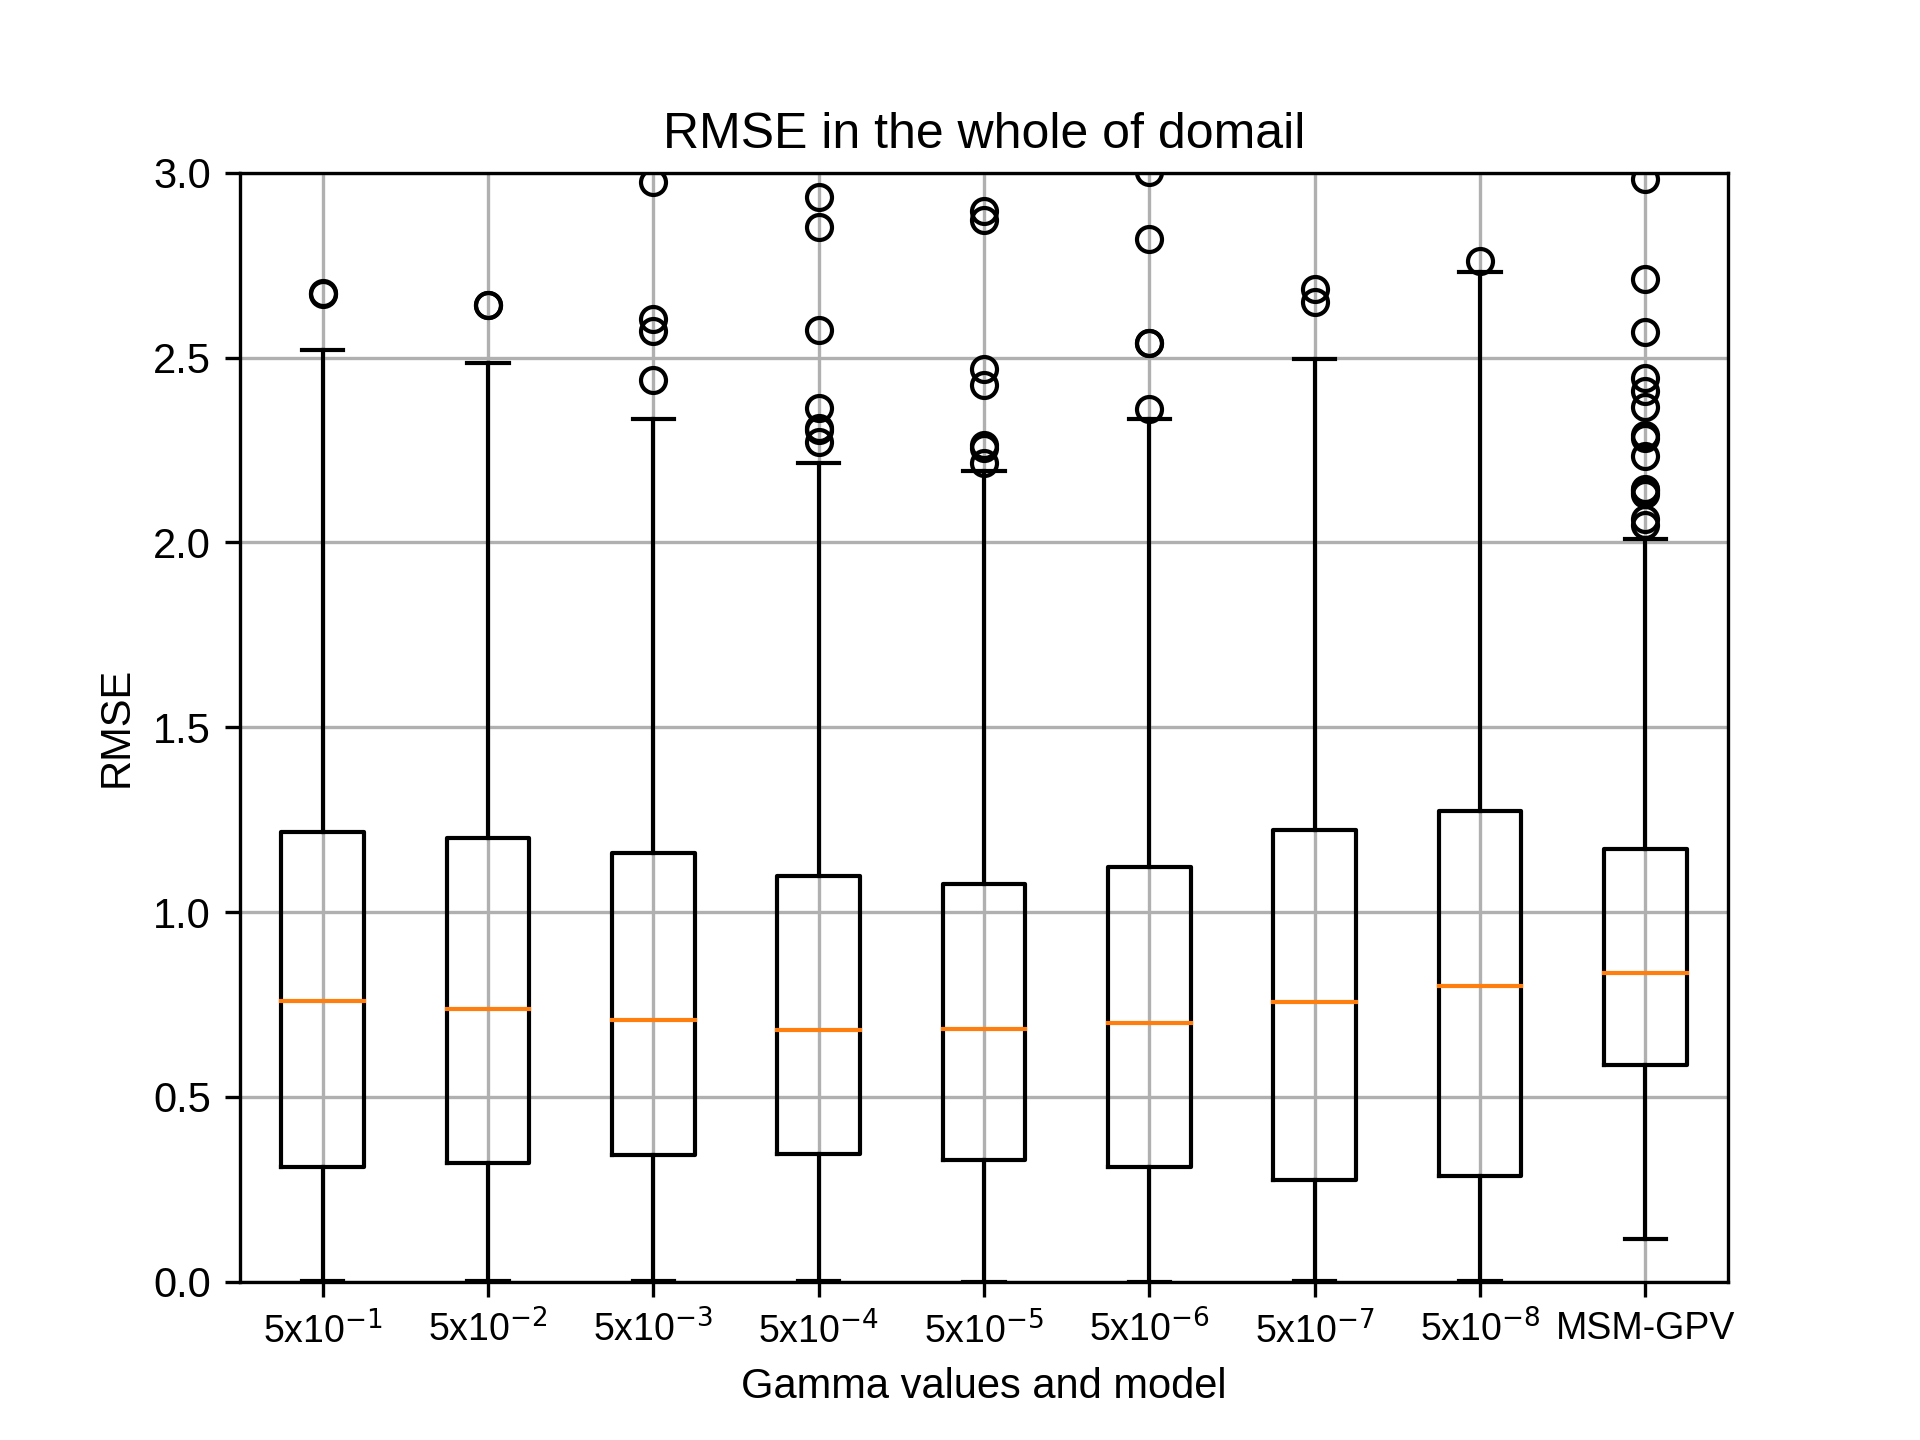
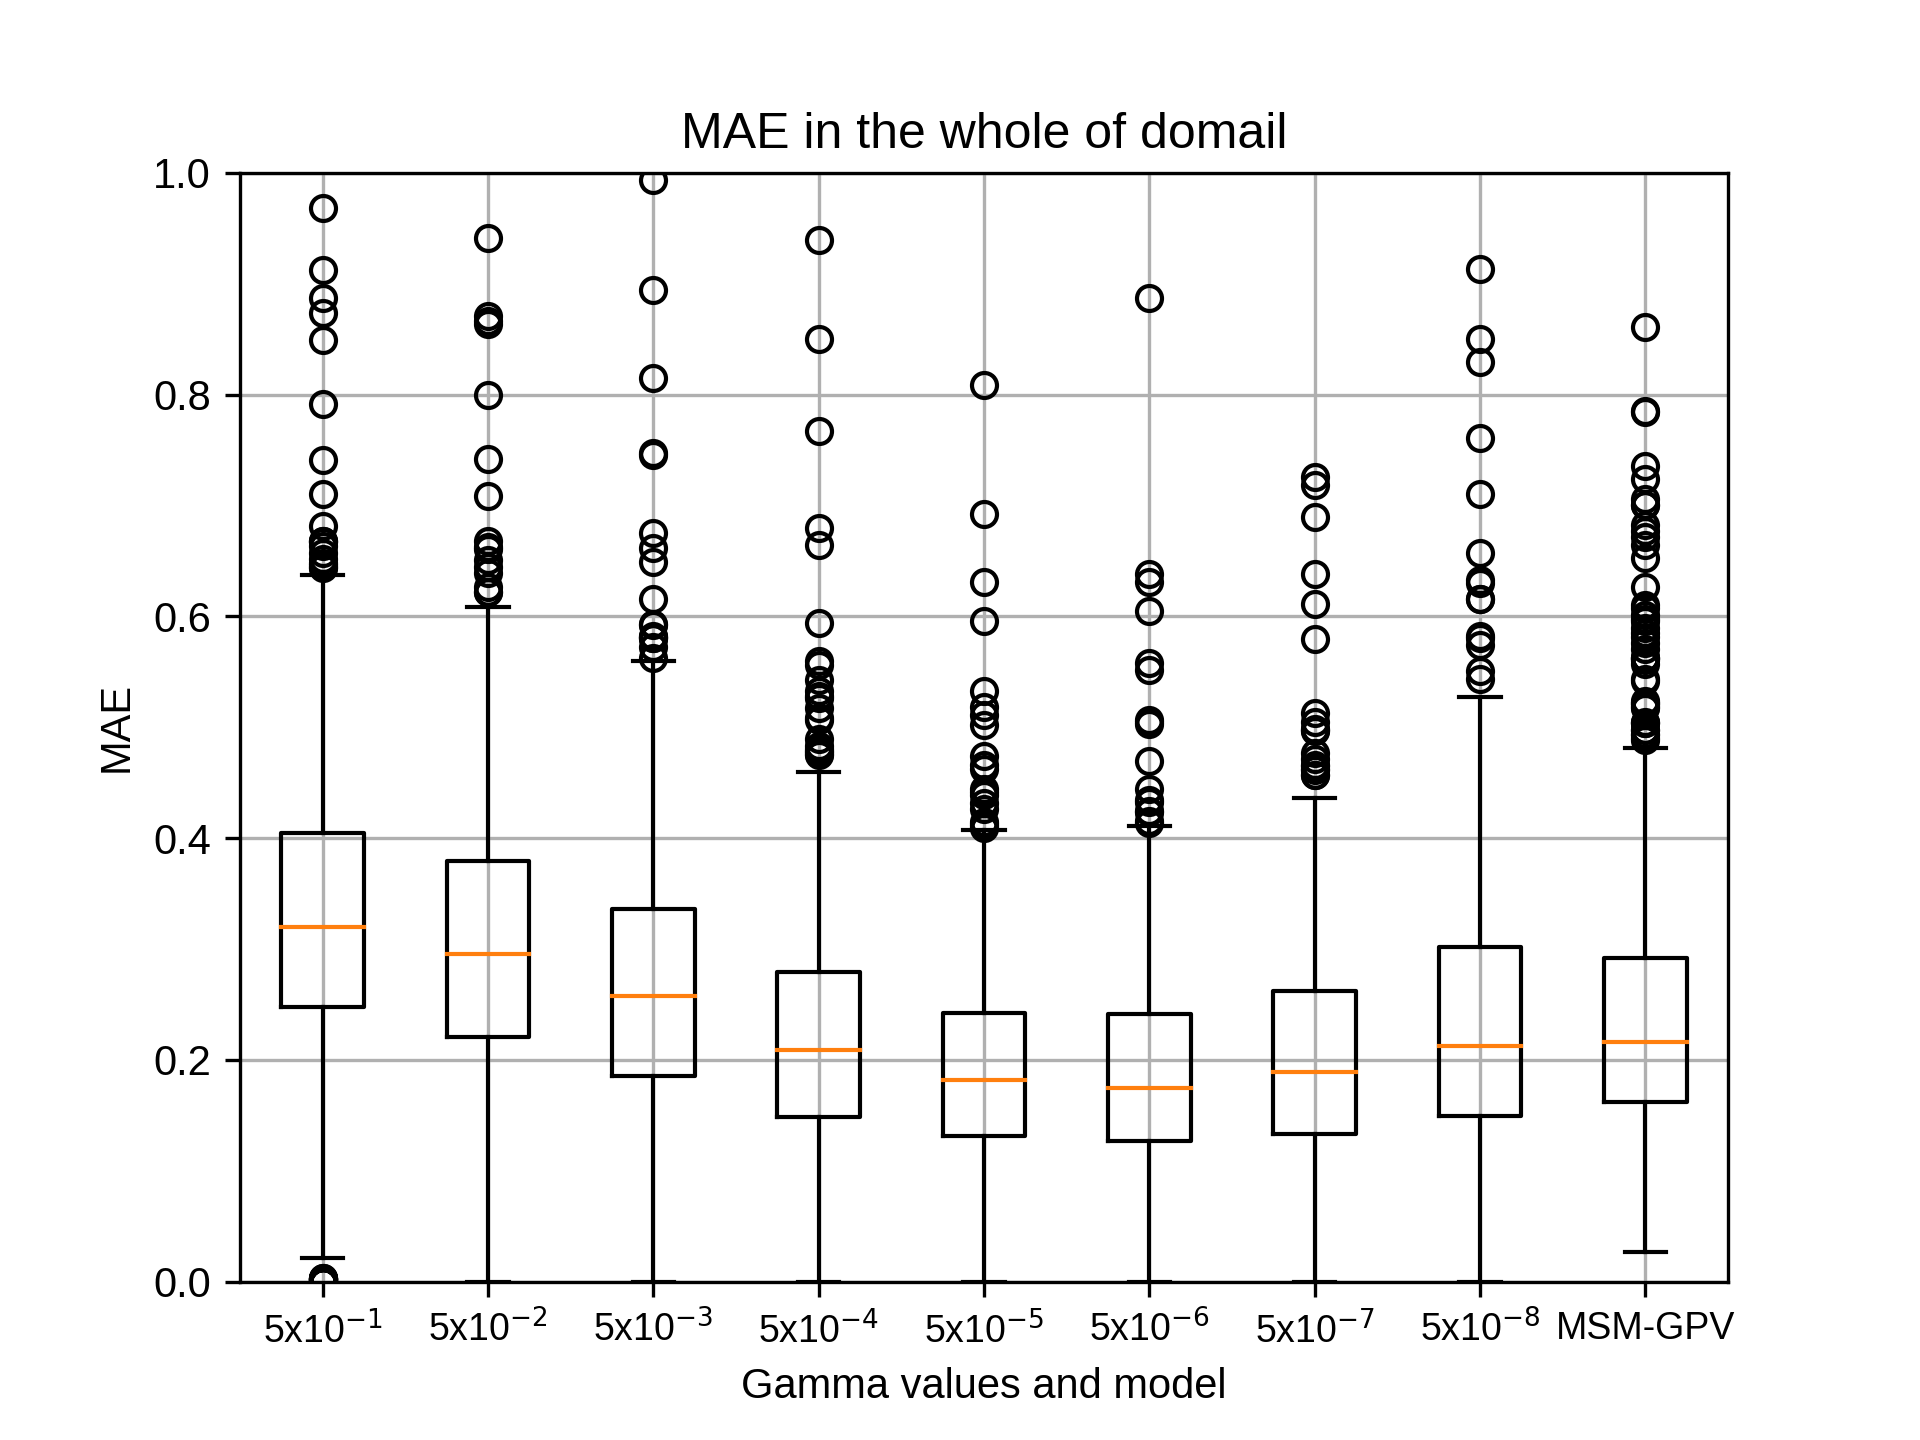
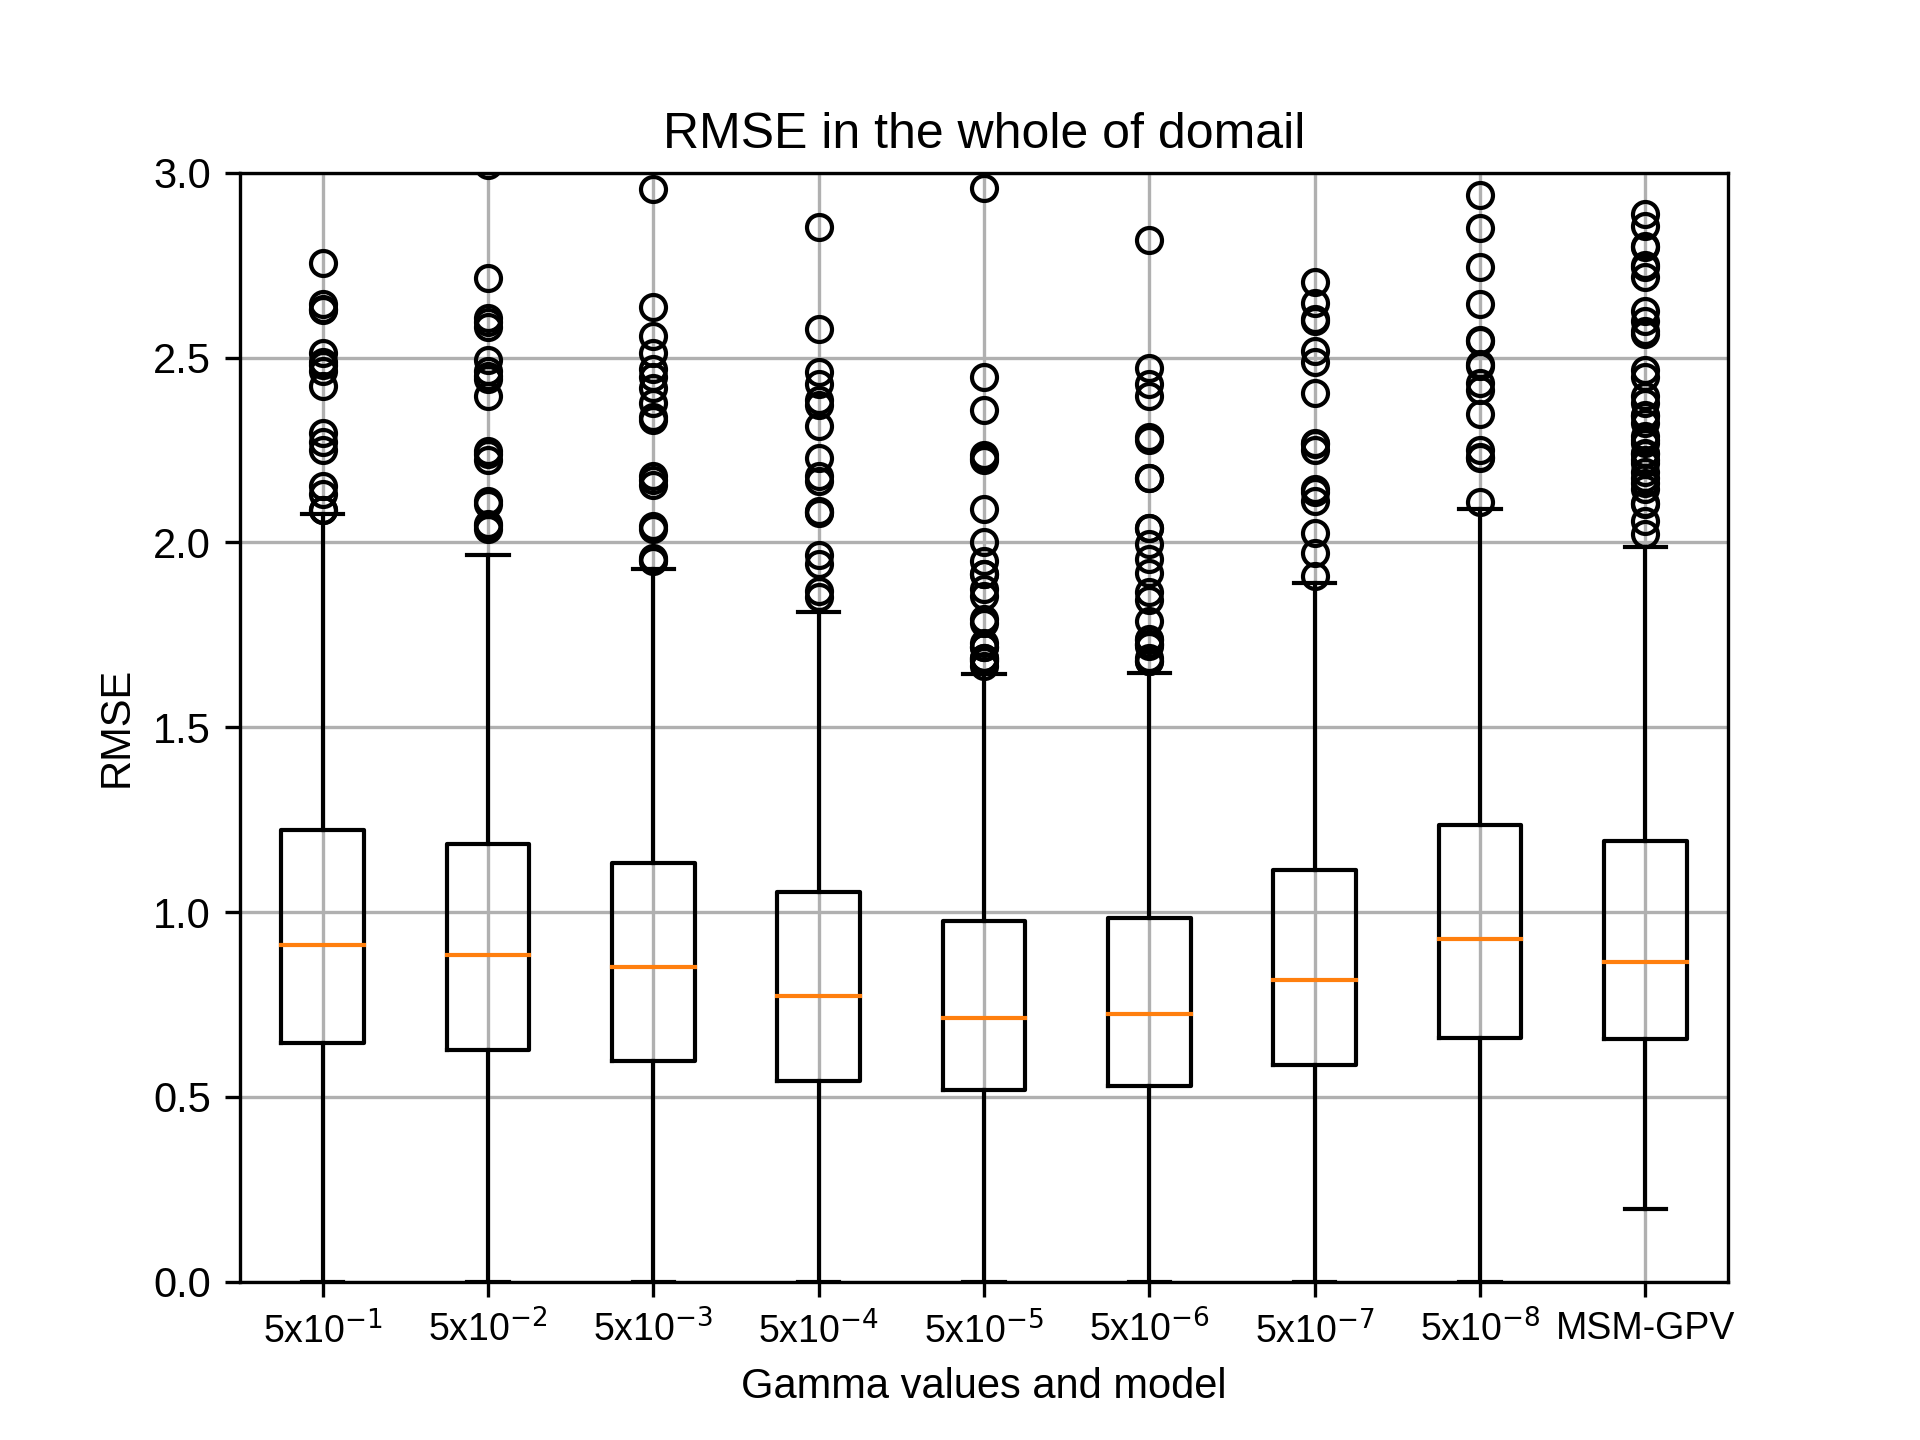
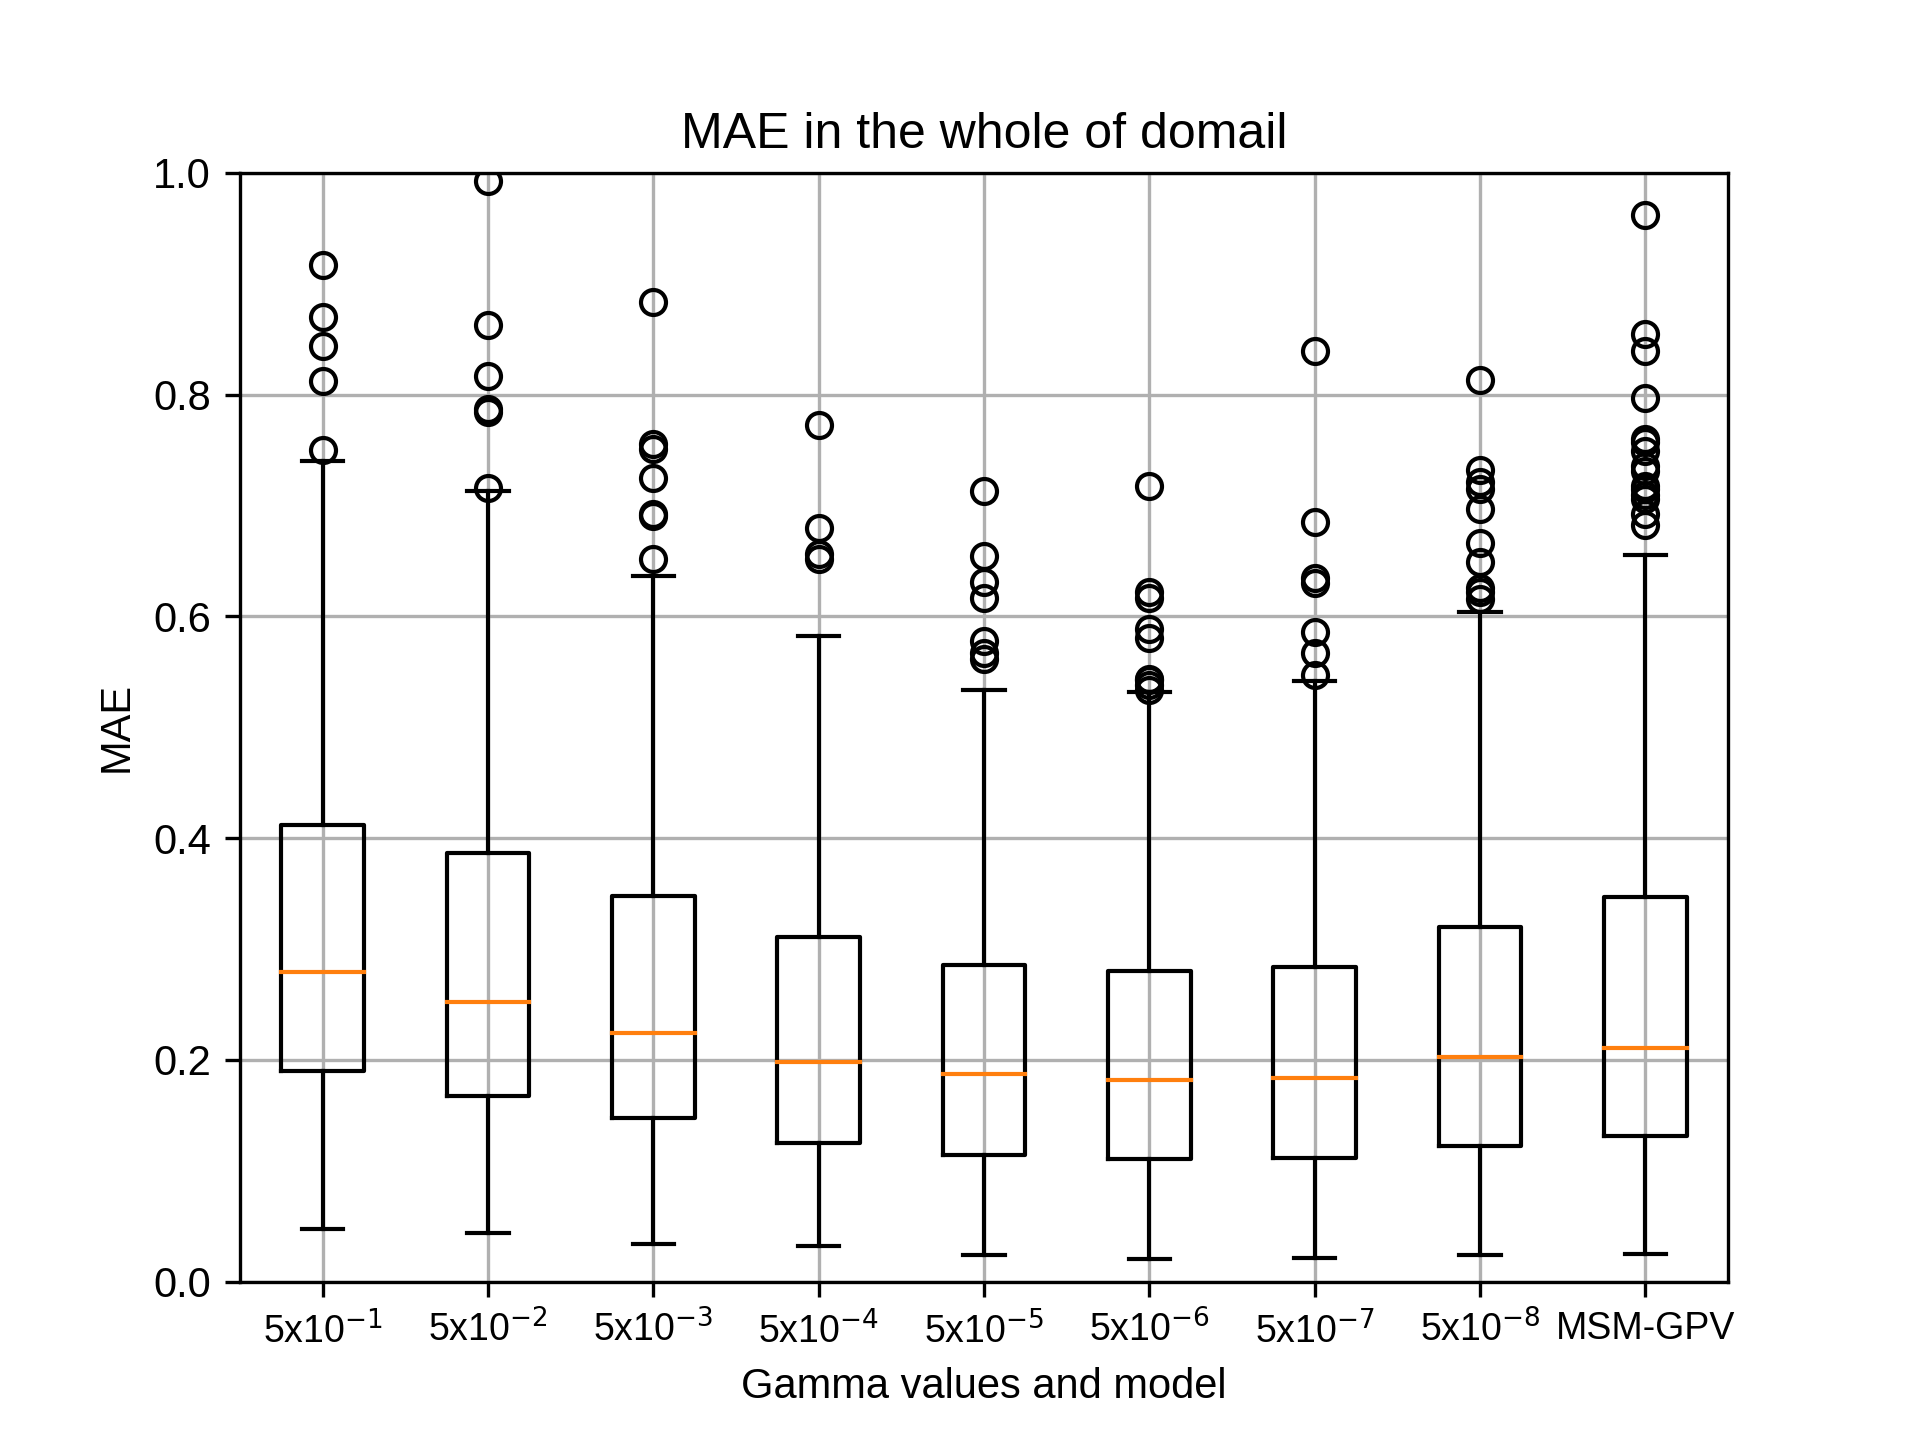
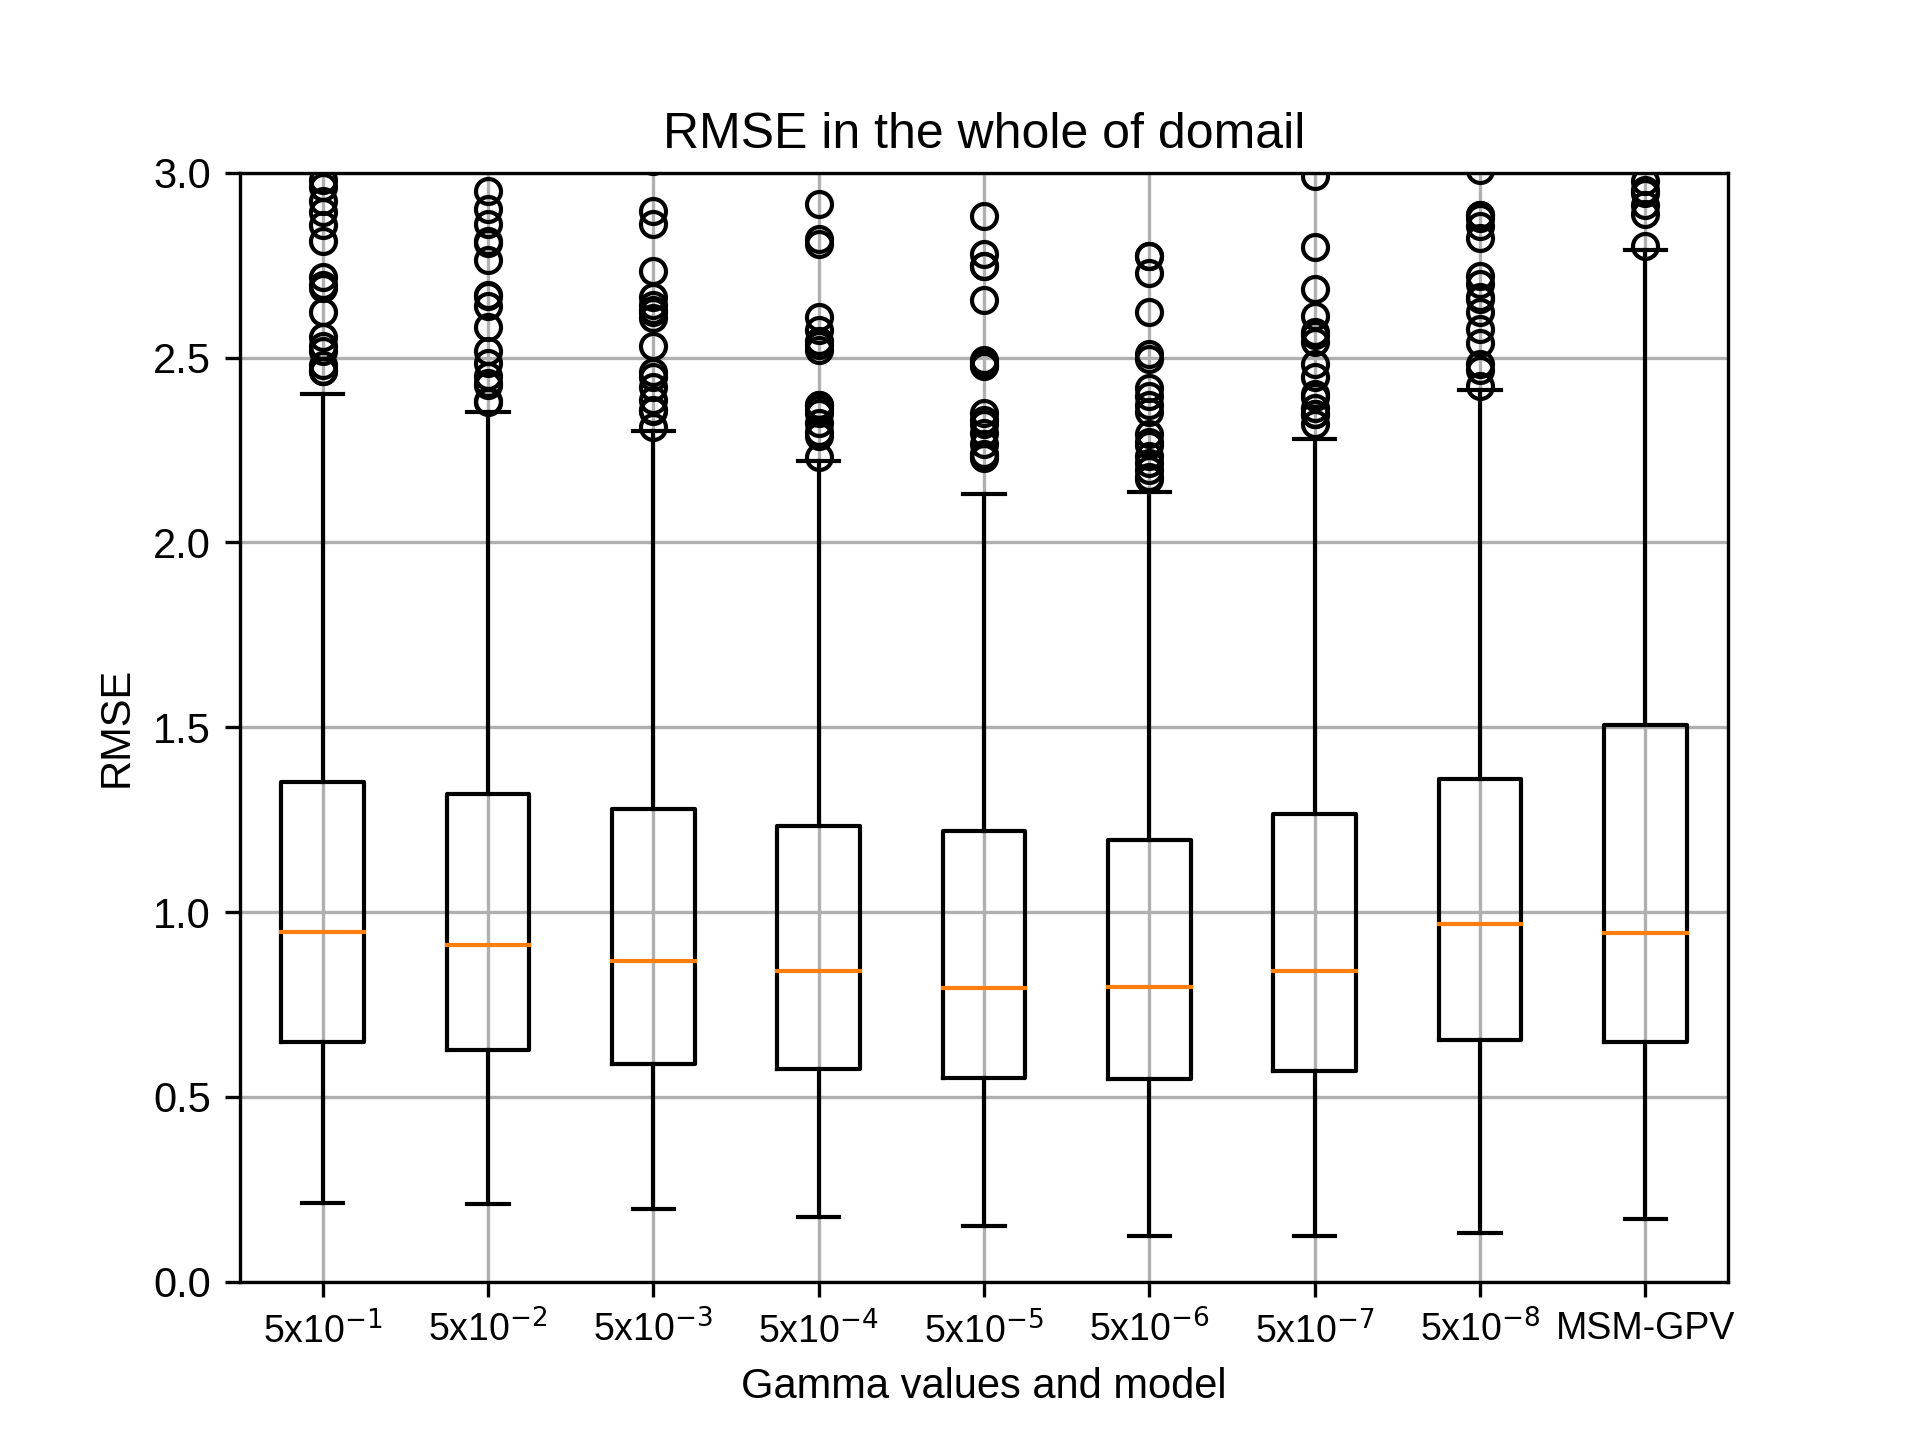
(MAE,RMSEでepsilon=1.0のみ大きい値となっております)
siteA 0.001
siteB 0.001,0.0001,0.00001(同じ)
siteC 0.01,0.001,0.0001,0.00001(同じ)
siteD 0.001
siteE 0.0001,0.00001(同じ)
今回の手法は以下のとおりです。
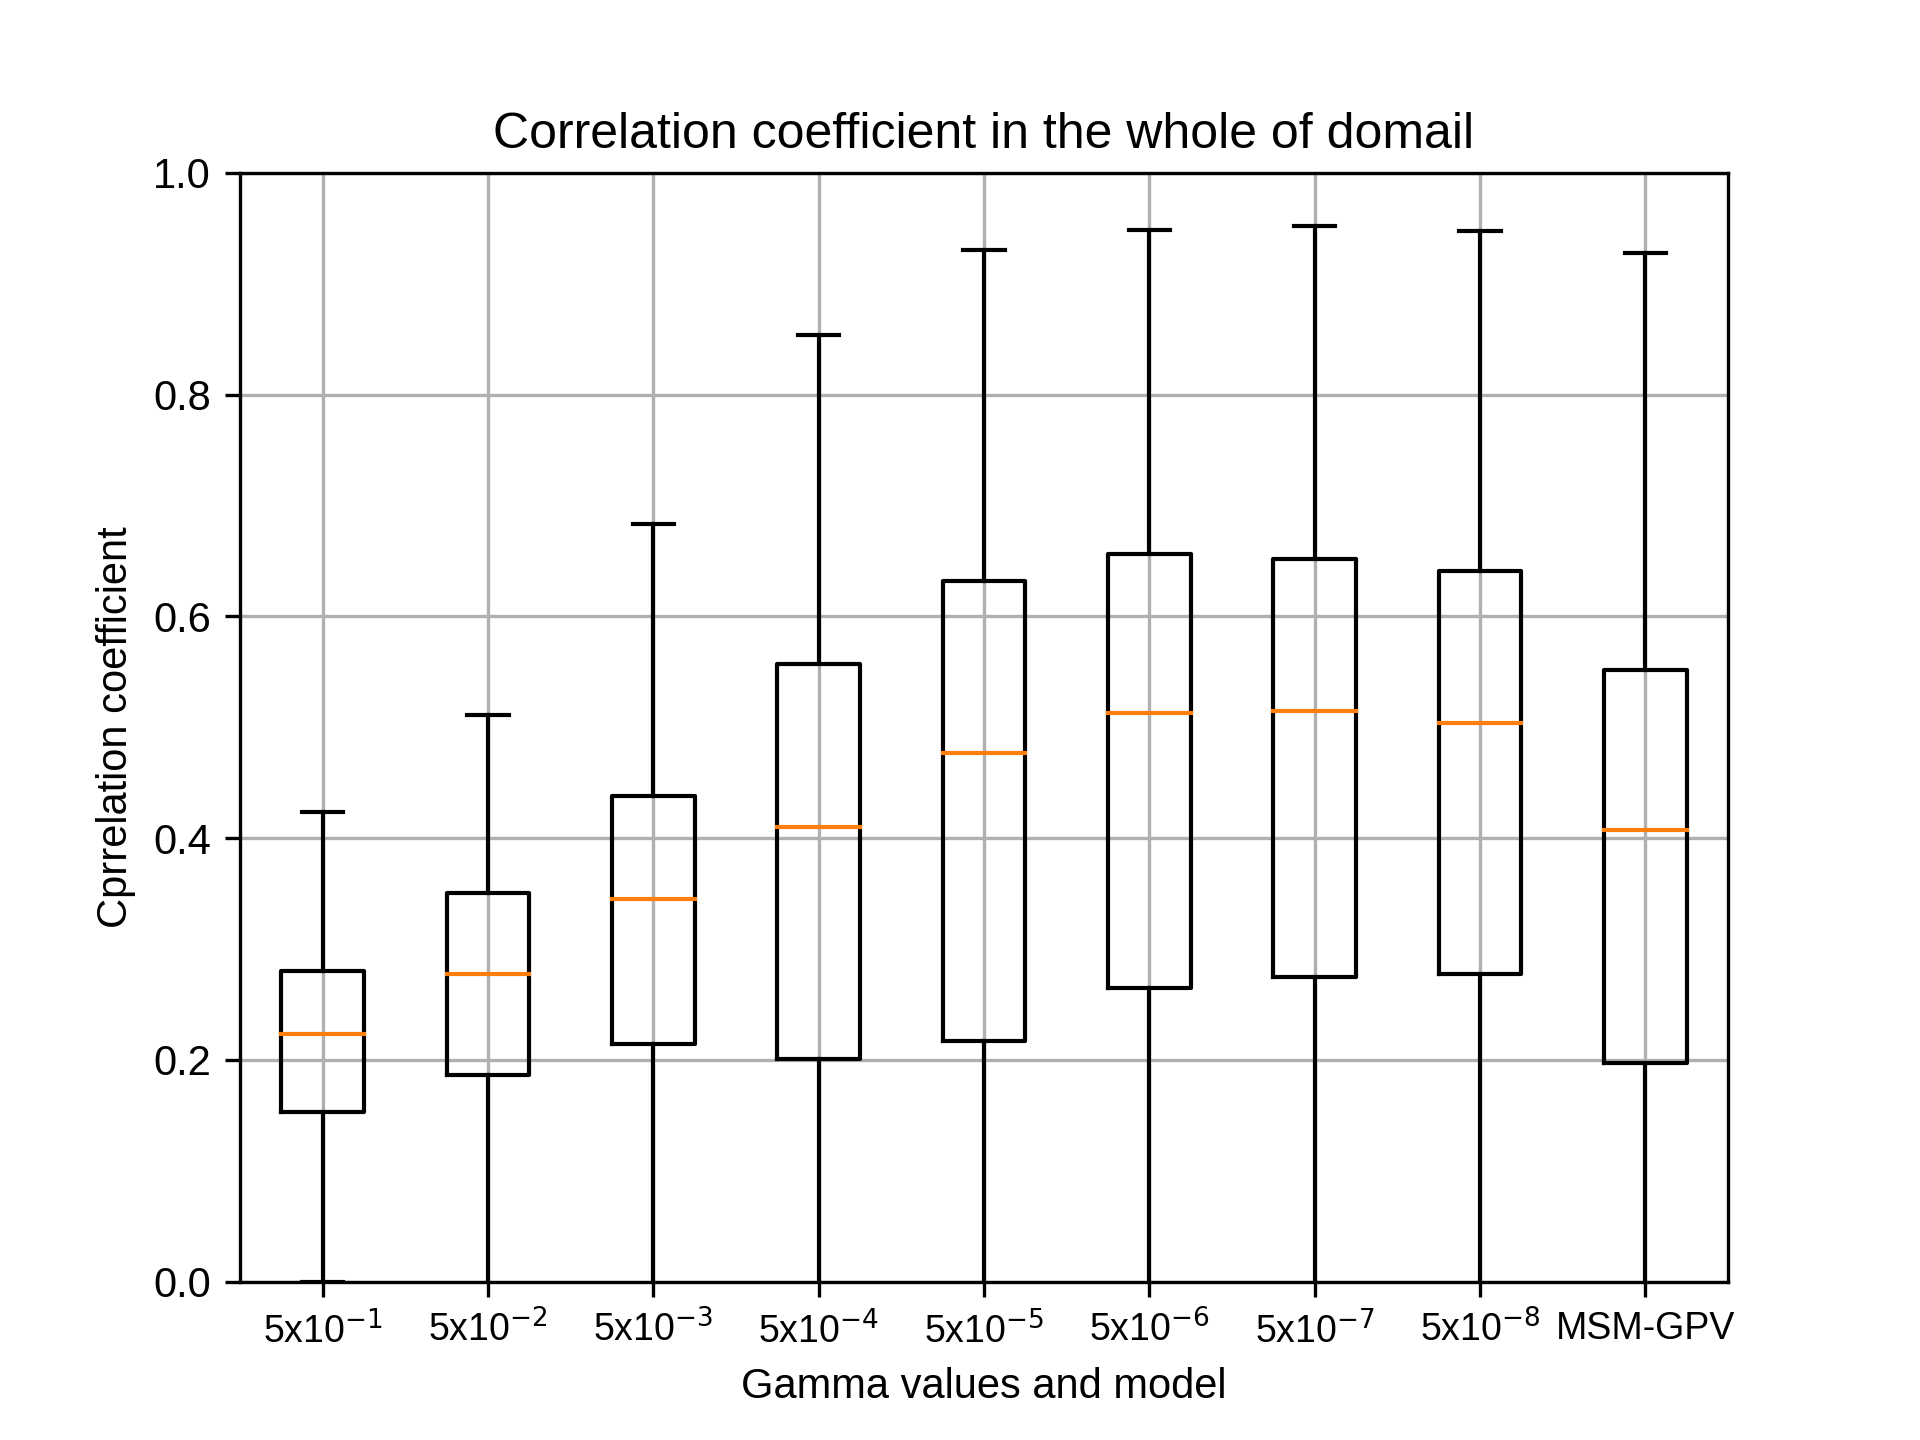
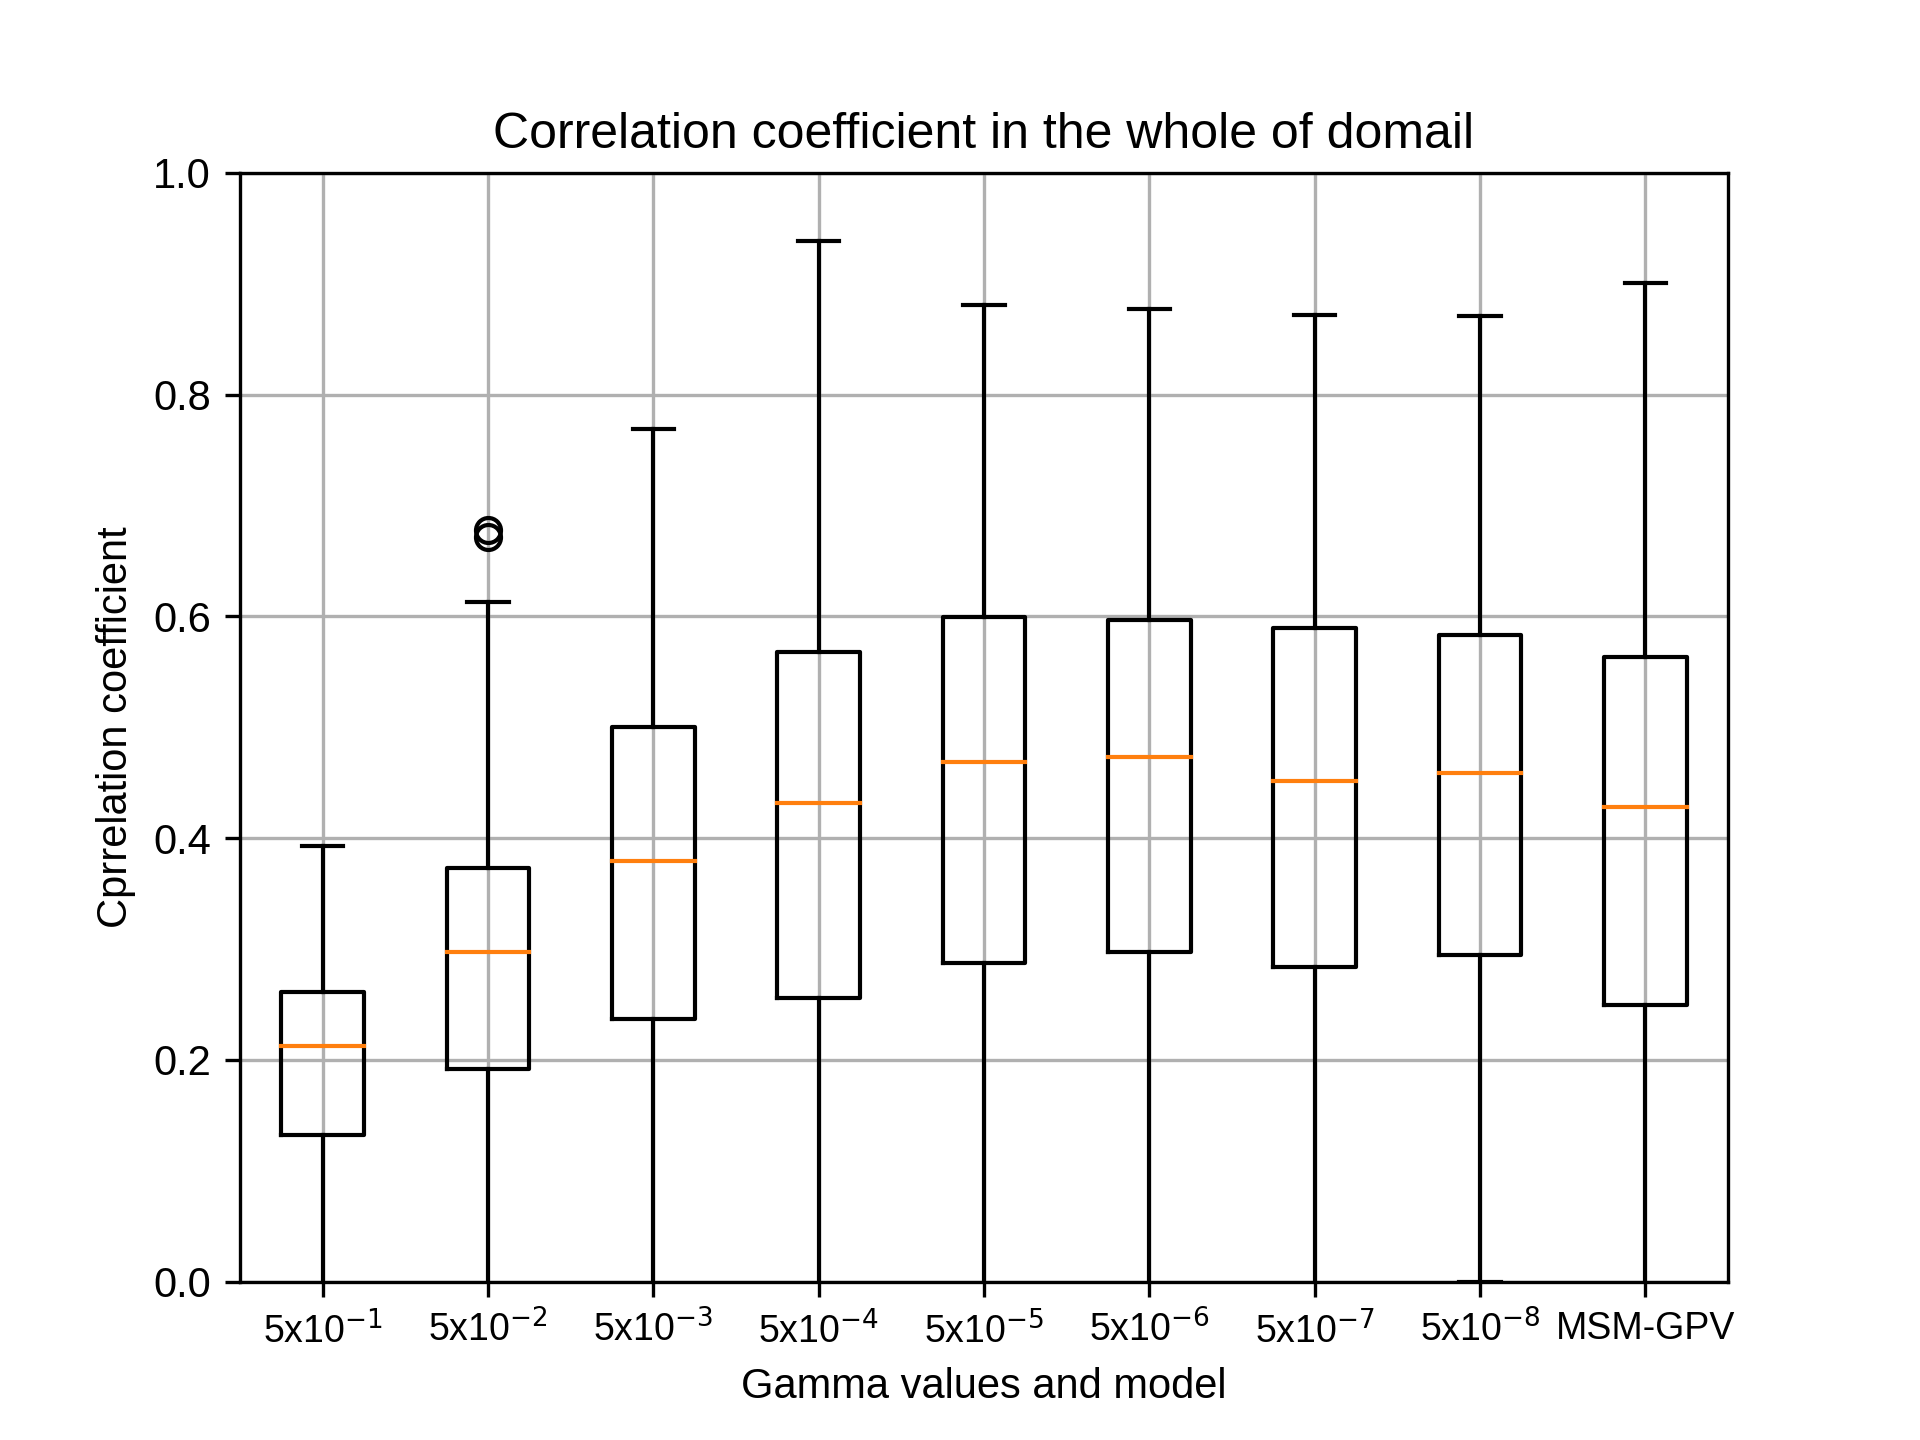
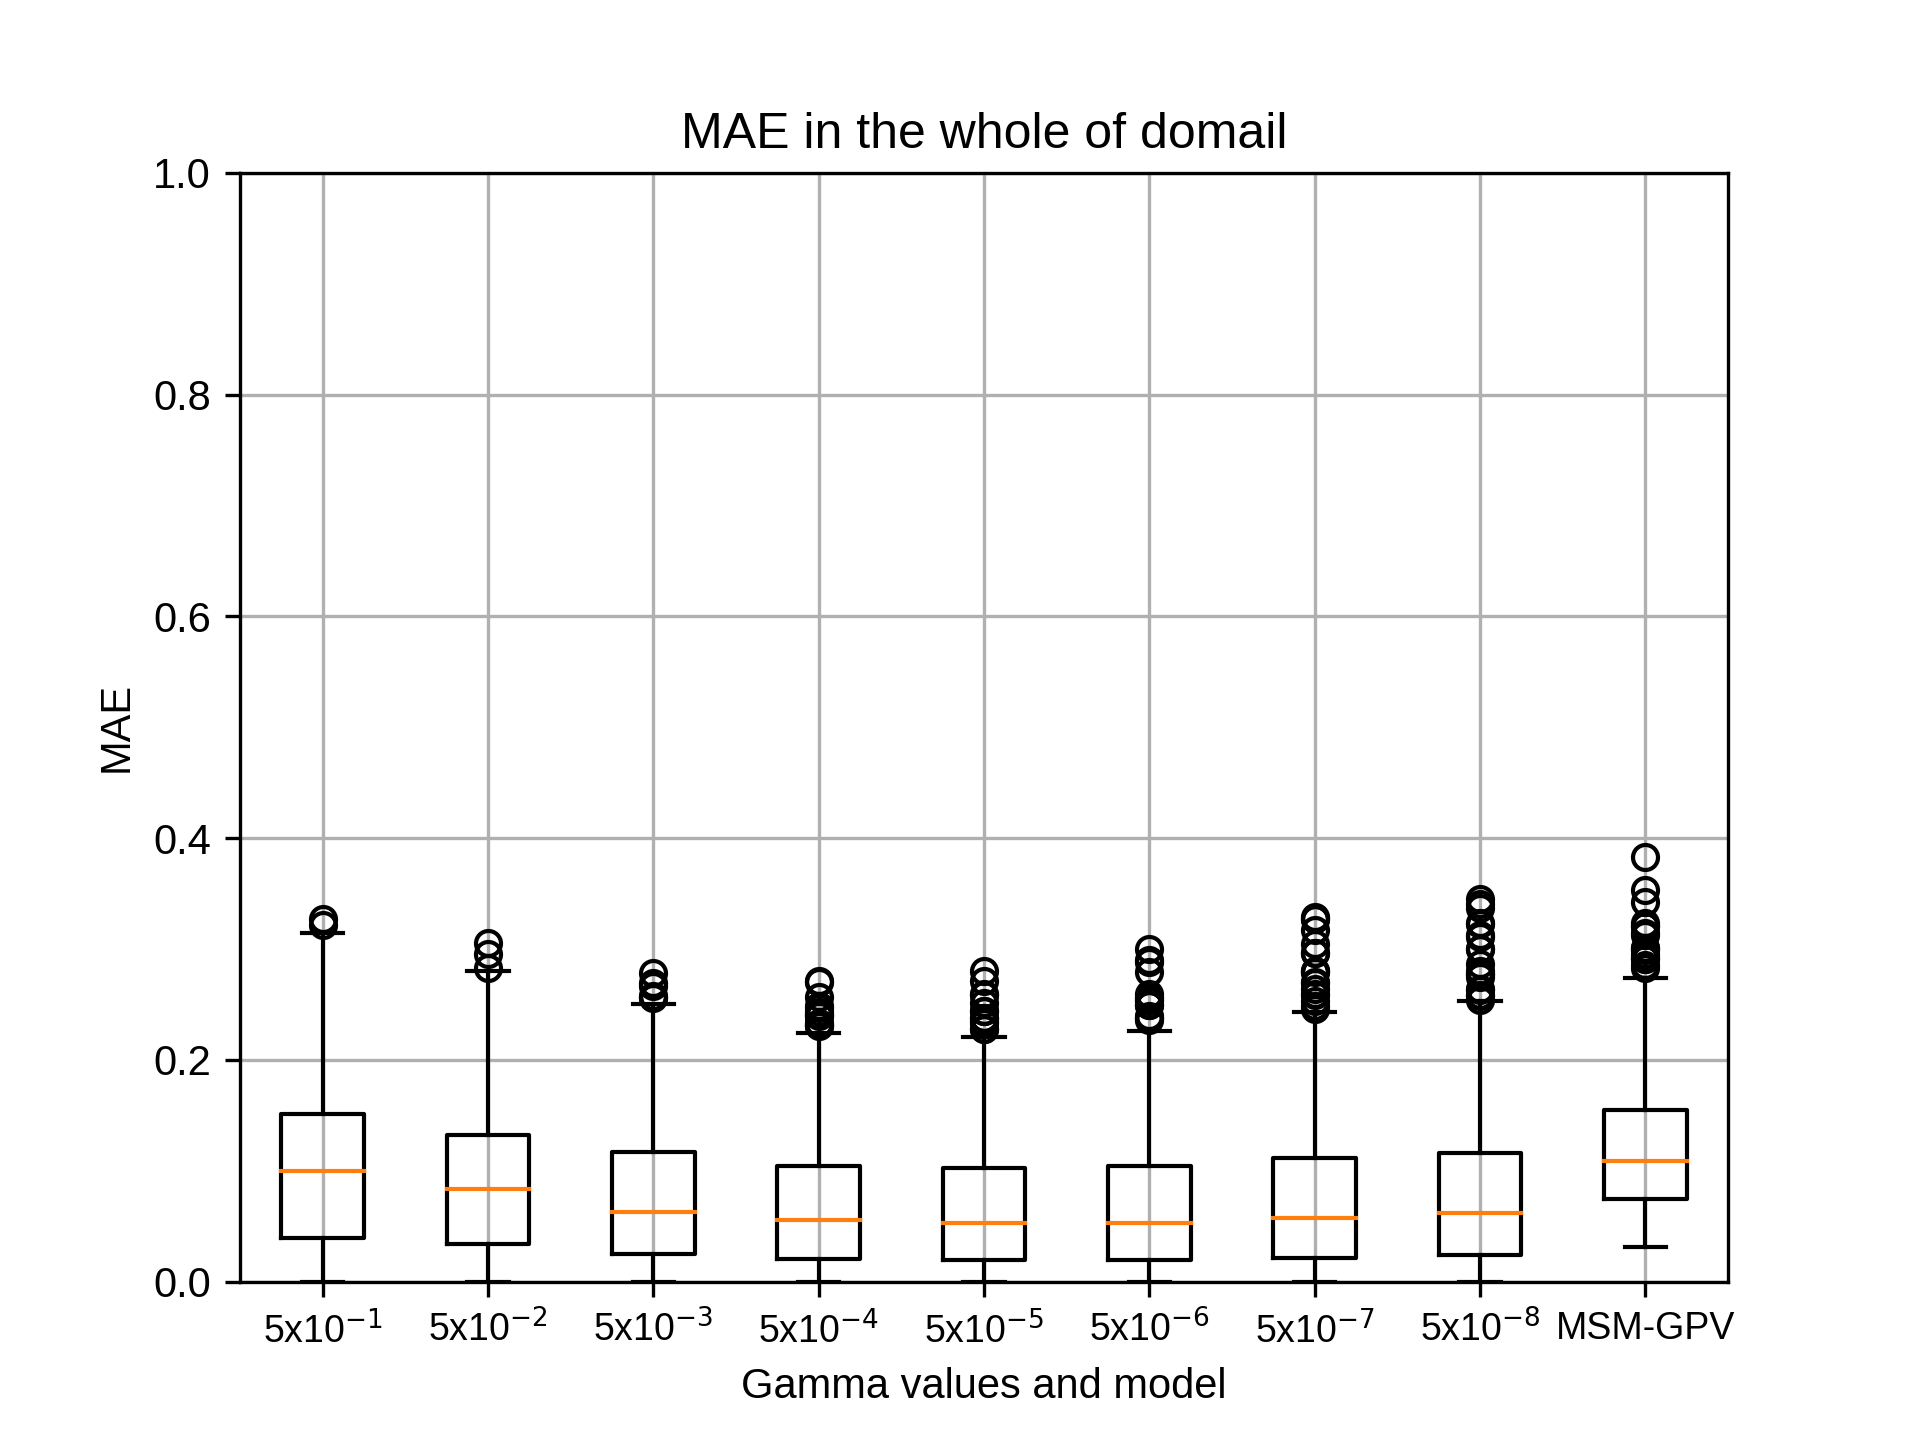
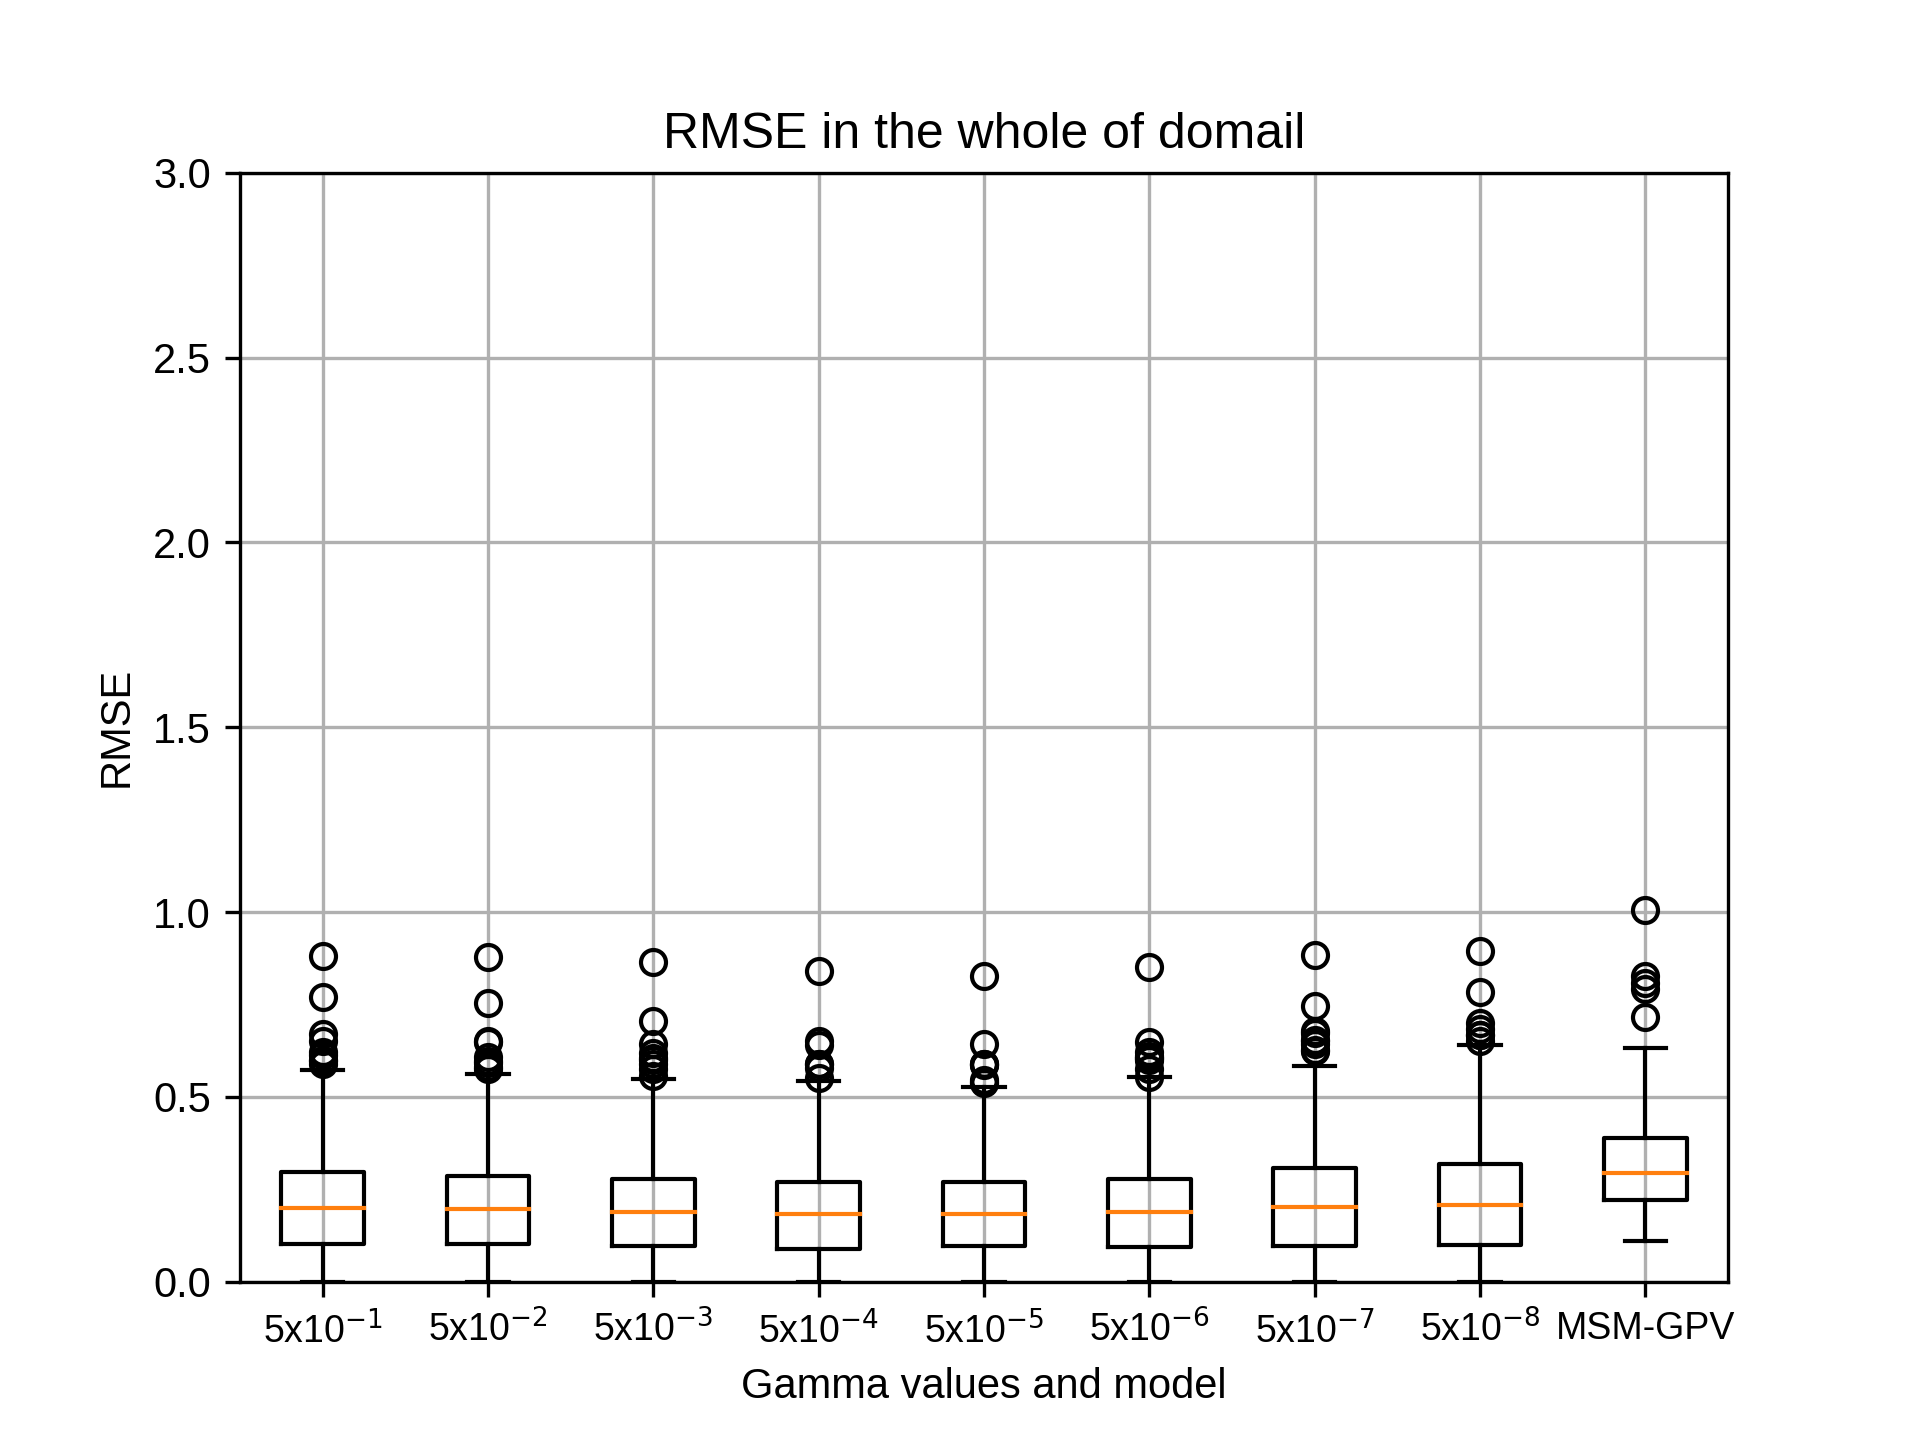
(1) cost=10, epsilon=0.001に固定し、gammaを'0.5 0.05 0.005 0.0005 0.00005 0.000005 0.0000005 0.00000005'と変化させ、相関係数の中央値が最も高いgammaを採用
(2) gammaを(1)で定めた値、epsilon=0.001に固定し、costを'50 40 30 20 10 8 6 4 2 1'と変化させ、相関係数の中央値が最も高いcostを採用
(3) gammaを(1)で定めた値、costを(2)で定めた値とし、epsilonを'1.0 0.1 0.01 0.001 0.0001 0.00001'と変化させ、相関係数の中央値が最も高いepsilonを採用
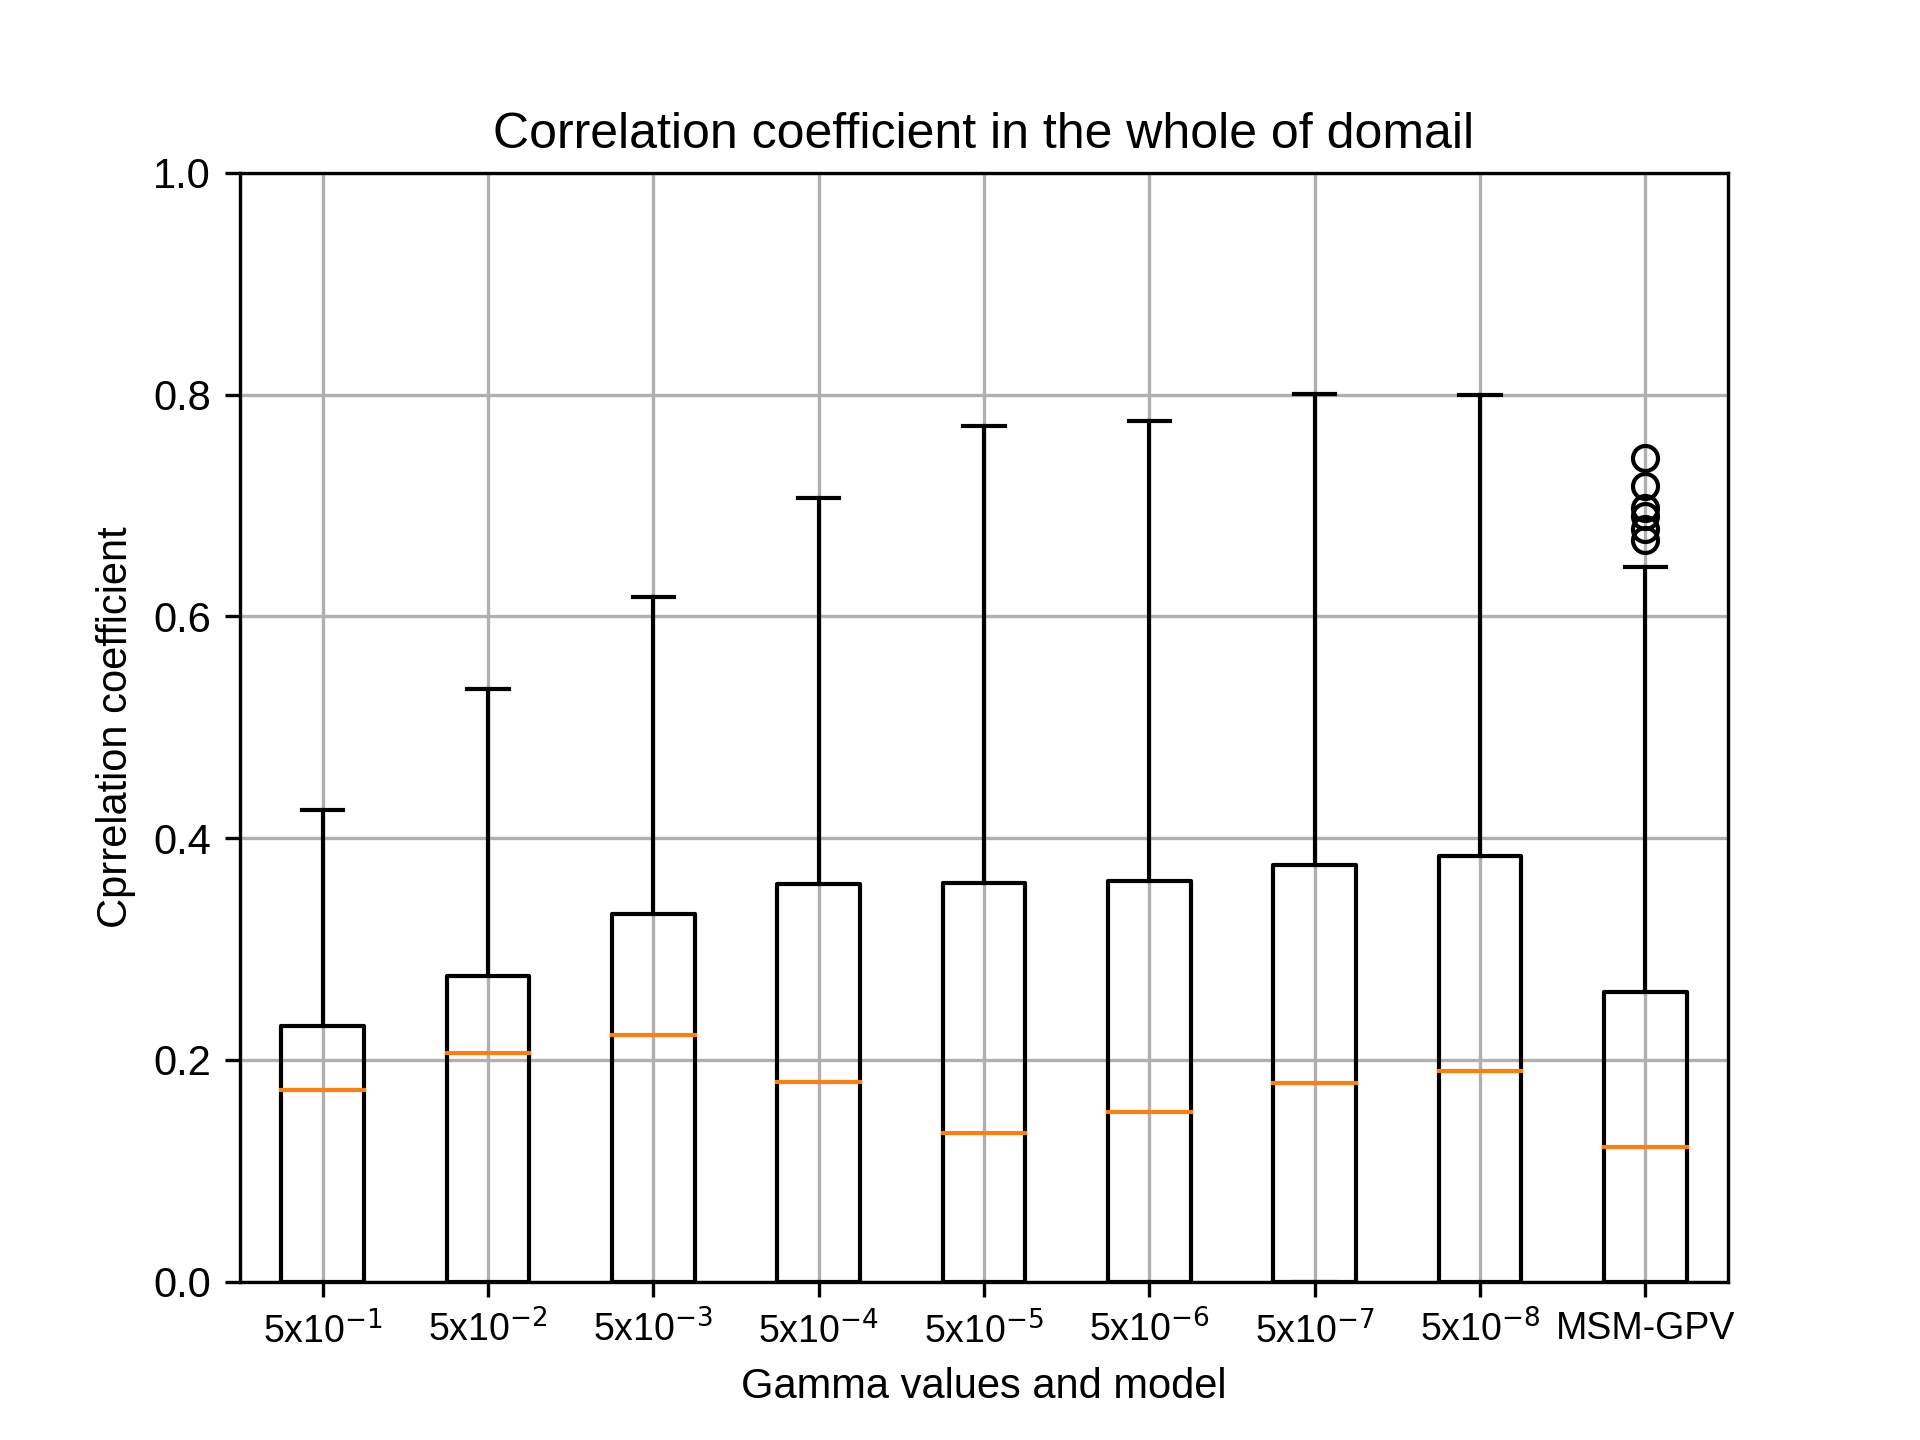
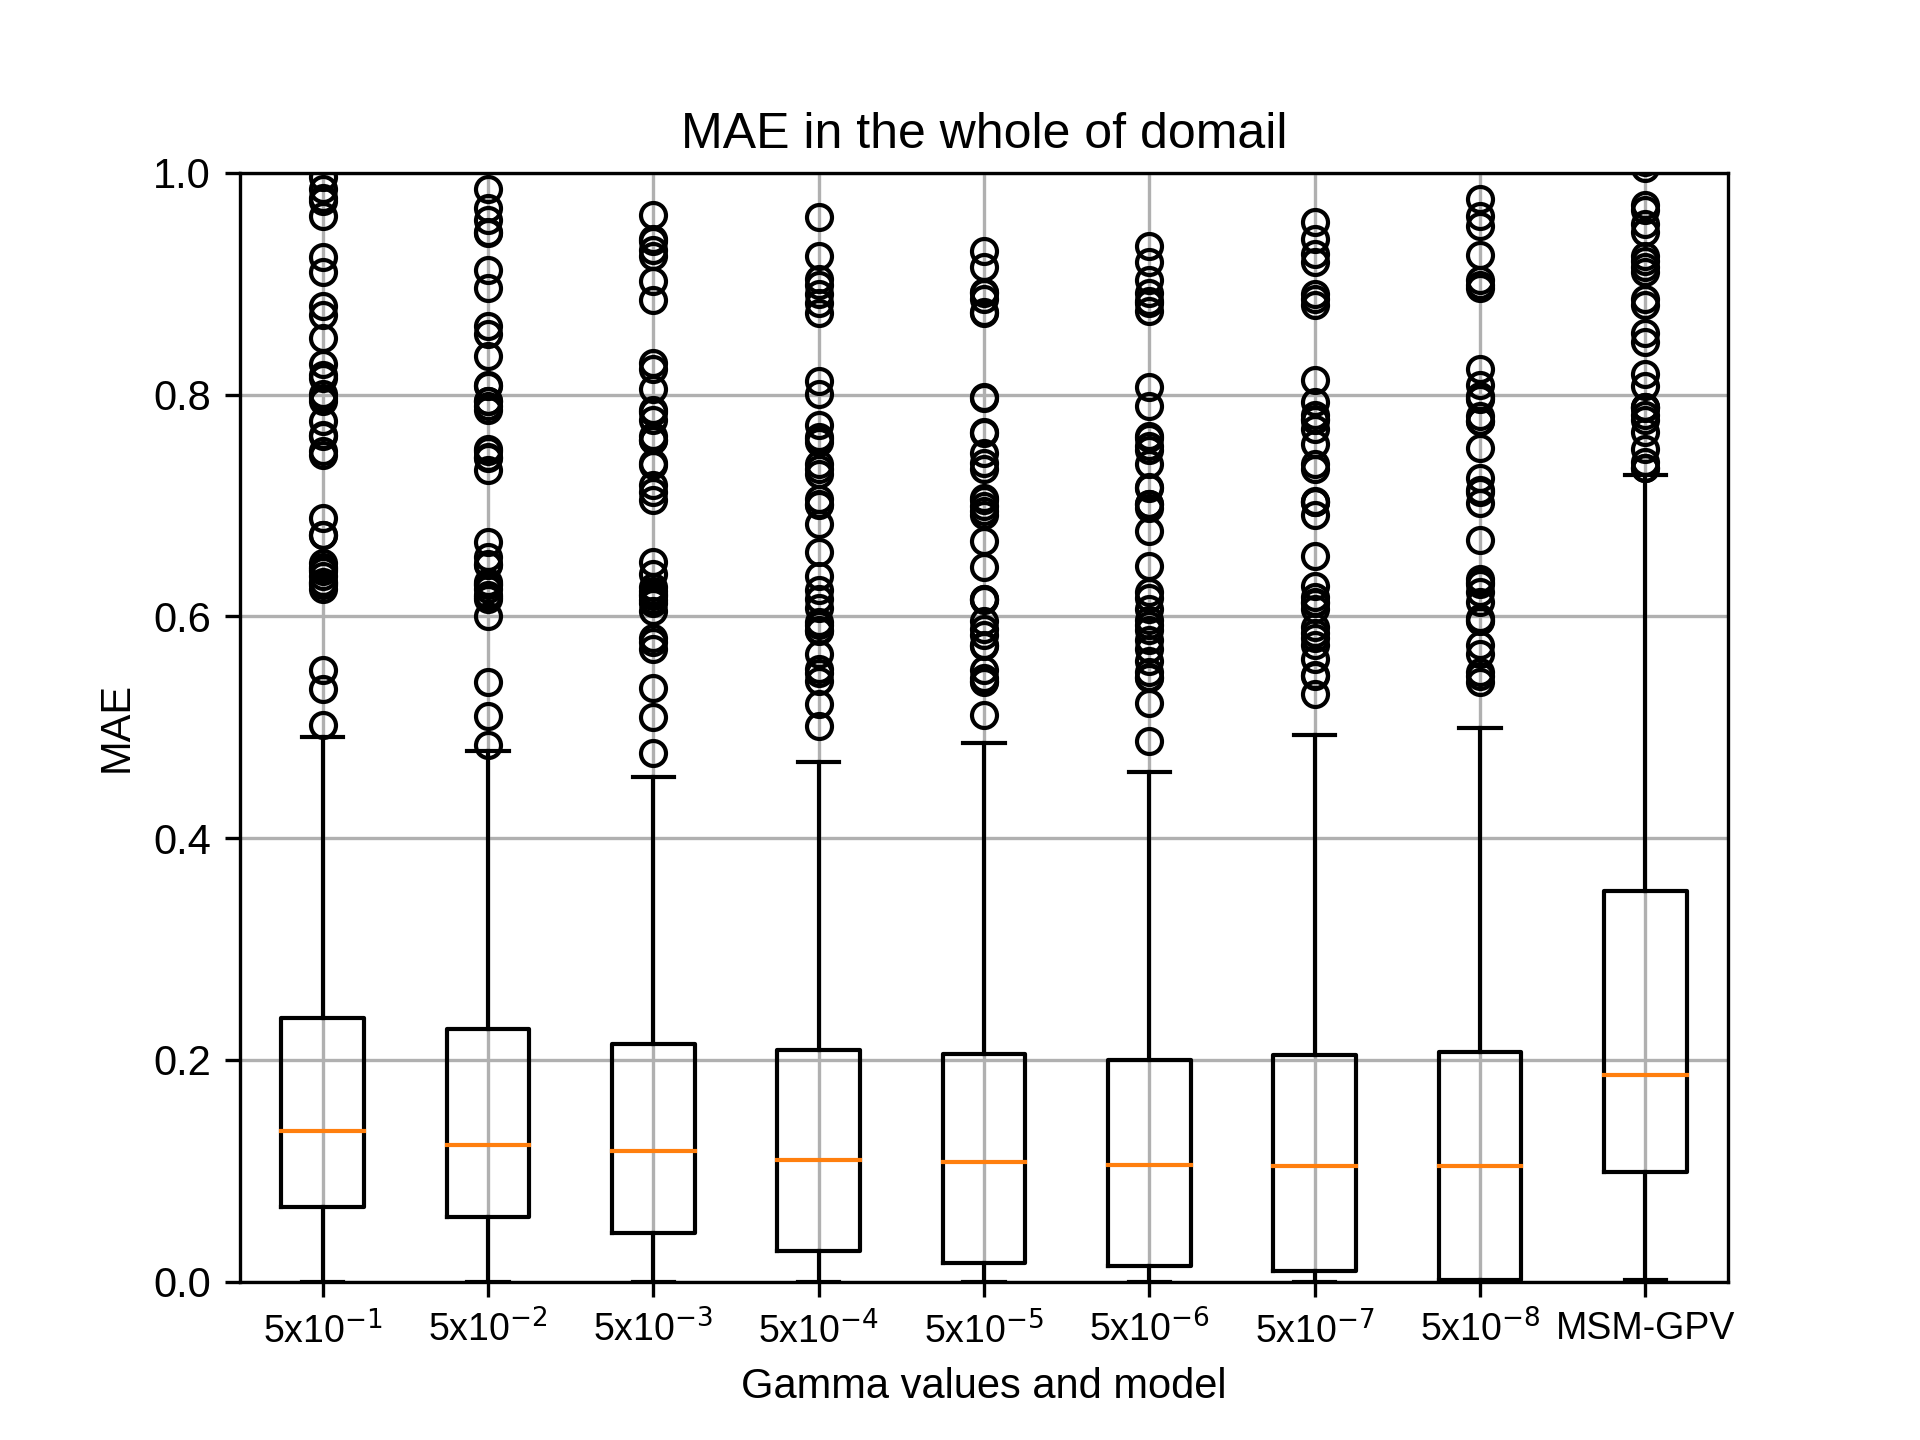
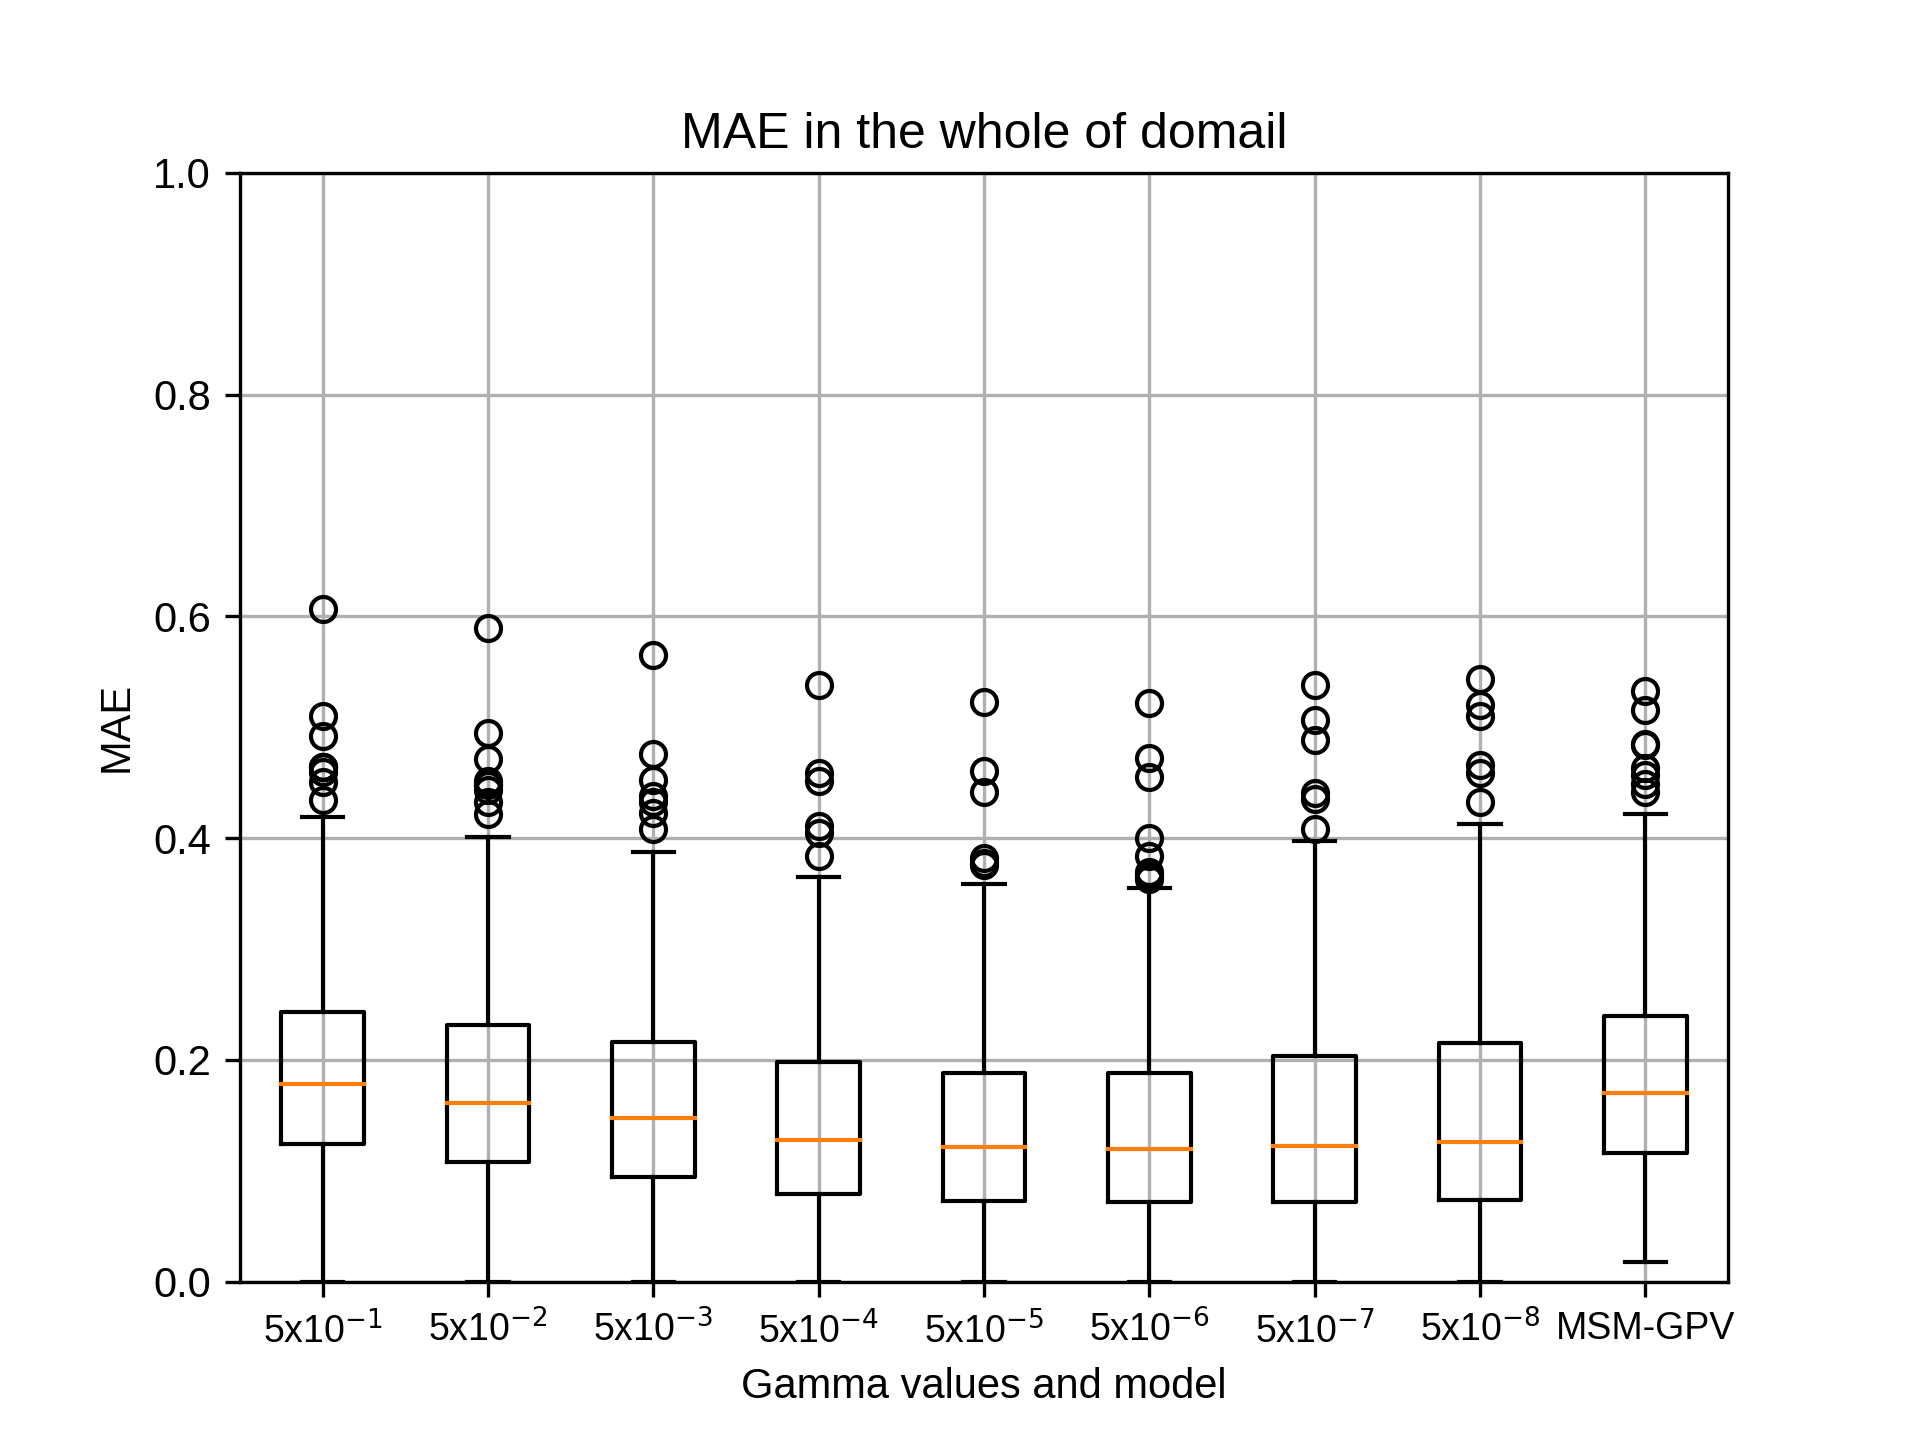
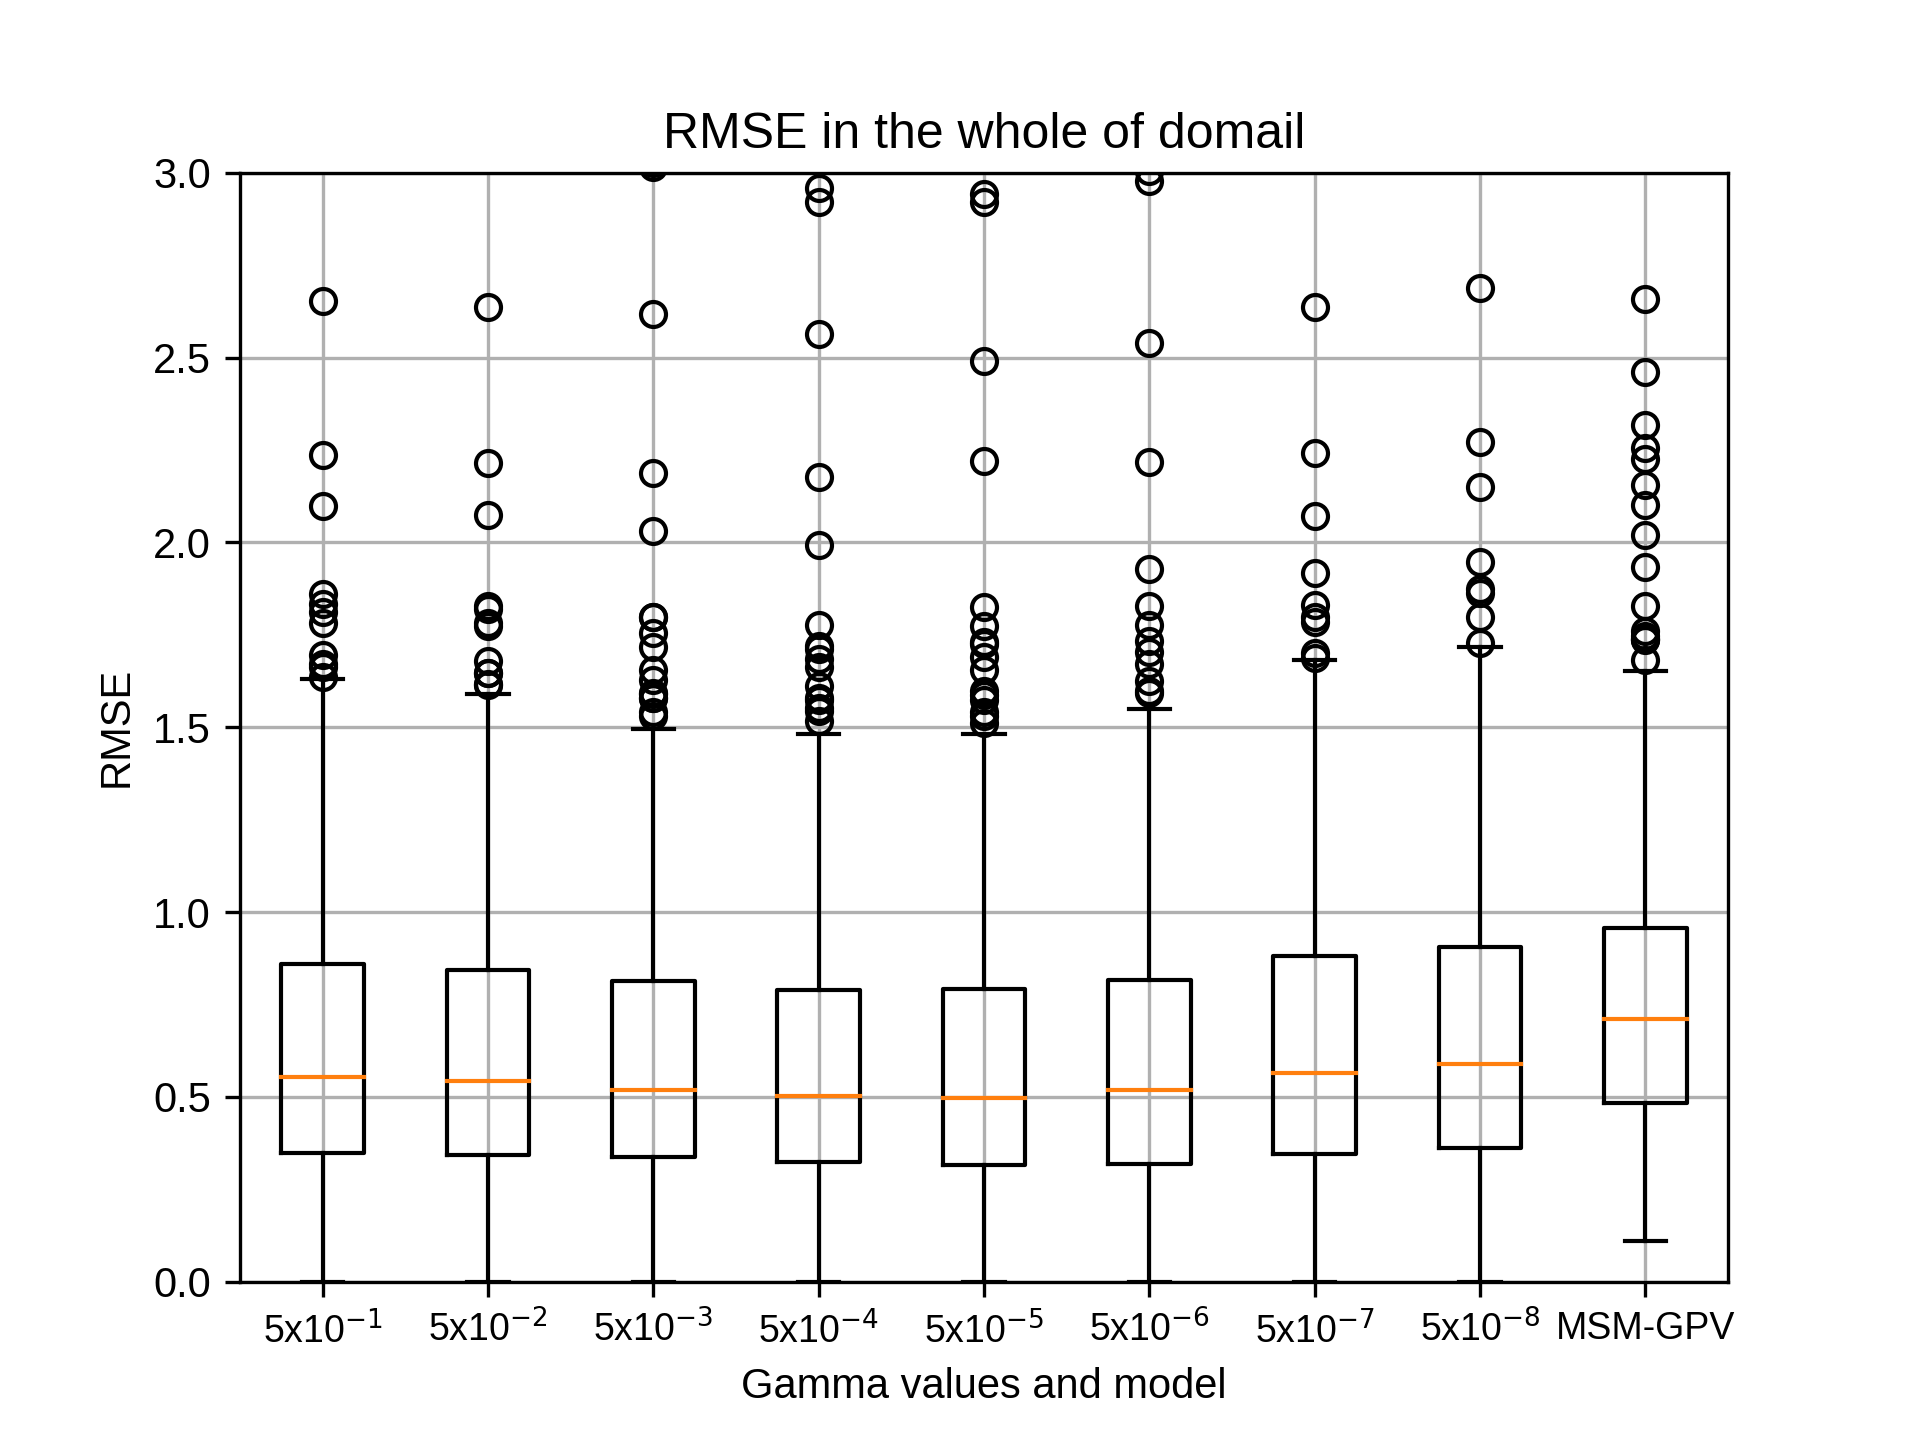
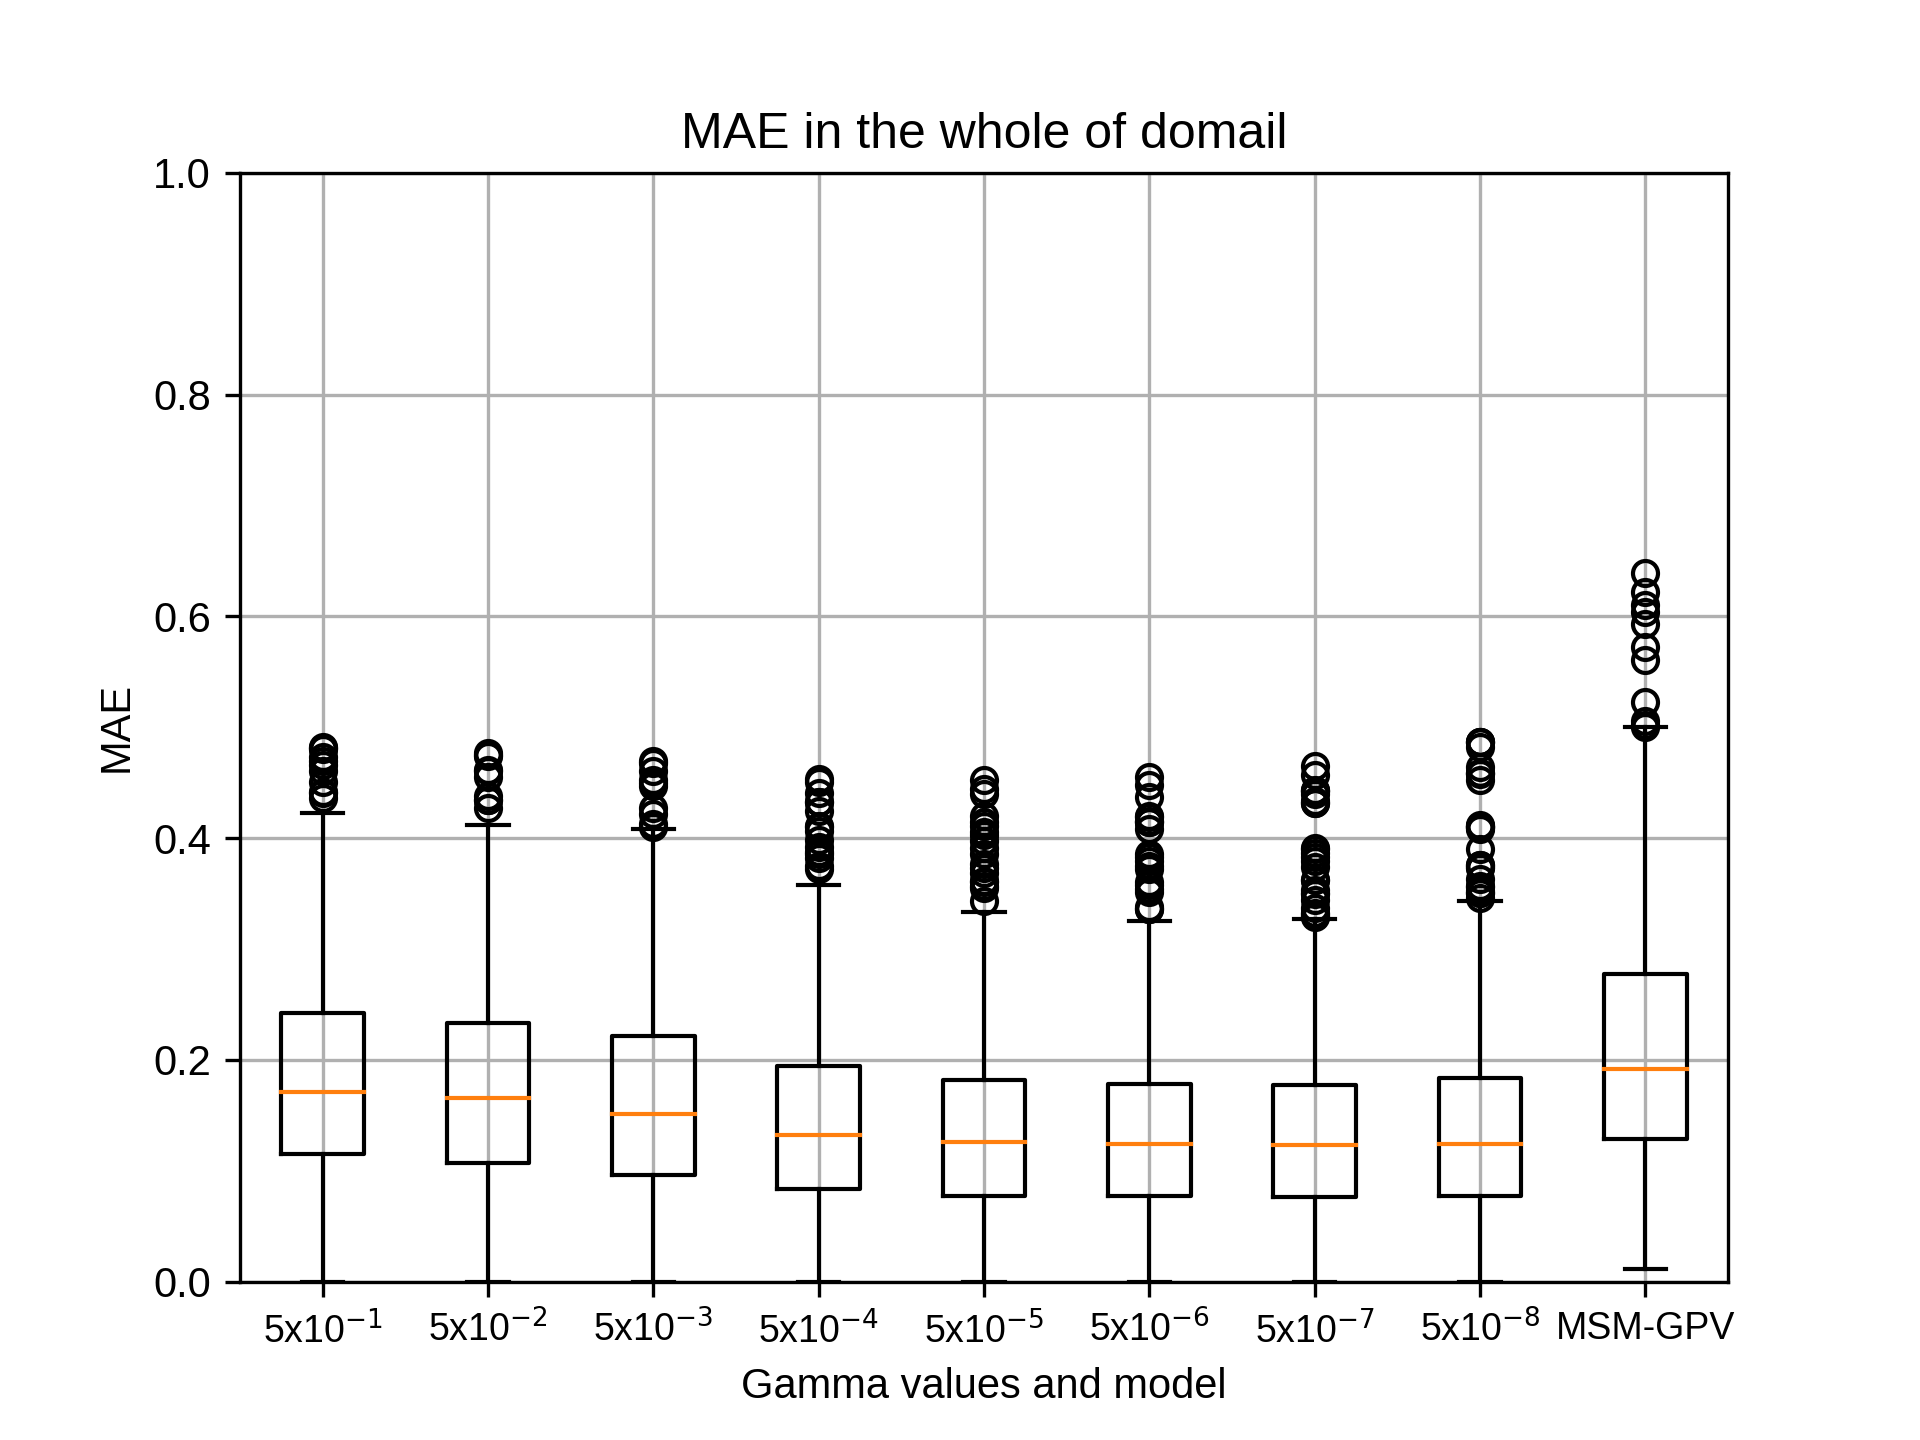
それぞれの結果のグラフは以下に示します。
吉兼先生
小林です。お世話になっております。
epsilonにつきまして結果が出ましたのでご報告いたします。
2007~2018年の7月の結果は添付のエクセルファイルのとおりです。
epsilonは変化させても相関係数の中央値はほとんど変わりませんでした。
(MAE,RMSEでepsilon=1.0のみ大きい値となっております)
siteA 0.001
siteB 0.001,0.0001,0.00001(同じ)
siteC 0.01,0.001,0.0001,0.00001(同じ)
siteD 0.001
siteE 0.0001,0.00001(同じ)
今回の手法は以下のとおりです。
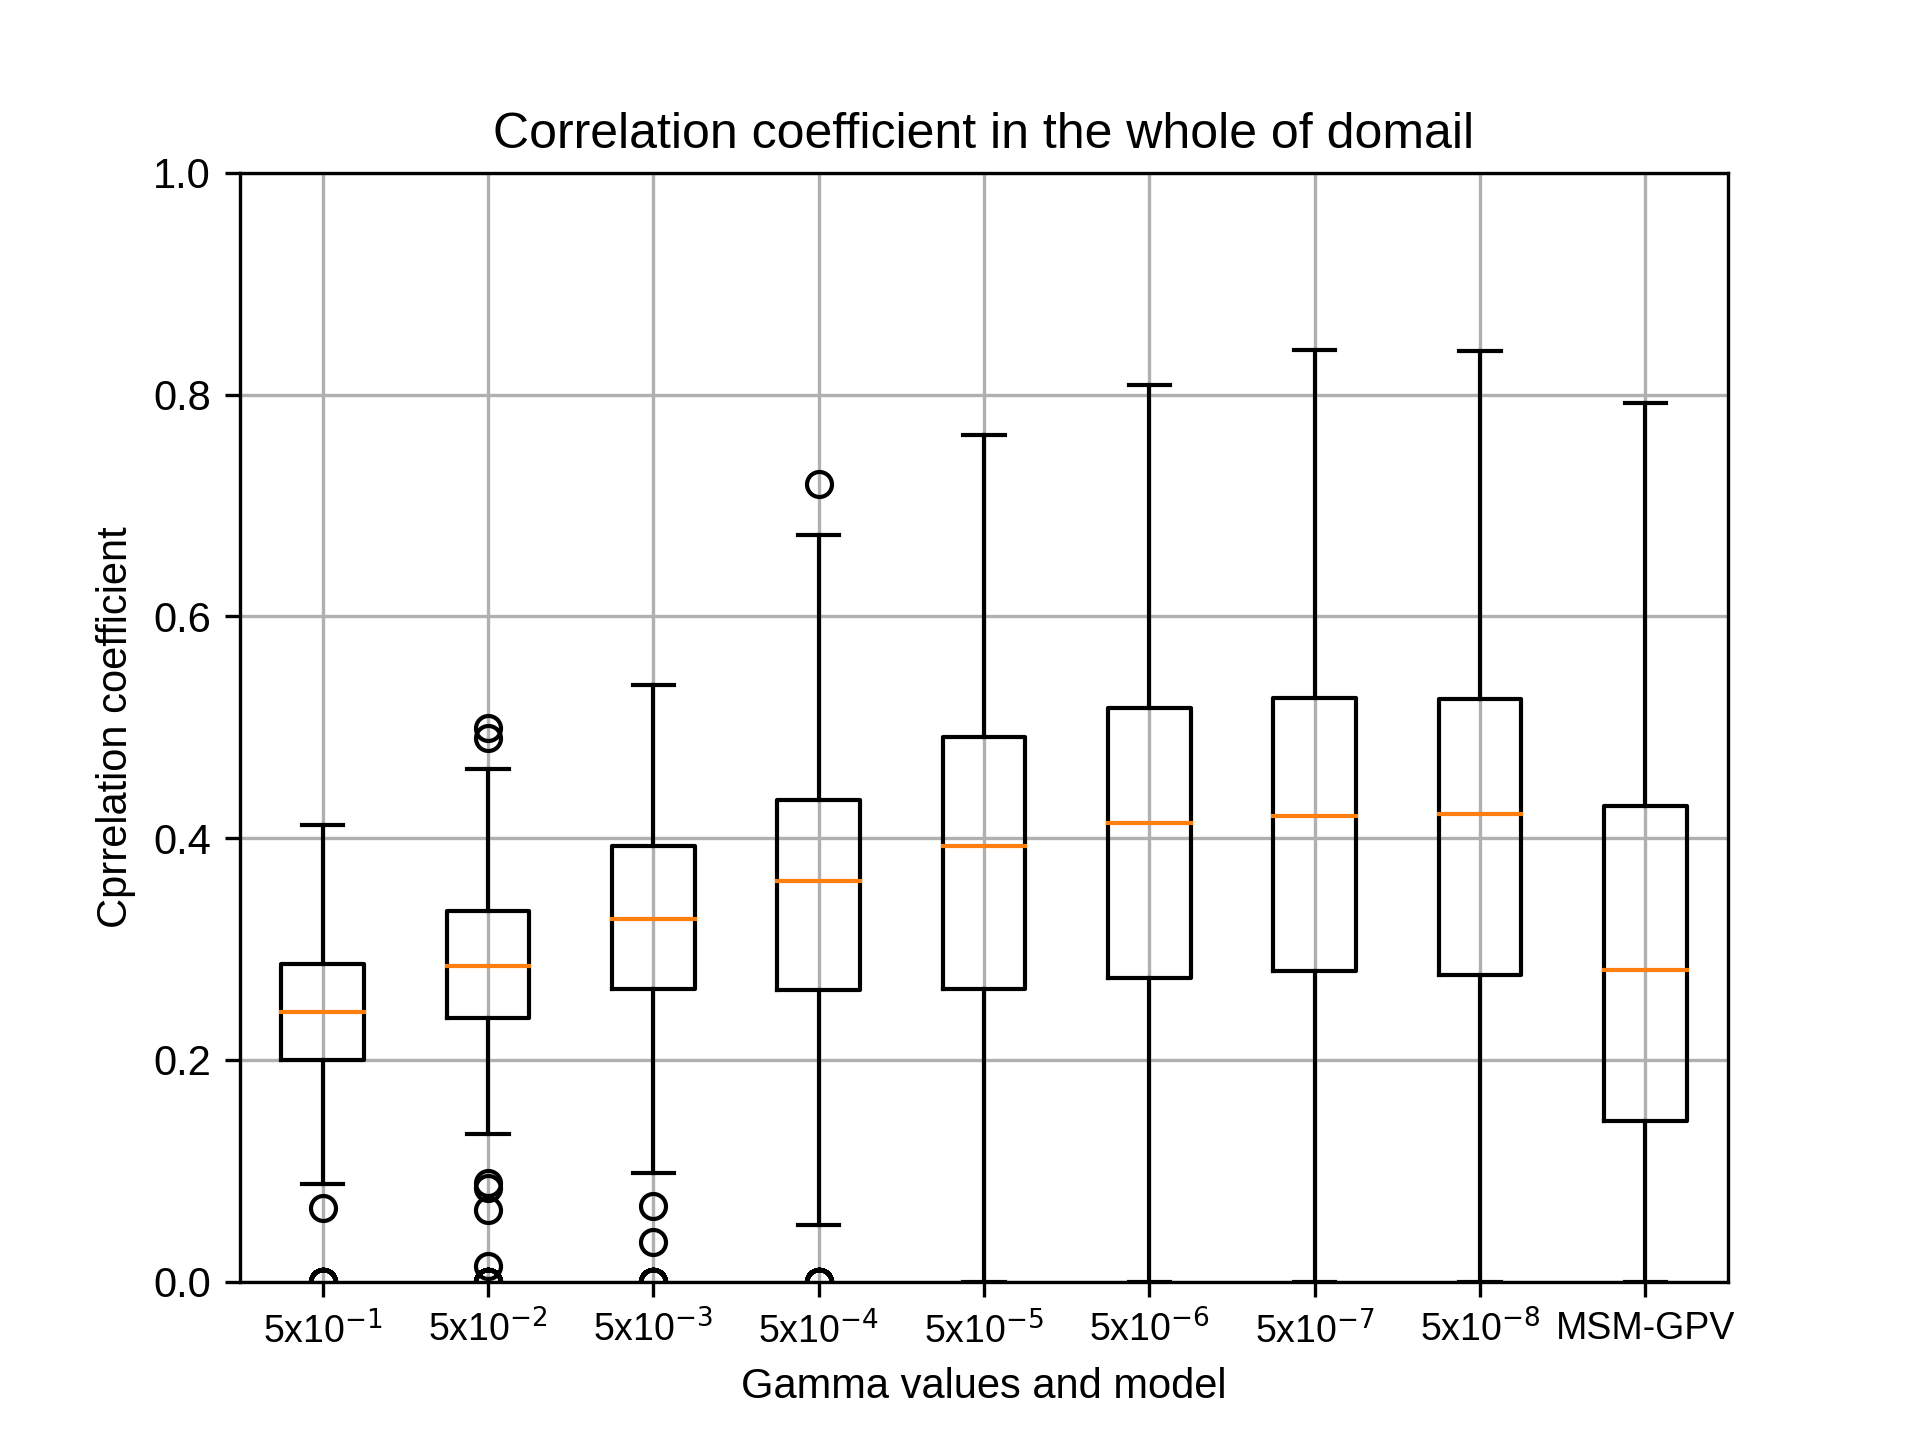
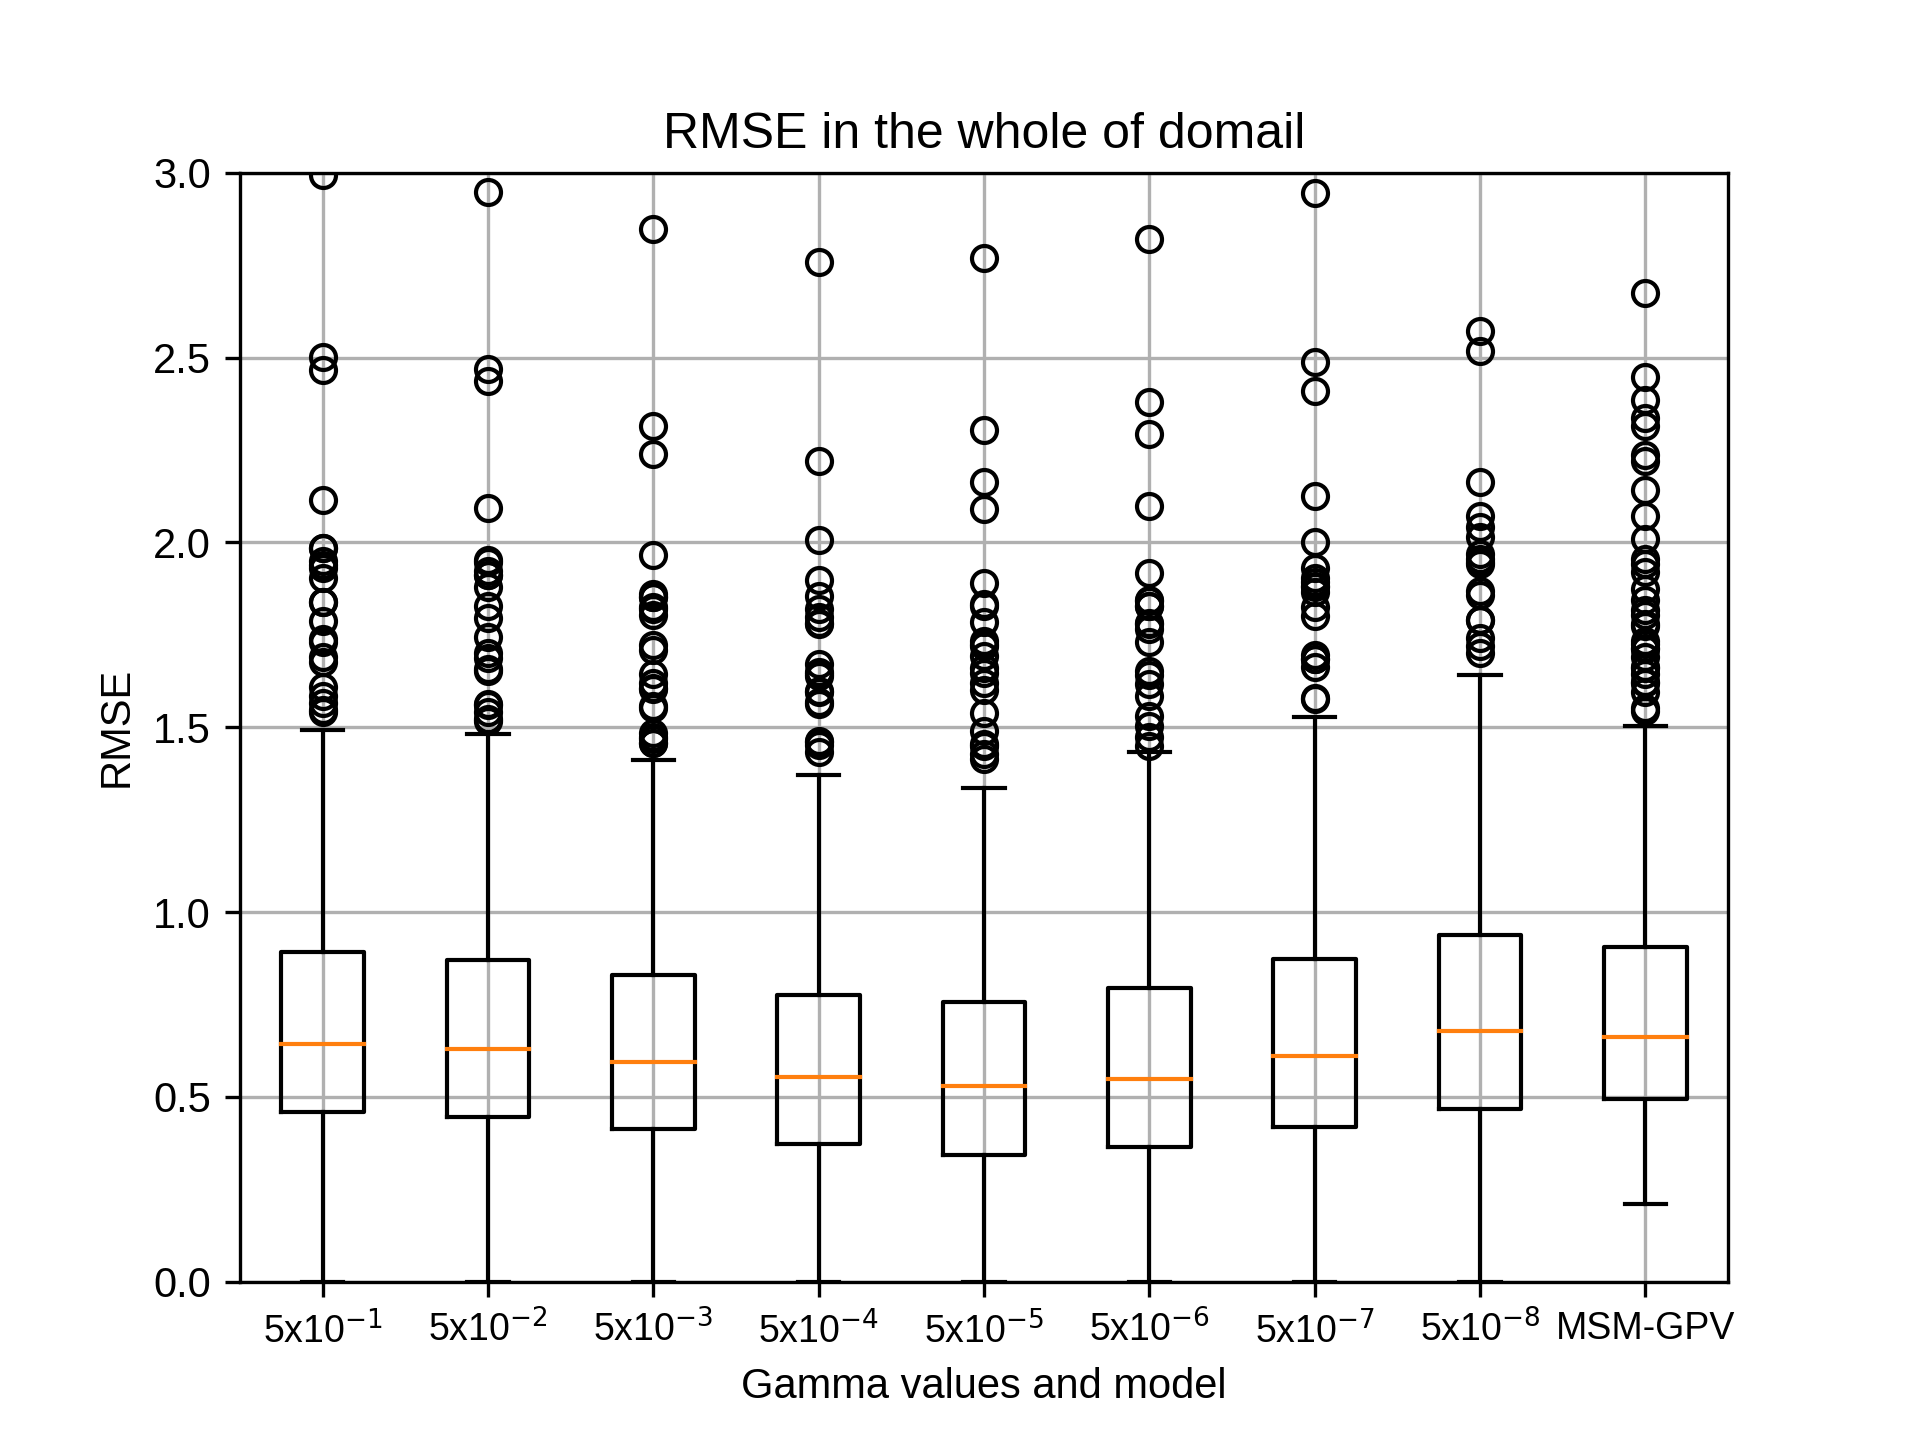
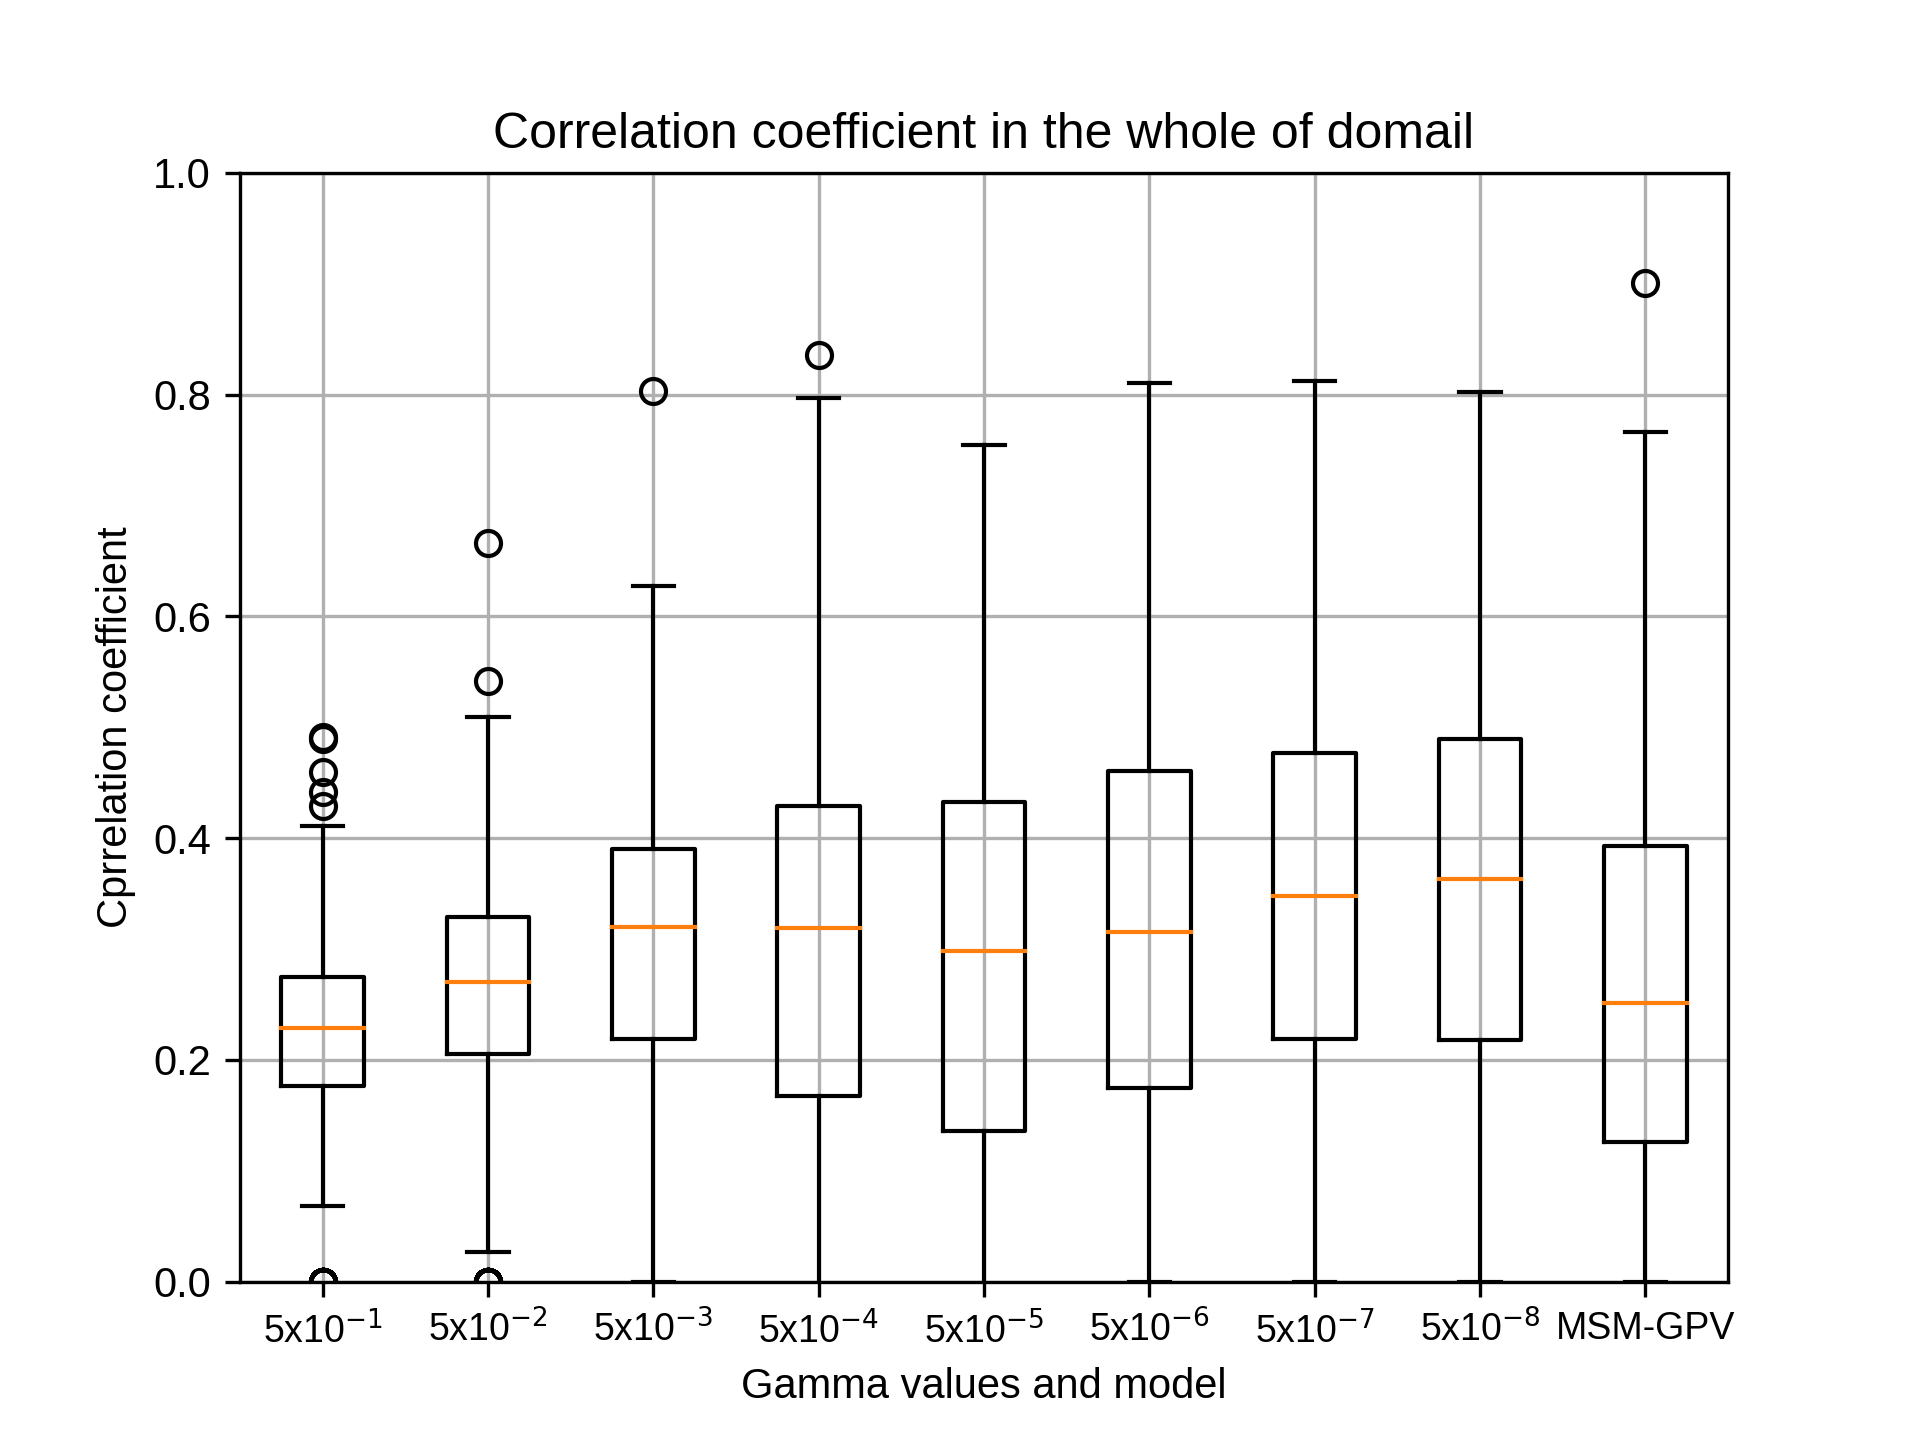
(1) cost=10, epsilon=0.001に固定し、gammaを'0.5 0.05 0.005 0.0005 0.00005 0.000005 0.0000005 0.00000005'と変化させ、相関係数の中央値が最も高いgammaを採用
(2) gammaを(1)で定めた値、epsilon=0.001に固定し、costを'50 40 30 20 10 8 6 4 2 1'と変化させ、相関係数の中央値が最も高いcostを採用
(3) gammaを(1)で定めた値、costを(2)で定めた値とし、epsilonを'1.0 0.1 0.01 0.001 0.0001 0.00001'と変化させ、相関係数の中央値が最も高いepsilonを採用
それぞれの結果のグラフは以下に示します。
kobayashi_yusukeMonday, September 14th, 2020 at 3:02:41 PM GMT+09:00
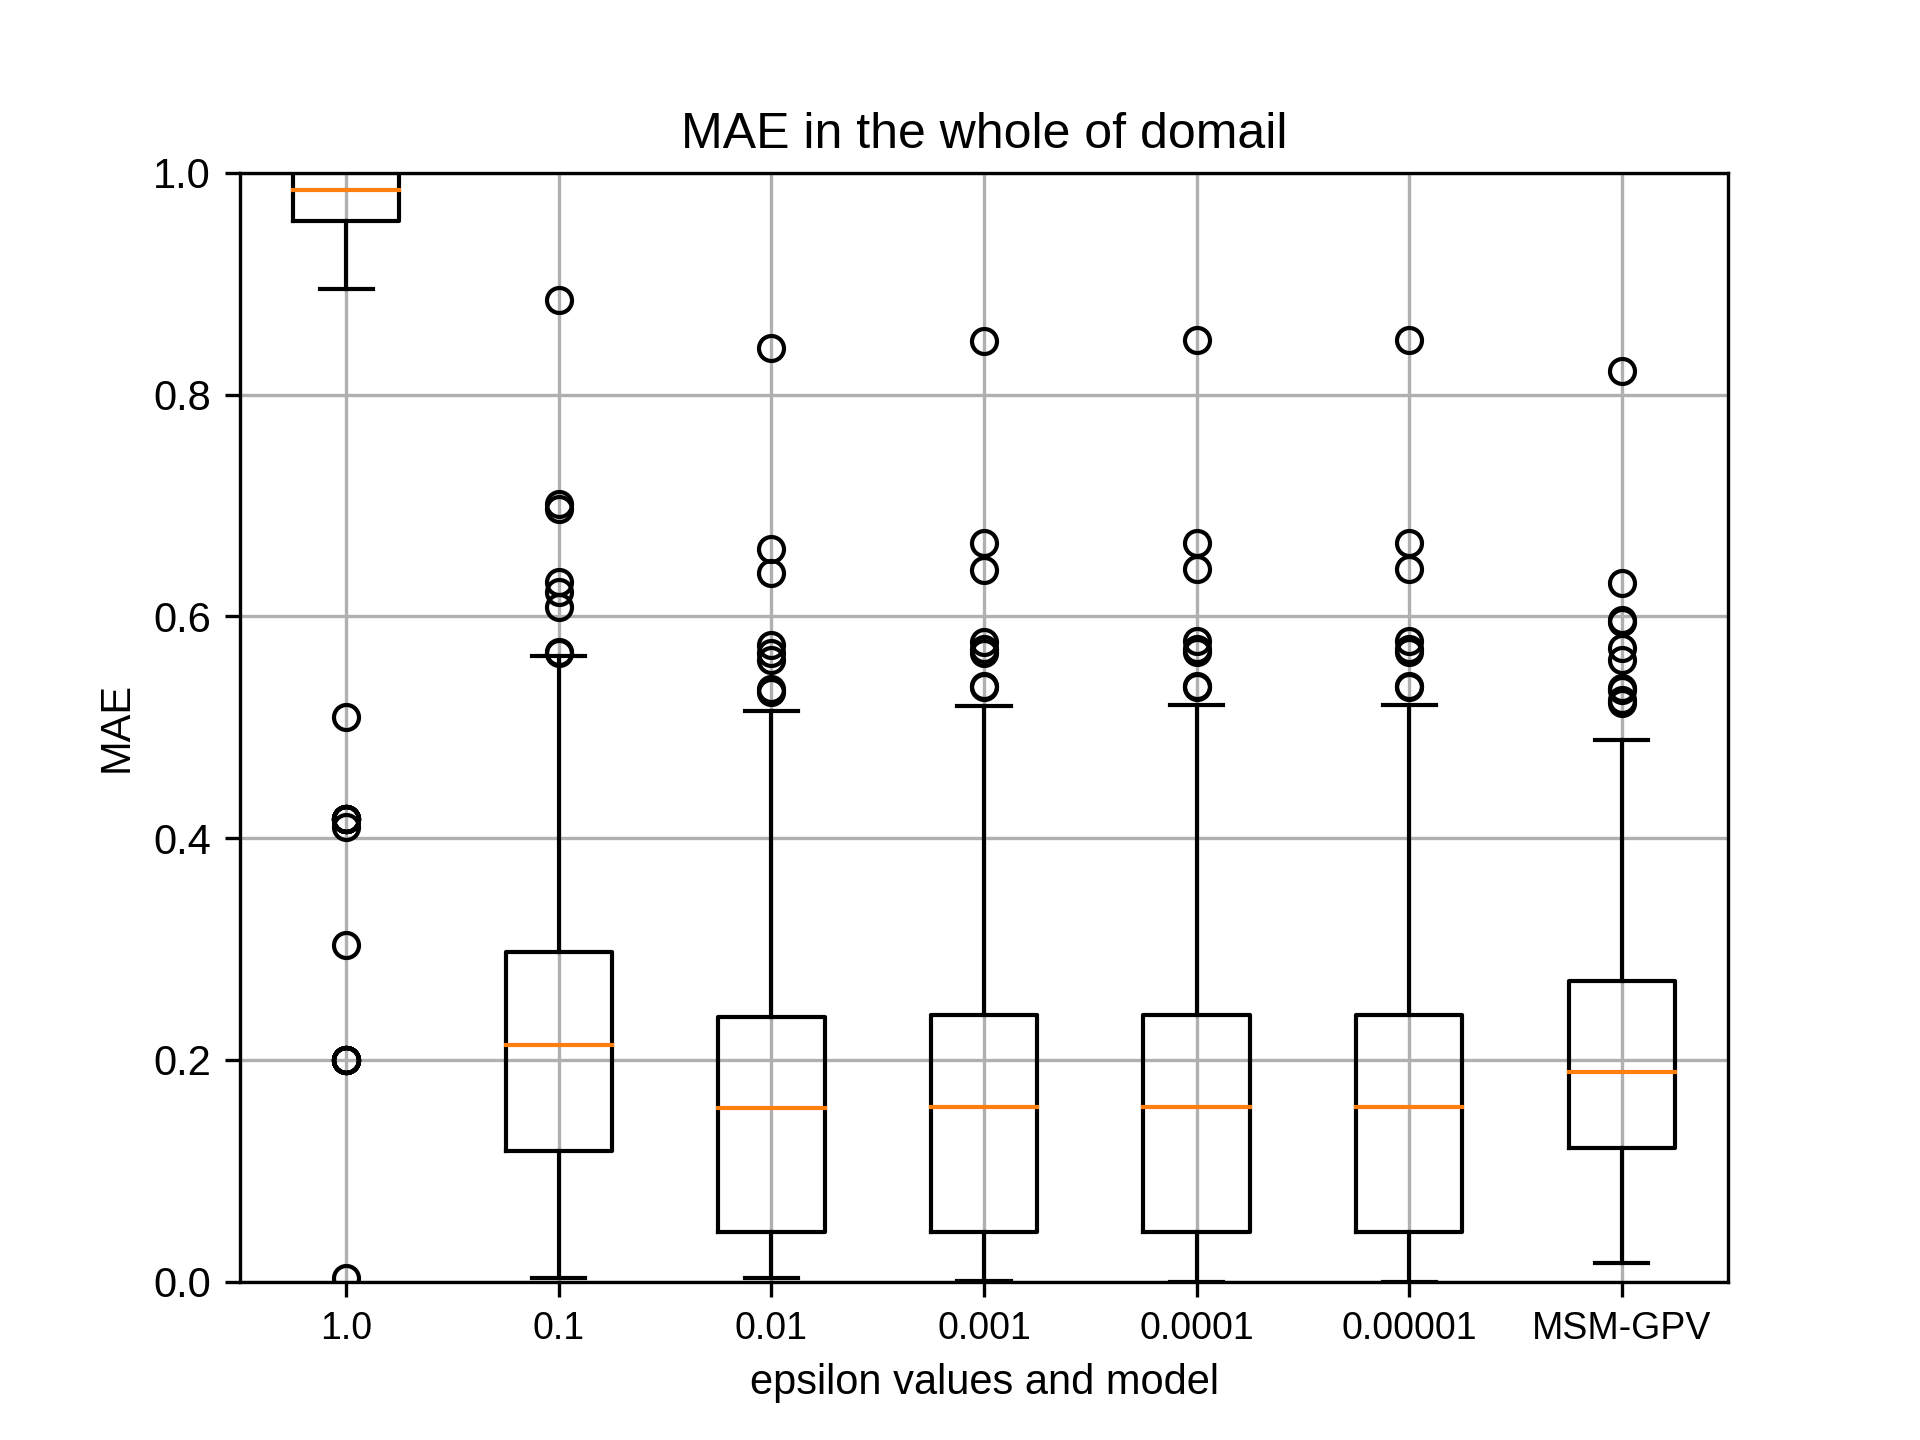
7月のsiteAのepsilonのグラフは添付のとおりです。epsilonを変化させても相関係数の中央値はほとんど変わりませんでしたが、その中で最も高かったのは0.001です。
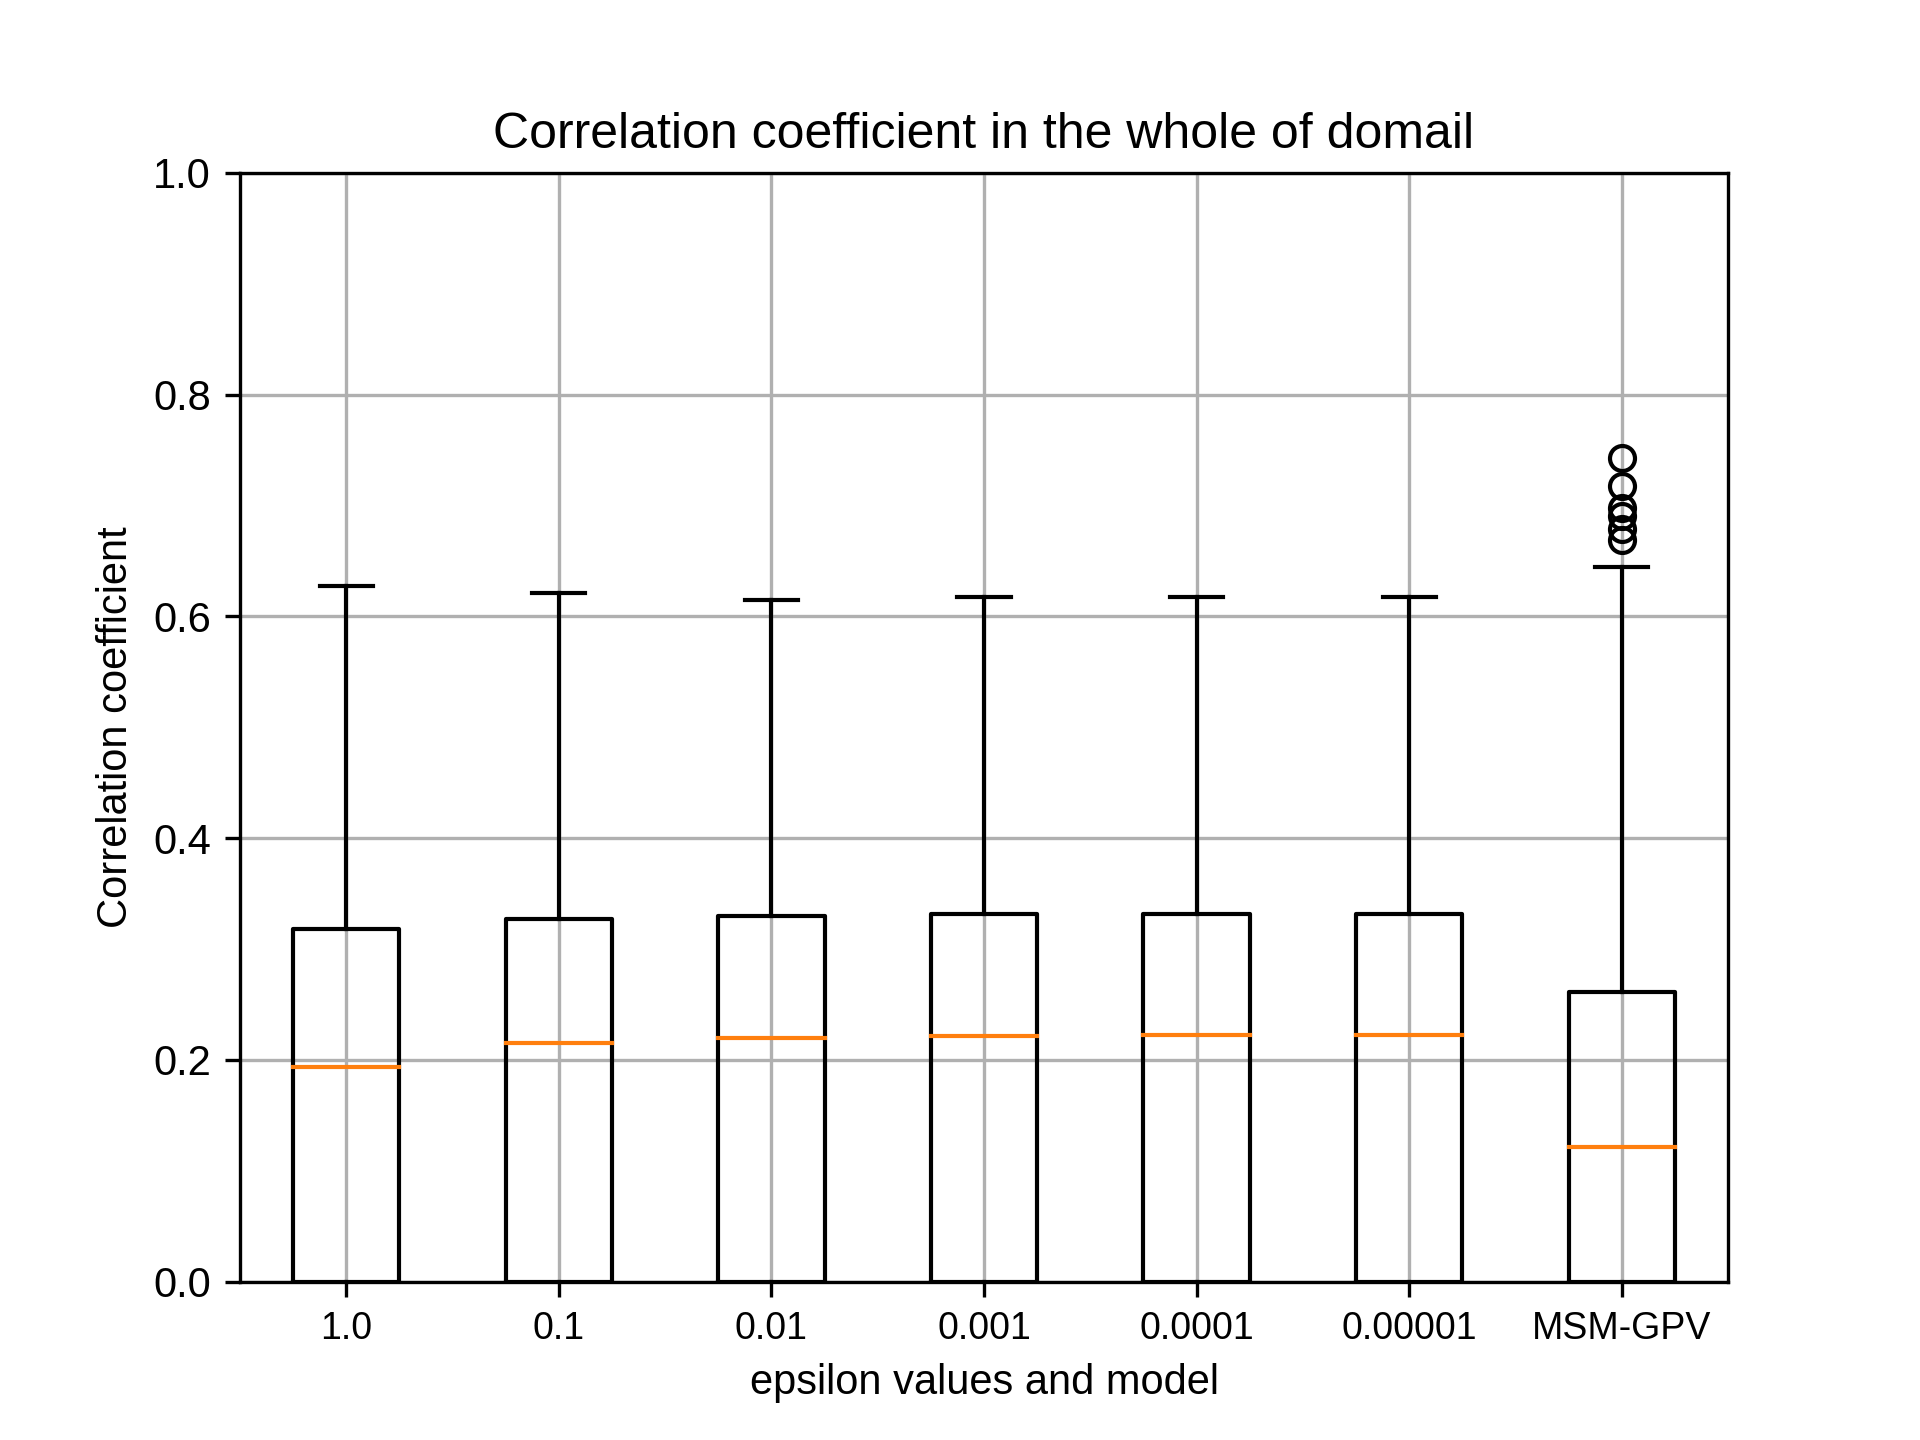
kobayashi_yusukeMonday, September 14th, 2020 at 3:03:56 PM GMT+09:00
7月のsiteBのepsilonのグラフは添付のとおりです。epsilonを変化させても相関係数の中央値はほとんど変わりませんでしたが、その中で0.001,0.0001,0.00001が同じで最も高くなりました。
kobayashi_yusukeMonday, September 14th, 2020 at 3:36:27 PM GMT+09:00
7月のsiteCのepsilonのグラフは添付のとおりです。epsilonを変化させても相関係数の中央値はほとんど変わりませんでしたが、その中で0.01,0.001,0.0001,0.00001が同じで最も高くなりました。
kobayashi_yusukeMonday, September 14th, 2020 at 3:38:06 PM GMT+09:00
7月のsiteDのepsilonのグラフは添付のとおりです。epsilonを変化させても相関係数の中央値はほとんど変わりませんでしたが、その中で最も高かったのは0.001です。
kobayashi_yusukeMonday, September 14th, 2020 at 3:40:23 PM GMT+09:00
7月のsiteEのepsilonのグラフは添付のとおりです。epsilonを変化させても相関係数の中央値はほとんど変わりませんでしたが、その中で0.0001,0.00001が同じで最も高くなりました。
最初のエクセルのまとめ、並びに各結果のグラフをご確認いただけると幸いです。
以上、よろしくお願いいたします。
最初のエクセルのまとめ、並びに各結果のグラフをご確認いただけると幸いです。
以上、よろしくお願いいたします。
takao-yMonday, September 14th, 2020 at 3:45:15 PM GMT+09:00
@kobayashi_yusuke
小林様。ありがとうございます。ここで推定されたCとepsilonの最適値を用いて、もう一度gamma値について計算していただけますでしょうか。その結果をみた後で特に大きな変化がなければ、ハイパーパラメータを決定して良いかと思います。
小林様。ありがとうございます。ここで推定されたCとepsilonの最適値を用いて、もう一度gamma値について計算していただけますでしょうか。その結果をみた後で特に大きな変化がなければ、ハイパーパラメータを決定して良いかと思います。
kobayashi_yusukeMonday, September 14th, 2020 at 4:08:11 PM GMT+09:00
@takao-y
吉兼先生
お返事ありがとうございます。今回推定されたCとepsilonを用いて、再度gamma値を計算いたします。その際のepsilonにつきまして、siteB,C,Eで最大が同値のため、以下のようにさせていただきます。
siteB:0.0001 (0.001,0.0001,0.00001で同じ)
siteC: 0.001 (0.01,0.001,0.0001,0.00001で同じ)
siteE 0.0001 (0.0001,0.00001で同じ)
結果が出ましたらご連絡いたします。
よろしくお願いいたします。
吉兼先生
お返事ありがとうございます。今回推定されたCとepsilonを用いて、再度gamma値を計算いたします。その際のepsilonにつきまして、siteB,C,Eで最大が同値のため、以下のようにさせていただきます。
siteB:0.0001 (0.001,0.0001,0.00001で同じ)
siteC: 0.001 (0.01,0.001,0.0001,0.00001で同じ)
siteE 0.0001 (0.0001,0.00001で同じ)
結果が出ましたらご連絡いたします。
よろしくお願いいたします。
takao-yTuesday, September 15th, 2020 at 12:31:40 PM GMT+09:00
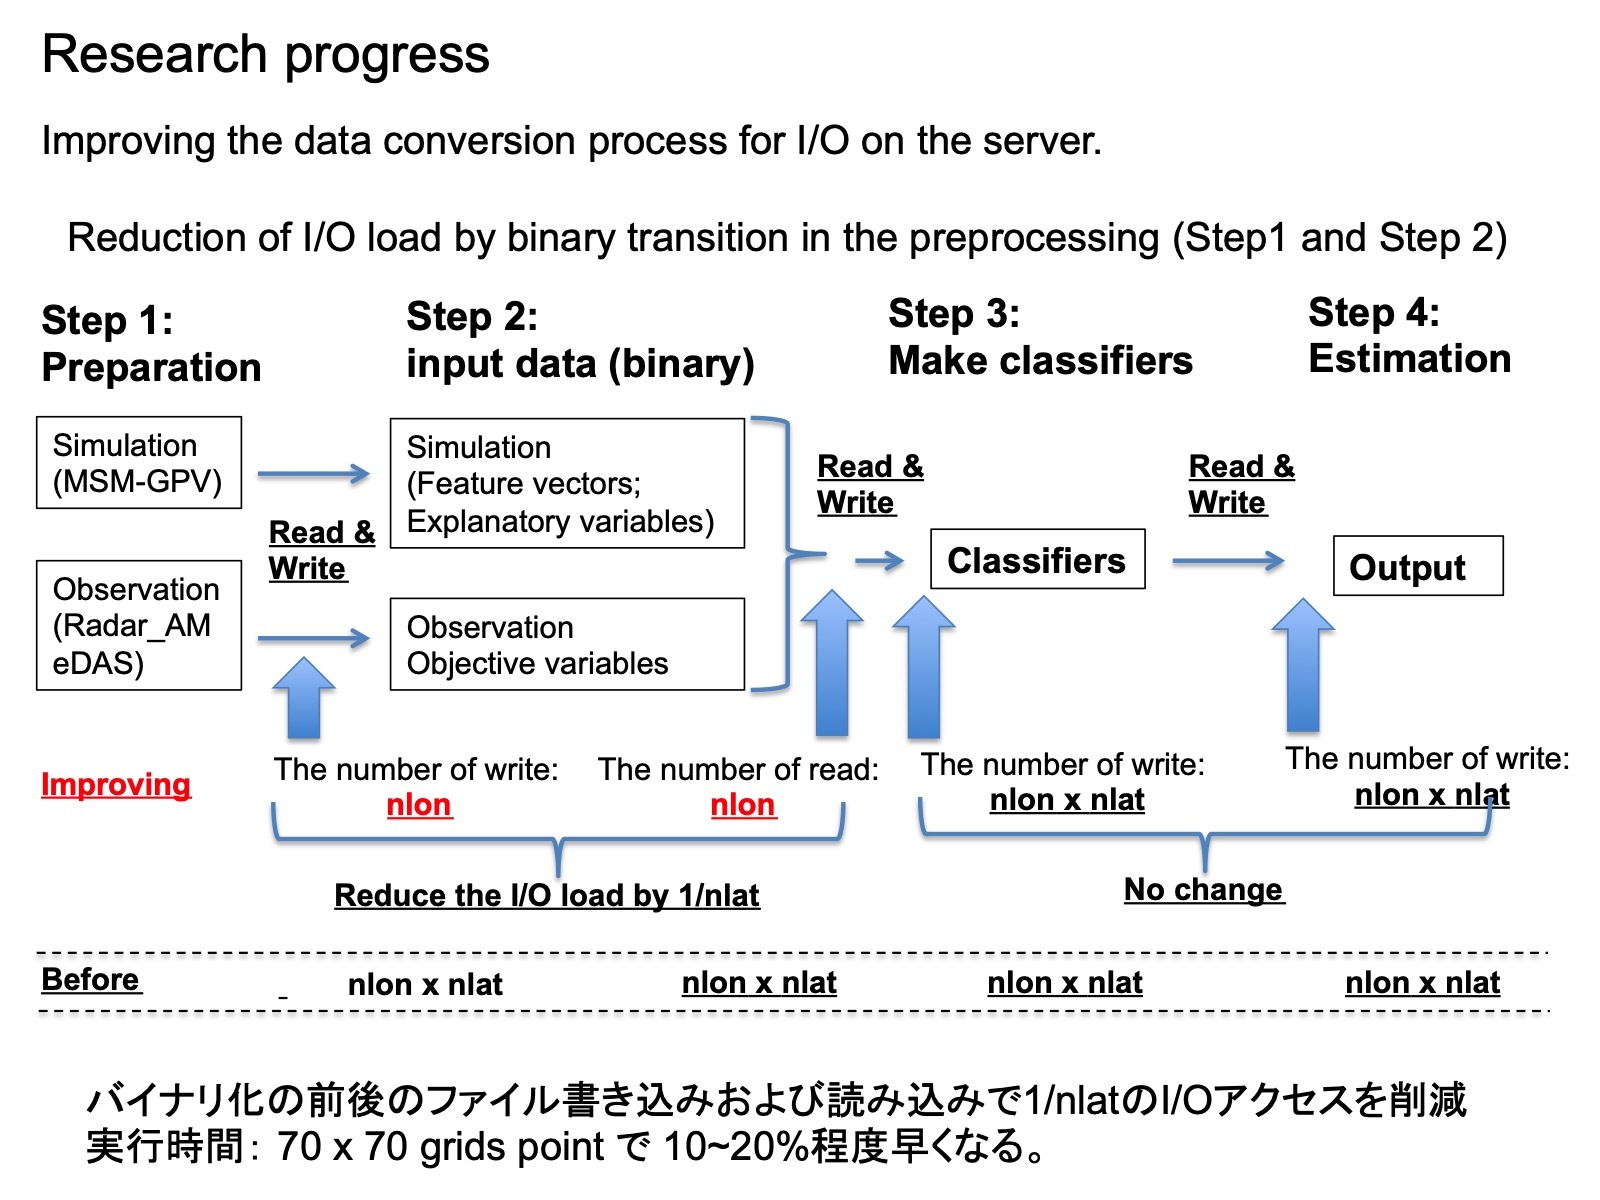
機械学習の入出力のバイナリ化ですが、概要図を添付します。
バイナリ化の前後でI/Oのアクセス数が1/nlat(緯度方向のグリッド数)になっており、書き込み遅延などによるサーバーへの負担を大幅に軽減できると思います。実行時間に関しては、今回70x70の領域で実施した結果、以前よりも10~20%程度早くなっていました。実行時間の大半が、識別機の作成であることを考慮すると、それほど時間短縮にはなっていません。ただ、同時並行数を増やすことによって、結果的に時間を短縮になるのではと考えています。
とりあえず、ソースコードを以下に置きました。時間があるときに試していただければ幸いです。
https://www.dropbox.com/s/x7r62s6z5960kkc/ml-region1-all-20200915.tar.gz?dl=0
kobayashi_yusukeTuesday, September 15th, 2020 at 7:49:47 PM GMT+09:00

@takao-y
吉兼先生
小林です。お世話になっております。
gammaにつきまして再解析した結果が出ましたのでご報告いたします。
結果はsiteA~siteEまですべて当初採用したgamma値が相関係数の中央値の最大でした。
cost,epsilon値等詳細は添付のエクセルファイルをご参照ください。
対象は、2007~2018年の7月です。
手法は以下のとおりです。
(1) cost=10, epsilon=0.001に固定し、gammaを'0.5 0.05 0.005 0.0005 0.00005 0.000005 0.0000005 0.00000005'と変化させ、相関係数の中央値が最も高いgammaを採用
(2) gammaを(1)で定めた値、epsilon=0.001に固定し、costを'50 40 30 20 10 8 6 4 2 1'と変化させ、相関係数の中央値が最も高いcostを採用
(3) gammaを(1)で定めた値、costを(2)で定めた値とし、epsilonを'1.0 0.1 0.01 0.001 0.0001 0.00001'と変化させ、相関係数の中央値が最も高いepsilonを採用
(4) costを(2)で定めた値、epsilonを(3)で定めた値とし、gammaを'0.5 0.05 0.005 0.0005 0.00005 0.000005 0.0000005 0.00000005'と変化させて再計算を行い、相関係数の中央値が最も高いgammaを確認
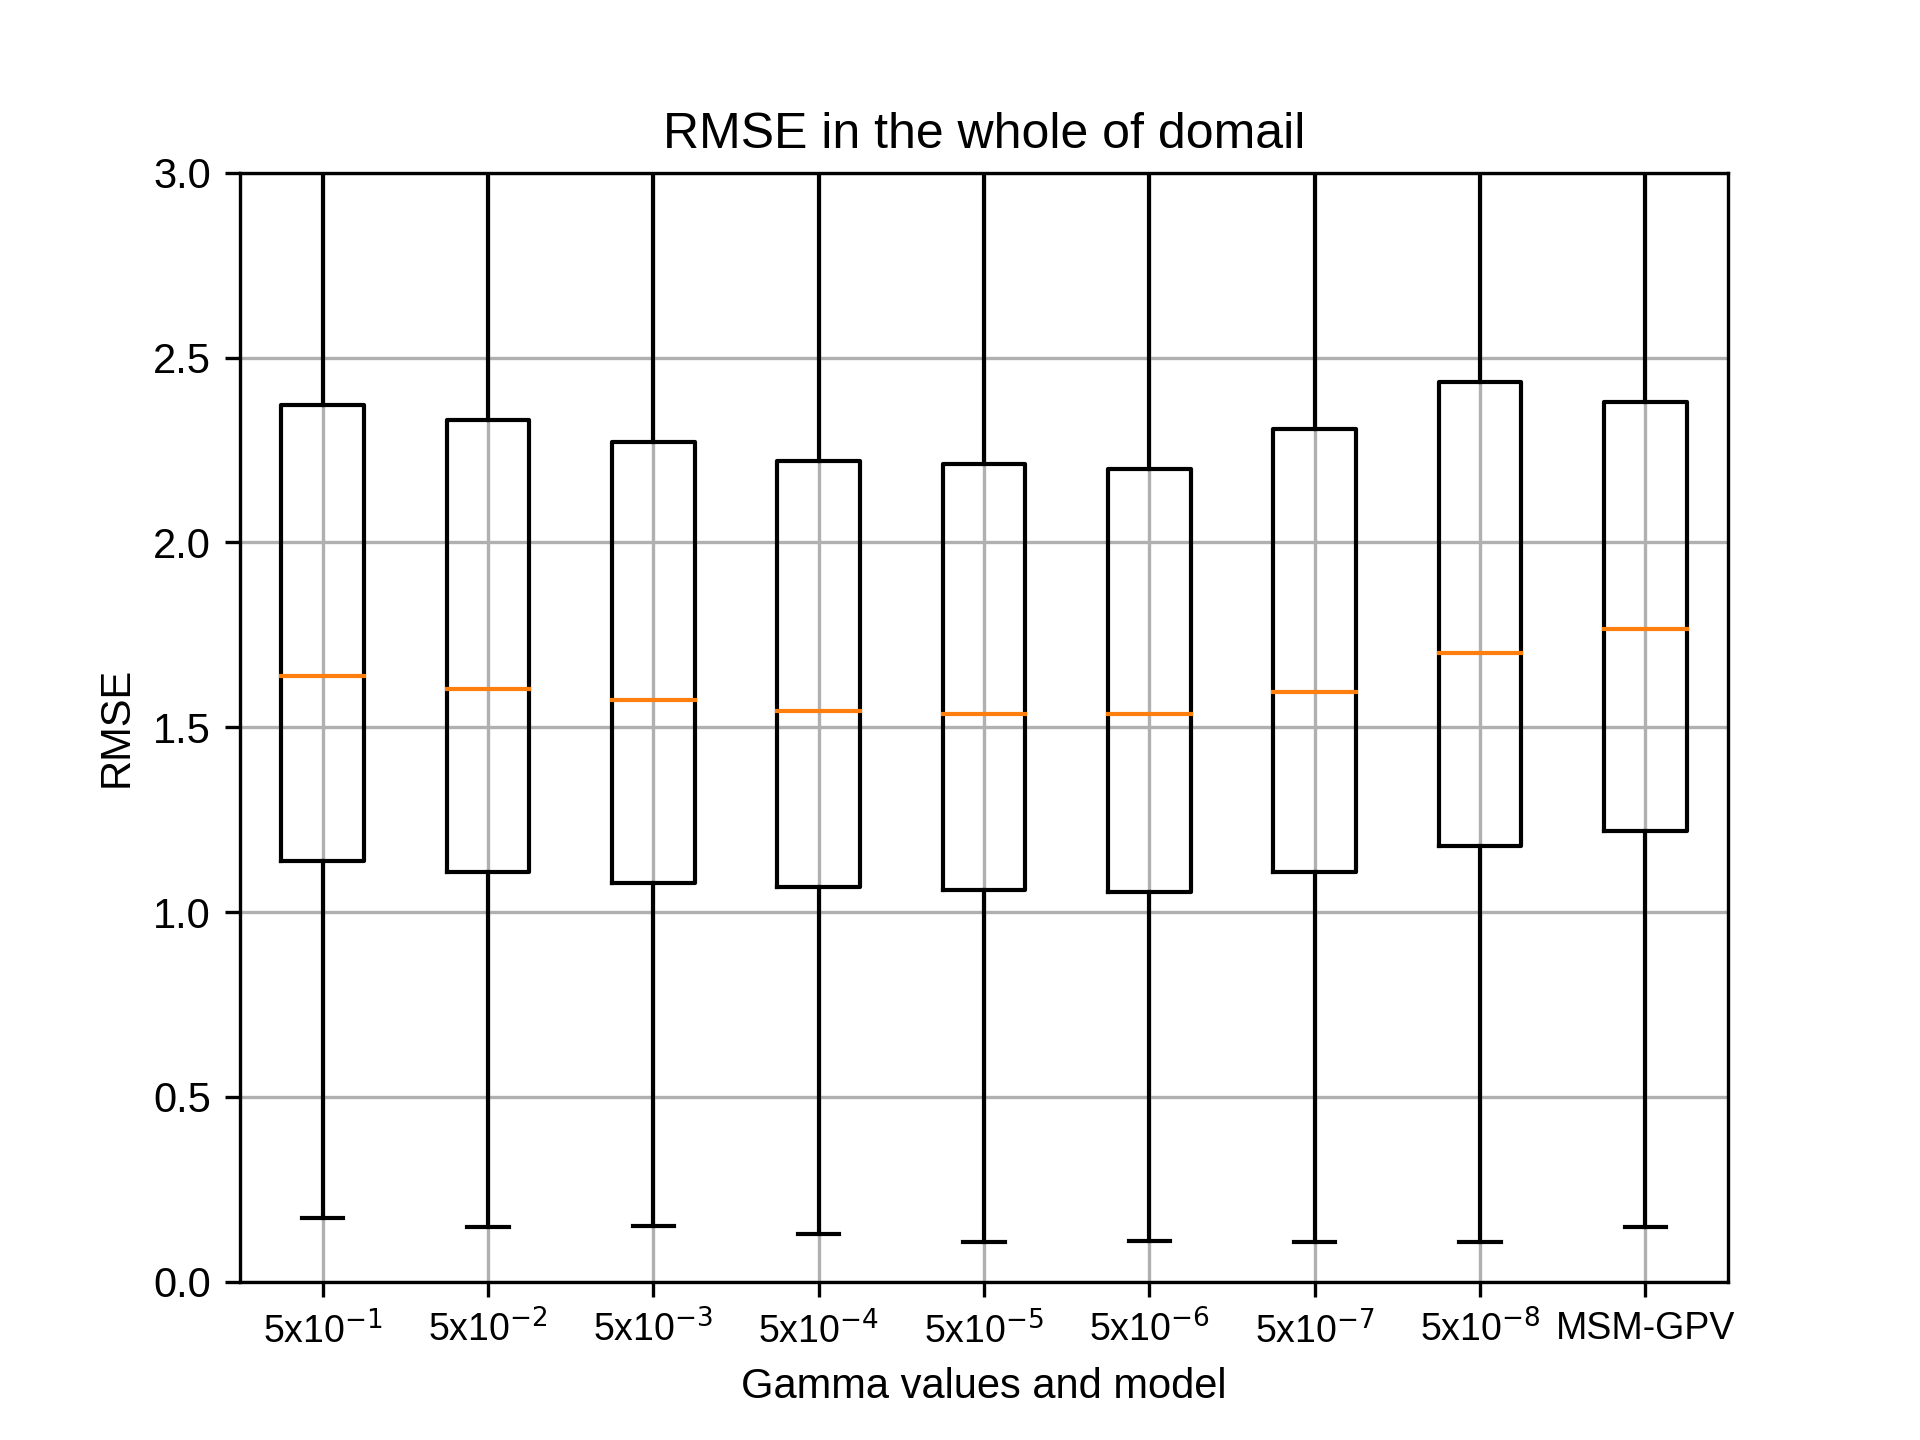
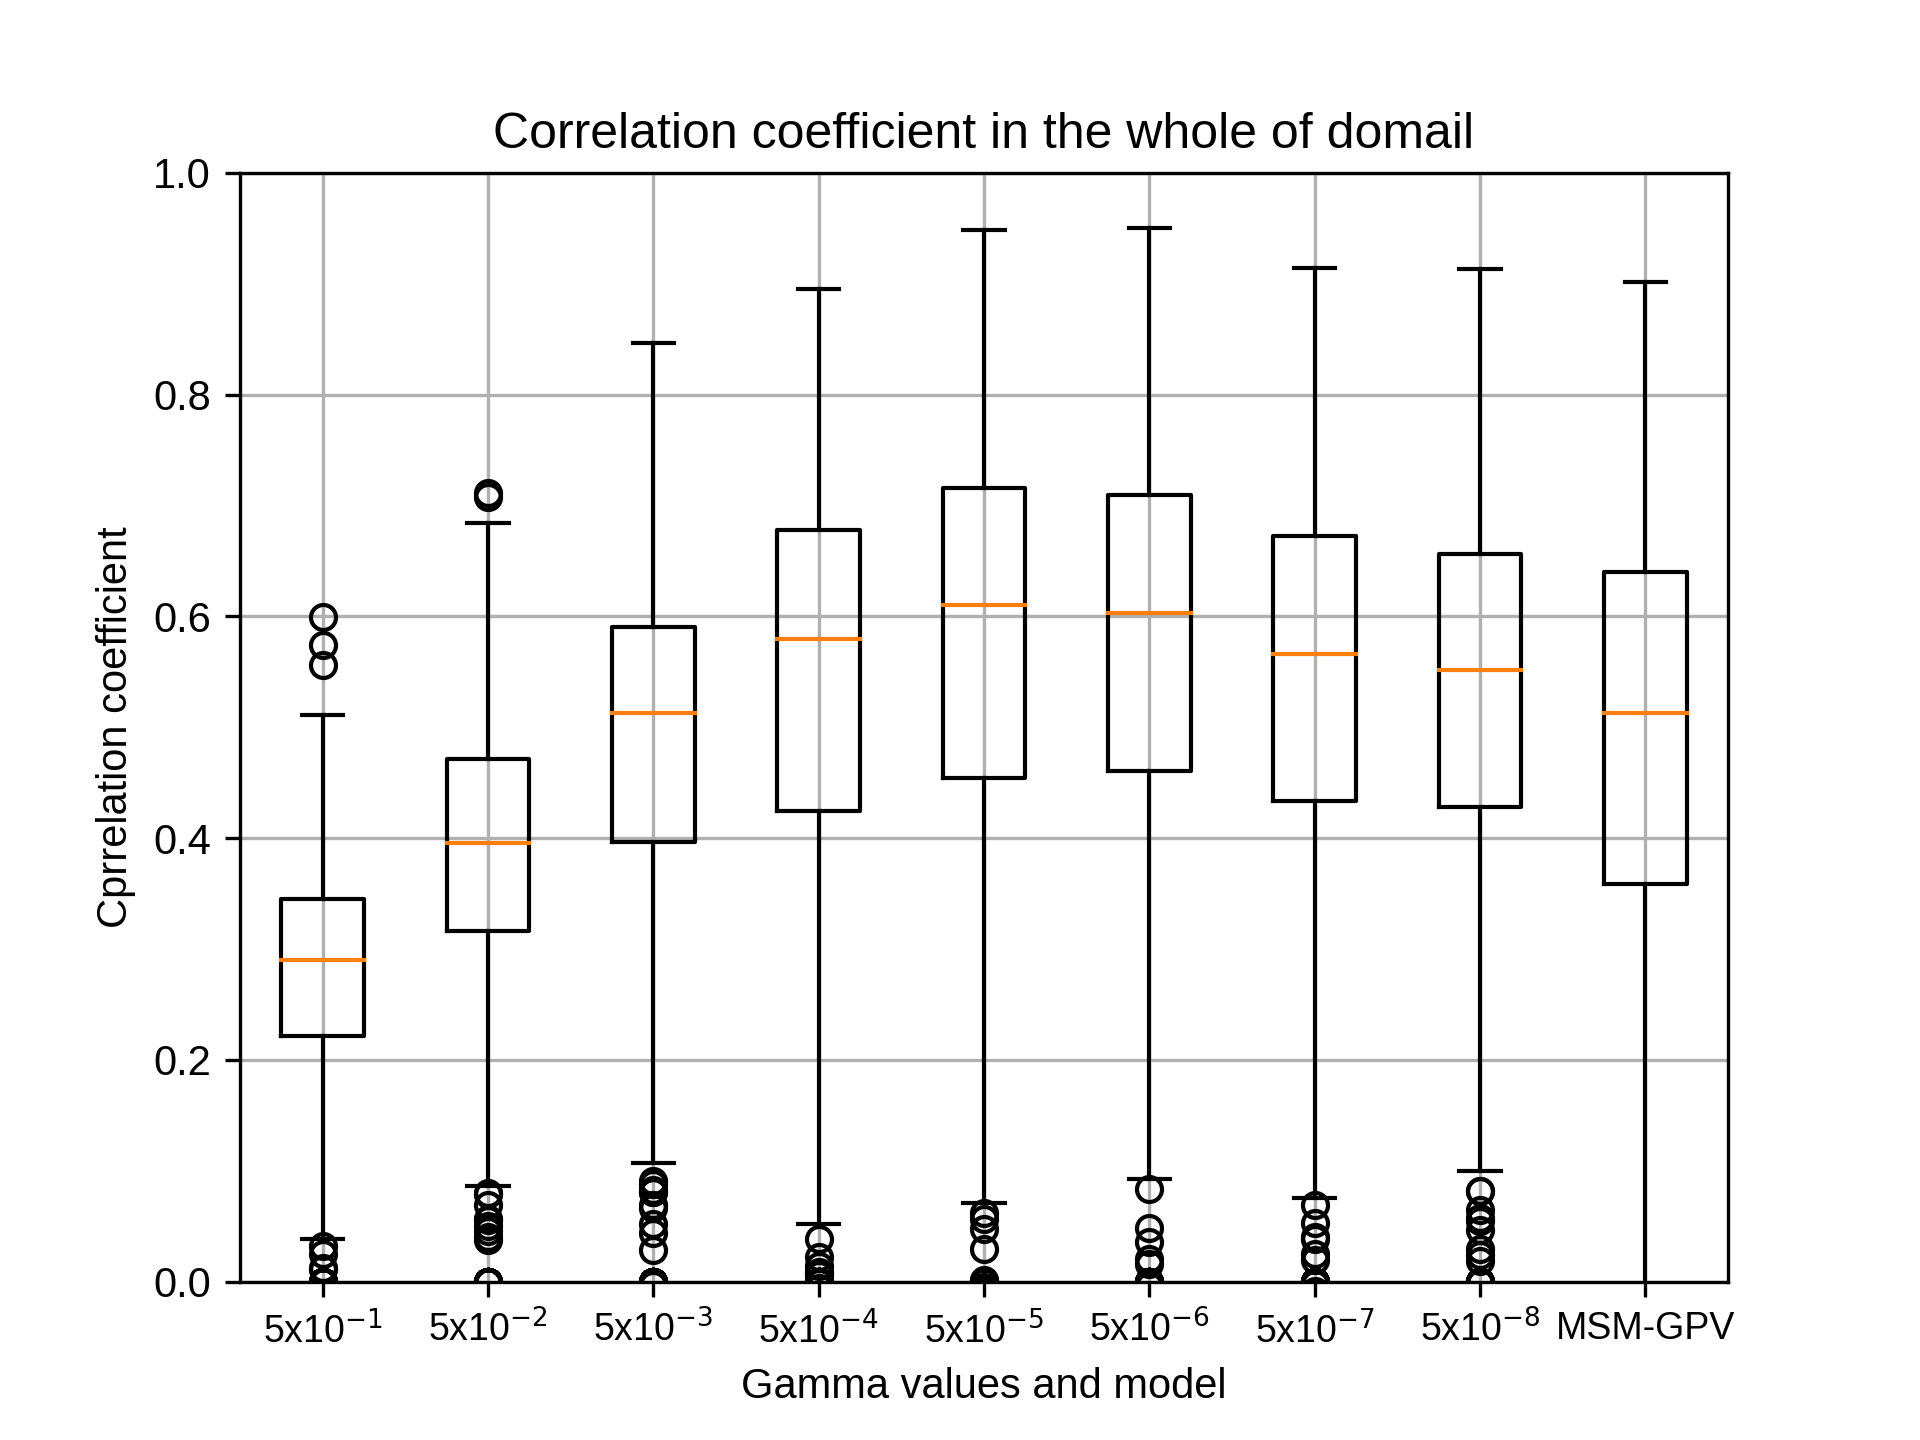
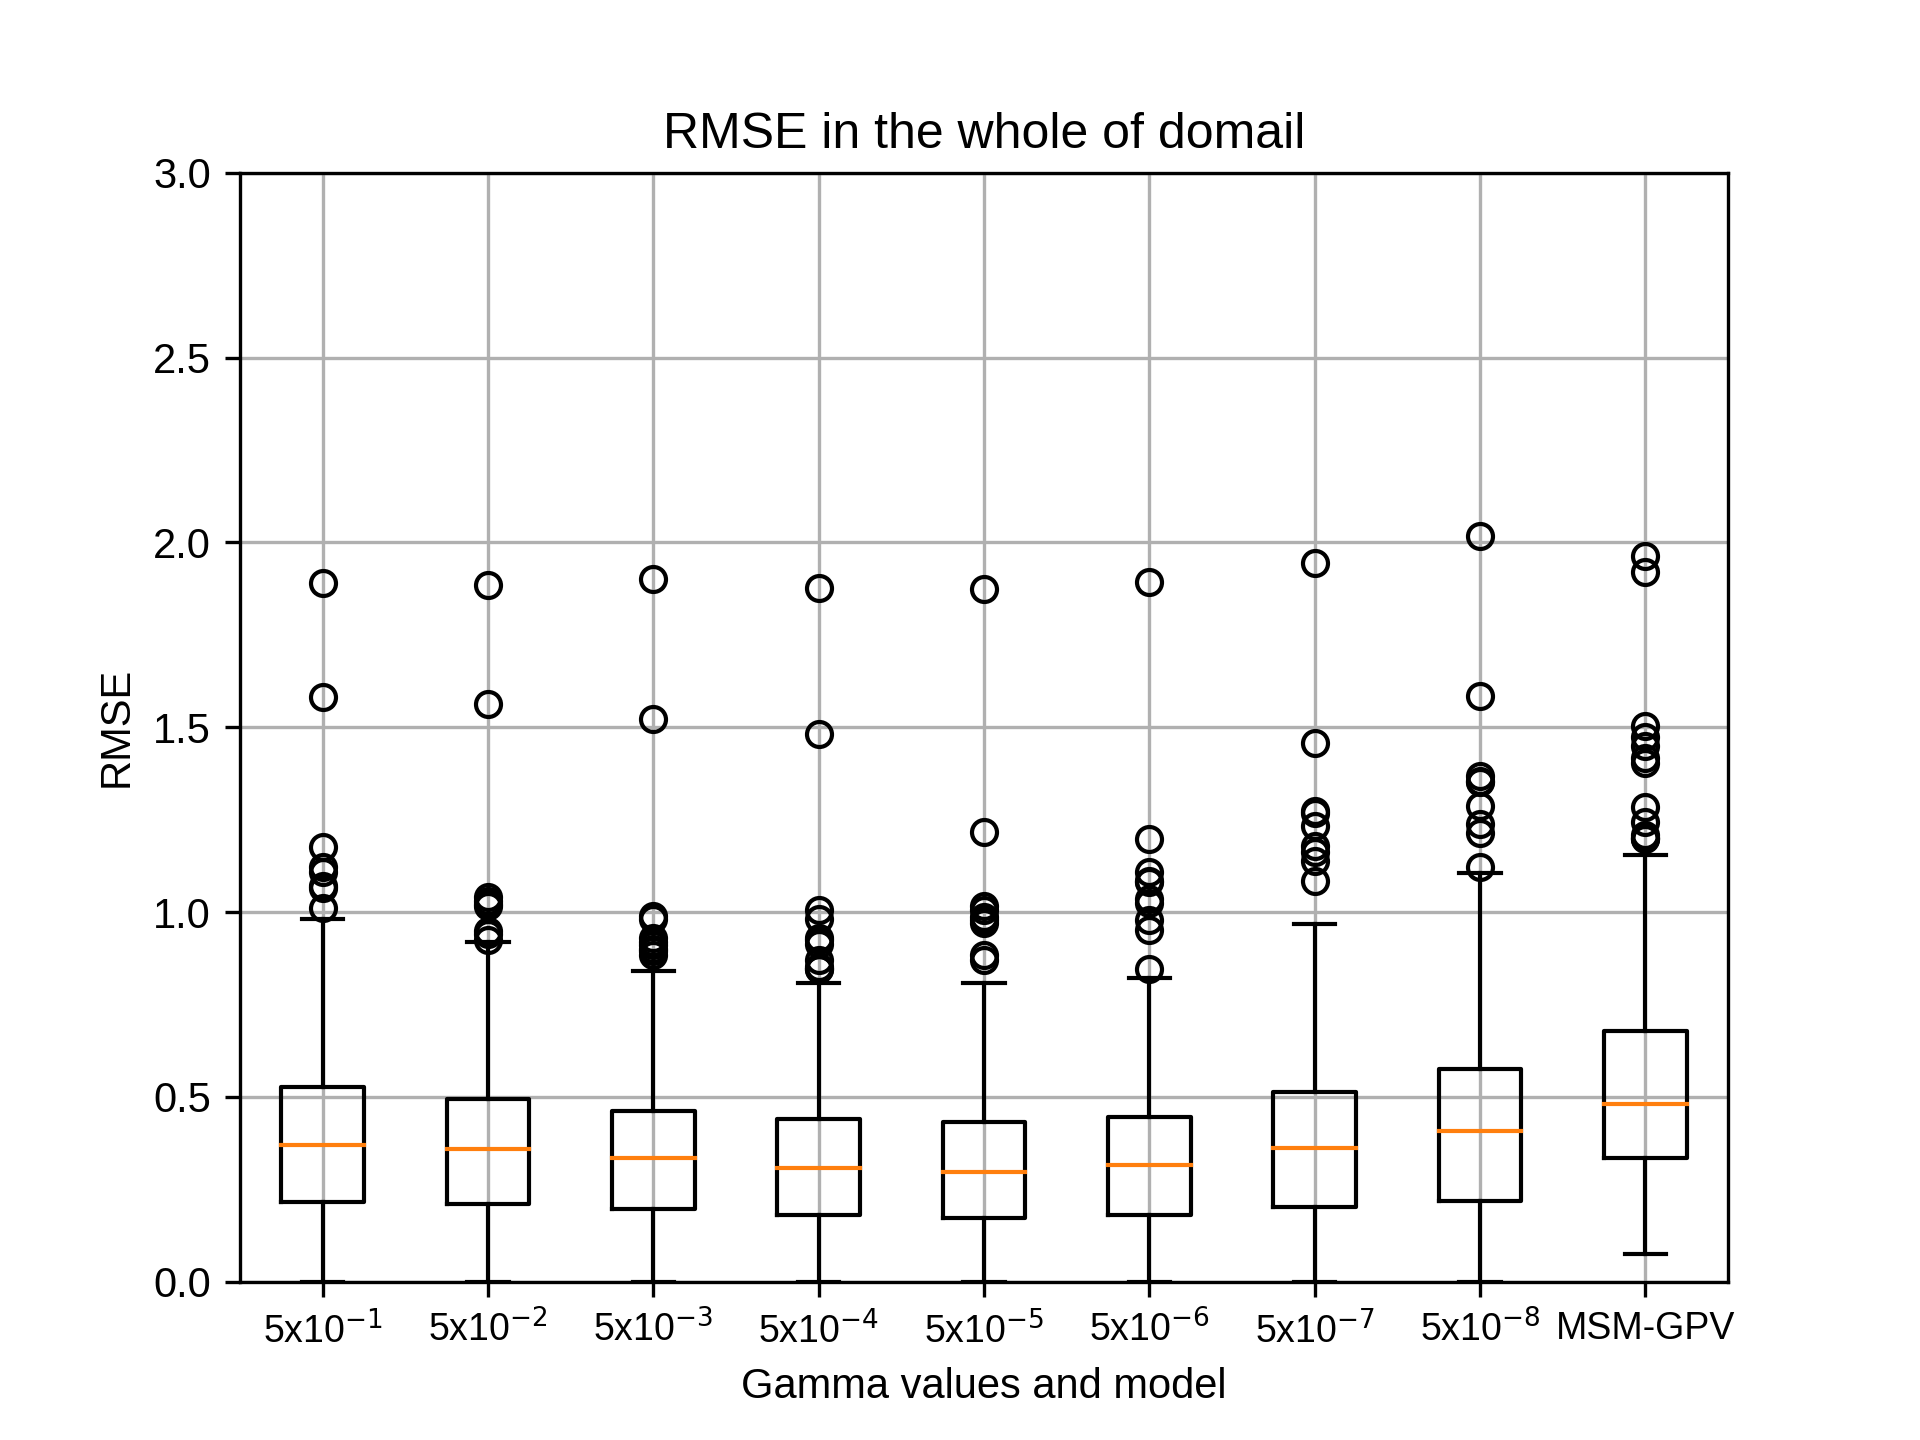
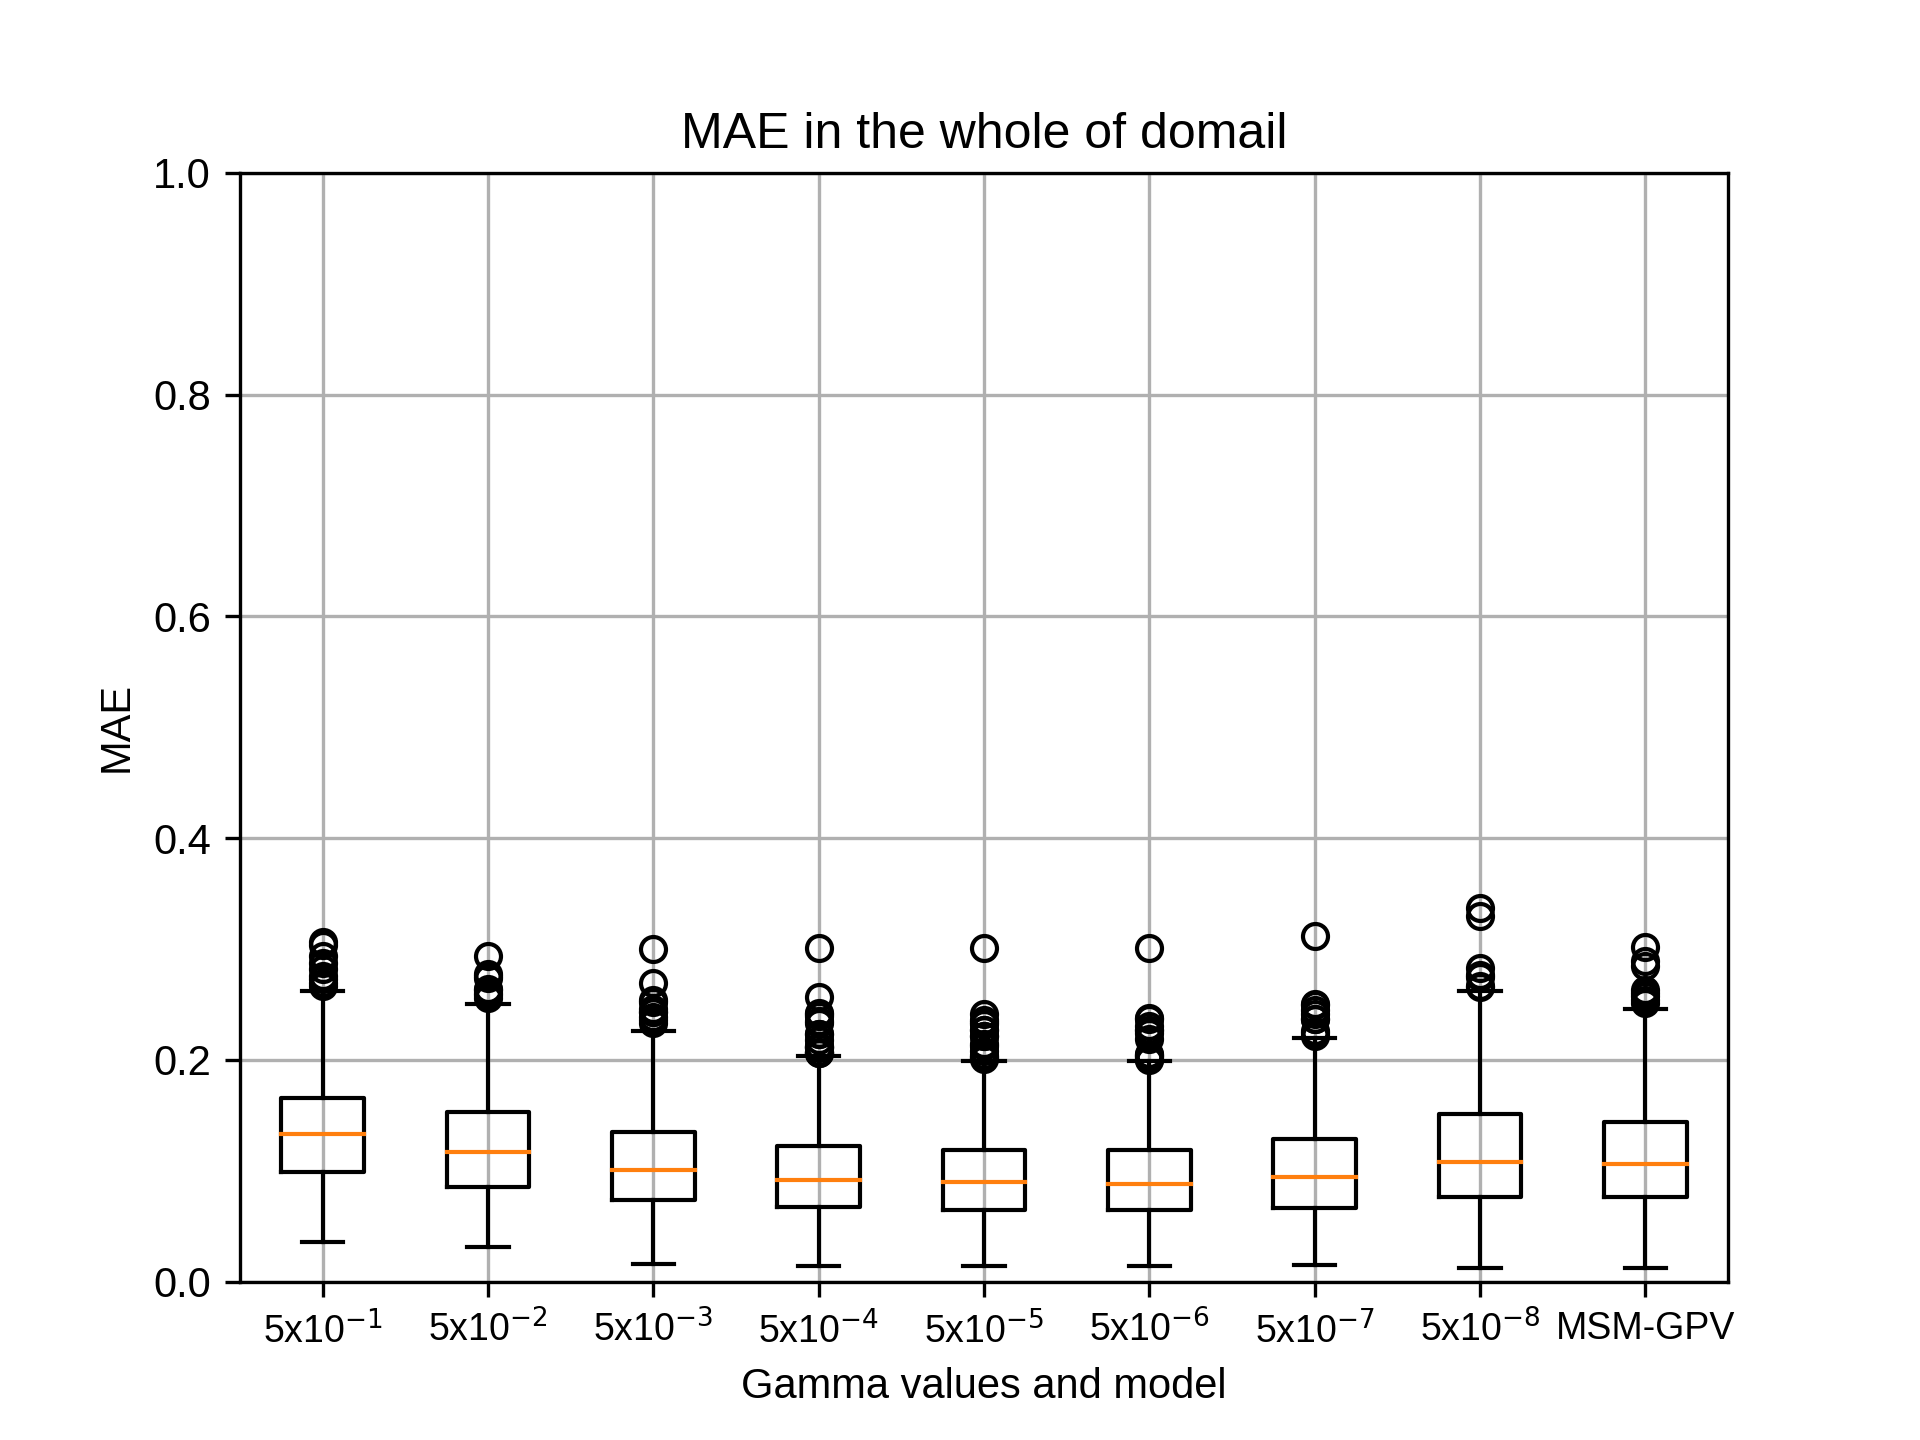
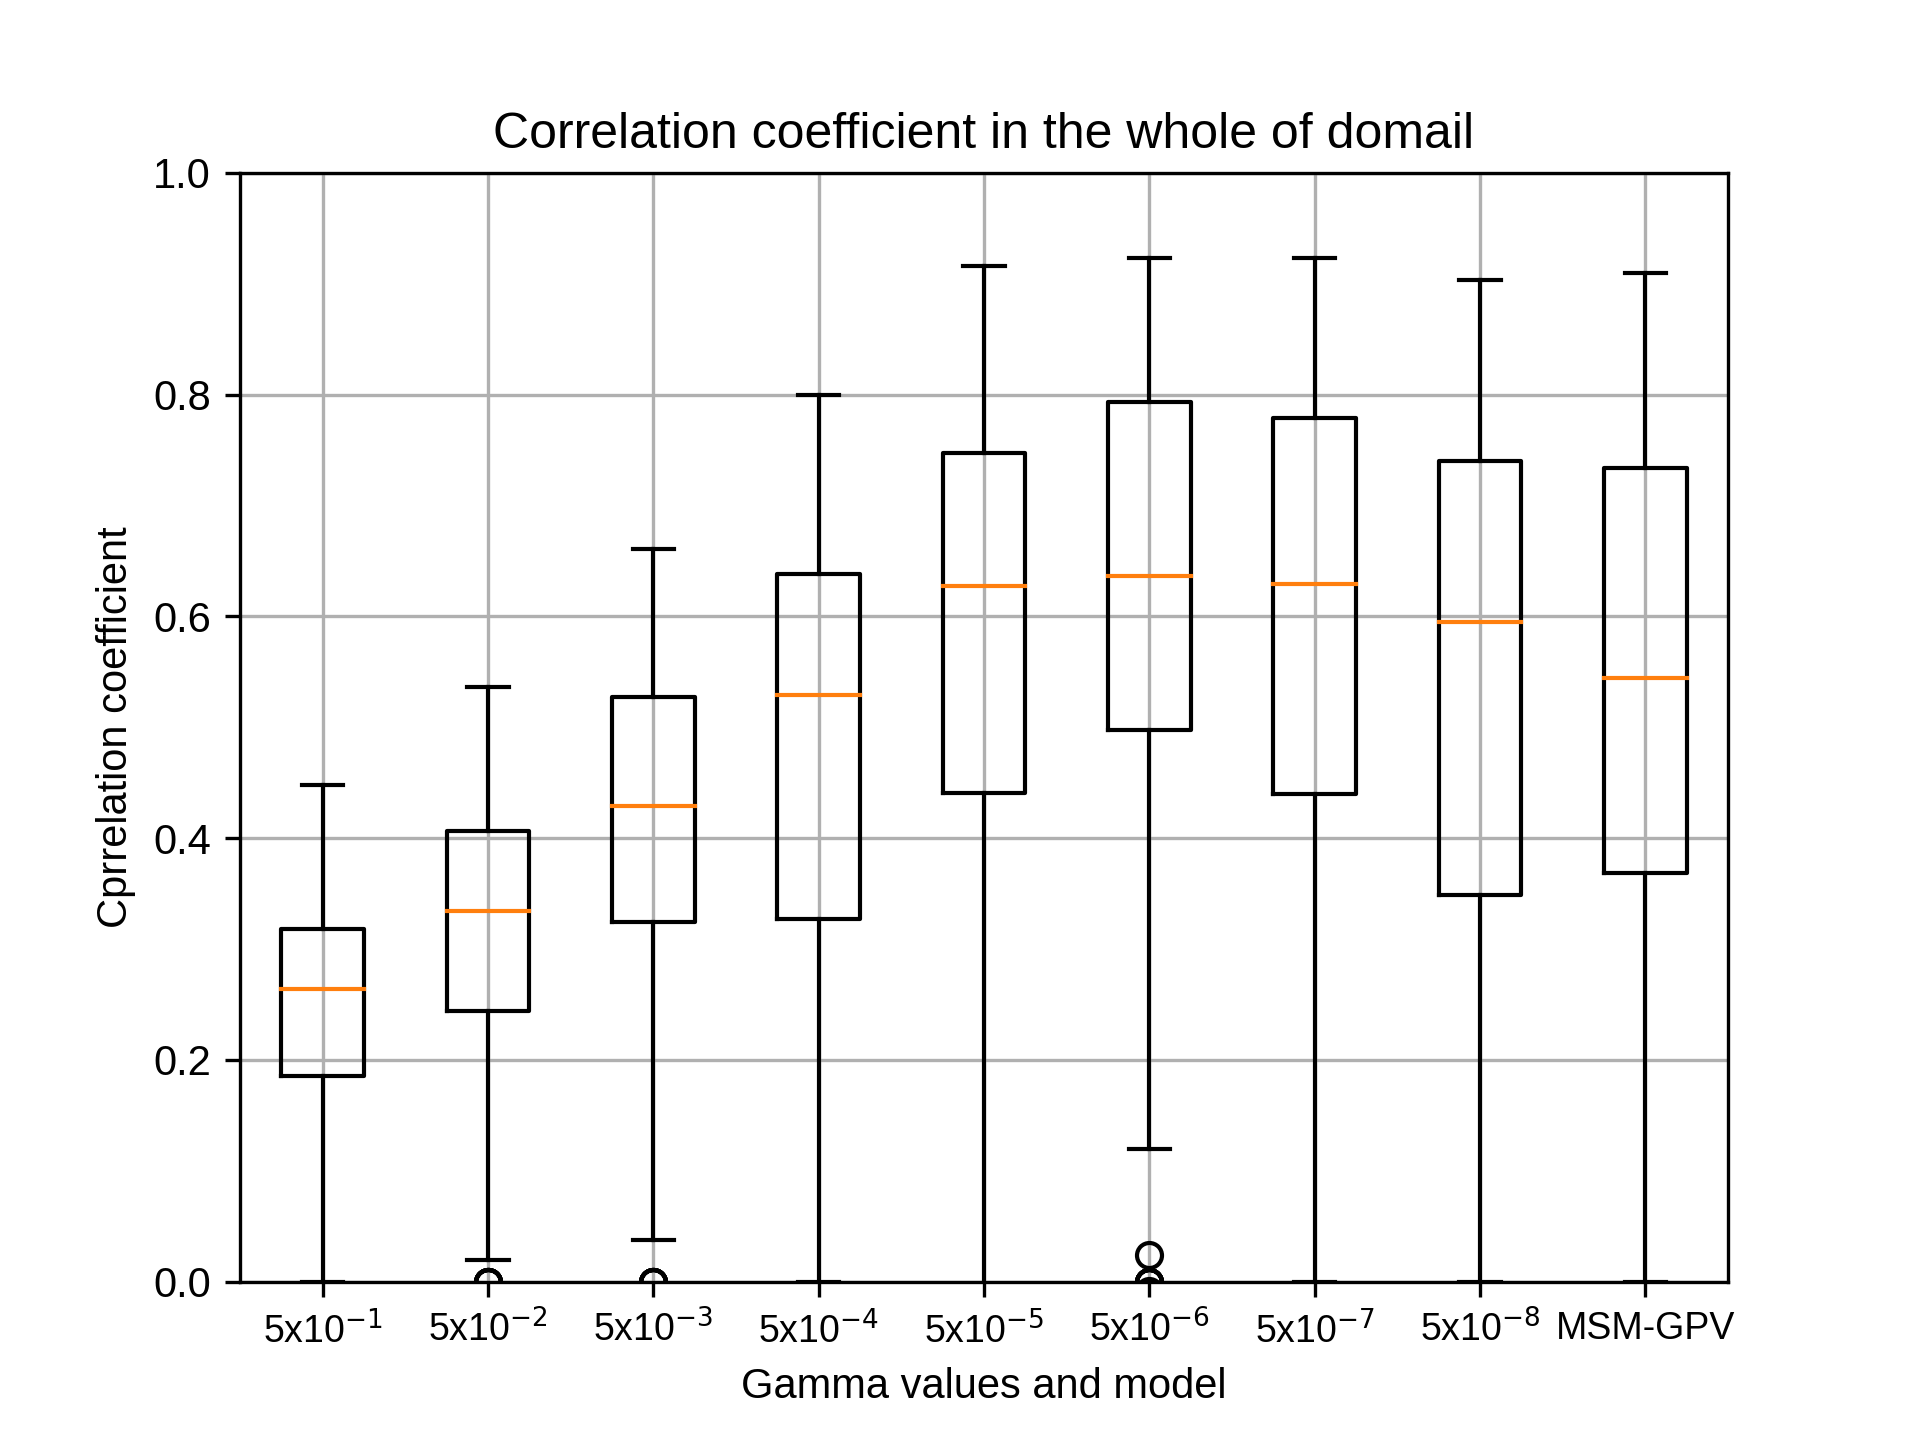
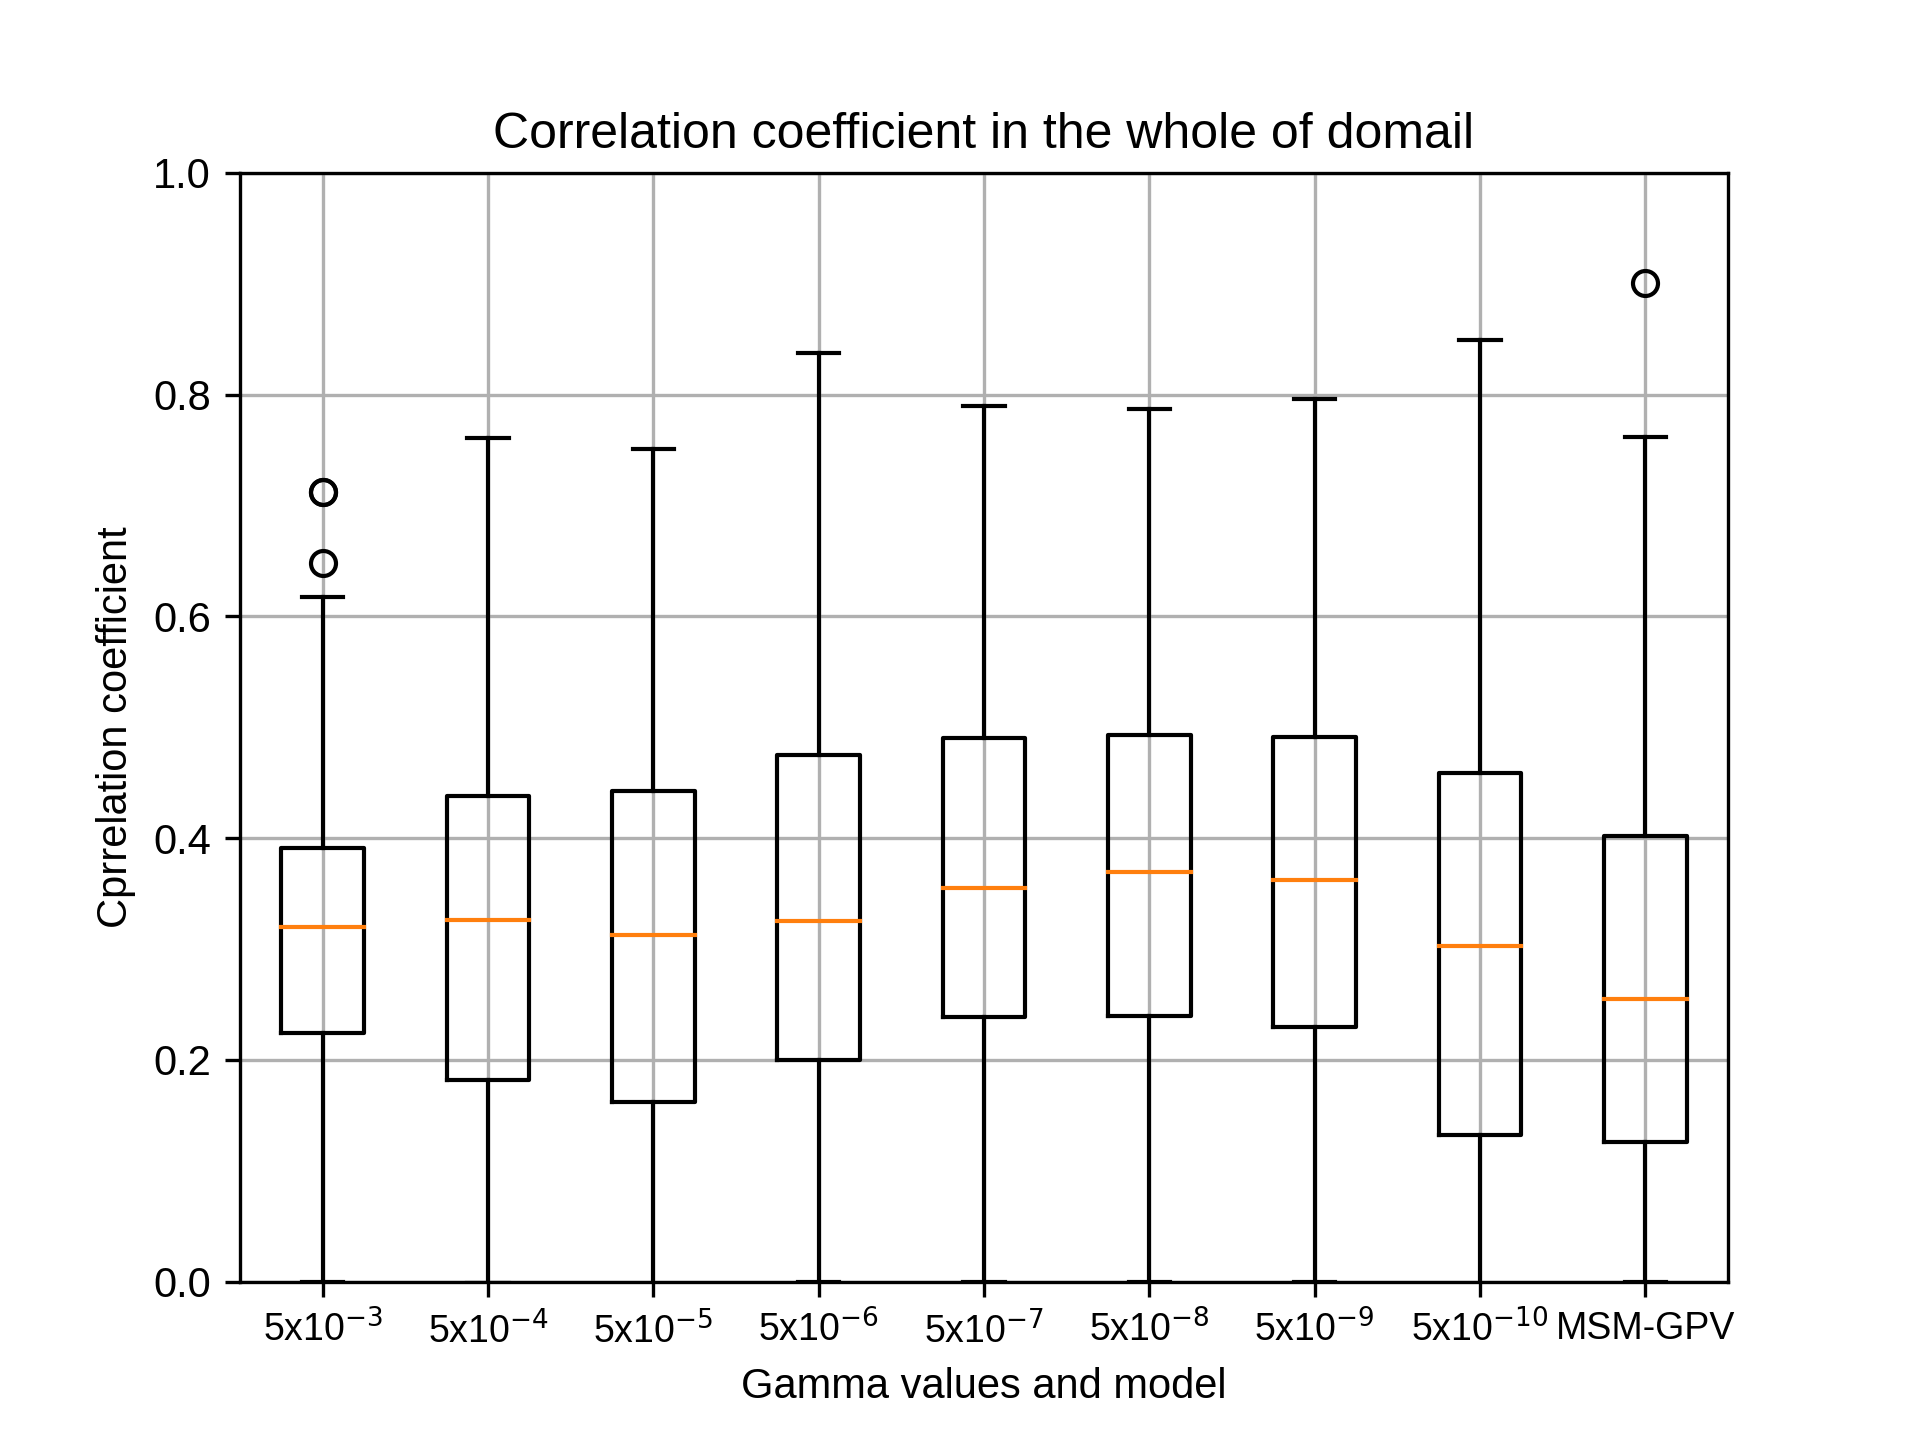
gammaの結果は結果は以下の通りです。(siteごとに1つずつ書き込みます)
吉兼先生
小林です。お世話になっております。
gammaにつきまして再解析した結果が出ましたのでご報告いたします。
結果はsiteA~siteEまですべて当初採用したgamma値が相関係数の中央値の最大でした。
cost,epsilon値等詳細は添付のエクセルファイルをご参照ください。
対象は、2007~2018年の7月です。
手法は以下のとおりです。
(1) cost=10, epsilon=0.001に固定し、gammaを'0.5 0.05 0.005 0.0005 0.00005 0.000005 0.0000005 0.00000005'と変化させ、相関係数の中央値が最も高いgammaを採用
(2) gammaを(1)で定めた値、epsilon=0.001に固定し、costを'50 40 30 20 10 8 6 4 2 1'と変化させ、相関係数の中央値が最も高いcostを採用
(3) gammaを(1)で定めた値、costを(2)で定めた値とし、epsilonを'1.0 0.1 0.01 0.001 0.0001 0.00001'と変化させ、相関係数の中央値が最も高いepsilonを採用
(4) costを(2)で定めた値、epsilonを(3)で定めた値とし、gammaを'0.5 0.05 0.005 0.0005 0.00005 0.000005 0.0000005 0.00000005'と変化させて再計算を行い、相関係数の中央値が最も高いgammaを確認
gammaの結果は結果は以下の通りです。(siteごとに1つずつ書き込みます)
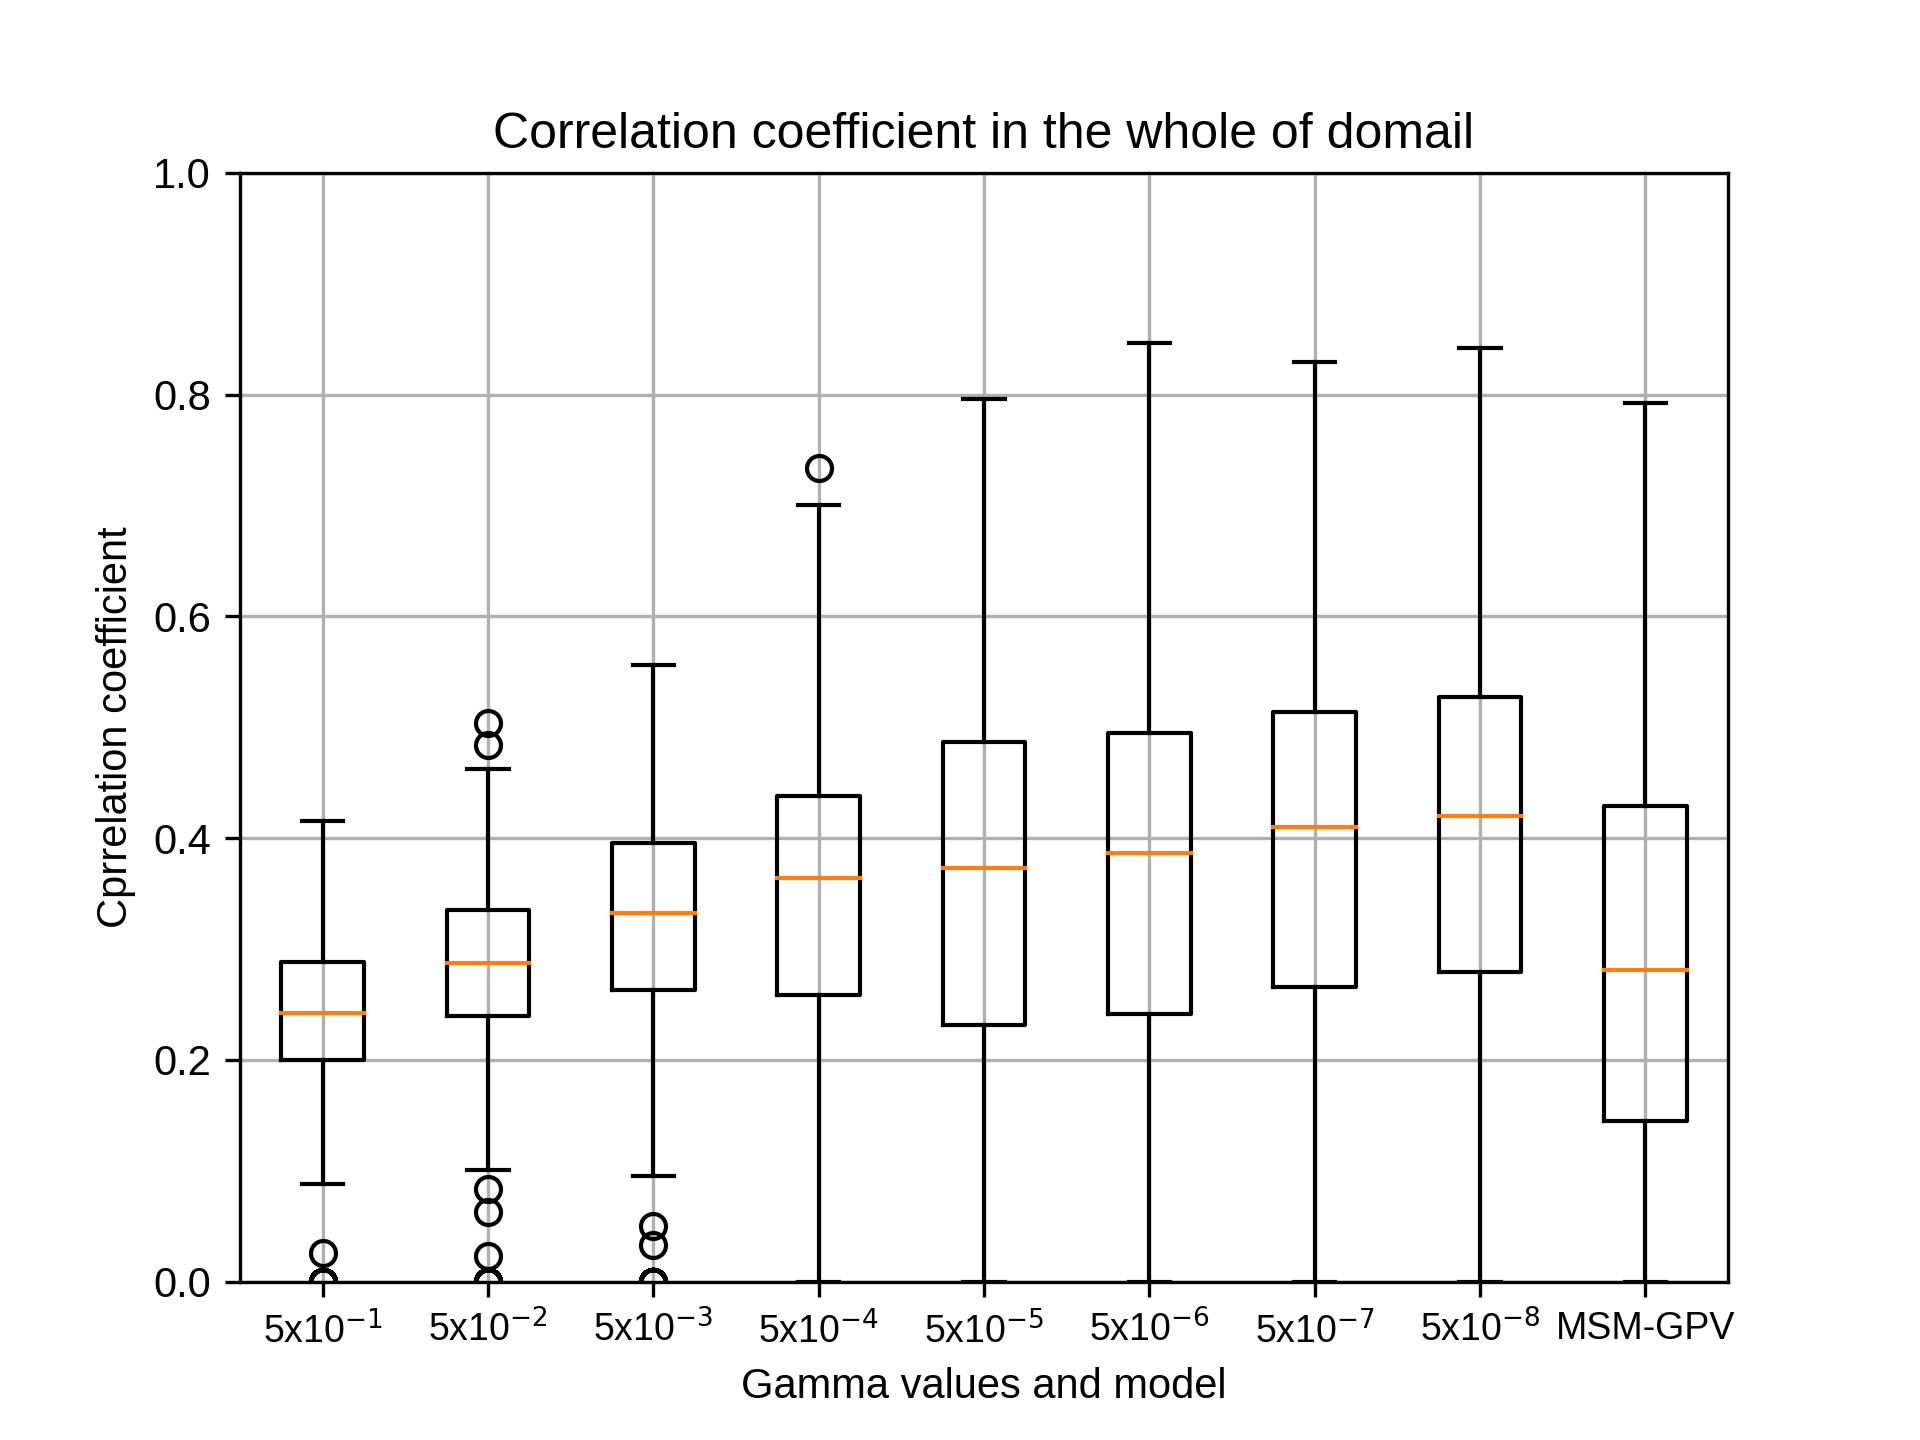
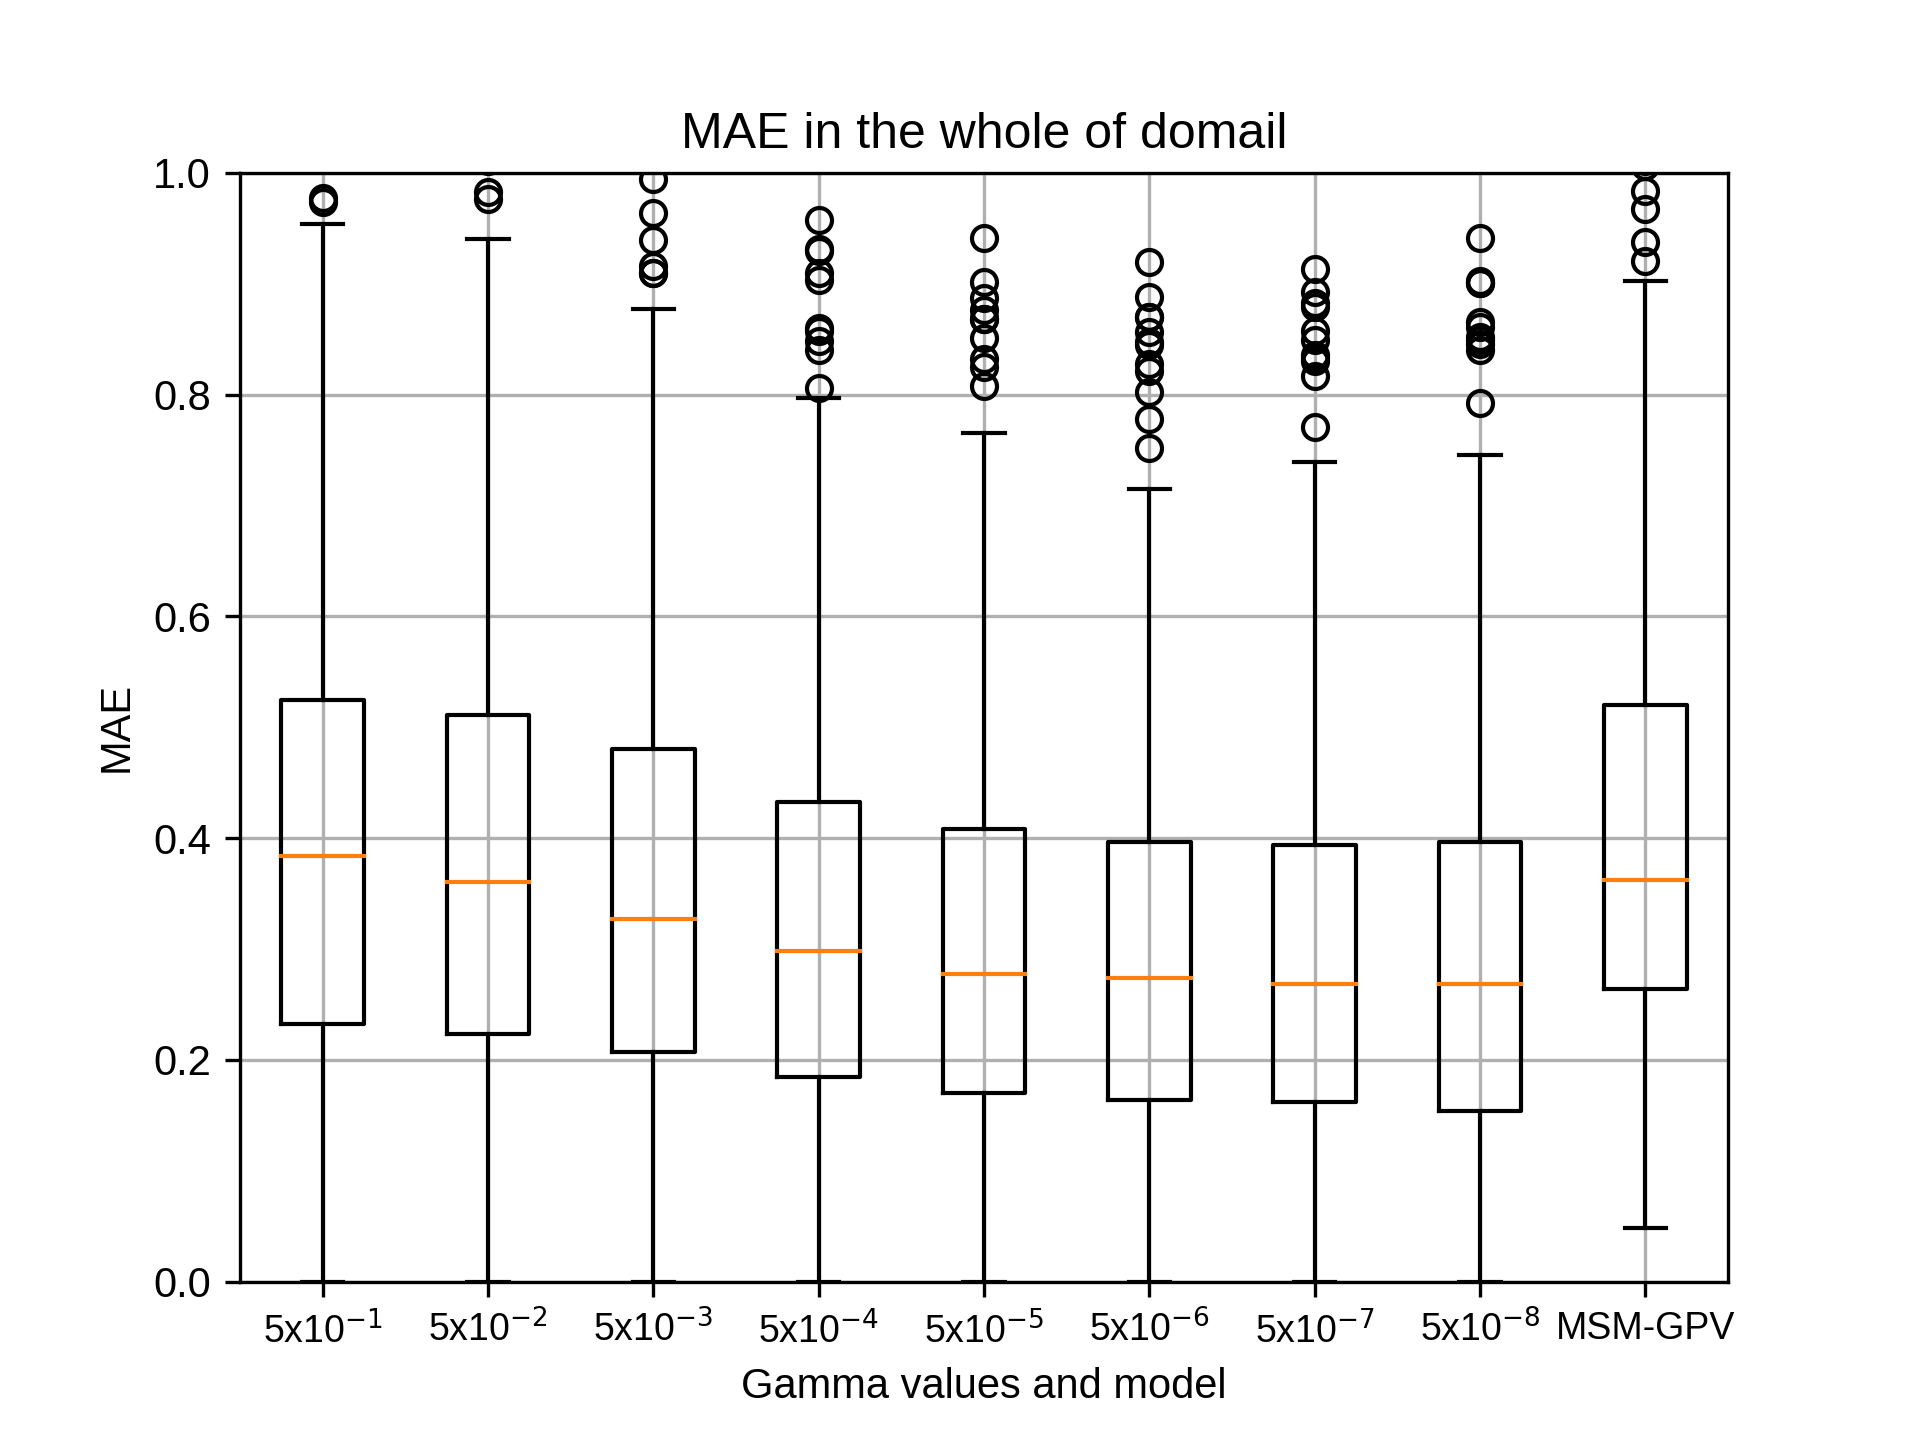
kobayashi_yusukeTuesday, September 15th, 2020 at 7:50:26 PM GMT+09:00
siteAのガンマの再解析のグラフは添付の通りです。
ガンマのパラメータは5x10の-7乗で相関係数の中央値の最大となりました。
ガンマのパラメータは5x10の-7乗で相関係数の中央値の最大となりました。
kobayashi_yusukeTuesday, September 15th, 2020 at 7:51:01 PM GMT+09:00
siteBのガンマの再解析のグラフは添付の通りです。
ガンマのパラメータは5x10の-6乗で相関係数の中央値の最大となりました。
ガンマのパラメータは5x10の-6乗で相関係数の中央値の最大となりました。
kobayashi_yusukeTuesday, September 15th, 2020 at 7:51:34 PM GMT+09:00

siteCのガンマの再解析のグラフは添付の通りです。
ガンマのパラメータは5x10の-7乗で相関係数の中央値の最大となりました。
ガンマのパラメータは5x10の-7乗で相関係数の中央値の最大となりました。
kobayashi_yusukeTuesday, September 15th, 2020 at 7:52:08 PM GMT+09:00


siteDのガンマの再解析のグラフは添付の通りです。
ガンマのパラメータは5x10の-8乗で相関係数の中央値の最大となりました。
ガンマのパラメータは5x10の-8乗で相関係数の中央値の最大となりました。
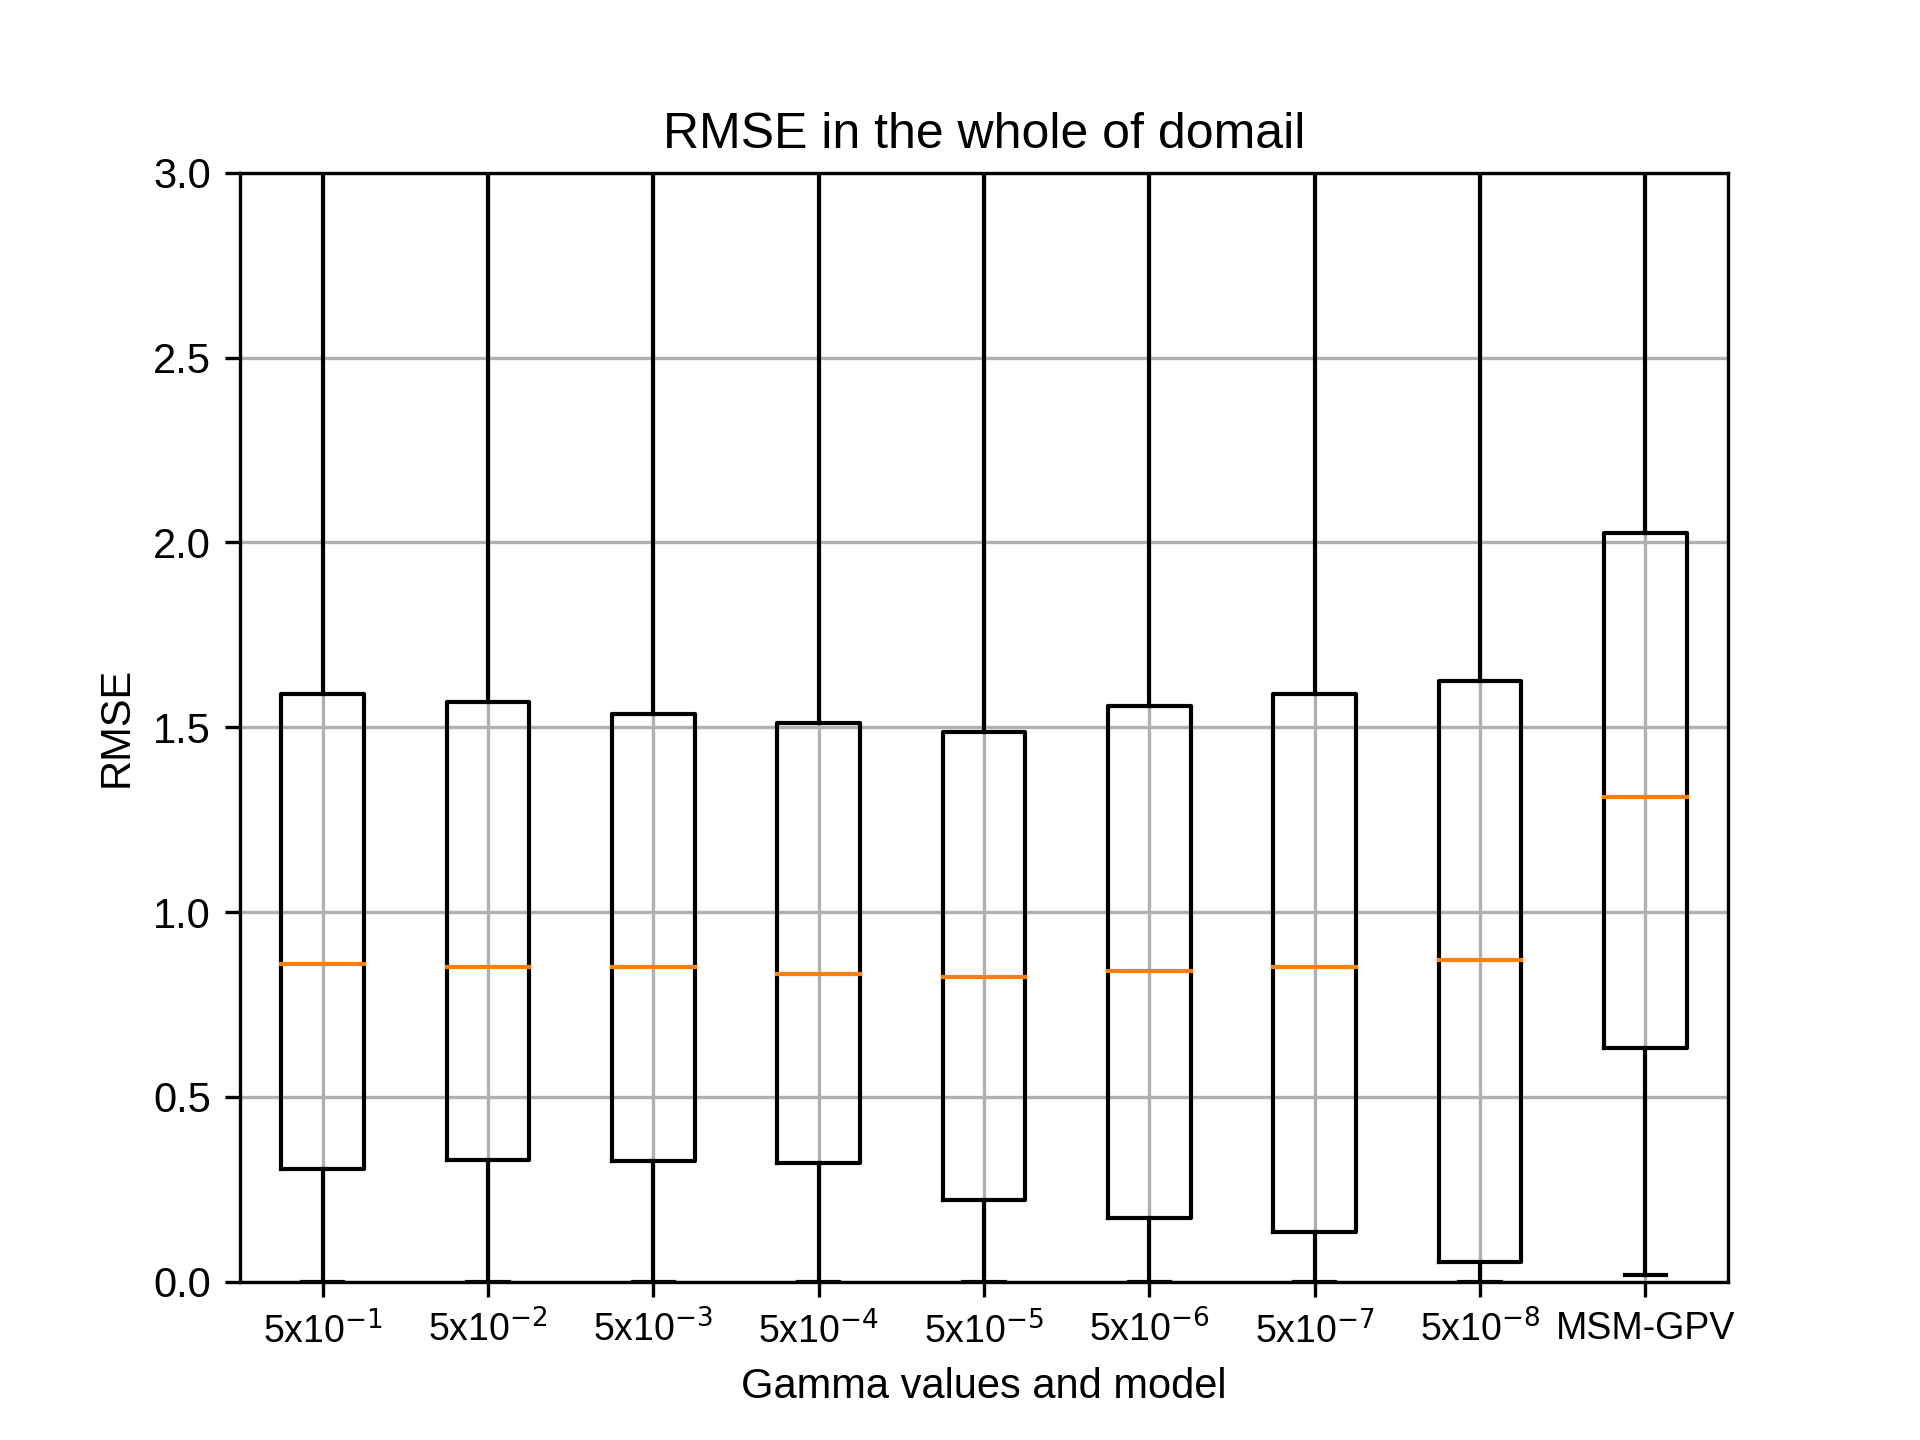
kobayashi_yusukeTuesday, September 15th, 2020 at 7:52:49 PM GMT+09:00

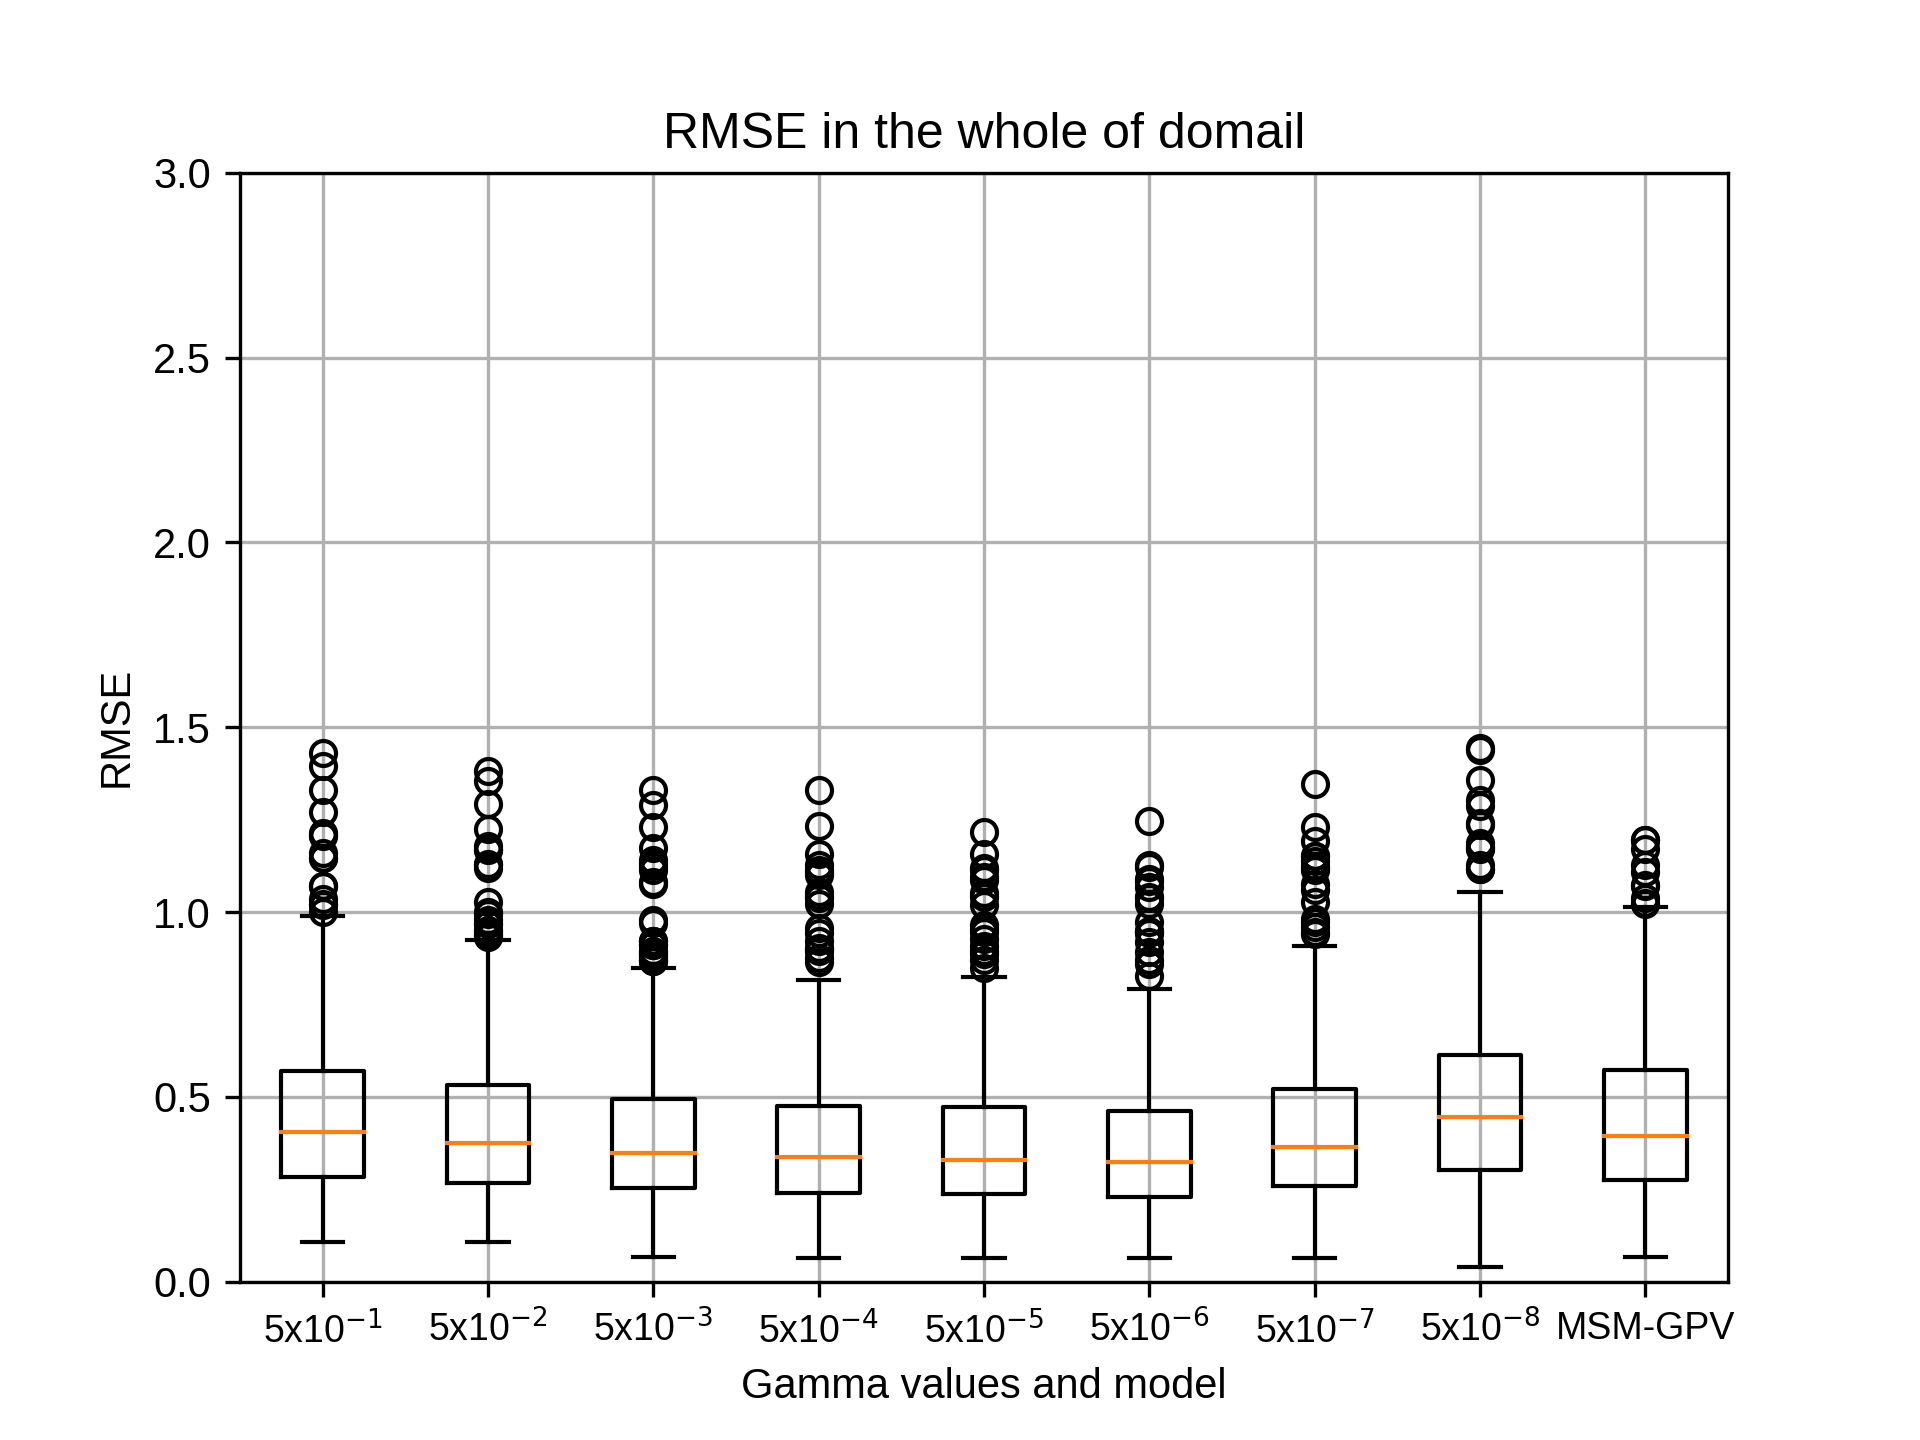
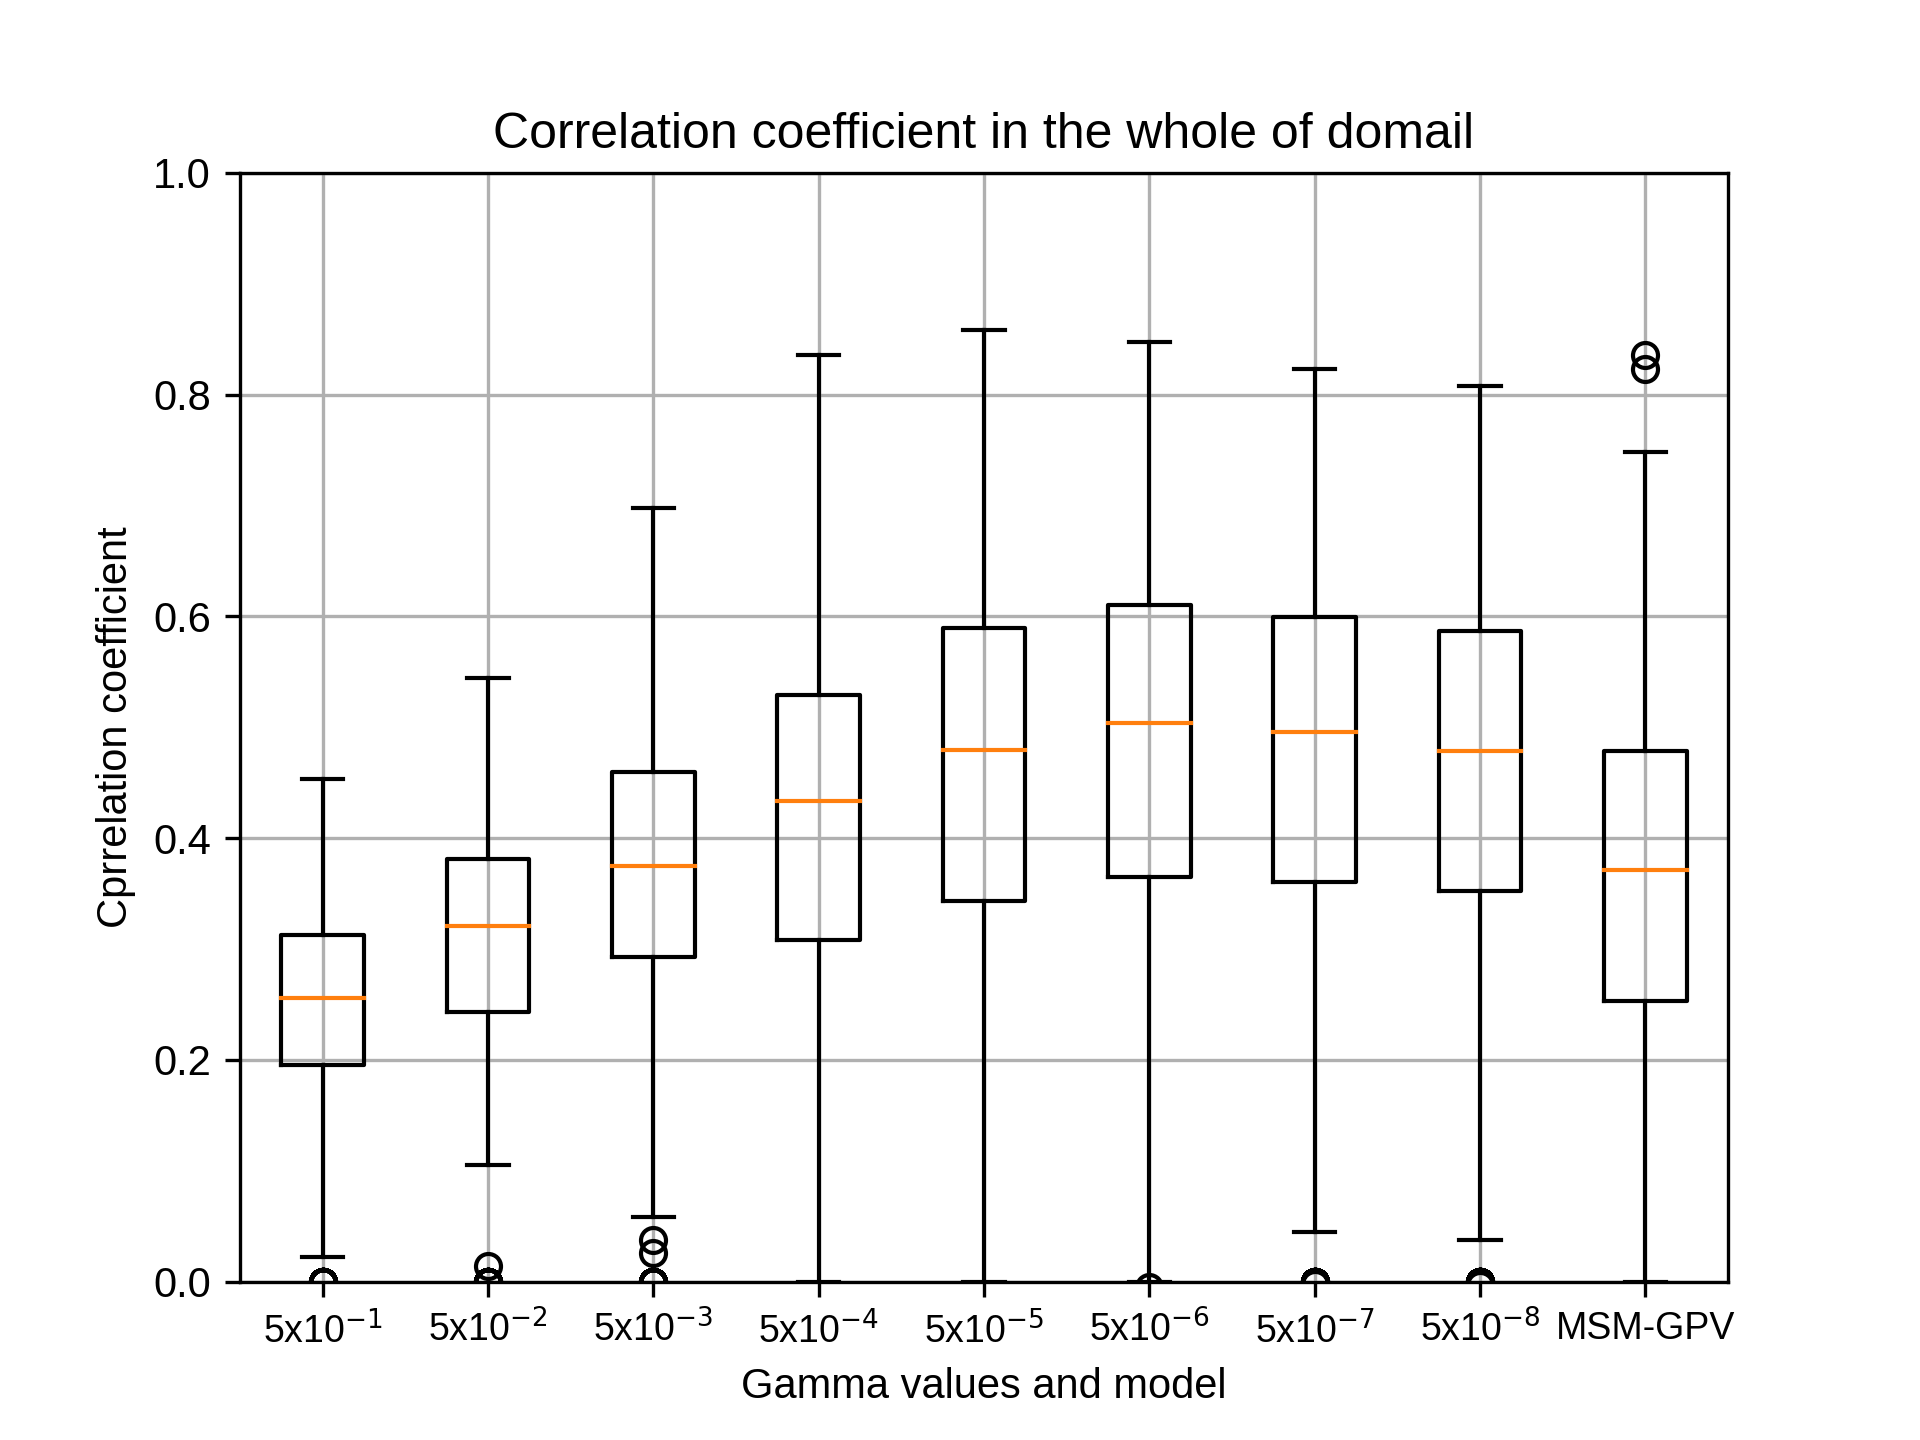
siteEのガンマの再解析のグラフは添付の通りです。
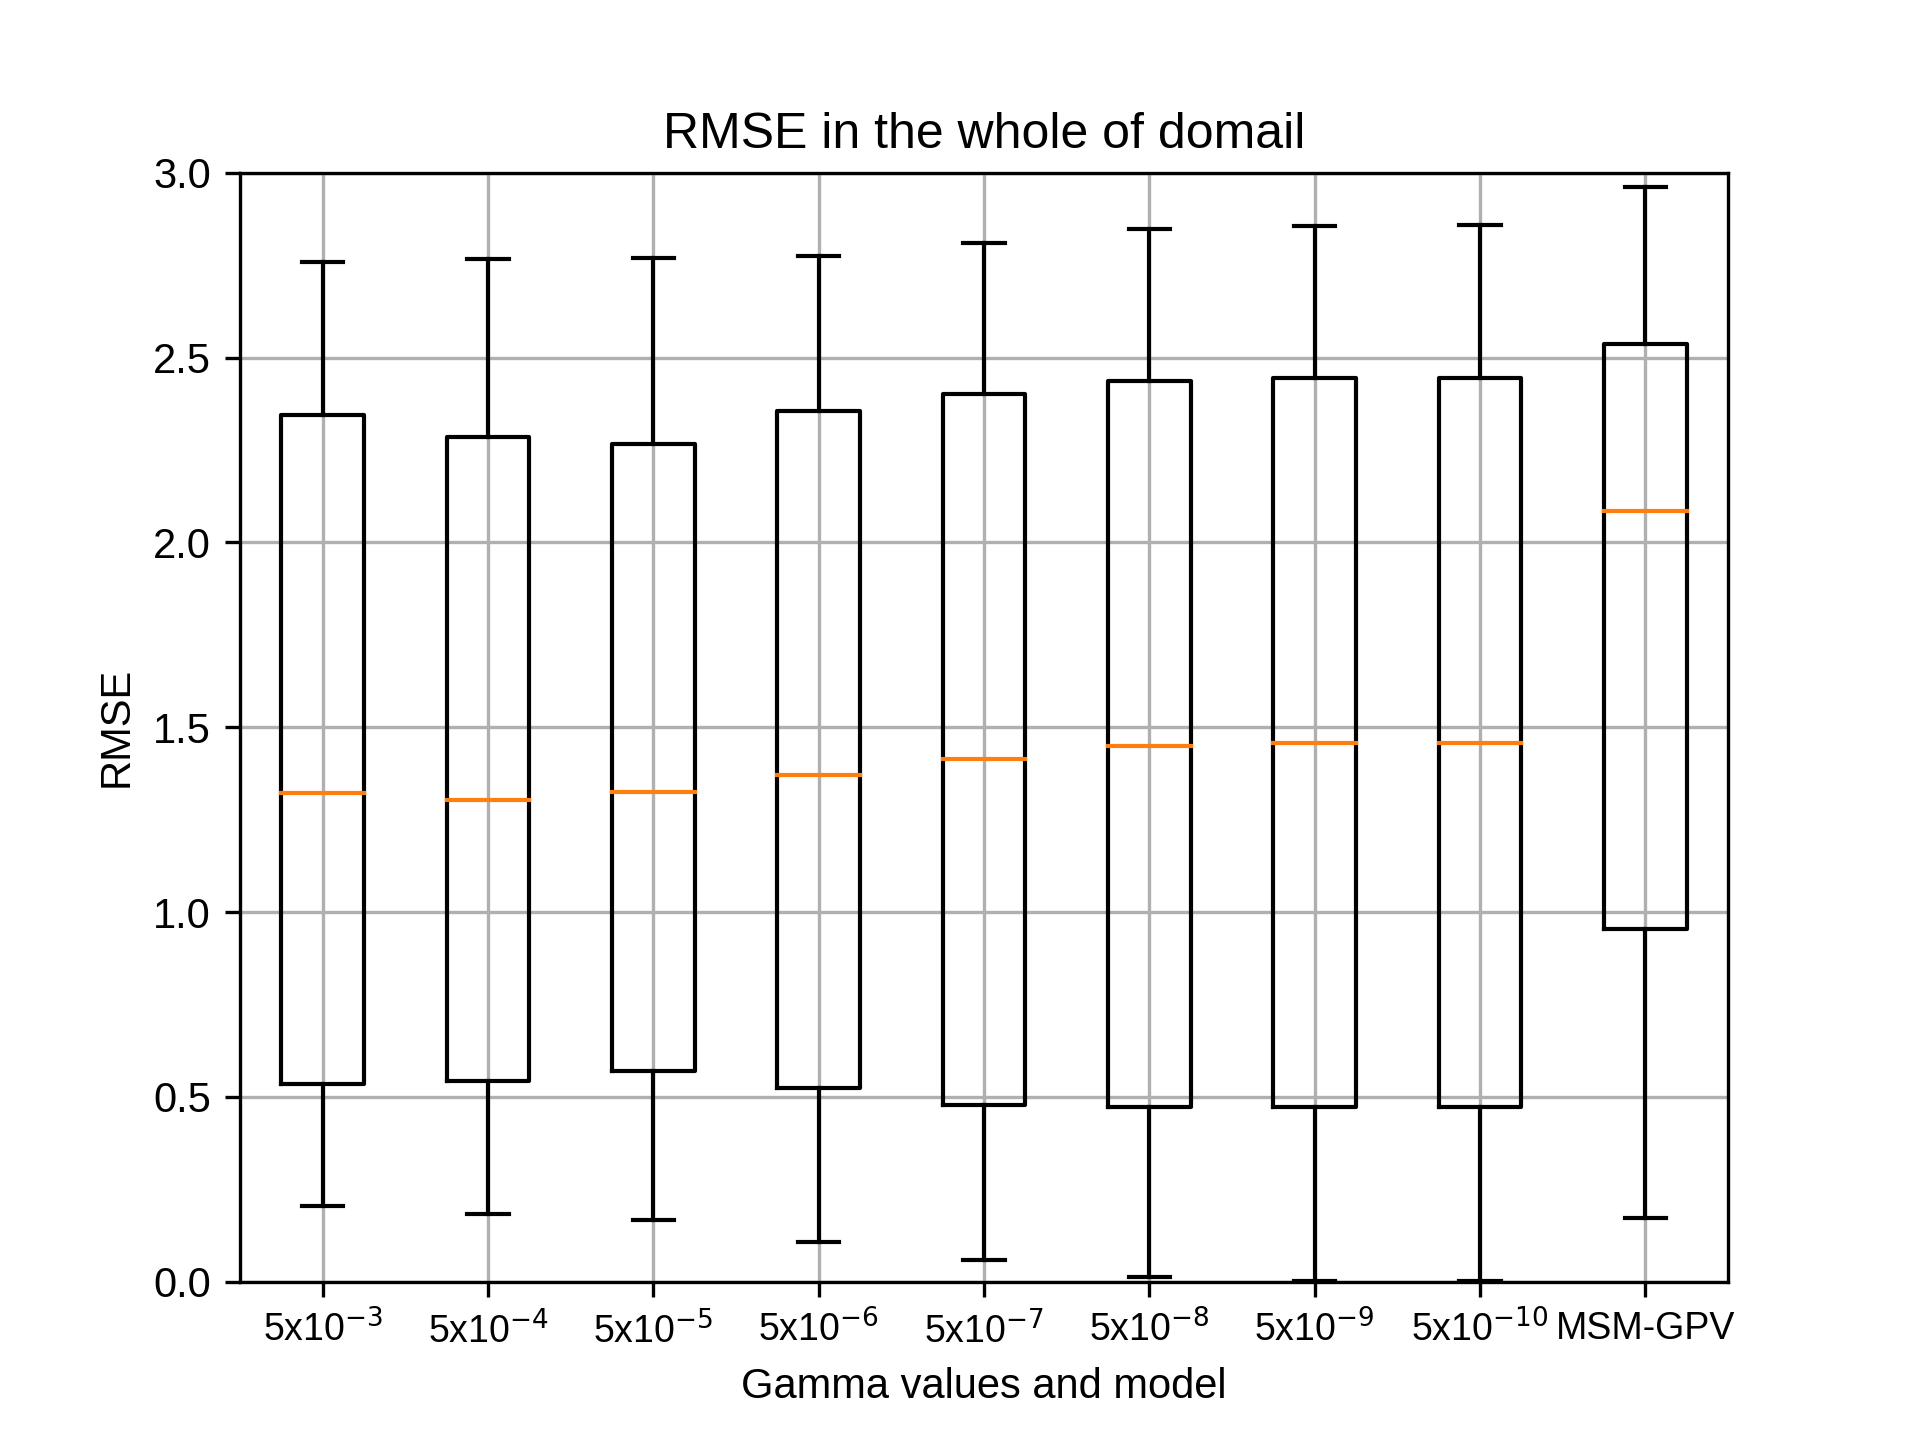
ガンマのパラメータは5x10の-3乗で相関係数の中央値の最大となりました。
これにて、ハイパーパラメータがすべて決まりました。ご意見ありがとうございました。
次はこのハイパーパラメータを用いた推定に入ると考えております。
その作業は別途相談させてください。
以上、よろしくお願いいたします。
ガンマのパラメータは5x10の-3乗で相関係数の中央値の最大となりました。
これにて、ハイパーパラメータがすべて決まりました。ご意見ありがとうございました。
次はこのハイパーパラメータを用いた推定に入ると考えております。
その作業は別途相談させてください。
以上、よろしくお願いいたします。
takao-yWednesday, September 16th, 2020 at 7:51:40 AM GMT+09:00
@kobayashi_yusuke
小林様。ありがとうございます。結果を見る限りは大きな違いはなさそうです。D,E領域については、もともとMSMの海上での再現性が良くないこともあるのでしょうか。もし時間がありましたら、D,Eについて島嶼領域(陸上)のみをピックアップして試していただけますでしょうか。琉球、八重山諸島の標高は高くてもせいぜい500m程度ですので、地形性降水の効果は小さいかもしれませんが。
小林様。ありがとうございます。結果を見る限りは大きな違いはなさそうです。D,E領域については、もともとMSMの海上での再現性が良くないこともあるのでしょうか。もし時間がありましたら、D,Eについて島嶼領域(陸上)のみをピックアップして試していただけますでしょうか。琉球、八重山諸島の標高は高くてもせいぜい500m程度ですので、地形性降水の効果は小さいかもしれませんが。
kobayashi_yusukeThursday, September 17th, 2020 at 1:16:44 PM GMT+09:00
@takao-y
吉兼先生
ご意見ありがとうございます。結果を見る限りは大きな違いはないとのご意見をいただき、ありがたく思います。時間がございましたら、D,Eについて島嶼領域(陸上)のみをピックアップして試したいと考えております。
ありがとうございました。
吉兼先生
ご意見ありがとうございます。結果を見る限りは大きな違いはないとのご意見をいただき、ありがたく思います。時間がございましたら、D,Eについて島嶼領域(陸上)のみをピックアップして試したいと考えております。
ありがとうございました。
takao-yWednesday, September 23rd, 2020 at 7:42:58 AM GMT+09:00
@kobayashi_yusuke
小林様。D,Eについてはいかがでしょうか。もし可能でしたら、1月、4月, 10月についても並行してお願いできますでしょうか。
小林様。D,Eについてはいかがでしょうか。もし可能でしたら、1月、4月, 10月についても並行してお願いできますでしょうか。
takao-yWednesday, September 23rd, 2020 at 11:36:25 AM GMT+09:00
皆様。吉兼です。
現在、小林さんに簡易実験を実施していただいていますが、以下の2点について検討できればと考えています。
1. 特徴量の範囲の季節による違い
2. バイナリ化した改良版での複数CPU実験
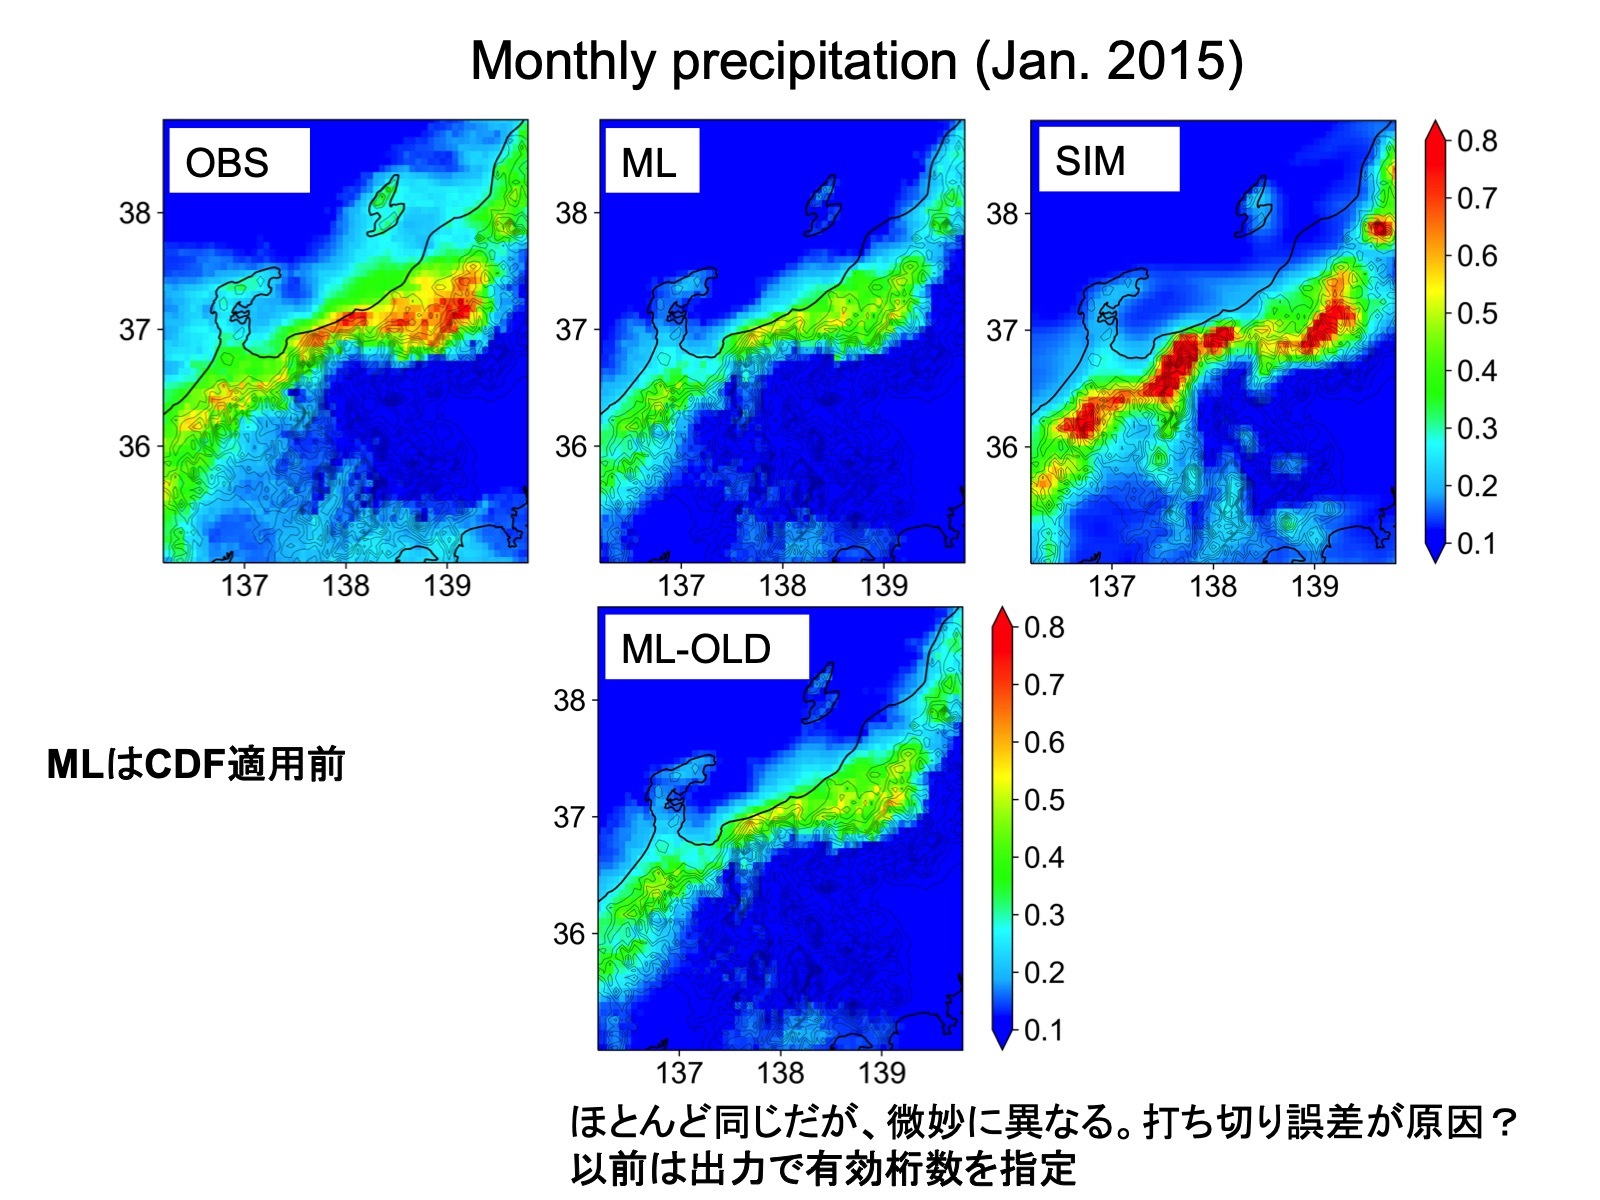
1.について、現在21x21(約105kmx105km)の特徴量の範囲を設定していますが、冬季と夏季で降水特性が異なることから、範囲を変更することによりパフォーマンスが変わってくる可能性があります。本件とは別のd4PDFの推定実験で気づいたことですが、夏季の場合、範囲を広げすぎると結果的に過大評価になる傾向があることが分かりました。夏季は線状降水帯のような狭い範囲で形成される降水が多く、特徴量を広く設定するとノイズも大きくなりあまり関係性のない降水まで関係があるかのように認識し、結果的に降水頻度自体が多くなってCDFを適用したあとで過大評価になるようです。もちろん、MSM-GPV自体の線状降水帯の再現性も影響するのですが、あまり広く取りすぎると、MSM-GPVの再現性の悪さがAIでの推定に影響を与えてしまうようです。d4PDFの実験結果から、60kmx60km程度が良さそうですので、特徴量の範囲を変えた調査もいくつか実施してみても良いのではと考えています。季節以外に地域による違いもありそうです。
2. は技術的な課題ですが、現在は5つの領域で実施していますが、実用面を考えるともっと細かく分割して並行処理を実施し、日本全域を同時に出力できるようになればと考えています。入力データのバイナリ化の改良版により、同時並行処理が可能と思いますので、例えば、陸域を中心に32分割して、32コアで同時並行処理を試していただくのは難しいでしょうか。バイナリ化によりメモリ消費も低減されていると思いますので、多分実行できるのではと考えています。さらにコア数を増やして64分割64コア同時並行ができればさらに実行時間は短縮されるのではないかと考えています。日本全域のバイアス補正データを統合できれば、TE-Japanへ入力も比較的容易になると思います。1kmでの運用を見据えて、さらに128コア, 256コア同時並行処理もできればと思いますが。深層学習に移行してGPUを活かした手法を開発した方が良いかなとも考えています。(個人的には今後は発展性のある深層学習に力を入れていきたいと考えています)
ご意見いただければ幸いです。
現在、小林さんに簡易実験を実施していただいていますが、以下の2点について検討できればと考えています。
1. 特徴量の範囲の季節による違い
2. バイナリ化した改良版での複数CPU実験
1.について、現在21x21(約105kmx105km)の特徴量の範囲を設定していますが、冬季と夏季で降水特性が異なることから、範囲を変更することによりパフォーマンスが変わってくる可能性があります。本件とは別のd4PDFの推定実験で気づいたことですが、夏季の場合、範囲を広げすぎると結果的に過大評価になる傾向があることが分かりました。夏季は線状降水帯のような狭い範囲で形成される降水が多く、特徴量を広く設定するとノイズも大きくなりあまり関係性のない降水まで関係があるかのように認識し、結果的に降水頻度自体が多くなってCDFを適用したあとで過大評価になるようです。もちろん、MSM-GPV自体の線状降水帯の再現性も影響するのですが、あまり広く取りすぎると、MSM-GPVの再現性の悪さがAIでの推定に影響を与えてしまうようです。d4PDFの実験結果から、60kmx60km程度が良さそうですので、特徴量の範囲を変えた調査もいくつか実施してみても良いのではと考えています。季節以外に地域による違いもありそうです。
2. は技術的な課題ですが、現在は5つの領域で実施していますが、実用面を考えるともっと細かく分割して並行処理を実施し、日本全域を同時に出力できるようになればと考えています。入力データのバイナリ化の改良版により、同時並行処理が可能と思いますので、例えば、陸域を中心に32分割して、32コアで同時並行処理を試していただくのは難しいでしょうか。バイナリ化によりメモリ消費も低減されていると思いますので、多分実行できるのではと考えています。さらにコア数を増やして64分割64コア同時並行ができればさらに実行時間は短縮されるのではないかと考えています。日本全域のバイアス補正データを統合できれば、TE-Japanへ入力も比較的容易になると思います。1kmでの運用を見据えて、さらに128コア, 256コア同時並行処理もできればと思いますが。深層学習に移行してGPUを活かした手法を開発した方が良いかなとも考えています。(個人的には今後は発展性のある深層学習に力を入れていきたいと考えています)
ご意見いただければ幸いです。

kubota.takujiFriday, September 25th, 2020 at 2:36:28 PM GMT+09:00
@kubota.takujiさんがチャンネルに参加しました
kobayashi_yusukeMonday, September 28th, 2020 at 9:52:42 AM GMT+09:00
@takao-y
吉兼先生
お世話になっております。D,Eの件はまだ着手出来ておりません。申し訳ございません。
できあがりましたらご連絡いたします。
吉兼先生
お世話になっております。D,Eの件はまだ着手出来ておりません。申し訳ございません。
できあがりましたらご連絡いたします。
takao-yMonday, September 28th, 2020 at 11:22:38 AM GMT+09:00
@kobayashi_yusuke
小林様。ご連絡ありがとうございます。もし難しいようでしたら後回しにして、1月,4月,10月を実施していただけますでしょうか。
小林様。ご連絡ありがとうございます。もし難しいようでしたら後回しにして、1月,4月,10月を実施していただけますでしょうか。
kobayashi_yusukeMonday, September 28th, 2020 at 6:18:20 PM GMT+09:00
@takao-y
吉兼先生
承知しました。1月、4月、10月を行います。結果が出ましたらご連絡いたします。
吉兼先生
承知しました。1月、4月、10月を行います。結果が出ましたらご連絡いたします。
takao-yFriday, October 2nd, 2020 at 7:03:27 PM GMT+09:00
@kobayashi_yusuke
小林様。進捗はいかがでしょうか。もし問題などありましたら、遠慮せずにご連絡ください。
小林様。進捗はいかがでしょうか。もし問題などありましたら、遠慮せずにご連絡ください。
kobayashi_yusukeFriday, October 2nd, 2020 at 7:18:36 PM GMT+09:00
@takao-y
吉兼先生 ご連絡ありがとうございます。経過報告をせずに申し訳ございません。解析は順次進めております。結果が出ましたら改めてご連絡いたします。以上、よろしくお願いいたします。
吉兼先生 ご連絡ありがとうございます。経過報告をせずに申し訳ございません。解析は順次進めております。結果が出ましたら改めてご連絡いたします。以上、よろしくお願いいたします。
kobayashi_yusukeMonday, October 5th, 2020 at 11:47:43 AM GMT+09:00

@takao-y
吉兼先生
小林です。お世話になっております。
1月,4月,10月のgamma⇒cost⇒epsilon⇒gamma再解析が終わりましたのでご連絡します。
1月の各パラメータの一覧表と手法と学習年等を記載したものをexcelとして添付します。
以下にsiteごとに、gamma,cost,epsilon,gamma再解析ごとの結果を書き込みます。
吉兼先生
小林です。お世話になっております。
1月,4月,10月のgamma⇒cost⇒epsilon⇒gamma再解析が終わりましたのでご連絡します。
1月の各パラメータの一覧表と手法と学習年等を記載したものをexcelとして添付します。
以下にsiteごとに、gamma,cost,epsilon,gamma再解析ごとの結果を書き込みます。
kobayashi_yusukeMonday, October 5th, 2020 at 11:48:21 AM GMT+09:00
1月のsiteAのgammaのグラフは添付のとおりです。
相関係数の中央値が最も高くなったgammaのパラメータは5x10の-6乗のため、これを採用します。
これを用いてcostを計算しました。
相関係数の中央値が最も高くなったgammaのパラメータは5x10の-6乗のため、これを採用します。
これを用いてcostを計算しました。
kobayashi_yusukeMonday, October 5th, 2020 at 11:48:53 AM GMT+09:00
1月のsiteAのcostのグラフは添付のとおりです。
どのパラメータでも大きく変わりませんでした。
相関係数の中央値が最も高くなったcostのパラメータは8のため、これを採用します。
これを用いてepsilonを計算しました。
どのパラメータでも大きく変わりませんでした。
相関係数の中央値が最も高くなったcostのパラメータは8のため、これを採用します。
これを用いてepsilonを計算しました。
kobayashi_yusukeMonday, October 5th, 2020 at 11:49:13 AM GMT+09:00
1月のsiteAのepsilonのグラフは添付のとおりです。
相関係数の中央値が最も高くなったepsilonのパラメータは0.01のため、これを採用します。
これを用いてgammaの再計算をしました。
相関係数の中央値が最も高くなったepsilonのパラメータは0.01のため、これを採用します。
これを用いてgammaの再計算をしました。
kobayashi_yusukeMonday, October 5th, 2020 at 11:49:31 AM GMT+09:00
1月のsiteAのgammaの再解析のグラフは添付のとおりです。
相関係数の中央値が最も高くなったgammaの再解析のパラメータは5x10の-6乗のため、これを採用します。
これで、1月のsiteAのパラメータは cost=8,epsilon=0.01,gamma=5x10の-6乗となりました。
相関係数の中央値が最も高くなったgammaの再解析のパラメータは5x10の-6乗のため、これを採用します。
これで、1月のsiteAのパラメータは cost=8,epsilon=0.01,gamma=5x10の-6乗となりました。
kobayashi_yusukeMonday, October 5th, 2020 at 11:50:14 AM GMT+09:00
1月のsiteBのgammaのグラフは添付のとおりです。
相関係数の中央値が最も高くなったgammaのパラメータは5x10の-5乗のため、これを採用します。
これを用いてcostを計算しました。
相関係数の中央値が最も高くなったgammaのパラメータは5x10の-5乗のため、これを採用します。
これを用いてcostを計算しました。
kobayashi_yusukeMonday, October 5th, 2020 at 11:50:30 AM GMT+09:00
1月のsiteBのcostのグラフは添付のとおりです。
どのパラメータでも大きく変わりませんでした。
相関係数の中央値が最も高くなったcostのパラメータは8のため、これを採用します。
これを用いてepsilonを計算しました。
どのパラメータでも大きく変わりませんでした。
相関係数の中央値が最も高くなったcostのパラメータは8のため、これを採用します。
これを用いてepsilonを計算しました。
kobayashi_yusukeMonday, October 5th, 2020 at 11:50:51 AM GMT+09:00
1月のsiteBのepsilonのグラフは添付のとおりです。
1.0以外はどのパラメータでも大きく変わりませんでした。
相関係数の中央値が最も高くなったepsilonのパラメータは0.01のため、これを採用します。
これを用いてgammaの再計算をしました。
1.0以外はどのパラメータでも大きく変わりませんでした。
相関係数の中央値が最も高くなったepsilonのパラメータは0.01のため、これを採用します。
これを用いてgammaの再計算をしました。
kobayashi_yusukeMonday, October 5th, 2020 at 11:51:35 AM GMT+09:00

1月のsiteBのgammaの再解析のグラフは添付のとおりです。
相関係数の中央値が最も高くなったgammaの再解析のパラメータは5x10の-5乗のため、これを採用します。
これで、1月のsiteBのパラメータは cost=8,epsilon=0.01,gamma=5x10の-5乗となりました。
相関係数の中央値が最も高くなったgammaの再解析のパラメータは5x10の-5乗のため、これを採用します。
これで、1月のsiteBのパラメータは cost=8,epsilon=0.01,gamma=5x10の-5乗となりました。
kobayashi_yusukeMonday, October 5th, 2020 at 11:52:05 AM GMT+09:00

1月のsiteCのgammaのグラフは添付のとおりです。
相関係数の中央値が最も高くなったgammaのパラメータは5x10の-6乗のため、これを採用します。
これを用いてcostを計算しました。
相関係数の中央値が最も高くなったgammaのパラメータは5x10の-6乗のため、これを採用します。
これを用いてcostを計算しました。
kobayashi_yusukeMonday, October 5th, 2020 at 11:52:25 AM GMT+09:00
1月のsiteCのcostのグラフは添付のとおりです。
どのパラメータでも大きく変わりませんでした。
相関係数の中央値が最も高くなったcostのパラメータは4のため、これを採用します。
これを用いてepsilonを計算しました。
どのパラメータでも大きく変わりませんでした。
相関係数の中央値が最も高くなったcostのパラメータは4のため、これを採用します。
これを用いてepsilonを計算しました。
kobayashi_yusukeMonday, October 5th, 2020 at 11:52:43 AM GMT+09:00
1月のsiteCのepsilonのグラフは添付のとおりです。
1.0以外はどのパラメータでも大きく変わりませんでした。
相関係数の中央値が最も高くなったepsilonのパラメータは0.001(0.1と同値)のため、これを採用します。
これを用いてgammaの再計算をしました。
1.0以外はどのパラメータでも大きく変わりませんでした。
相関係数の中央値が最も高くなったepsilonのパラメータは0.001(0.1と同値)のため、これを採用します。
これを用いてgammaの再計算をしました。
kobayashi_yusukeMonday, October 5th, 2020 at 11:53:03 AM GMT+09:00


1月のsiteCのgammaの再解析のグラフは添付のとおりです。
相関係数の中央値が最も高くなったgammaの再解析のパラメータは5x10の-6乗のため、これを採用します。
これで、1月のsiteCのパラメータは cost=4,epsilon=0.001,gamma=5x10の-6乗となりました。
相関係数の中央値が最も高くなったgammaの再解析のパラメータは5x10の-6乗のため、これを採用します。
これで、1月のsiteCのパラメータは cost=4,epsilon=0.001,gamma=5x10の-6乗となりました。
kobayashi_yusukeMonday, October 5th, 2020 at 11:53:43 AM GMT+09:00
1月のsiteDのgammaのグラフは添付のとおりです。
相関係数の中央値が最も高くなったgammaのパラメータは5x10の-6乗のため、これを採用します。
これを用いてcostを計算しました。
相関係数の中央値が最も高くなったgammaのパラメータは5x10の-6乗のため、これを採用します。
これを用いてcostを計算しました。
kobayashi_yusukeMonday, October 5th, 2020 at 11:54:01 AM GMT+09:00
1月のsiteDのcostのグラフは添付のとおりです。
どのパラメータでも大きく変わりませんでした。
相関係数の中央値が最も高くなったcostのパラメータは4のため、これを採用します。
これを用いてepsilonを計算しました。
どのパラメータでも大きく変わりませんでした。
相関係数の中央値が最も高くなったcostのパラメータは4のため、これを採用します。
これを用いてepsilonを計算しました。
kobayashi_yusukeMonday, October 5th, 2020 at 11:54:19 AM GMT+09:00
1月のsiteDのepsilonのグラフは添付のとおりです。
1.0以外はどのパラメータでも大きく変わりませんでした。
相関係数の中央値が最も高くなったepsilonのパラメータは0.0001(0.00001と同値)のため、これを採用します。
これを用いてgammaの再計算をしました。
1.0以外はどのパラメータでも大きく変わりませんでした。
相関係数の中央値が最も高くなったepsilonのパラメータは0.0001(0.00001と同値)のため、これを採用します。
これを用いてgammaの再計算をしました。
kobayashi_yusukeMonday, October 5th, 2020 at 11:54:34 AM GMT+09:00

1月のsiteDのgammaの再解析のグラフは添付のとおりです。
相関係数の中央値が最も高くなったgammaの再解析のパラメータは5x10の-6乗のため、これを採用します。
これで、1月のsiteDのパラメータは cost=4,epsilon=0.0001,gamma=5x10の-6乗となりました。
相関係数の中央値が最も高くなったgammaの再解析のパラメータは5x10の-6乗のため、これを採用します。
これで、1月のsiteDのパラメータは cost=4,epsilon=0.0001,gamma=5x10の-6乗となりました。
kobayashi_yusukeMonday, October 5th, 2020 at 11:54:50 AM GMT+09:00


1月のsiteEのgammaのグラフは添付のとおりです。
相関係数の中央値が最も高くなったgammaのパラメータは5x10の-7乗のため、これを採用します。
これを用いてcostを計算しました。
相関係数の中央値が最も高くなったgammaのパラメータは5x10の-7乗のため、これを採用します。
これを用いてcostを計算しました。
kobayashi_yusukeMonday, October 5th, 2020 at 11:55:04 AM GMT+09:00

1月のsiteEのcostのグラフは添付のとおりです。
どのパラメータでも大きく変わりませんでした。
相関係数の中央値が最も高くなったcostのパラメータは10のため、これを採用します。
これを用いてepsilonを計算しました。
どのパラメータでも大きく変わりませんでした。
相関係数の中央値が最も高くなったcostのパラメータは10のため、これを採用します。
これを用いてepsilonを計算しました。
kobayashi_yusukeMonday, October 5th, 2020 at 11:55:23 AM GMT+09:00
1月のsiteEのepsilonのグラフは添付のとおりです。
1.0以外はどのパラメータでも大きく変わりませんでした。
相関係数の中央値が最も高くなったepsilonのパラメータは0.001(0.01と同値)のため、これを採用します。
これを用いてgammaの再計算をしました。
1.0以外はどのパラメータでも大きく変わりませんでした。
相関係数の中央値が最も高くなったepsilonのパラメータは0.001(0.01と同値)のため、これを採用します。
これを用いてgammaの再計算をしました。
kobayashi_yusukeMonday, October 5th, 2020 at 11:55:43 AM GMT+09:00


1月のsiteEのgammaの再解析のグラフは添付のとおりです。
相関係数の中央値が最も高くなったgammaの再解析のパラメータは5x10の-7乗のため、これを採用します。
これで、1月のsiteEのパラメータは cost=10,epsilon=0.001,gamma=5x10の-7乗となりました。
相関係数の中央値が最も高くなったgammaの再解析のパラメータは5x10の-7乗のため、これを採用します。
これで、1月のsiteEのパラメータは cost=10,epsilon=0.001,gamma=5x10の-7乗となりました。
kobayashi_yusukeMonday, October 5th, 2020 at 11:56:14 AM GMT+09:00

@takao-y
吉兼先生
小林です。お世話になっております。
続きまして、4月のgamma⇒cost⇒epsilon⇒gamma再解析が終わりましたのでご連絡します。
各パラメータの一覧表と手法と学習年等を記載したものをexcelとして添付します。
以下にsiteごとに、gamma,cost,epsilon,gamma再解析ごとの結果を書き込みます。
吉兼先生
小林です。お世話になっております。
続きまして、4月のgamma⇒cost⇒epsilon⇒gamma再解析が終わりましたのでご連絡します。
各パラメータの一覧表と手法と学習年等を記載したものをexcelとして添付します。
以下にsiteごとに、gamma,cost,epsilon,gamma再解析ごとの結果を書き込みます。
kobayashi_yusukeMonday, October 5th, 2020 at 11:56:29 AM GMT+09:00


4月のsiteAのgammaのグラフは添付のとおりです。
相関係数の中央値が最も高くなったgammaのパラメータは5x10の-6乗のため、これを採用します。
これを用いてcostを計算しました。
相関係数の中央値が最も高くなったgammaのパラメータは5x10の-6乗のため、これを採用します。
これを用いてcostを計算しました。
kobayashi_yusukeMonday, October 5th, 2020 at 11:56:43 AM GMT+09:00
4月のsiteAのcostのグラフは添付のとおりです。
どのパラメータでも大きく変わりませんでした。
相関係数の中央値が最も高くなったcostのパラメータは10のため、これを採用します。
これを用いてepsilonを計算しました。
どのパラメータでも大きく変わりませんでした。
相関係数の中央値が最も高くなったcostのパラメータは10のため、これを採用します。
これを用いてepsilonを計算しました。
kobayashi_yusukeMonday, October 5th, 2020 at 11:56:57 AM GMT+09:00
4月のsiteAのepsilonのグラフは添付のとおりです。
1.0以外はどのパラメータでも大きく変わりませんでした。
相関係数の中央値が最も高くなったepsilonのパラメータは0.001のため、これを採用します。
これを用いてgammaの再計算をしました。
1.0以外はどのパラメータでも大きく変わりませんでした。
相関係数の中央値が最も高くなったepsilonのパラメータは0.001のため、これを採用します。
これを用いてgammaの再計算をしました。
kobayashi_yusukeMonday, October 5th, 2020 at 11:57:13 AM GMT+09:00


4月のsiteAのgammaの再解析のグラフは添付のとおりです。
相関係数の中央値が最も高くなったgammaの再解析のパラメータは5x10の-6乗のため、これを採用します。
これで、4月のsiteAのパラメータは cost=10,epsilon=0.001,gamma=5x10の-6乗となりました。
相関係数の中央値が最も高くなったgammaの再解析のパラメータは5x10の-6乗のため、これを採用します。
これで、4月のsiteAのパラメータは cost=10,epsilon=0.001,gamma=5x10の-6乗となりました。
kobayashi_yusukeMonday, October 5th, 2020 at 11:57:27 AM GMT+09:00
4月のsiteBのgammaのグラフは添付のとおりです。
相関係数の中央値が最も高くなったgammaのパラメータは5x10の-5乗のため、これを採用します。
これを用いてcostを計算しました。
相関係数の中央値が最も高くなったgammaのパラメータは5x10の-5乗のため、これを採用します。
これを用いてcostを計算しました。
kobayashi_yusukeMonday, October 5th, 2020 at 11:57:42 AM GMT+09:00

4月のsiteBのcostのグラフは添付のとおりです。
どのパラメータでも大きく変わりませんでした。
相関係数の中央値が最も高くなったcostのパラメータは8のため、これを採用します。
これを用いてepsilonを計算しました。
どのパラメータでも大きく変わりませんでした。
相関係数の中央値が最も高くなったcostのパラメータは8のため、これを採用します。
これを用いてepsilonを計算しました。
kobayashi_yusukeMonday, October 5th, 2020 at 11:57:56 AM GMT+09:00
4月のsiteBのepsilonのグラフは添付のとおりです。
1.0以外はどのパラメータでも大きく変わりませんでした。
相関係数の中央値が最も高くなったepsilonのパラメータは0.0001 (0.001,0.00001と同値)のため、これを採用します。
これを用いてgammaの再計算をしました。
1.0以外はどのパラメータでも大きく変わりませんでした。
相関係数の中央値が最も高くなったepsilonのパラメータは0.0001 (0.001,0.00001と同値)のため、これを採用します。
これを用いてgammaの再計算をしました。
kobayashi_yusukeMonday, October 5th, 2020 at 11:58:12 AM GMT+09:00
4月のsiteBのgammaの再解析のグラフは添付のとおりです。
相関係数の中央値が最も高くなったgammaの再解析のパラメータは5x10の-5乗のため、これを採用します。
これで、4月のsiteBのパラメータは cost=8,epsilon=0.0001 ,gamma=5x10の-5乗となりました。
相関係数の中央値が最も高くなったgammaの再解析のパラメータは5x10の-5乗のため、これを採用します。
これで、4月のsiteBのパラメータは cost=8,epsilon=0.0001 ,gamma=5x10の-5乗となりました。
kobayashi_yusukeMonday, October 5th, 2020 at 11:58:27 AM GMT+09:00
4月のsiteCのgammaのグラフは添付のとおりです。
相関係数の中央値が最も高くなったgammaのパラメータは5x10の-6乗のため、これを採用します。
これを用いてcostを計算しました。
相関係数の中央値が最も高くなったgammaのパラメータは5x10の-6乗のため、これを採用します。
これを用いてcostを計算しました。
kobayashi_yusukeMonday, October 5th, 2020 at 11:59:19 AM GMT+09:00
4月のsiteCのepsilonのグラフは添付のとおりです。
1.0以外はどのパラメータでも大きく変わりませんでした。
相関係数の中央値が最も高くなったepsilonのパラメータは0.0001 (0.001,0.00001と同値)のため、これを採用します。
これを用いてgammaの再計算をしました。
1.0以外はどのパラメータでも大きく変わりませんでした。
相関係数の中央値が最も高くなったepsilonのパラメータは0.0001 (0.001,0.00001と同値)のため、これを採用します。
これを用いてgammaの再計算をしました。
kobayashi_yusukeMonday, October 5th, 2020 at 11:59:42 AM GMT+09:00


4月のsiteCのgammaの再解析のグラフは添付のとおりです。
相関係数の中央値が最も高くなったgammaの再解析のパラメータは5x10の-6乗のため、これを採用します。
これで、4月のsiteCのパラメータは cost=10,epsilon=0.0001,gamma=5x10の-6乗となりました。
相関係数の中央値が最も高くなったgammaの再解析のパラメータは5x10の-6乗のため、これを採用します。
これで、4月のsiteCのパラメータは cost=10,epsilon=0.0001,gamma=5x10の-6乗となりました。
kobayashi_yusukeMonday, October 5th, 2020 at 12:00:08 PM GMT+09:00
4月のsiteDのgammaのグラフは添付のとおりです。
相関係数の中央値が最も高くなったgammaのパラメータは5x10の-7乗のため、これを採用します。
これを用いてcostを計算しました。
相関係数の中央値が最も高くなったgammaのパラメータは5x10の-7乗のため、これを採用します。
これを用いてcostを計算しました。
kobayashi_yusukeMonday, October 5th, 2020 at 12:00:29 PM GMT+09:00
4月のsiteDのcostのグラフは添付のとおりです。
どのパラメータでも大きく変わりませんでした。
相関係数の中央値が最も高くなったcostのパラメータは20のため、これを採用します。
これを用いてepsilonを計算しました。
どのパラメータでも大きく変わりませんでした。
相関係数の中央値が最も高くなったcostのパラメータは20のため、これを採用します。
これを用いてepsilonを計算しました。
kobayashi_yusukeMonday, October 5th, 2020 at 12:00:49 PM GMT+09:00
4月のsiteDのepsilonのグラフは添付のとおりです。
1.0以外はどのパラメータでも大きく変わりませんでした。
相関係数の中央値が最も高くなったepsilonのパラメータは0.0001 (0.001,0.00001と同値)のため、これを採用します。
これを用いてgammaの再計算をしました。
1.0以外はどのパラメータでも大きく変わりませんでした。
相関係数の中央値が最も高くなったepsilonのパラメータは0.0001 (0.001,0.00001と同値)のため、これを採用します。
これを用いてgammaの再計算をしました。
kobayashi_yusukeMonday, October 5th, 2020 at 12:01:08 PM GMT+09:00


4月のsiteDのgammaの再解析のグラフは添付のとおりです。
相関係数の中央値が最も高くなったgammaの再解析のパラメータは5x10の-7乗のため、これを採用します。
これで、4月のsiteDのパラメータは cost=20,epsilon=0.0001,gamma=5x10の-7乗となりました。
相関係数の中央値が最も高くなったgammaの再解析のパラメータは5x10の-7乗のため、これを採用します。
これで、4月のsiteDのパラメータは cost=20,epsilon=0.0001,gamma=5x10の-7乗となりました。
kobayashi_yusukeMonday, October 5th, 2020 at 12:01:31 PM GMT+09:00
4月のsiteEのgammaのグラフは添付のとおりです。
相関係数の中央値が最も高くなったgammaのパラメータは5x10の-8乗のため、これを採用します。
これを用いてcostを計算しました。
相関係数の中央値が最も高くなったgammaのパラメータは5x10の-8乗のため、これを採用します。
これを用いてcostを計算しました。
kobayashi_yusukeMonday, October 5th, 2020 at 12:01:53 PM GMT+09:00
4月のsiteEのcostのグラフは添付のとおりです。
どのパラメータでも大きく変わりませんでした。
相関係数の中央値が最も高くなったcostのパラメータは1のため、これを採用します。
これを用いてepsilonを計算しました。
どのパラメータでも大きく変わりませんでした。
相関係数の中央値が最も高くなったcostのパラメータは1のため、これを採用します。
これを用いてepsilonを計算しました。
kobayashi_yusukeMonday, October 5th, 2020 at 12:02:16 PM GMT+09:00
4月のsiteEのepsilonのグラフは添付のとおりです。
1.0以外はどのパラメータでも大きく変わりませんでした。
相関係数の中央値が最も高くなったepsilonのパラメータは0.001 (0.01と同値)のため、これを採用します。
これを用いてgammaの再計算をしました。
1.0以外はどのパラメータでも大きく変わりませんでした。
相関係数の中央値が最も高くなったepsilonのパラメータは0.001 (0.01と同値)のため、これを採用します。
これを用いてgammaの再計算をしました。
kobayashi_yusukeMonday, October 5th, 2020 at 12:02:37 PM GMT+09:00
4月のsiteEのgammaの再解析のグラフは添付のとおりです。
相関係数の中央値が最も高くなったgammaの再解析のパラメータは5x10の-8乗のため、これを採用します。
これで、4月のsiteEのパラメータは cost=1,epsilon=0.001,gamma=5x10の-8乗となりました。
相関係数の中央値が最も高くなったgammaの再解析のパラメータは5x10の-8乗のため、これを採用します。
これで、4月のsiteEのパラメータは cost=1,epsilon=0.001,gamma=5x10の-8乗となりました。
kobayashi_yusukeMonday, October 5th, 2020 at 12:03:08 PM GMT+09:00

@takao-y
吉兼先生
小林です。お世話になっております。
続きまして、10月のgamma⇒cost⇒epsilon⇒gamma再解析が終わりましたのでご連絡します。
各パラメータの一覧表と手法と学習年等を記載したものをexcelとして添付します。
以下にsiteごとに、gamma,cost,epsilon,gamma再解析ごとの結果を書き込みます。
吉兼先生
小林です。お世話になっております。
続きまして、10月のgamma⇒cost⇒epsilon⇒gamma再解析が終わりましたのでご連絡します。
各パラメータの一覧表と手法と学習年等を記載したものをexcelとして添付します。
以下にsiteごとに、gamma,cost,epsilon,gamma再解析ごとの結果を書き込みます。
kobayashi_yusukeMonday, October 5th, 2020 at 12:03:23 PM GMT+09:00

10月のsiteAのgammaのグラフは添付のとおりです。
相関係数の中央値が最も高くなったgammaのパラメータは5x10の-6乗のため、これを採用します。
これを用いてcostを計算しました。
相関係数の中央値が最も高くなったgammaのパラメータは5x10の-6乗のため、これを採用します。
これを用いてcostを計算しました。
kobayashi_yusukeMonday, October 5th, 2020 at 12:03:37 PM GMT+09:00
10月のsiteAのcostのグラフは添付のとおりです。
どのパラメータでも大きく変わりませんでした。
相関係数の中央値が最も高くなったcostのパラメータは20のため、これを採用します。
これを用いてepsilonを計算しました。
どのパラメータでも大きく変わりませんでした。
相関係数の中央値が最も高くなったcostのパラメータは20のため、これを採用します。
これを用いてepsilonを計算しました。
kobayashi_yusukeMonday, October 5th, 2020 at 12:03:52 PM GMT+09:00


10月のsiteAのepsilonのグラフは添付のとおりです。
1.0以外はどのパラメータでも大きく変わりませんでした。
相関係数の中央値が最も高くなったepsilonのパラメータは0.001のため、これを採用します。
これを用いてgammaの再計算をしました。
1.0以外はどのパラメータでも大きく変わりませんでした。
相関係数の中央値が最も高くなったepsilonのパラメータは0.001のため、これを採用します。
これを用いてgammaの再計算をしました。
kobayashi_yusukeMonday, October 5th, 2020 at 12:04:08 PM GMT+09:00


10月のsiteAのgammaの再解析のグラフは添付のとおりです。
相関係数の中央値が最も高くなったgammaの再解析のパラメータは5x10の-6乗のため、これを採用します。
これで、10月のsiteAのパラメータは cost=20,epsilon=0.001,gamma=5x10の-6乗となりました。
相関係数の中央値が最も高くなったgammaの再解析のパラメータは5x10の-6乗のため、これを採用します。
これで、10月のsiteAのパラメータは cost=20,epsilon=0.001,gamma=5x10の-6乗となりました。
kobayashi_yusukeMonday, October 5th, 2020 at 12:04:40 PM GMT+09:00
10月のsiteBのgammaのグラフは添付のとおりです。
相関係数の中央値が最も高くなったgammaのパラメータは5x10の-6乗のため、これを採用します。
これを用いてcostを計算しました。
相関係数の中央値が最も高くなったgammaのパラメータは5x10の-6乗のため、これを採用します。
これを用いてcostを計算しました。
kobayashi_yusukeMonday, October 5th, 2020 at 12:04:56 PM GMT+09:00
10月のsiteBのcostのグラフは添付のとおりです。
どのパラメータでも大きく変わりませんでした。
相関係数の中央値が最も高くなったcostのパラメータは20(30,10と同値)のため、これを採用します。
これを用いてepsilonを計算しました。
どのパラメータでも大きく変わりませんでした。
相関係数の中央値が最も高くなったcostのパラメータは20(30,10と同値)のため、これを採用します。
これを用いてepsilonを計算しました。
kobayashi_yusukeMonday, October 5th, 2020 at 12:05:12 PM GMT+09:00
10月のsiteBのepsilonのグラフは添付のとおりです。
1.0以外はどのパラメータでも大きく変わりませんでした。
相関係数の中央値が最も高くなったepsilonのパラメータは0.0001 (0.001,0.00001と同値)のため、これを採用します。
これを用いてgammaの再計算をしました。
1.0以外はどのパラメータでも大きく変わりませんでした。
相関係数の中央値が最も高くなったepsilonのパラメータは0.0001 (0.001,0.00001と同値)のため、これを採用します。
これを用いてgammaの再計算をしました。
kobayashi_yusukeMonday, October 5th, 2020 at 12:05:27 PM GMT+09:00
10月のsiteBのgammaの再解析のグラフは添付のとおりです。
相関係数の中央値が最も高くなったgammaの再解析のパラメータは5x10の-6乗のため、これを採用します。
これで、10月のsiteBのパラメータは cost=20,epsilon=0.0001 ,gamma=5x10の-6乗となりました。
相関係数の中央値が最も高くなったgammaの再解析のパラメータは5x10の-6乗のため、これを採用します。
これで、10月のsiteBのパラメータは cost=20,epsilon=0.0001 ,gamma=5x10の-6乗となりました。
kobayashi_yusukeMonday, October 5th, 2020 at 12:05:46 PM GMT+09:00
10月のsiteCのgammaのグラフは添付のとおりです。
相関係数の中央値が最も高くなったgammaのパラメータは5x10の-7乗のため、これを採用します。
これを用いてcostを計算しました。
相関係数の中央値が最も高くなったgammaのパラメータは5x10の-7乗のため、これを採用します。
これを用いてcostを計算しました。
kobayashi_yusukeMonday, October 5th, 2020 at 12:06:01 PM GMT+09:00
10月のsiteCのcostのグラフは添付のとおりです。
どのパラメータでも大きく変わりませんでした。
相関係数の中央値が最も高くなったcostのパラメータは20のため、これを採用します。
これを用いてepsilonを計算しました。
どのパラメータでも大きく変わりませんでした。
相関係数の中央値が最も高くなったcostのパラメータは20のため、これを採用します。
これを用いてepsilonを計算しました。
kobayashi_yusukeMonday, October 5th, 2020 at 12:06:16 PM GMT+09:00

10月のsiteCのepsilonのグラフは添付のとおりです。
1.0以外はどのパラメータでも大きく変わりませんでした。
相関係数の中央値が最も高くなったepsilonのパラメータは0.0001(0.00001と同値)のため、これを採用します。
これを用いてgammaの再計算をしました。
1.0以外はどのパラメータでも大きく変わりませんでした。
相関係数の中央値が最も高くなったepsilonのパラメータは0.0001(0.00001と同値)のため、これを採用します。
これを用いてgammaの再計算をしました。
kobayashi_yusukeMonday, October 5th, 2020 at 12:06:33 PM GMT+09:00
10月のsiteCのgammaの再解析のグラフは添付のとおりです。
相関係数の中央値が最も高くなったgammaの再解析のパラメータは5x10の-7乗(5x10の-8乗と同値)のため、これを採用します。
これで、10月のsiteCのパラメータは cost=20,epsilon=0.0001,gamma=5x10の-7乗となりました。
相関係数の中央値が最も高くなったgammaの再解析のパラメータは5x10の-7乗(5x10の-8乗と同値)のため、これを採用します。
これで、10月のsiteCのパラメータは cost=20,epsilon=0.0001,gamma=5x10の-7乗となりました。
kobayashi_yusukeMonday, October 5th, 2020 at 12:06:50 PM GMT+09:00
10月のsiteDのgammaのグラフは添付のとおりです。
相関係数の中央値が最も高くなったgammaのパラメータは5x10の-7乗のため、これを採用します。
これを用いてcostを計算しました。
相関係数の中央値が最も高くなったgammaのパラメータは5x10の-7乗のため、これを採用します。
これを用いてcostを計算しました。
kobayashi_yusukeMonday, October 5th, 2020 at 12:07:05 PM GMT+09:00
10月のsiteDのcostのグラフは添付のとおりです。
どのパラメータでも大きく変わりませんでした。
相関係数の中央値が最も高くなったcostのパラメータは8(10,6と同値)のため、これを採用します。
これを用いてepsilonを計算しました。
どのパラメータでも大きく変わりませんでした。
相関係数の中央値が最も高くなったcostのパラメータは8(10,6と同値)のため、これを採用します。
これを用いてepsilonを計算しました。
kobayashi_yusukeMonday, October 5th, 2020 at 12:07:21 PM GMT+09:00

10月のsiteDのepsilonのグラフは添付のとおりです。
1.0以外はどのパラメータでも大きく変わりませんでした。
相関係数の中央値が最も高くなったepsilonのパラメータは0.0001(0.00001と同値)のため、これを採用します。
これを用いてgammaの再計算をしました。
1.0以外はどのパラメータでも大きく変わりませんでした。
相関係数の中央値が最も高くなったepsilonのパラメータは0.0001(0.00001と同値)のため、これを採用します。
これを用いてgammaの再計算をしました。
kobayashi_yusukeMonday, October 5th, 2020 at 12:07:35 PM GMT+09:00

10月のsiteDのgammaの再解析のグラフは添付のとおりです。
相関係数の中央値が最も高くなったgammaの再解析のパラメータは5x10の-7乗のため、これを採用します。
これで、10月のsiteDのパラメータは cost=8,epsilon=0.0001,gamma=5x10の-7乗となりました。
相関係数の中央値が最も高くなったgammaの再解析のパラメータは5x10の-7乗のため、これを採用します。
これで、10月のsiteDのパラメータは cost=8,epsilon=0.0001,gamma=5x10の-7乗となりました。
kobayashi_yusukeMonday, October 5th, 2020 at 12:07:54 PM GMT+09:00


10月のsiteEのgammaのグラフは添付のとおりです。
相関係数の中央値が最も高くなったgammaのパラメータは5x10の-8乗のため、これを採用します。
これを用いてcostを計算しました。
相関係数の中央値が最も高くなったgammaのパラメータは5x10の-8乗のため、これを採用します。
これを用いてcostを計算しました。
kobayashi_yusukeMonday, October 5th, 2020 at 12:08:12 PM GMT+09:00
10月のsiteEのcostのグラフは添付のとおりです。
どのパラメータでも大きく変わりませんでした。
相関係数の中央値が最も高くなったcostのパラメータは4のため、これを採用します。
これを用いてepsilonを計算しました。
どのパラメータでも大きく変わりませんでした。
相関係数の中央値が最も高くなったcostのパラメータは4のため、これを採用します。
これを用いてepsilonを計算しました。
kobayashi_yusukeMonday, October 5th, 2020 at 12:08:26 PM GMT+09:00
10月のsiteEのepsilonのグラフは添付のとおりです。
1.0以外はどのパラメータでも大きく変わりませんでした。
相関係数の中央値が最も高くなったepsilonのパラメータは0.00001のため、これを採用します。
これを用いてgammaの再計算をしました。
1.0以外はどのパラメータでも大きく変わりませんでした。
相関係数の中央値が最も高くなったepsilonのパラメータは0.00001のため、これを採用します。
これを用いてgammaの再計算をしました。
kobayashi_yusukeMonday, October 5th, 2020 at 12:08:40 PM GMT+09:00


10月のsiteEのgammaの再解析のグラフは添付のとおりです。
相関係数の中央値が最も高くなったgammaの再解析のパラメータは5x10の-8乗のため、これを採用します。
これで、10月のsiteEのパラメータは cost=1,epsilon=0.001,gamma=5x10の-8乗となりました。
相関係数の中央値が最も高くなったgammaの再解析のパラメータは5x10の-8乗のため、これを採用します。
これで、10月のsiteEのパラメータは cost=1,epsilon=0.001,gamma=5x10の-8乗となりました。
kobayashi_yusukeMonday, October 5th, 2020 at 12:09:01 PM GMT+09:00
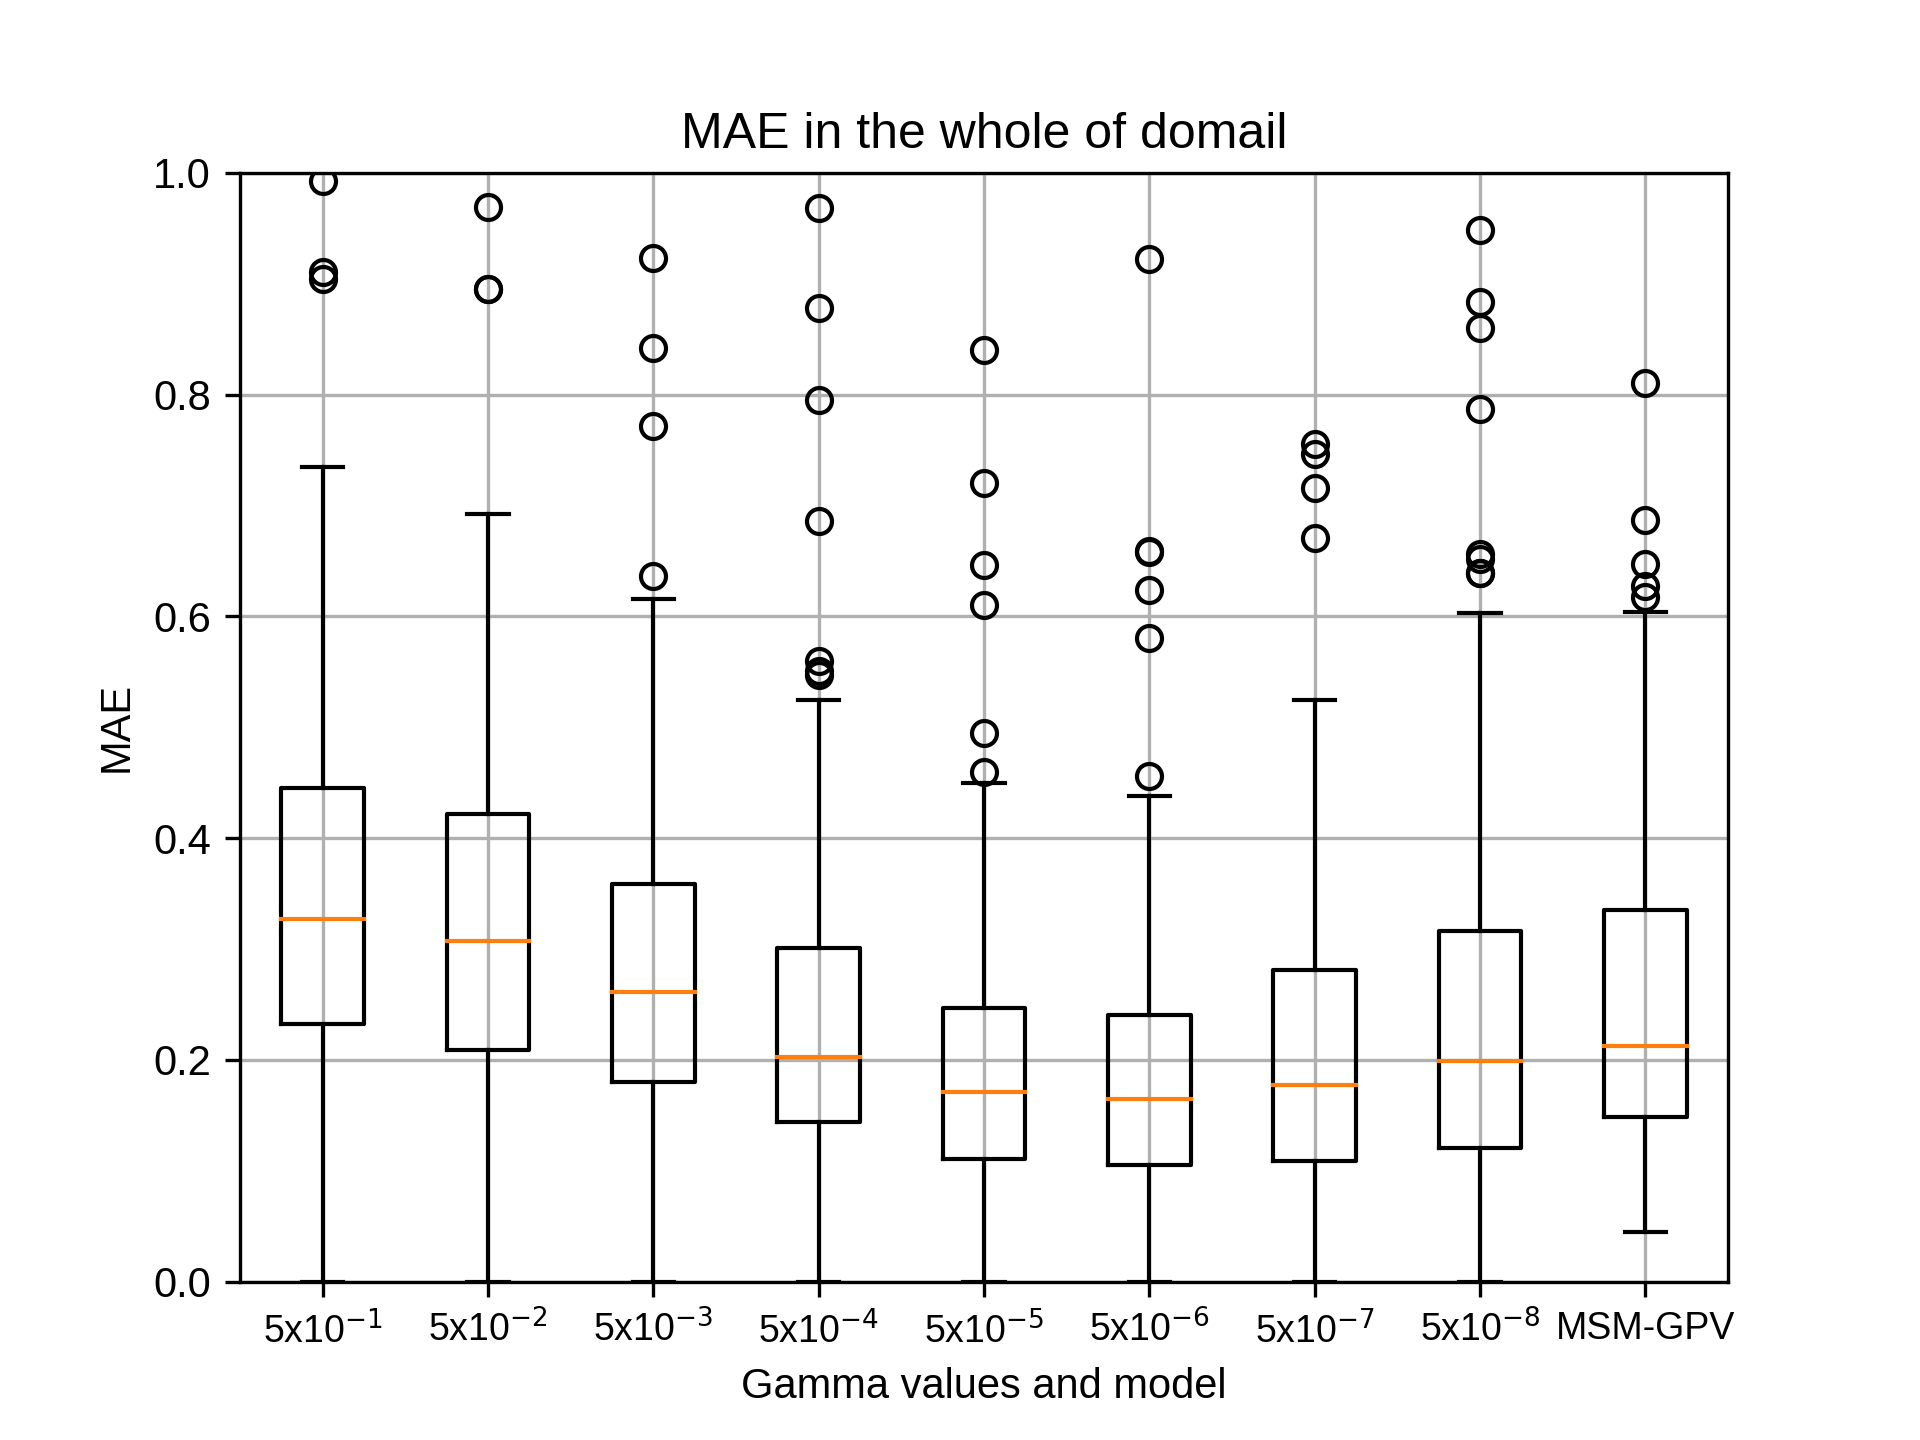
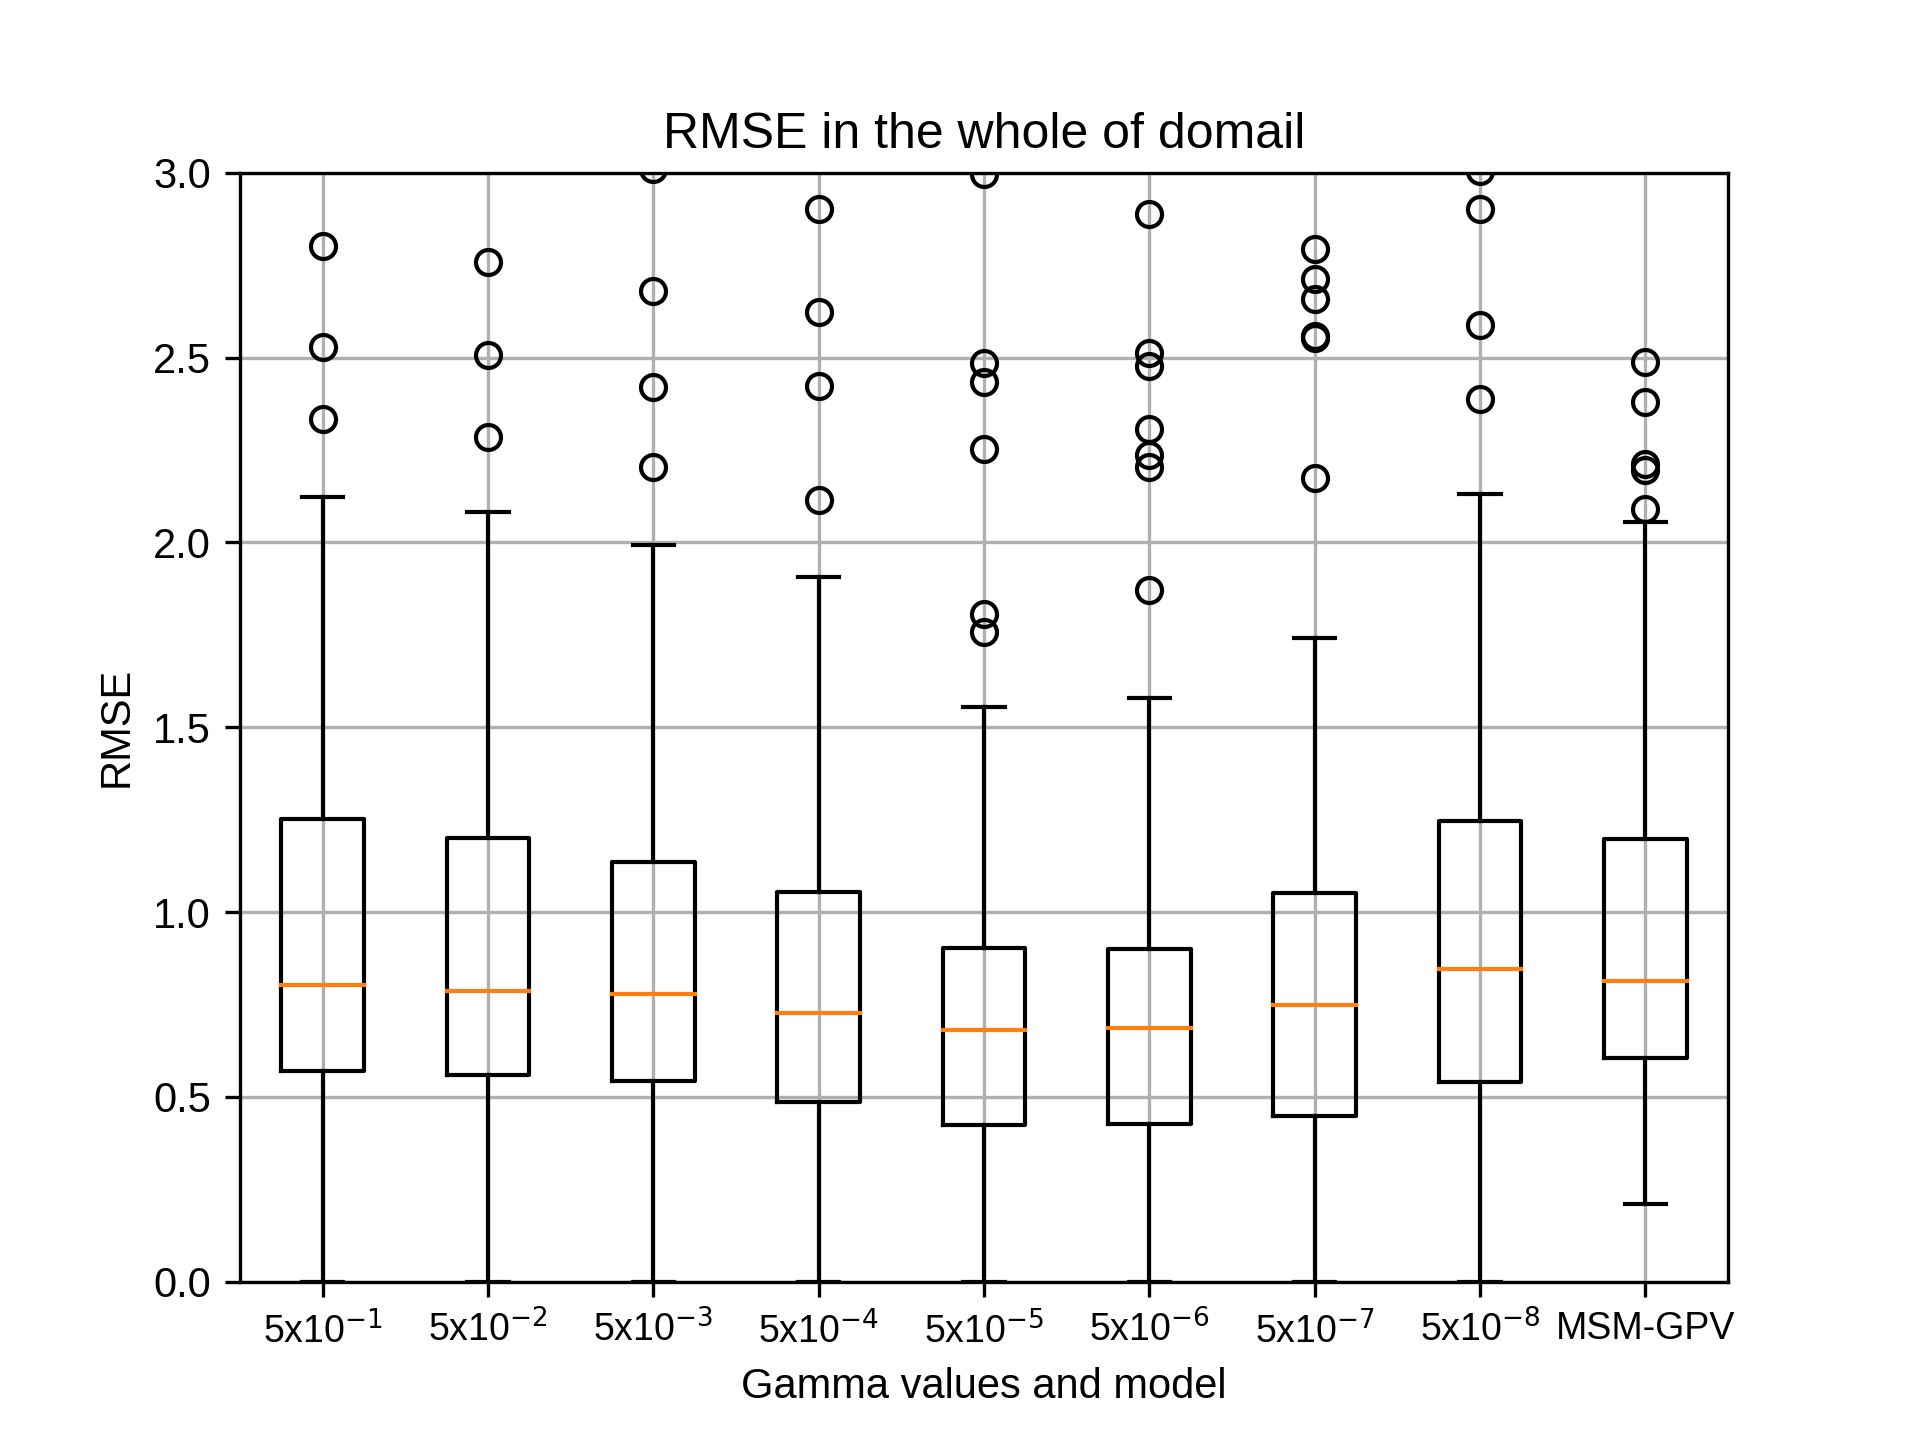
これにて、1月、4月、7月、10月のハイパーパラメータの設定は終わります。
全体的な傾向として、gammaは影響しますが、cost、epsilon(1.0を除く)のパラメータは変化させてもほとんど変わらないことがわかりました。
残りとしまして、7月のsiteD,siteEにおける陸上につきまして行いたいと考えております。
以上、よろしくお願いいたします。
全体的な傾向として、gammaは影響しますが、cost、epsilon(1.0を除く)のパラメータは変化させてもほとんど変わらないことがわかりました。
残りとしまして、7月のsiteD,siteEにおける陸上につきまして行いたいと考えております。
以上、よろしくお願いいたします。
takao-yMonday, October 5th, 2020 at 3:42:11 PM GMT+09:00
小林様。ありがとうございます。5x10⁻⁸で最も相関係数が高いケースについて、5x10⁻⁹, 5x10⁻¹⁰を追加して(5x10⁻¹, 5x10⁻²の代わりに)、再度実施してもらえますでしょうか。
kobayashi_yusukeMonday, October 5th, 2020 at 5:08:25 PM GMT+09:00
@takao-y
吉兼先生
小林です。お世話になっております。
5x10⁻⁸で最も相関係数が高いケースにつきまして、5x10⁻⁹, 5x10⁻¹⁰を追加して(5x10⁻¹, 5x10⁻²の代わりに)、再度gammaを実施いたします。この際のcost, epsilonのパラメータはこれまでで最も相関が高い値を利用します。結果が出ましたらお伝えいたします。
以上、よろしくお願いいたします。
吉兼先生
小林です。お世話になっております。
5x10⁻⁸で最も相関係数が高いケースにつきまして、5x10⁻⁹, 5x10⁻¹⁰を追加して(5x10⁻¹, 5x10⁻²の代わりに)、再度gammaを実施いたします。この際のcost, epsilonのパラメータはこれまでで最も相関が高い値を利用します。結果が出ましたらお伝えいたします。
以上、よろしくお願いいたします。
kobayashi_yusukeWednesday, October 7th, 2020 at 2:07:12 PM GMT+09:00
@takao-y
吉兼先生
小林です。お世話になっております。
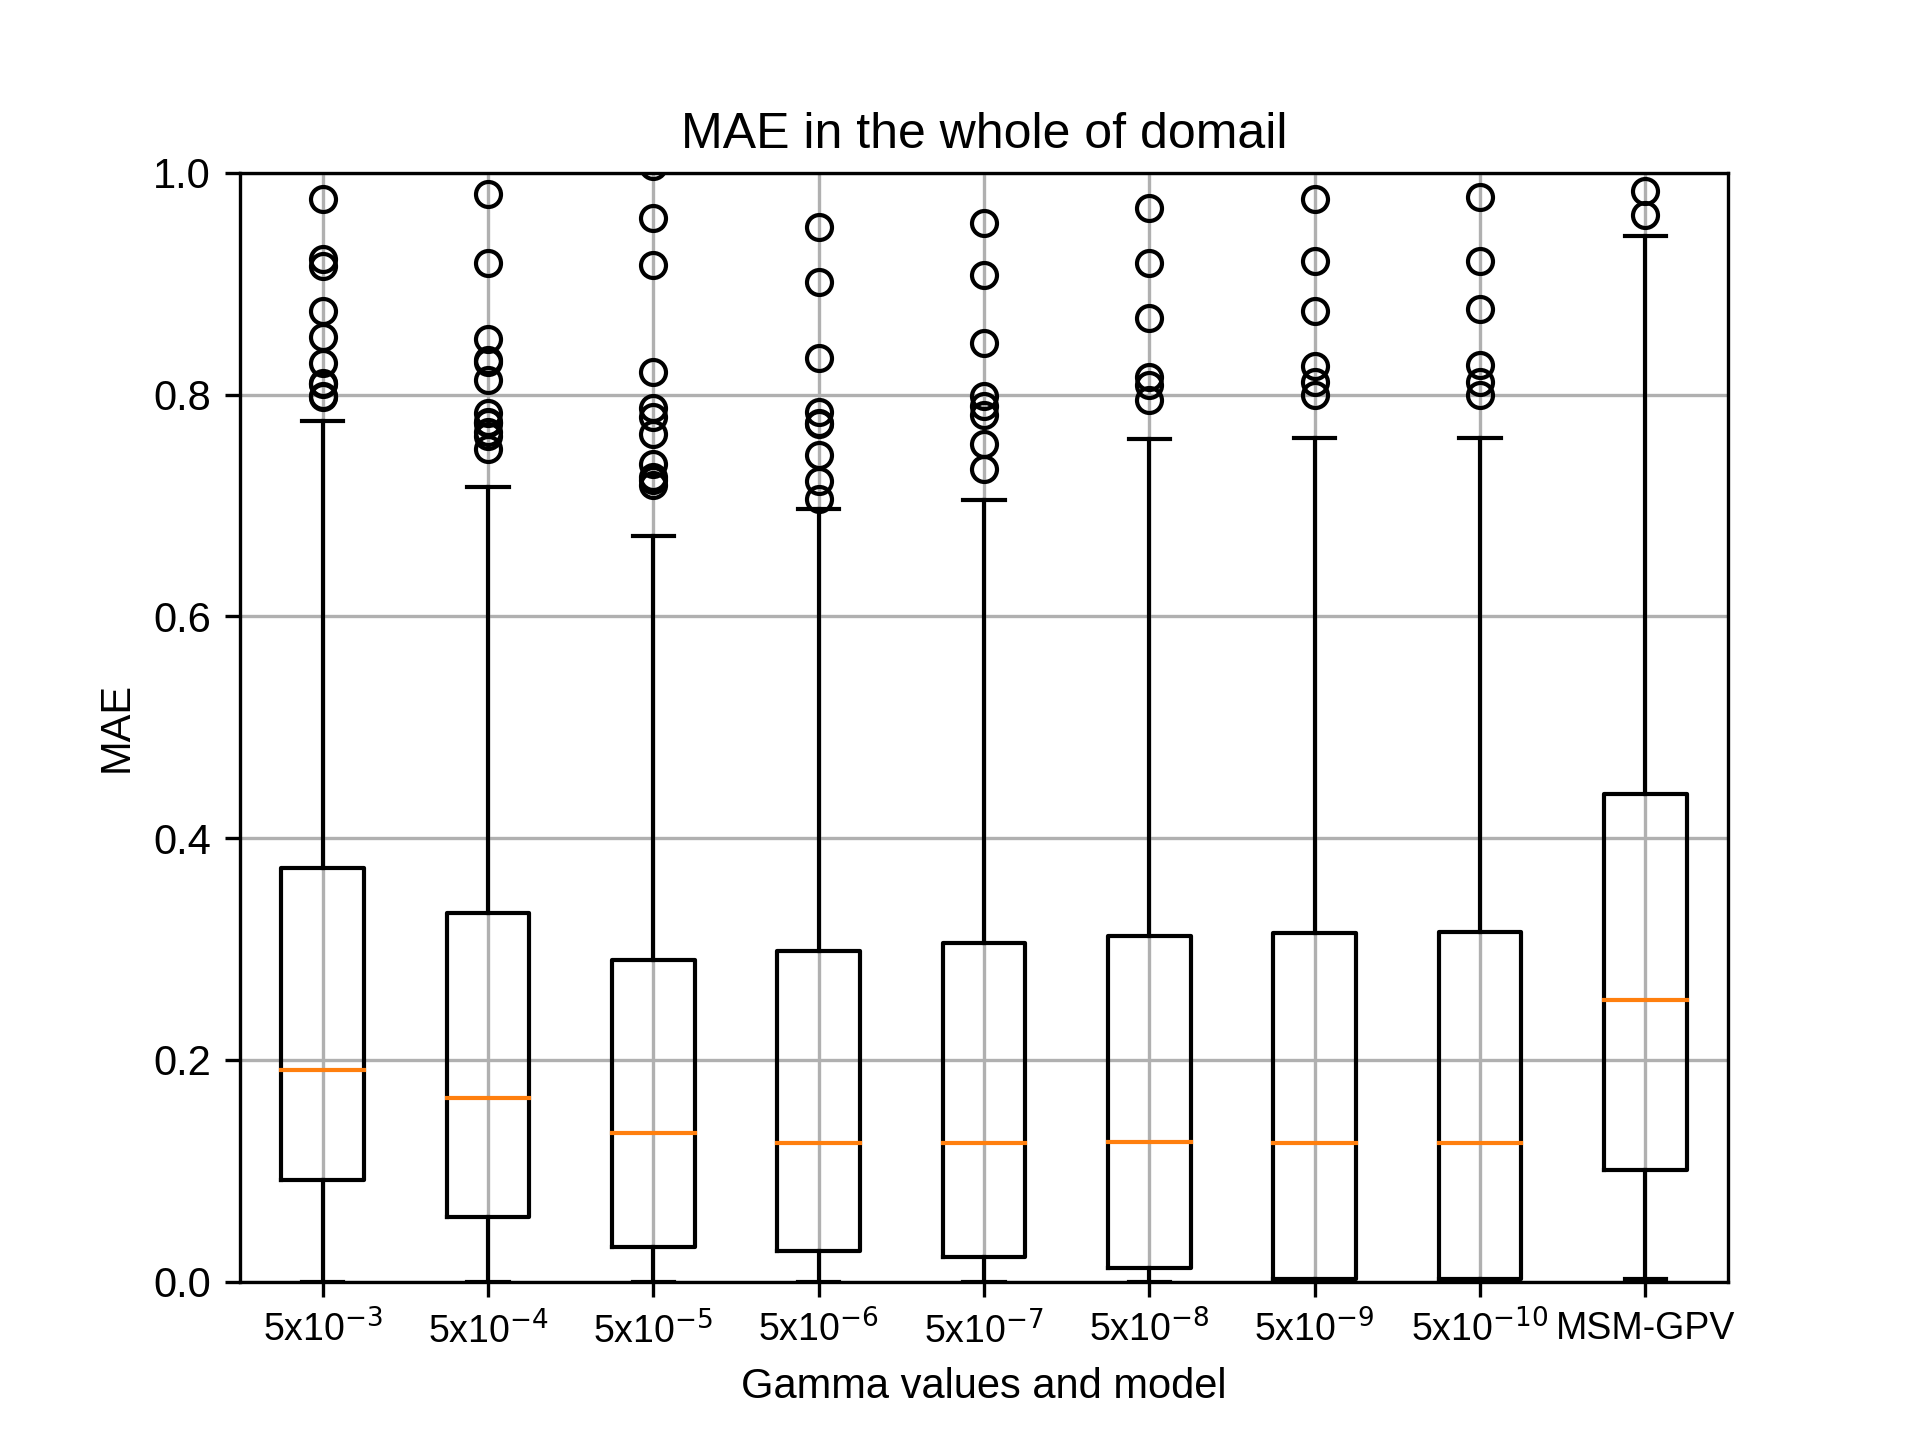
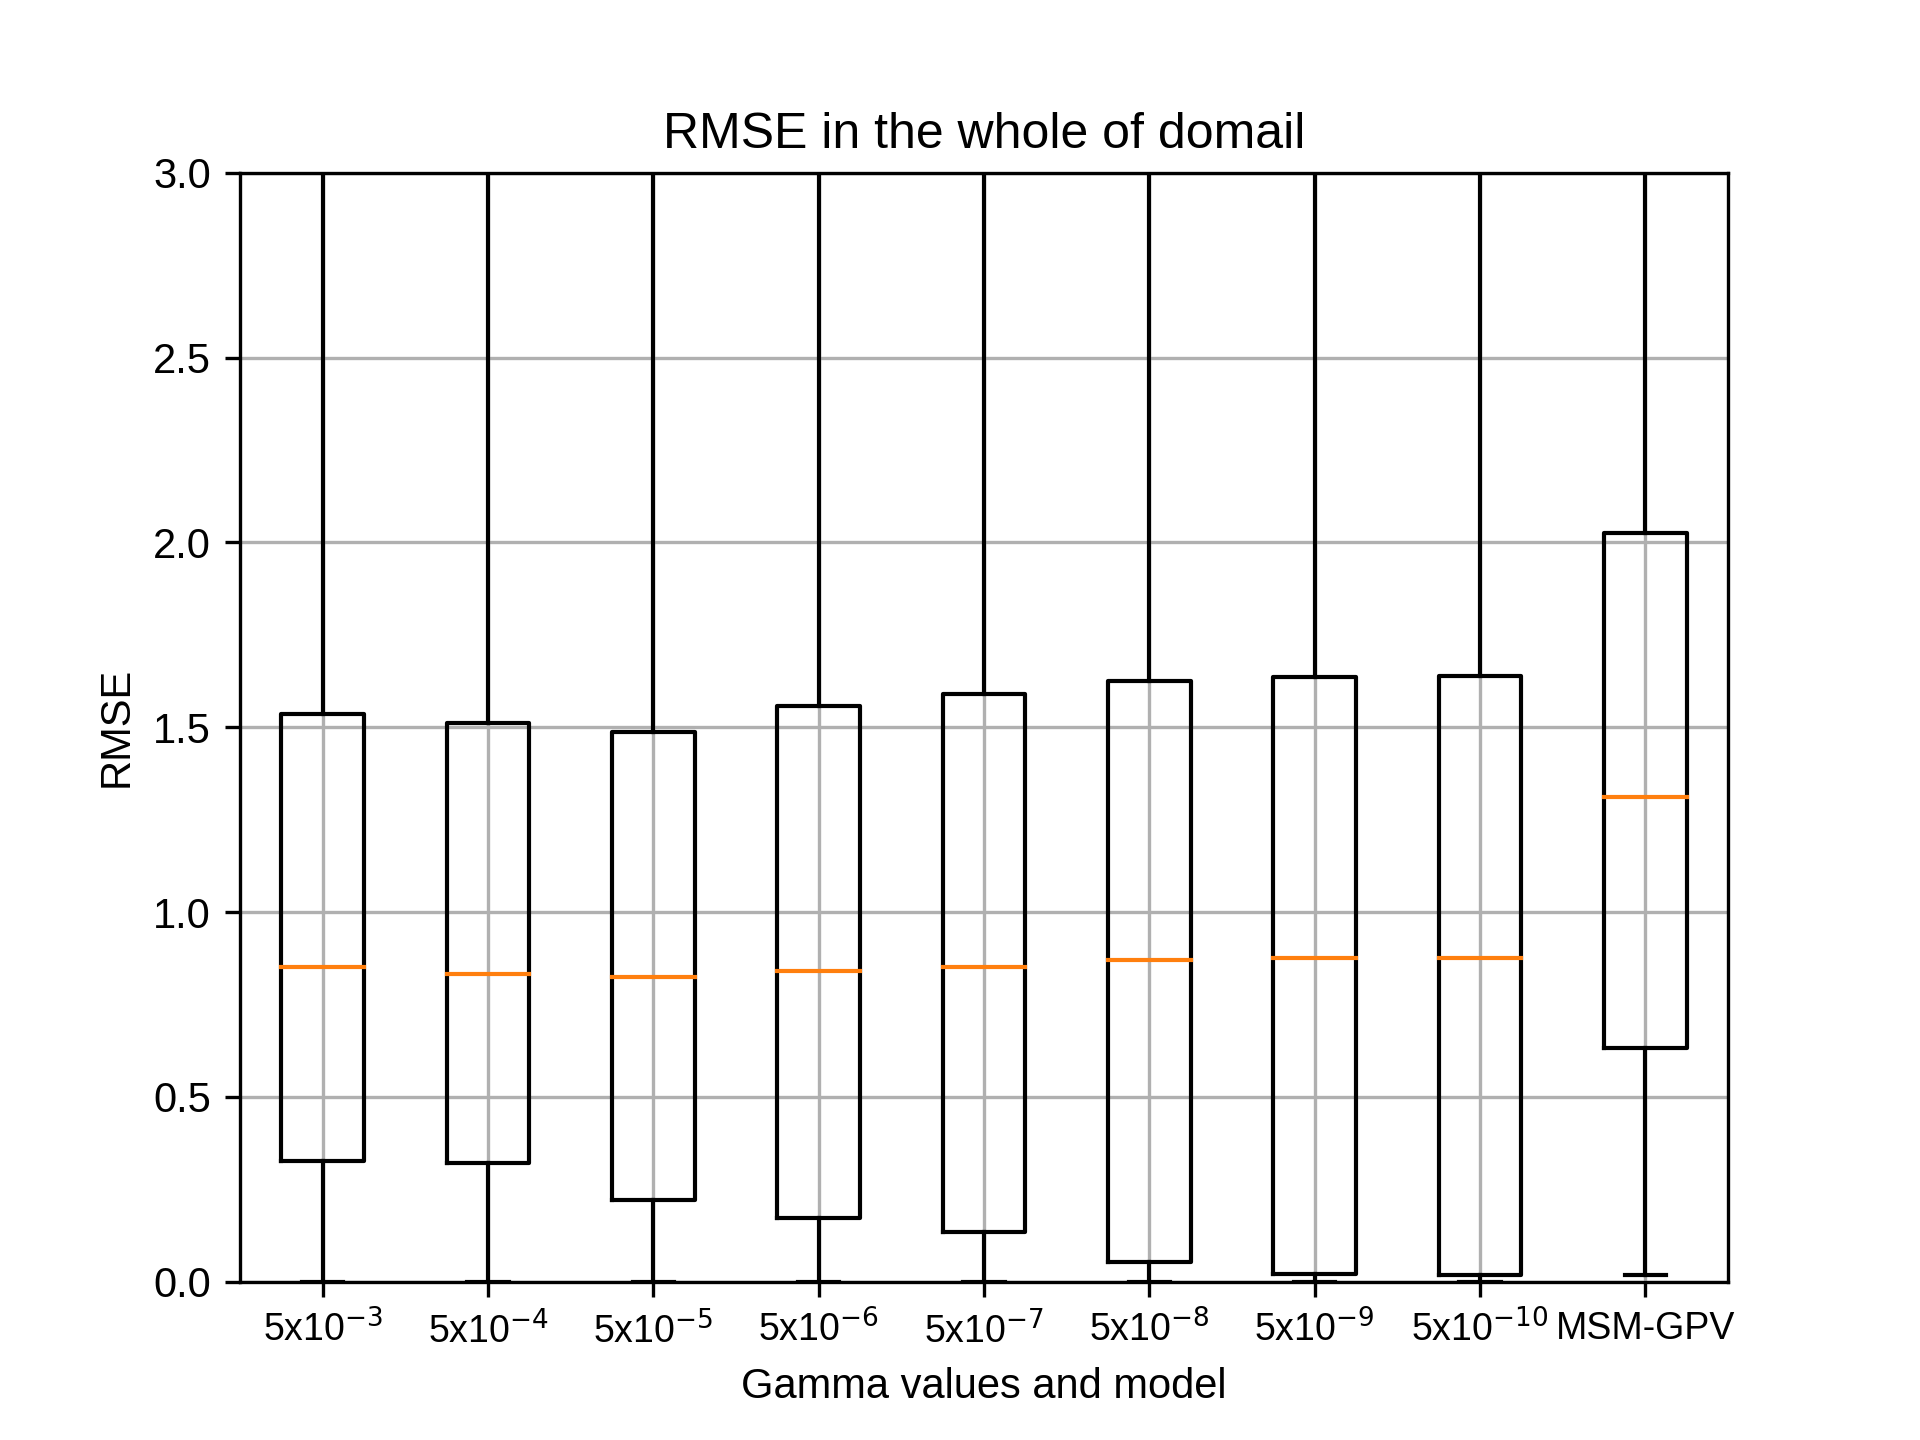
5x10⁻⁸で最も相関係数が高いケースにつきまして、5x10⁻⁹, 5x10⁻¹⁰を追加して(5x10⁻¹, 5x10⁻²の代わりに)、gammaを再計算しました。
5x10⁻⁸で最も相関係数が高くなったのは、
(1) 4月のsiteE, (2)7月 siteD (3)10月 siteEでした。
この結果、(1) 4月のsiteEは5x10⁻¹⁰で最大、(2)7月 siteDは5x10⁻⁸で最大、(3)10月 siteEは5x10⁻⁸で最大となりました。
(1) 4月のsiteEは5x10⁻¹⁰で最大となったため、5x10-11, 5x10-12を追加して(5x10⁻³, 5x10⁻⁴の代わりに)、gammaを再計算しました。
この結果、(1) 4月のsiteEは5x10⁻¹⁰で最大となりました。なお、5x10⁻¹⁰と5x10-12で相関係数の中央値は同値でした。
以下にグラフを載せます。
吉兼先生
小林です。お世話になっております。
5x10⁻⁸で最も相関係数が高いケースにつきまして、5x10⁻⁹, 5x10⁻¹⁰を追加して(5x10⁻¹, 5x10⁻²の代わりに)、gammaを再計算しました。
5x10⁻⁸で最も相関係数が高くなったのは、
(1) 4月のsiteE, (2)7月 siteD (3)10月 siteEでした。
この結果、(1) 4月のsiteEは5x10⁻¹⁰で最大、(2)7月 siteDは5x10⁻⁸で最大、(3)10月 siteEは5x10⁻⁸で最大となりました。
(1) 4月のsiteEは5x10⁻¹⁰で最大となったため、5x10-11, 5x10-12を追加して(5x10⁻³, 5x10⁻⁴の代わりに)、gammaを再計算しました。
この結果、(1) 4月のsiteEは5x10⁻¹⁰で最大となりました。なお、5x10⁻¹⁰と5x10-12で相関係数の中央値は同値でした。
以下にグラフを載せます。
kobayashi_yusukeWednesday, October 7th, 2020 at 2:07:45 PM GMT+09:00

まず、(1) 4月のsiteEの結果です。
パラメータはcost=1, epsilon=0.001としました。5x10⁻¹⁰と5x10-12で最大となりました。
5x10⁻⁸より小さい場合はほとんど変化はございませんでした。
パラメータはcost=1, epsilon=0.001としました。5x10⁻¹⁰と5x10-12で最大となりました。
5x10⁻⁸より小さい場合はほとんど変化はございませんでした。
kobayashi_yusukeWednesday, October 7th, 2020 at 2:09:18 PM GMT+09:00

続いて、(2)7月 siteDの結果です。
パラメータはcost=2, epsilon=0.0001としました。5x10⁻⁸で最大となりました。
5x10⁻⁷より小さい場合はほとんど変化はございませんでした。
パラメータはcost=2, epsilon=0.0001としました。5x10⁻⁸で最大となりました。
5x10⁻⁷より小さい場合はほとんど変化はございませんでした。
kobayashi_yusukeWednesday, October 7th, 2020 at 2:10:17 PM GMT+09:00

最後に、(3)10月 siteEの結果です。
パラメータはcost=4, epsilon=0.00001としました。5x10⁻⁸で最大となりました。
パラメータはcost=4, epsilon=0.00001としました。5x10⁻⁸で最大となりました。
kobayashi_yusukeWednesday, October 7th, 2020 at 2:10:34 PM GMT+09:00
これで残りはsiteD,siteEの陸上での結果のみとなりました。
こちらも改めて結果をご連絡いたします。
以上、よろしくお願いいたします。
こちらも改めて結果をご連絡いたします。
以上、よろしくお願いいたします。
takao-yWednesday, October 7th, 2020 at 2:15:53 PM GMT+09:00
小林様。ありがとうございます。D,Eの陸上での実験と平行して、ここで算出したハイパーパラメータを用いて全グリッドでの推定をお願いできますでしょうか。プログラムは以下の場所にあります。python用に一部書き換えが必要ですが、もし問題などありましたらご連絡ください。
takao-yWednesday, October 7th, 2020 at 2:17:42 PM GMT+09:00
小林様。すみません。dropboxのアドレスを忘れていました。
https://www.dropbox.com/s/x7r62s6z5960kkc/ml-region1-all-20200915.tar.gz?dl=0
よろしくお願いいたします。
https://www.dropbox.com/s/x7r62s6z5960kkc/ml-region1-all-20200915.tar.gz?dl=0
よろしくお願いいたします。
kobayashi_yusukeWednesday, October 7th, 2020 at 5:28:05 PM GMT+09:00
@takao-y
吉兼先生
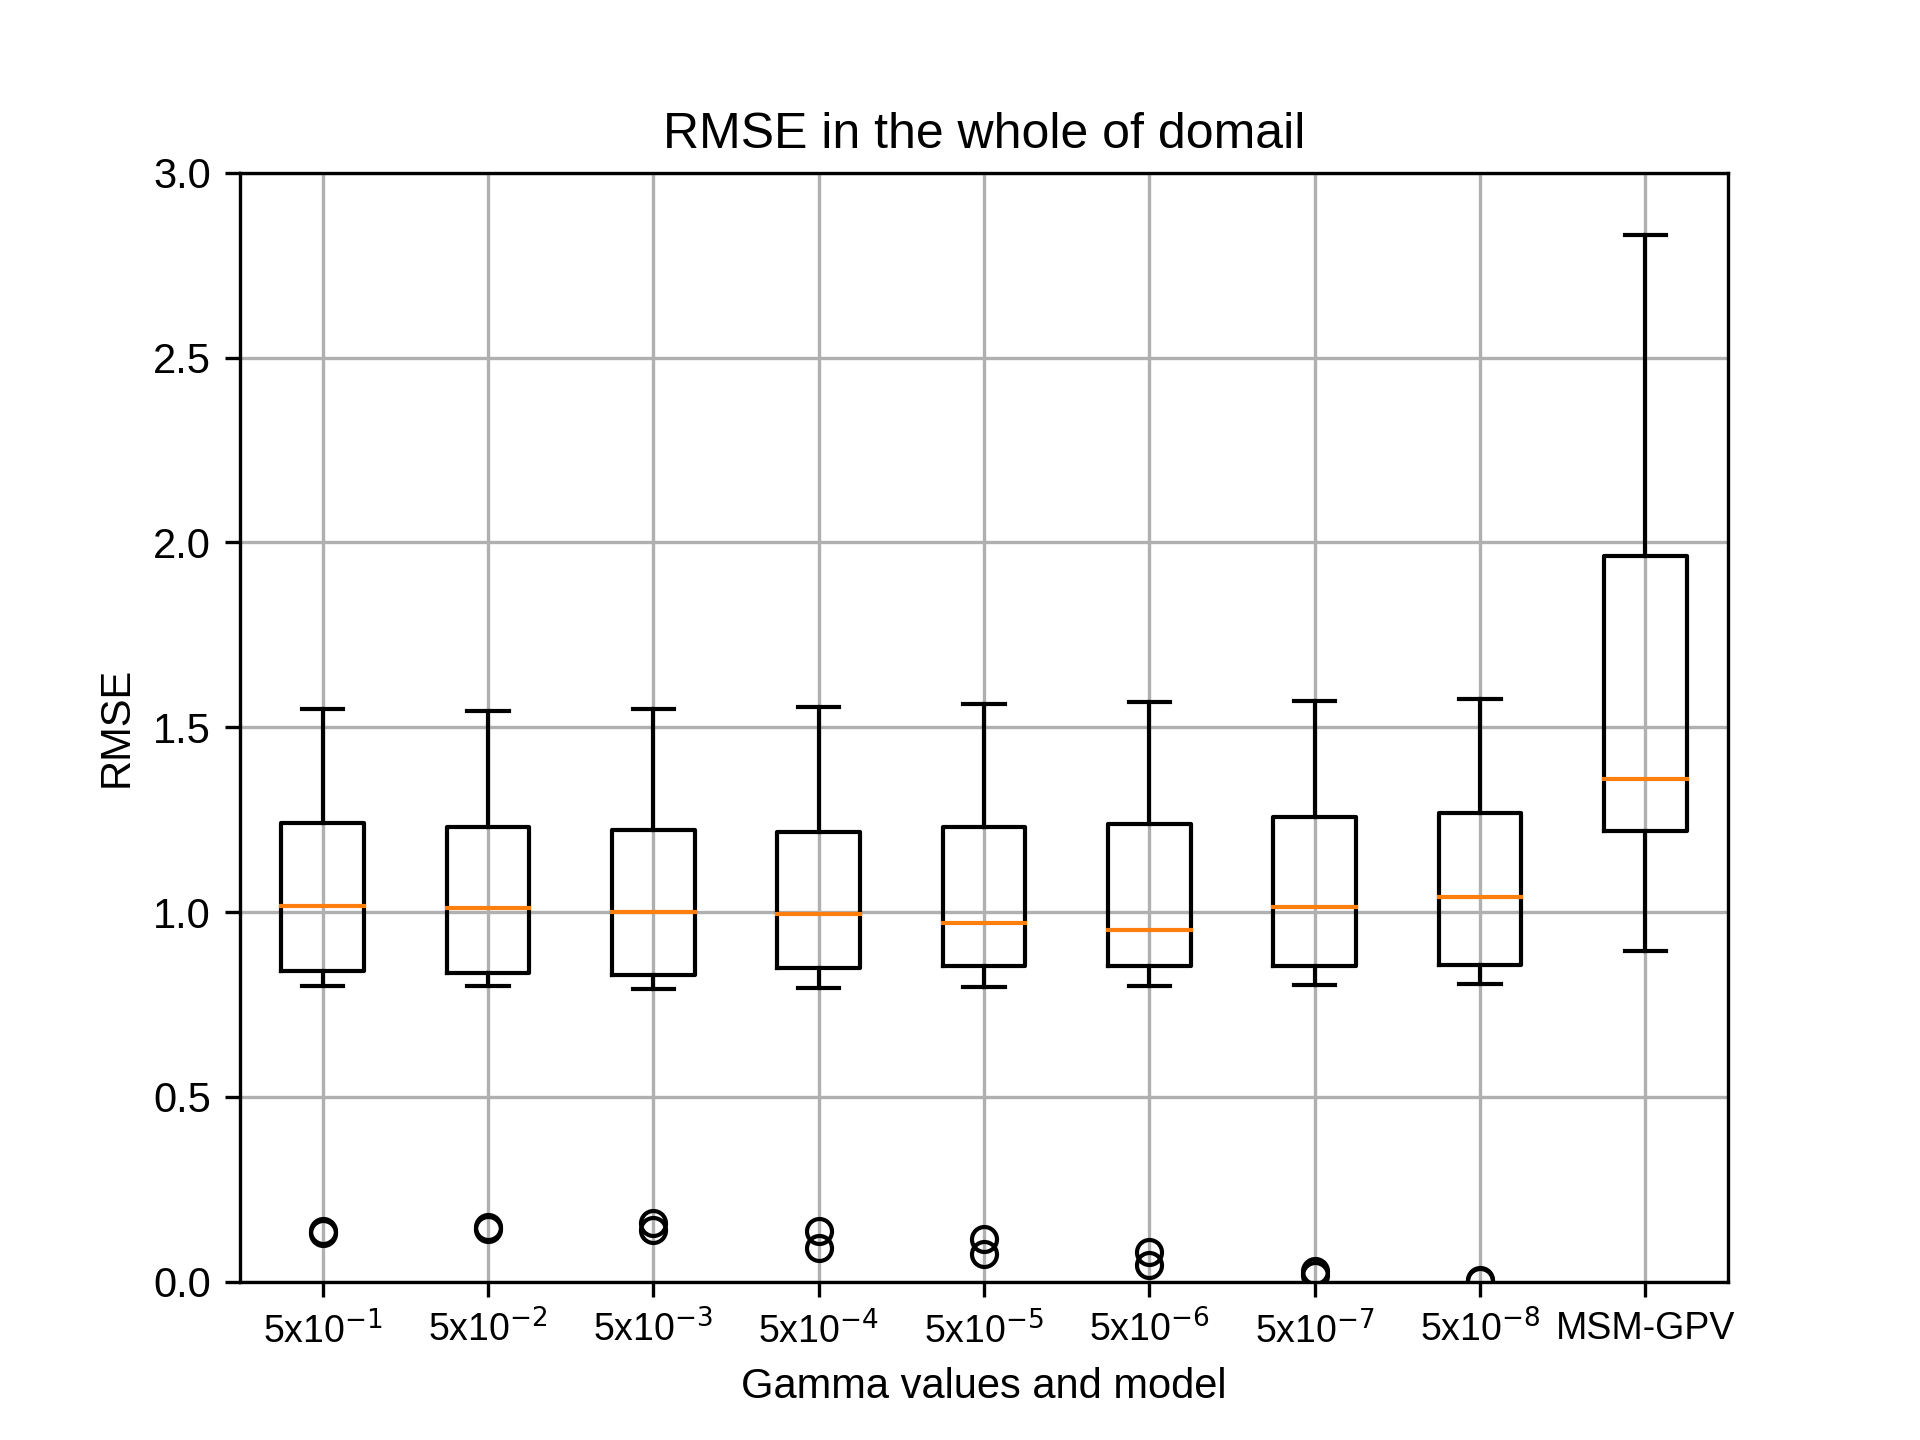
お返事ありがとうございます。D,Eの陸上の結果につきましては改めてご連絡いたします。
そして、pythonの書き換えを含む新たなプログラムを用いた全グリッド推定の件につきましては、現在弊財団はJAXA様との契約で動いておりますので、一旦確認させていただいたのちに引き受けの可否をご回答させていただけると幸いです。
以上、よろしくお願いいたします。
吉兼先生
お返事ありがとうございます。D,Eの陸上の結果につきましては改めてご連絡いたします。
そして、pythonの書き換えを含む新たなプログラムを用いた全グリッド推定の件につきましては、現在弊財団はJAXA様との契約で動いておりますので、一旦確認させていただいたのちに引き受けの可否をご回答させていただけると幸いです。
以上、よろしくお願いいたします。
takao-yThursday, October 8th, 2020 at 10:05:20 AM GMT+09:00
小林様。すみません。あまり契約を理解していないのですが、pythonへの書き換えが問題でしたら、その部分については私の方で実施しますので、早めにご連絡いただければと思います。よろしくお願いいたします。
kobayashi_yusukeMonday, October 12th, 2020 at 2:43:51 PM GMT+09:00
吉兼先生
お返事ありがとうございます。pythonの書き換えだけでなく全体的な問題でございますので一旦確認させてください。以上、よろしくお願いいたします。
お返事ありがとうございます。pythonの書き換えだけでなく全体的な問題でございますので一旦確認させてください。以上、よろしくお願いいたします。
kobayashi_yusukeWednesday, October 7th, 2020 at 8:02:50 PM GMT+09:00
@takao-y
吉兼先生
siteD,siteEの陸上での結果が出ましたのでご報告いたします。
7月のデータを用いて、cost,epsilonのパラメータは最適となりましたものを用いて行いました。
まずはsiteDにつきましてご報告いたします。
最適となりましたcost=10,epsilon=0.001で緯度経度(127.8,26.4)の地図で示した位置1か所で行いました。
結果は図のとおりです。
吉兼先生
siteD,siteEの陸上での結果が出ましたのでご報告いたします。
7月のデータを用いて、cost,epsilonのパラメータは最適となりましたものを用いて行いました。
まずはsiteDにつきましてご報告いたします。
最適となりましたcost=10,epsilon=0.001で緯度経度(127.8,26.4)の地図で示した位置1か所で行いました。
結果は図のとおりです。
kobayashi_yusukeWednesday, October 7th, 2020 at 8:05:59 PM GMT+09:00
kobayashi_yusukeWednesday, October 7th, 2020 at 8:06:46 PM GMT+09:00


参考として、siteD全体
x:20 30 40 50 60 70 80
y:20 30 40 50 60 70
での結果は図のとおりです(再掲)。パラメータは上と同じです。
x:20 30 40 50 60 70 80
y:20 30 40 50 60 70
での結果は図のとおりです(再掲)。パラメータは上と同じです。
kobayashi_yusukeWednesday, October 7th, 2020 at 8:07:29 PM GMT+09:00

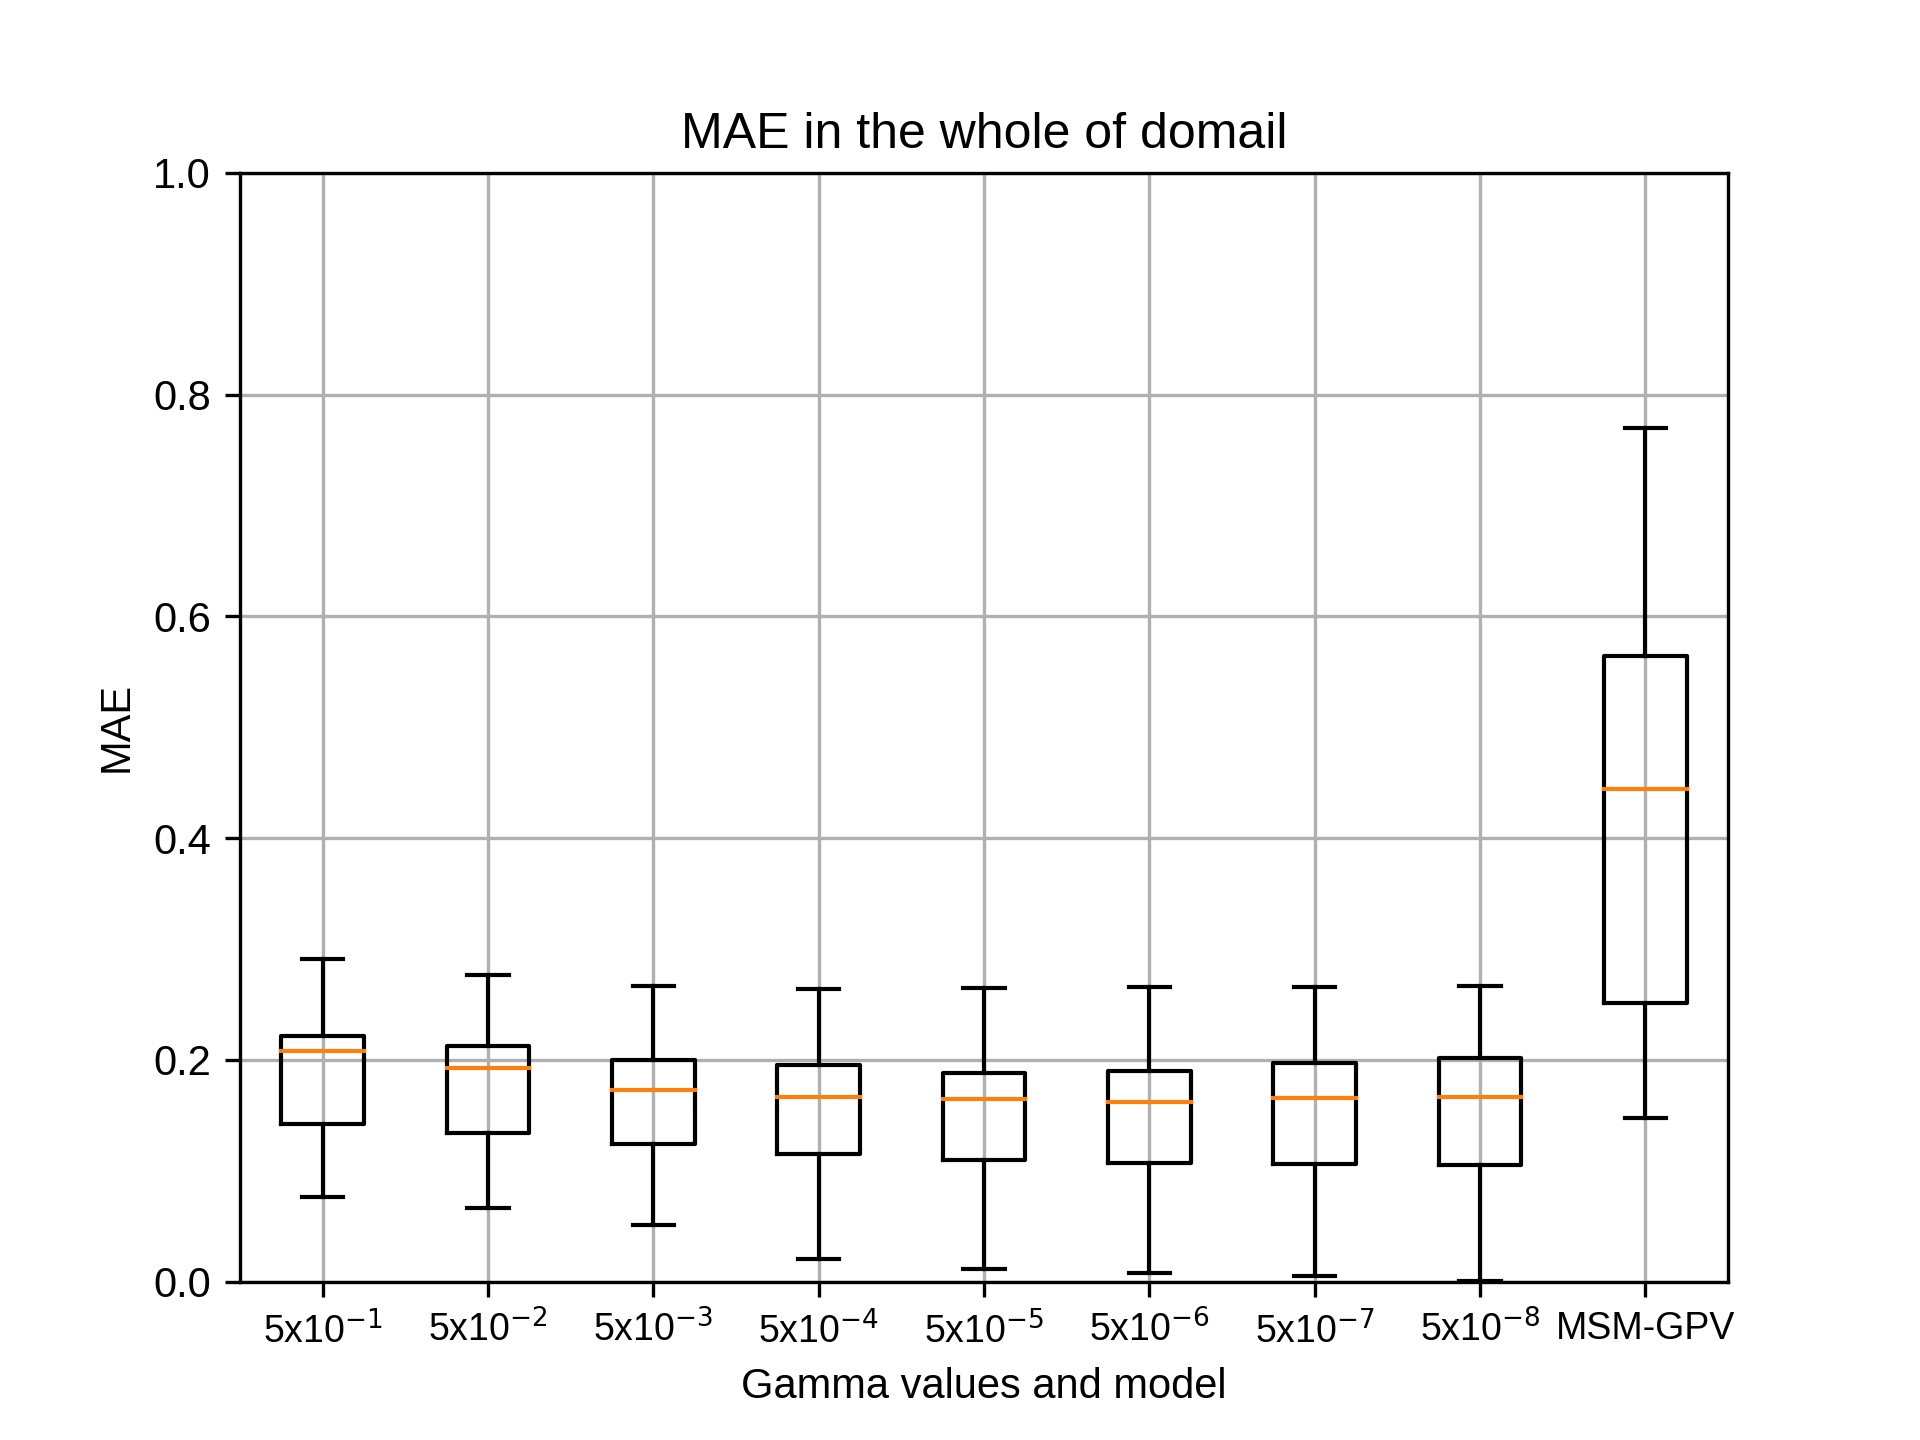
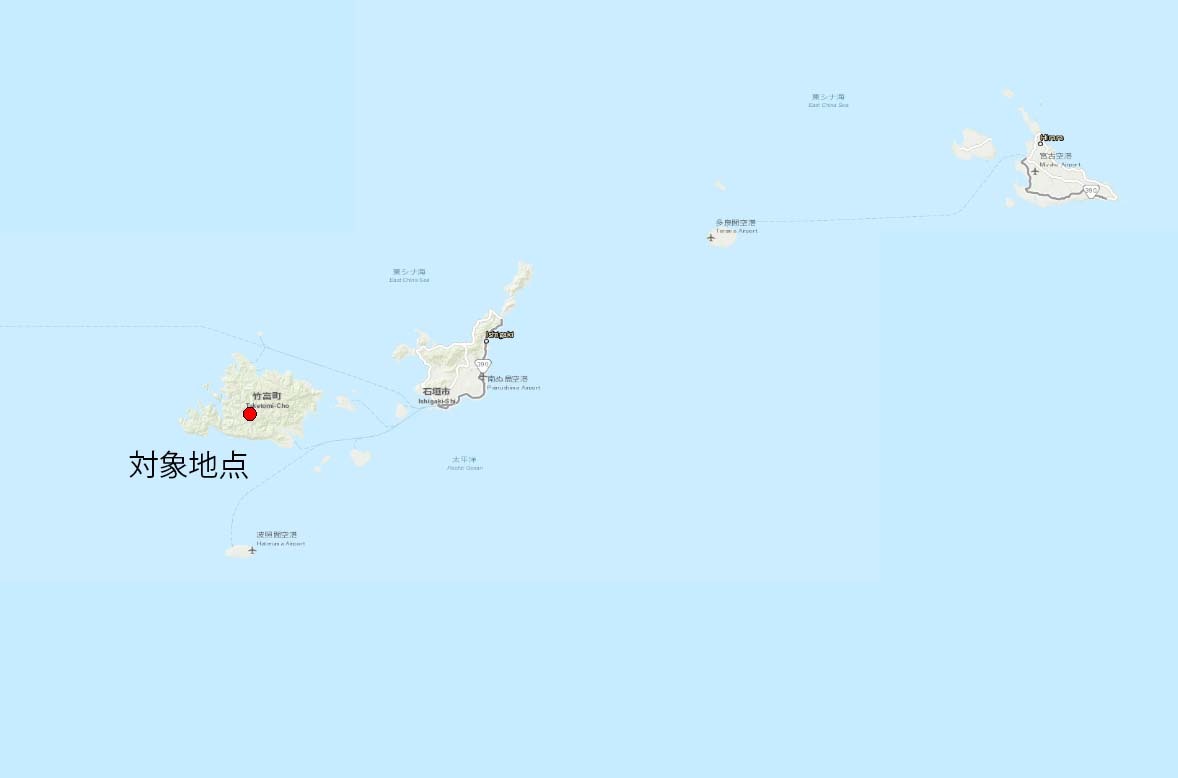
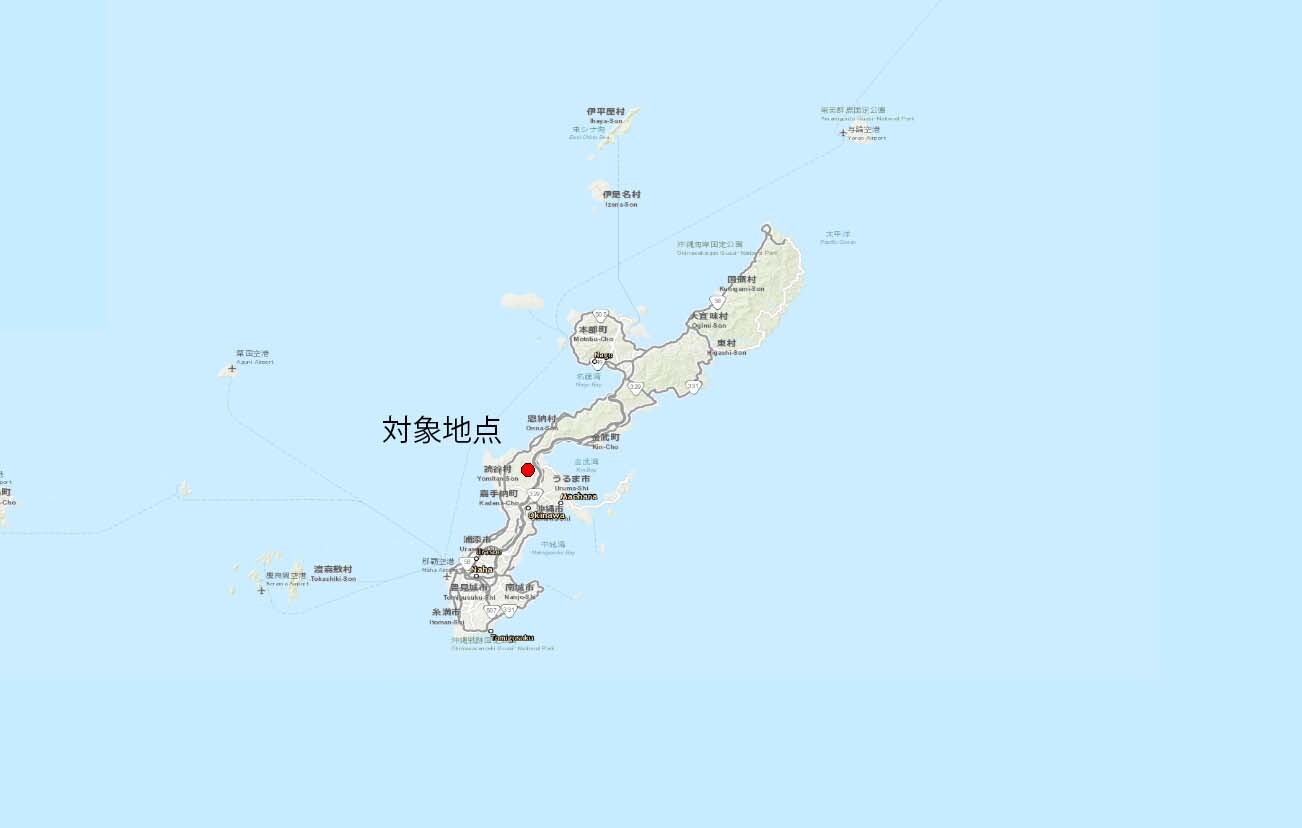
続いてsiteEにつきましてご報告いたします。
最適となりましたcost=2,epsilon=0.0001で緯度経度(123.8,24.32)の地図で示した位置1か所で行いました。
結果は図のとおりです。
最適となりましたcost=2,epsilon=0.0001で緯度経度(123.8,24.32)の地図で示した位置1か所で行いました。
結果は図のとおりです。
kobayashi_yusukeWednesday, October 7th, 2020 at 8:08:17 PM GMT+09:00
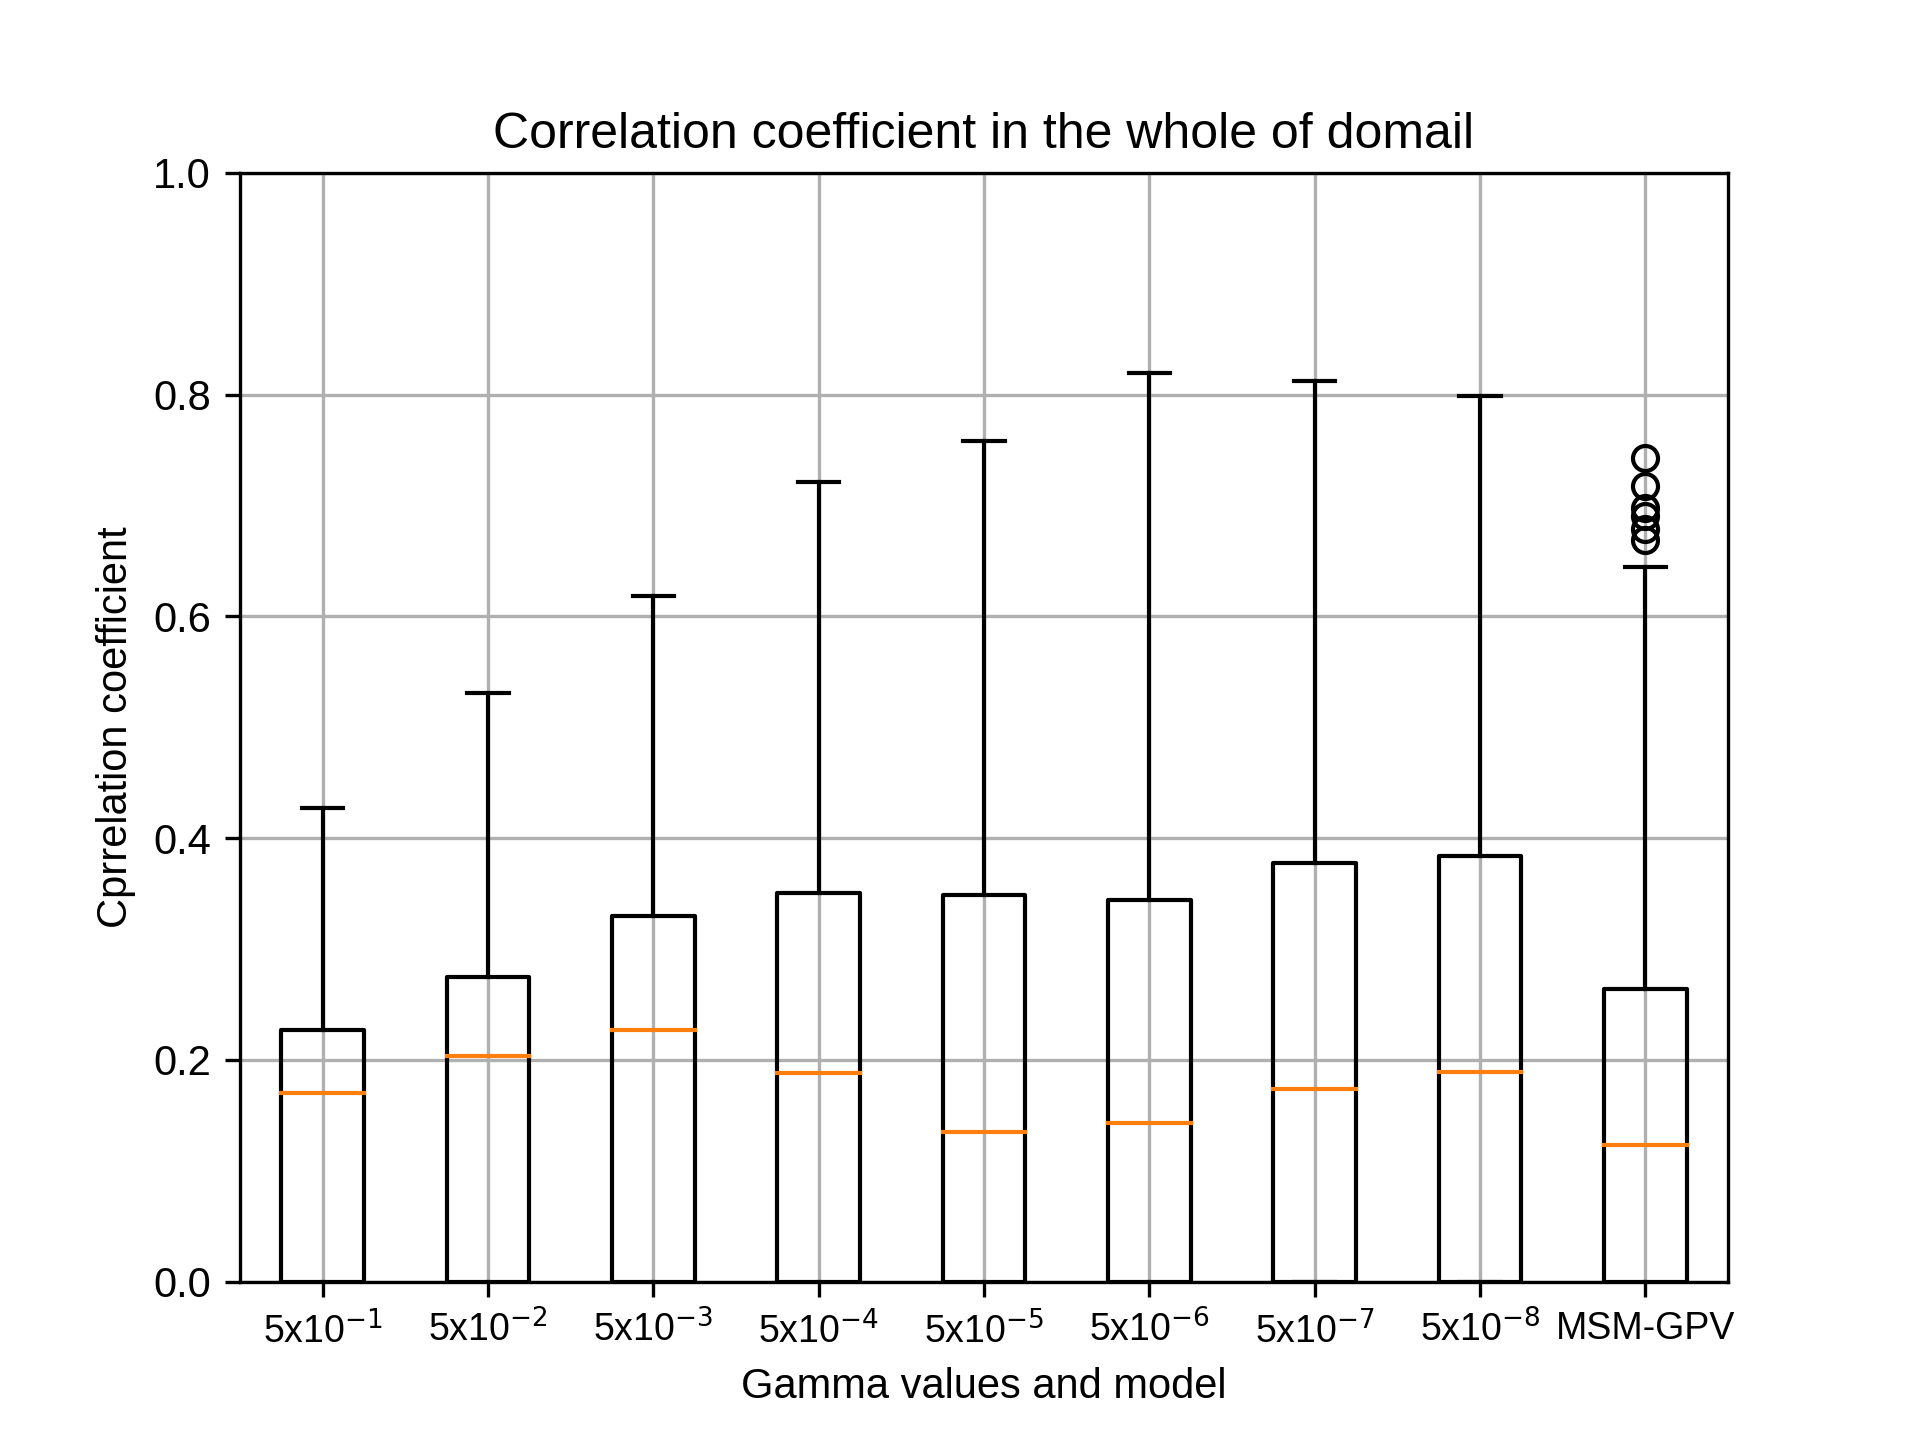
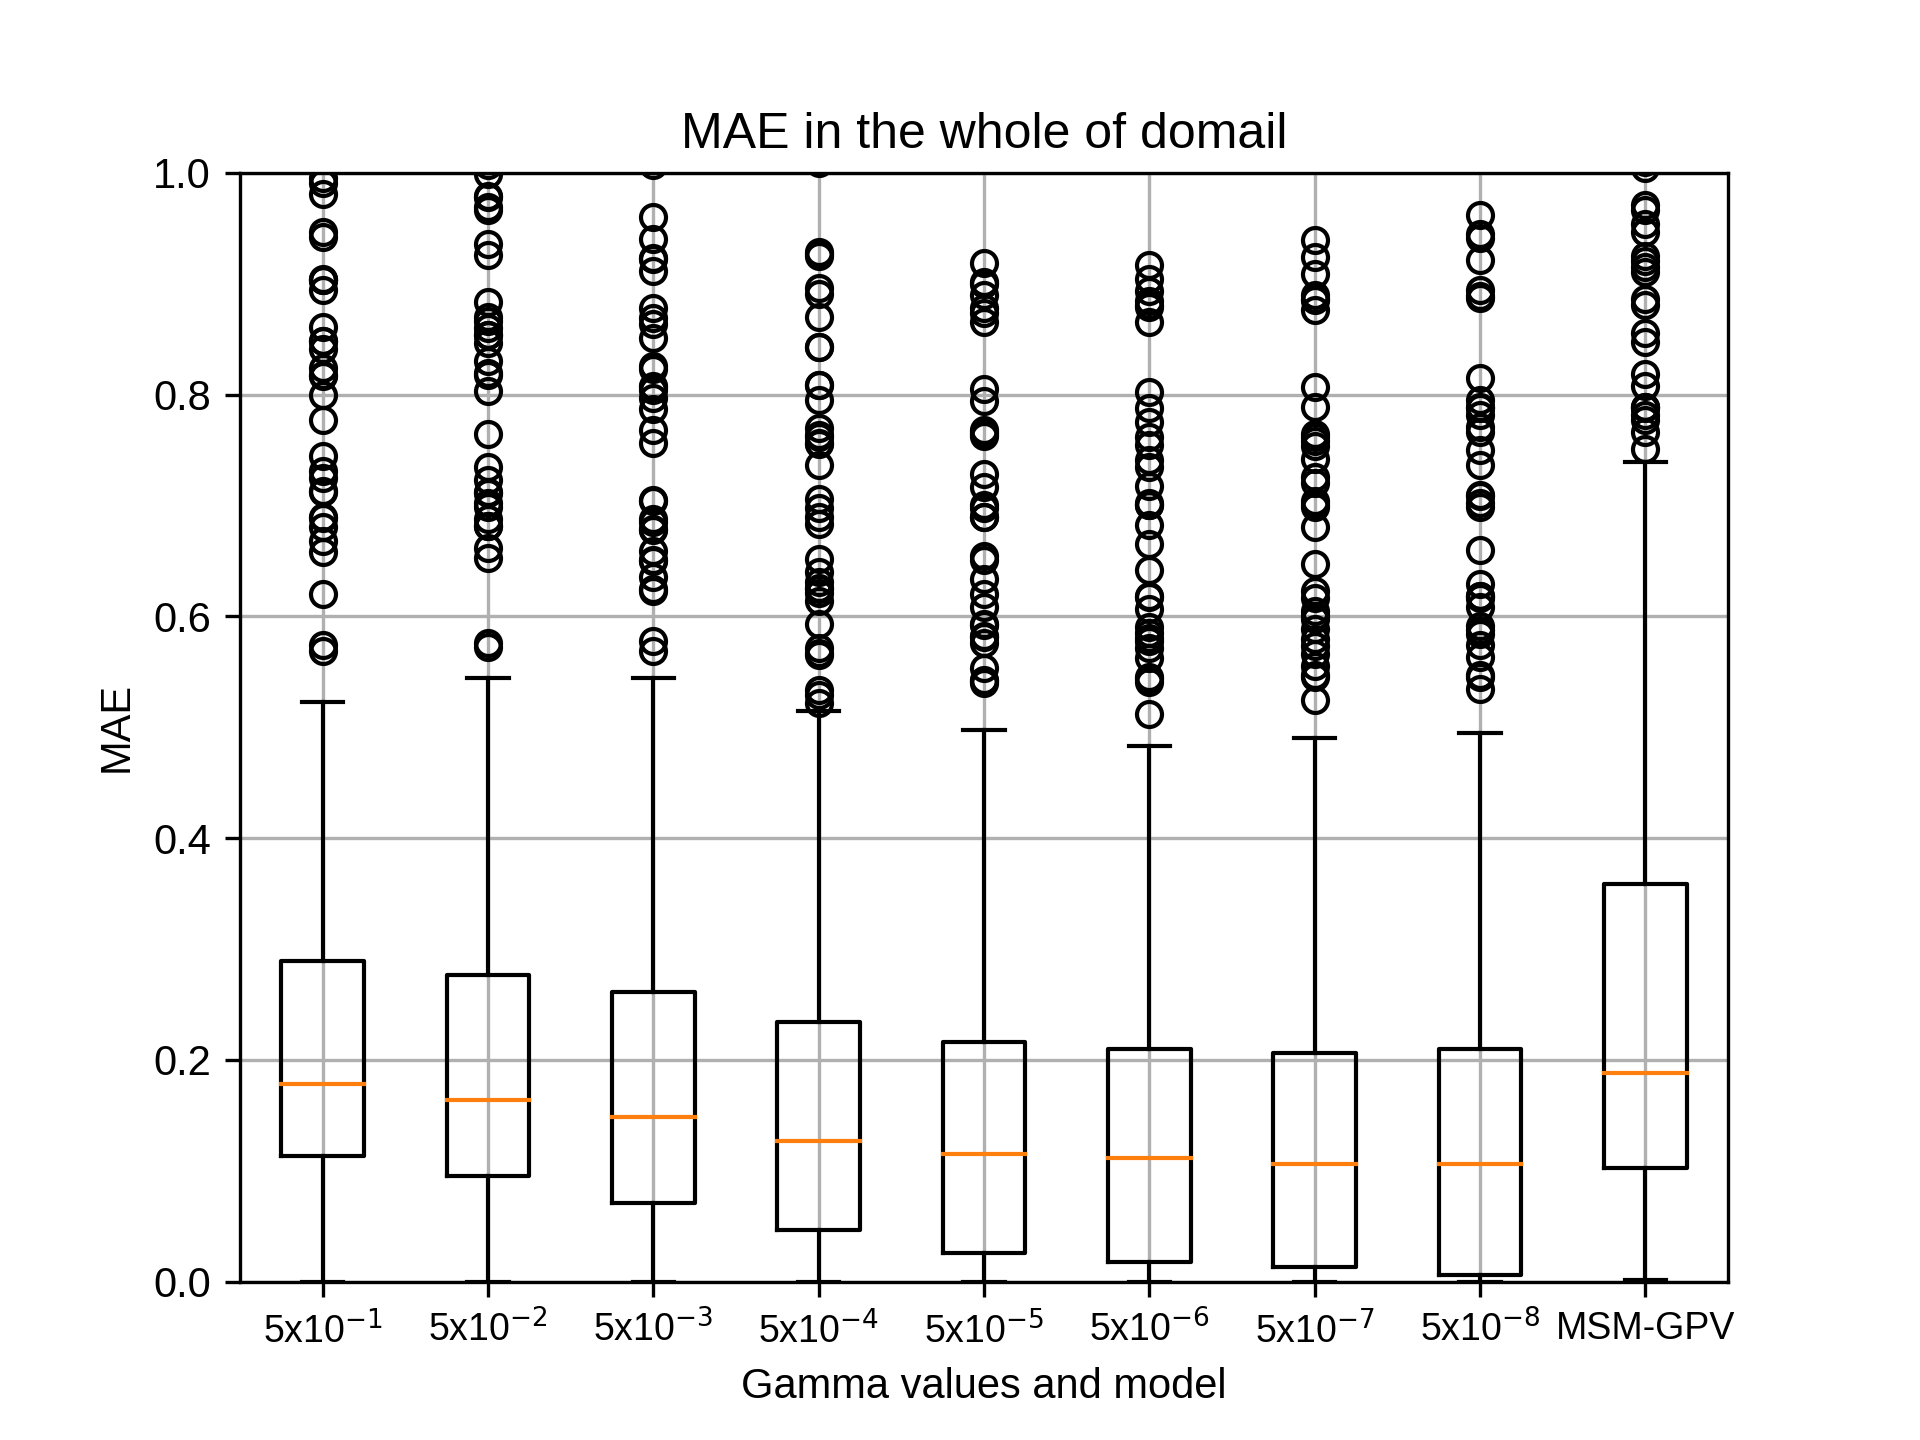

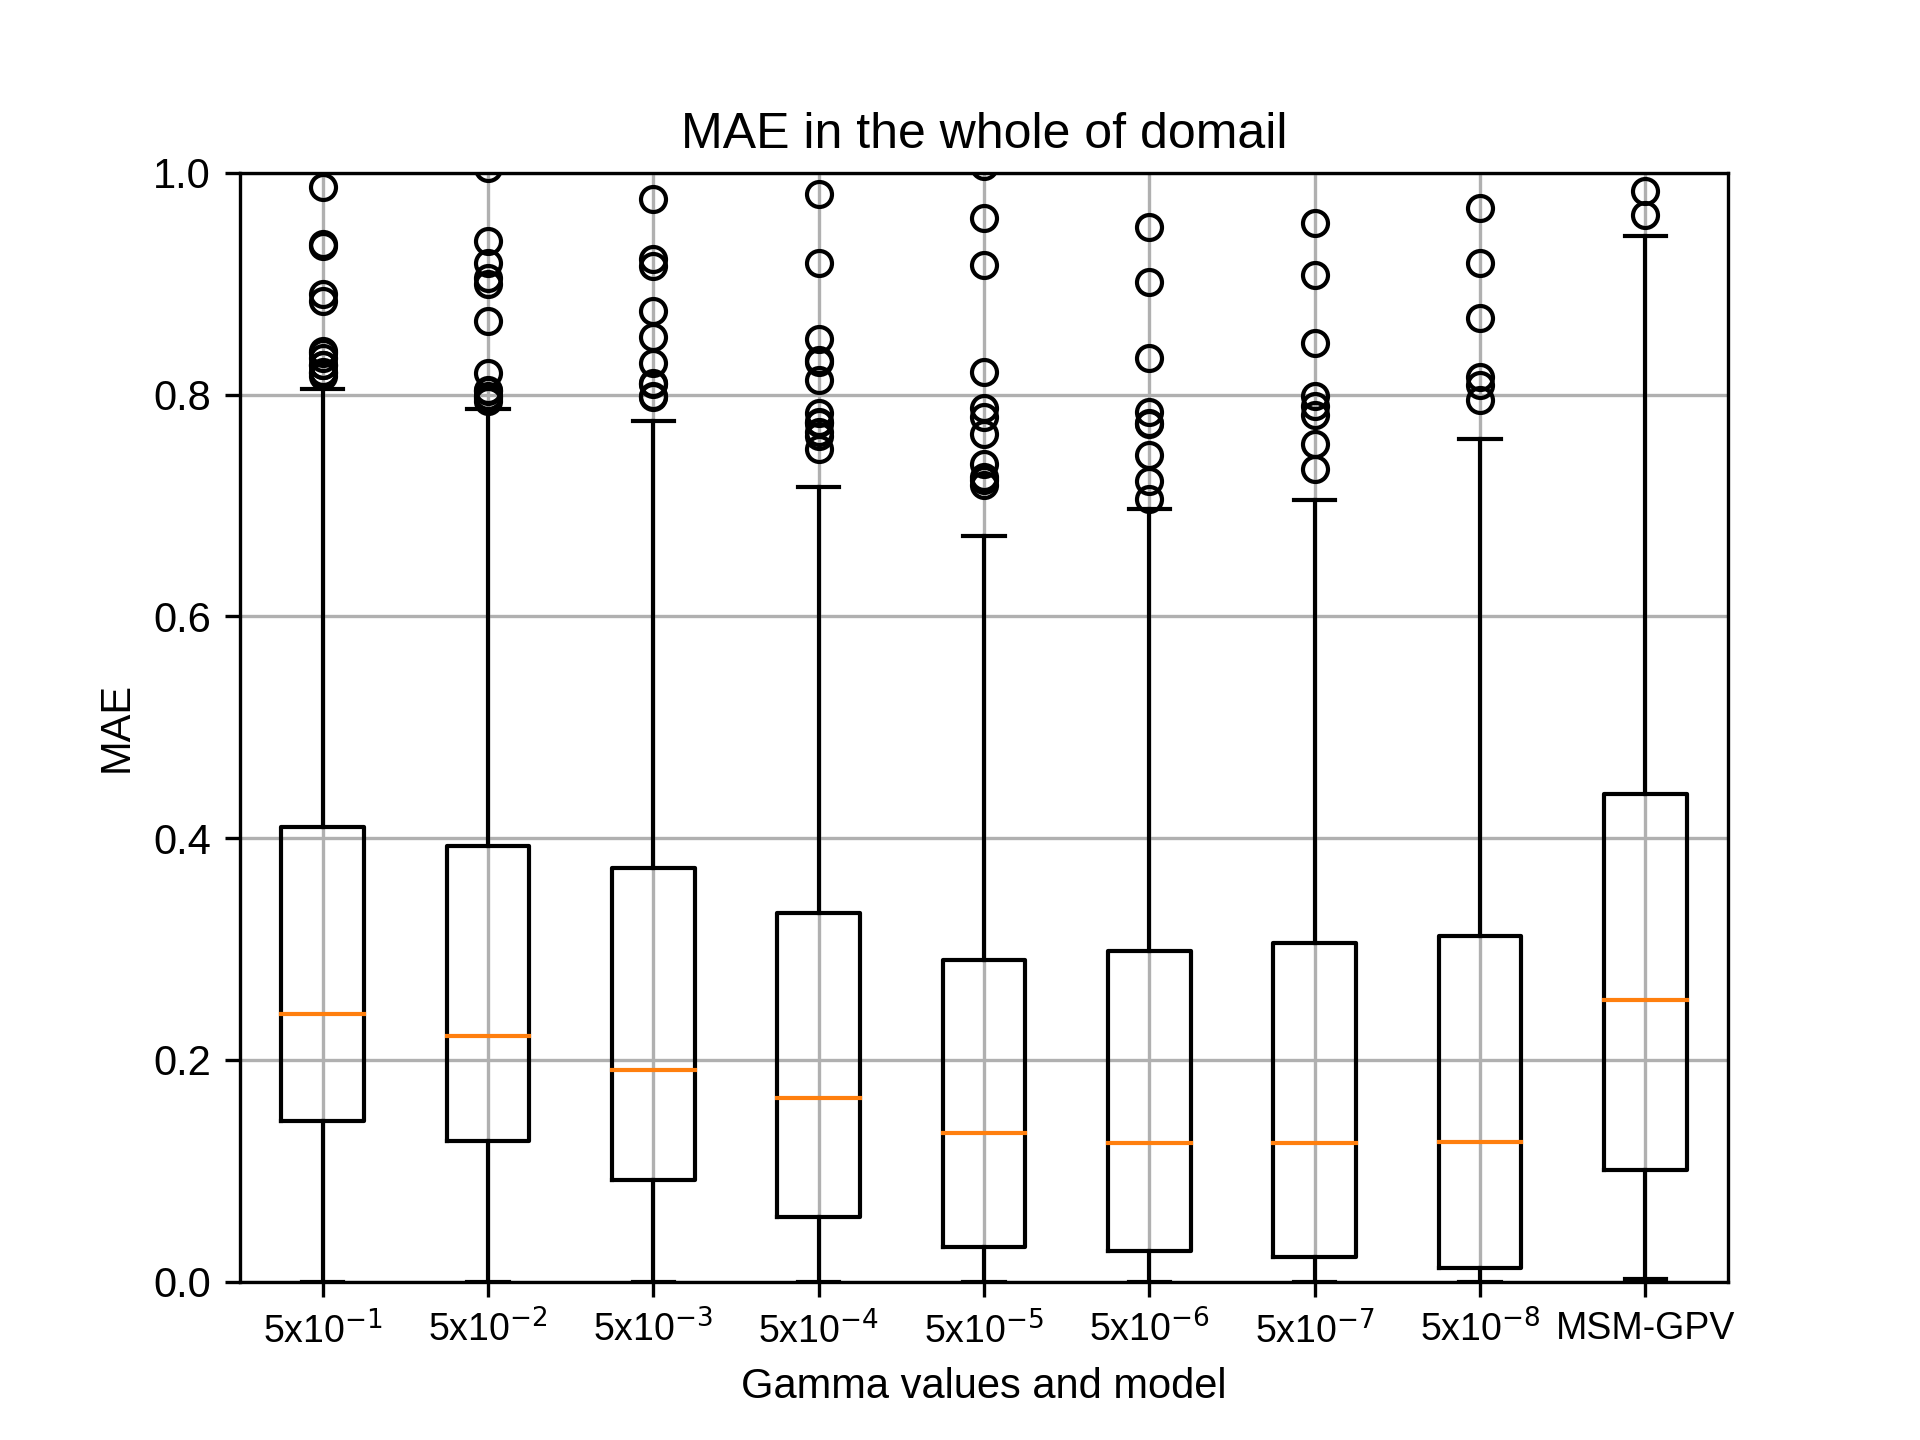
参考として、siteE全体
x:20 30 40 50 60 70
y:20 30 40 50 60 70
での結果は図のとおりです(再掲)。パラメータは上と同じです。
これにて前回の打合せで依頼を受けましたハイパーパラメータ設定に関しての作業は完了いたしました。
以上、よろしくお願いいたします。
x:20 30 40 50 60 70
y:20 30 40 50 60 70
での結果は図のとおりです(再掲)。パラメータは上と同じです。
これにて前回の打合せで依頼を受けましたハイパーパラメータ設定に関しての作業は完了いたしました。
以上、よろしくお願いいたします。
takao-yWednesday, October 7th, 2020 at 8:12:32 PM GMT+09:00
小林様。ありがとうございます。何となく陸上ではよくなっているようですが、もし可能であれば、多少海上が入っても良いので間隔を開けないで複数地点で実施してもらうことはできますでしょうか。
takao-yThursday, October 8th, 2020 at 10:01:33 AM GMT+09:00
小林様。少し説明不足だったかもしれません。例えば、沖縄本島が収まる(長方形の)領域を設定し、10グリッド毎ではなく, 1グリッド毎で評価することにより、島嶼全体としての特性が見えてくるのではないかと考えています。
yamamoto.kosukeTuesday, October 13th, 2020 at 10:54:43 AM GMT+09:00
@takao-y 様、@kobayashi_yusuke様
きちんと追いついておらず、確認が遅れまして申し訳ありません。再計算や確認等で小林さんの負担が少し重くなってしまっているようで恐縮です。RESTECさんにお願いしている作業量の問題もあり、具体的な今後の作業方針は明後日の会議で相談させていただければと思いますが、取りそぎ以下の点について確認させてください。
・現状、すべてのサイトで1,4,7,10月のガンマ、コスト、イプシロンの最適値が求まっていると思います。ただ、前回の打ち合わせでは、「5領域毎、月毎で最も精度の高いもの見つける」と認識合わせをしたつもりですので、全期間推定の前にまずは1~12月の各月でパラメータの最適値を決定する必要があると考えていますが、如何でしょうか。
・今年度中には最適パラメータで全期間推定を終わらせて、CDF補正までかけた状態での精度評価を行い、TE-Japanへの入力試験までできればよいと考えています(この結果をもとに定常運用システム構築に着手できればベストです)。なので、前年からRESTECさんにお願いしている作業量を減らしていることを考えると、現在吉兼先生からお願いされているsite D,Eでの再実験は、重要度がそれほど高くなければスキップしてもよいかと考えているのですが、如何でしょうか(もしどうしても必要であれば、先生にJAXA計算機で直接作業いただくか、私が作業するかで対応したいと思っています)。
kobayashi_yusukeTuesday, October 13th, 2020 at 11:48:37 AM GMT+09:00
@yamamoto.kosuke
山本様
いつも大変お世話になっております。
今回は弊財団が環境構築を行い、解析は東京大学様がJAXA環境に入って行う、という認識でおりました。
その中で前回の打合せで、パラメータの最適値を弊財団で行うことになり、5領域ごとにガンマ、コスト、エプシロン、そしてガンマの再計算を行うことになりました。5領域ごとに行うことは認識しておりましたが、月につきましては認識しておりませんでしたので、各月ごとに行うのではなく7月を行い、追加で1,4,10月を行ったという認識でおりました。もともと環境構築が弊財団の担当と認識しておりましたので、パラメータの最適値作業は(契約内で)追加作業で行っているという認識でおります。そのため、新たなお願いに対してはJAXA様と協議した次第です。
今年度の目標に向けて、JAXA様との契約の範囲内で進めさせていただけると幸いです。
以上、よろしくお願いいたします。
yamamoto.kosukeTuesday, October 13th, 2020 at 1:35:46 PM GMT+09:00
@kobayashi_yusuke様
「弊財団が環境構築を行い、解析は東京大学様がJAXA環境に入って行う」についてはご認識のとおりです。パラメータ最適値決定は、環境構築の一環として、吉兼先生のツールを使用して簡単に決定できればと考えていましたが、作業量の読みが甘く失礼しました(各月での推定実施は、共有させていただいている前回打合せのメモに記載させてただいていたのですが、ここはそもそも私の方に誤認があったのかもしれません)。
今後の方針としては、11月より東大側にPDが新たに加わられるので、その方にこういった作業の続きをお願いしていくことになるかと思います。ひとまず明後日は現状までの成果をご報告いただければと思います。よろしくお願いいたします。
kobayashi_yusukeTuesday, October 13th, 2020 at 4:07:05 PM GMT+09:00
@yamamoto.kosuke
山本様
いつも大変お世話になっております。
お返事ありがとうございます。
ご確認させていただきありがとうございました。環境構築の一環として、今回は5領域のパラメータ作業を行わせていただいております。1~12月の各月行うとなりますと、環境構築の範囲を超えますので、そこまでは引き受けていないという認識でおります。
明後日の打合せでは、5領域につきまして、7月に加え1月、4月、10月のパラメータの結果報告をさせていただきます。
ご連絡ありがとうございました。
以上、よろしくお願いいたします。
山本様
いつも大変お世話になっております。
お返事ありがとうございます。
ご確認させていただきありがとうございました。環境構築の一環として、今回は5領域のパラメータ作業を行わせていただいております。1~12月の各月行うとなりますと、環境構築の範囲を超えますので、そこまでは引き受けていないという認識でおります。
明後日の打合せでは、5領域につきまして、7月に加え1月、4月、10月のパラメータの結果報告をさせていただきます。
ご連絡ありがとうございました。
以上、よろしくお願いいたします。
takao-yThursday, October 15th, 2020 at 9:07:22 AM GMT+09:00
山本様、小林様
吉兼です。ご連絡ありがとうございます。連絡が遅くなり申し訳ありません。小林さんの負担が大きくなっているとのこと承知いたしました。この件については、本日の会議でご相談させていただければと思います。
小林さんのおっしゃっている契約というのは、恐らく私が関与できないものだと思いますので正直なところよく理解できていないのですが、可能な範囲で契約内容について教えていただければありがたいです。
前回の打ち合わせでは、特に1,4,7,10月とは決めておらず、私の方で勝手にお願いしてしまったのですが、これもよくなかったでしょうか。とりあえず季節を代表する月からどの程度違いがあるのかを確認したかったので、1,4,7,10月を先に実施していただきました。
前回の打ち合わせでは、今年度の予定として、以下を決定しています。
1.[RESTEC] 2007年から2018年の11年間(テスト年を含む)でRadar-AMeDAS解析雨量を学習する(1時間毎、5km)
•識別器は保存する
•将来的には学習・予測を1kmで行うため、1kmでどれくらいの計算コストになるか試算しておく
2.[東大] SVMの推定値に対してCDF手法を適用、精度評価
3.MSMGPV39時間予報値を用いた推定(5㎞)を実施、定常運用システムを構築(MEPS利用も検討)
今までの経験から、実行可能と判断して提案させていただいたのですが、もし負担が大きすぎるなどありましたらご意見いただければ幸いです。11月1日からYinさんが参加されますので、連携して行っていただければと作業効率もよくなり、小林さんの負担も軽減するのではないかと考えています。

gyinThursday, October 15th, 2020 at 9:54:13 AM GMT+09:00
@gyinさんがチャンネルに参加しました
kobayashi_yusukeThursday, October 15th, 2020 at 12:06:25 PM GMT+09:00
@takao-y
吉兼先生
本日は打合せをさせていただきありがとうございました。そして早速ですが特徴量ベクトルにつきまして相談させていただきたく思います。
吉兼先生から受領したプログラムのうち、auto-check.shに以下の記述がございます。
-----
## Range of feature vectors (2xRG+1)x (2xRG+1) : e.g. RG=15: 31x31 grids =961 grids (almost 180km x180km) resolution: 0.6 deg
#nums='961'
#rg2='15'
nums='441'
rg2='10'
-----
いただいたファイルではrg2='10'となっており、(10+1)x(10+1)で現在は行っているものと考えております。
こちらのrg2を変えることでよろしいのでしょうか。
また、その変える値につきましてご教授いただけると幸いです。
siteA~siteEの5領域に対し、1,4,7,10月でcost,epsilonは決まった値で固定し、gammaでグラフを作成することを考えております。
教えていただけると幸いです。
以上、よろしくお願いいたします。
takao-yThursday, October 15th, 2020 at 12:09:34 PM GMT+09:00
小林様
吉兼です。auto-check.shのnumsとrg2を変更して特徴ベクトルの範囲を変更します。numsとrg2の関係は(rg2x2+1)(rg2x2+1)=numsです。
今はnums=441, rg2=10となっていますが、これを
1. rg2=4, nums=81
2. rg2=6, nums=161
3. rg2=8,nums=289
4. rg2=12,nums=625
で実施していただけますでしょうか。
よろしくお願いいたします。
吉兼です。auto-check.shのnumsとrg2を変更して特徴ベクトルの範囲を変更します。numsとrg2の関係は(rg2x2+1)(rg2x2+1)=numsです。
今はnums=441, rg2=10となっていますが、これを
1. rg2=4, nums=81
2. rg2=6, nums=161
3. rg2=8,nums=289
4. rg2=12,nums=625
で実施していただけますでしょうか。
よろしくお願いいたします。
kobayashi_yusukeThursday, October 15th, 2020 at 12:15:22 PM GMT+09:00
吉兼先生
リモート・センシング技術センターの小林です。いつもお世話になっております。
さっそくのお返事ありがとうございます。
以下の4通りで順次行ってまいります。
1. rg2=4, nums=81
2. rg2=6, nums=161
3. rg2=8,nums=289
4. rg2=12,nums=625
以上、よろしくお願いいたします。
リモート・センシング技術センターの小林です。いつもお世話になっております。
さっそくのお返事ありがとうございます。
以下の4通りで順次行ってまいります。
1. rg2=4, nums=81
2. rg2=6, nums=161
3. rg2=8,nums=289
4. rg2=12,nums=625
以上、よろしくお願いいたします。
takao-yFriday, October 16th, 2020 at 7:32:29 AM GMT+09:00
小林様
計算間違えていました。2.ng2=6,nums=169ですね。
計算間違えていました。2.ng2=6,nums=169ですね。
kobayashi_yusukeFriday, October 16th, 2020 at 1:15:28 PM GMT+09:00
@takao-y
吉兼先生
ご連絡ありがとうございます。2.はng2=6,nums=169で承知しました。結果が出ましたらご連絡いたします。
吉兼先生
ご連絡ありがとうございます。2.はng2=6,nums=169で承知しました。結果が出ましたらご連絡いたします。
yamamoto.kosukeWednesday, October 21st, 2020 at 8:18:23 PM GMT+09:00
@takao-y さま
お世話になります。先日の打ち合わせで整理させていただいた今後の作業項目のうち、
「3.全格子・各月毎で識別機作成+CDF補正」
の作業に備えて、JAXAの計算機スペックの情報をお伝えすることになっていた点ですが、以下の通りお知らせします。
計算機名:zico-n, pele-n
・物理CPU数:2
・コア数:24
・スレッド数:2
・論理CPU数:96
・メモリ:131[GB]
・クロック周波数:3000[MHz]
こちら、二台ともほぼ機械学習占有で使えるはずですが、全格子・各月毎での計算に耐えられそうか、情報頂ければ幸いです。よろしくお願いいたします。
お世話になります。先日の打ち合わせで整理させていただいた今後の作業項目のうち、
「3.全格子・各月毎で識別機作成+CDF補正」
の作業に備えて、JAXAの計算機スペックの情報をお伝えすることになっていた点ですが、以下の通りお知らせします。
計算機名:zico-n, pele-n
・物理CPU数:2
・コア数:24
・スレッド数:2
・論理CPU数:96
・メモリ:131[GB]
・クロック周波数:3000[MHz]
こちら、二台ともほぼ機械学習占有で使えるはずですが、全格子・各月毎での計算に耐えられそうか、情報頂ければ幸いです。よろしくお願いいたします。
takao-yThursday, October 22nd, 2020 at 7:29:15 AM GMT+09:00
山本様
ありがとうございます。24コア同時計算できればかなり早くなるかと思いますが、バイナリ化されていないとI/Oでエラーが起こる可能性があります。もし時間がありましたら、とりあえず10コア同時計算を実施してもらえますでしょうか。よろしくお願いいたします。
ありがとうございます。24コア同時計算できればかなり早くなるかと思いますが、バイナリ化されていないとI/Oでエラーが起こる可能性があります。もし時間がありましたら、とりあえず10コア同時計算を実施してもらえますでしょうか。よろしくお願いいたします。
takao-yThursday, October 22nd, 2020 at 7:33:14 AM GMT+09:00
山本様。現状ではマシントラブルが起こる可能性が高いので、バイナリ化したシステムができるまで待っていただけますでしょうか。近日中にお渡しできると思います。
kobayashi_yusukeThursday, October 22nd, 2020 at 4:10:17 PM GMT+09:00

@takao-y
吉兼先生
特徴量ベクトルのうち、1月、4月、7月の結果が出ましたのでお伝えいたします。
cost,epsilonはそれぞれこれまでのハイパーパラメータ決定で相関係数の中央値が最大の者を採用しました。詳細は添付のエクセルをご参照ください。
まず1月の結果は表の右2列となります。特徴量ベクトルは10もしくは12、gammaは当初の結果と同じになりました。ただ、特徴量ベクトルはrg2=8,10,12で大きな差はございませんでした。
吉兼先生
特徴量ベクトルのうち、1月、4月、7月の結果が出ましたのでお伝えいたします。
cost,epsilonはそれぞれこれまでのハイパーパラメータ決定で相関係数の中央値が最大の者を採用しました。詳細は添付のエクセルをご参照ください。
まず1月の結果は表の右2列となります。特徴量ベクトルは10もしくは12、gammaは当初の結果と同じになりました。ただ、特徴量ベクトルはrg2=8,10,12で大きな差はございませんでした。
kobayashi_yusukeThursday, October 22nd, 2020 at 4:10:44 PM GMT+09:00
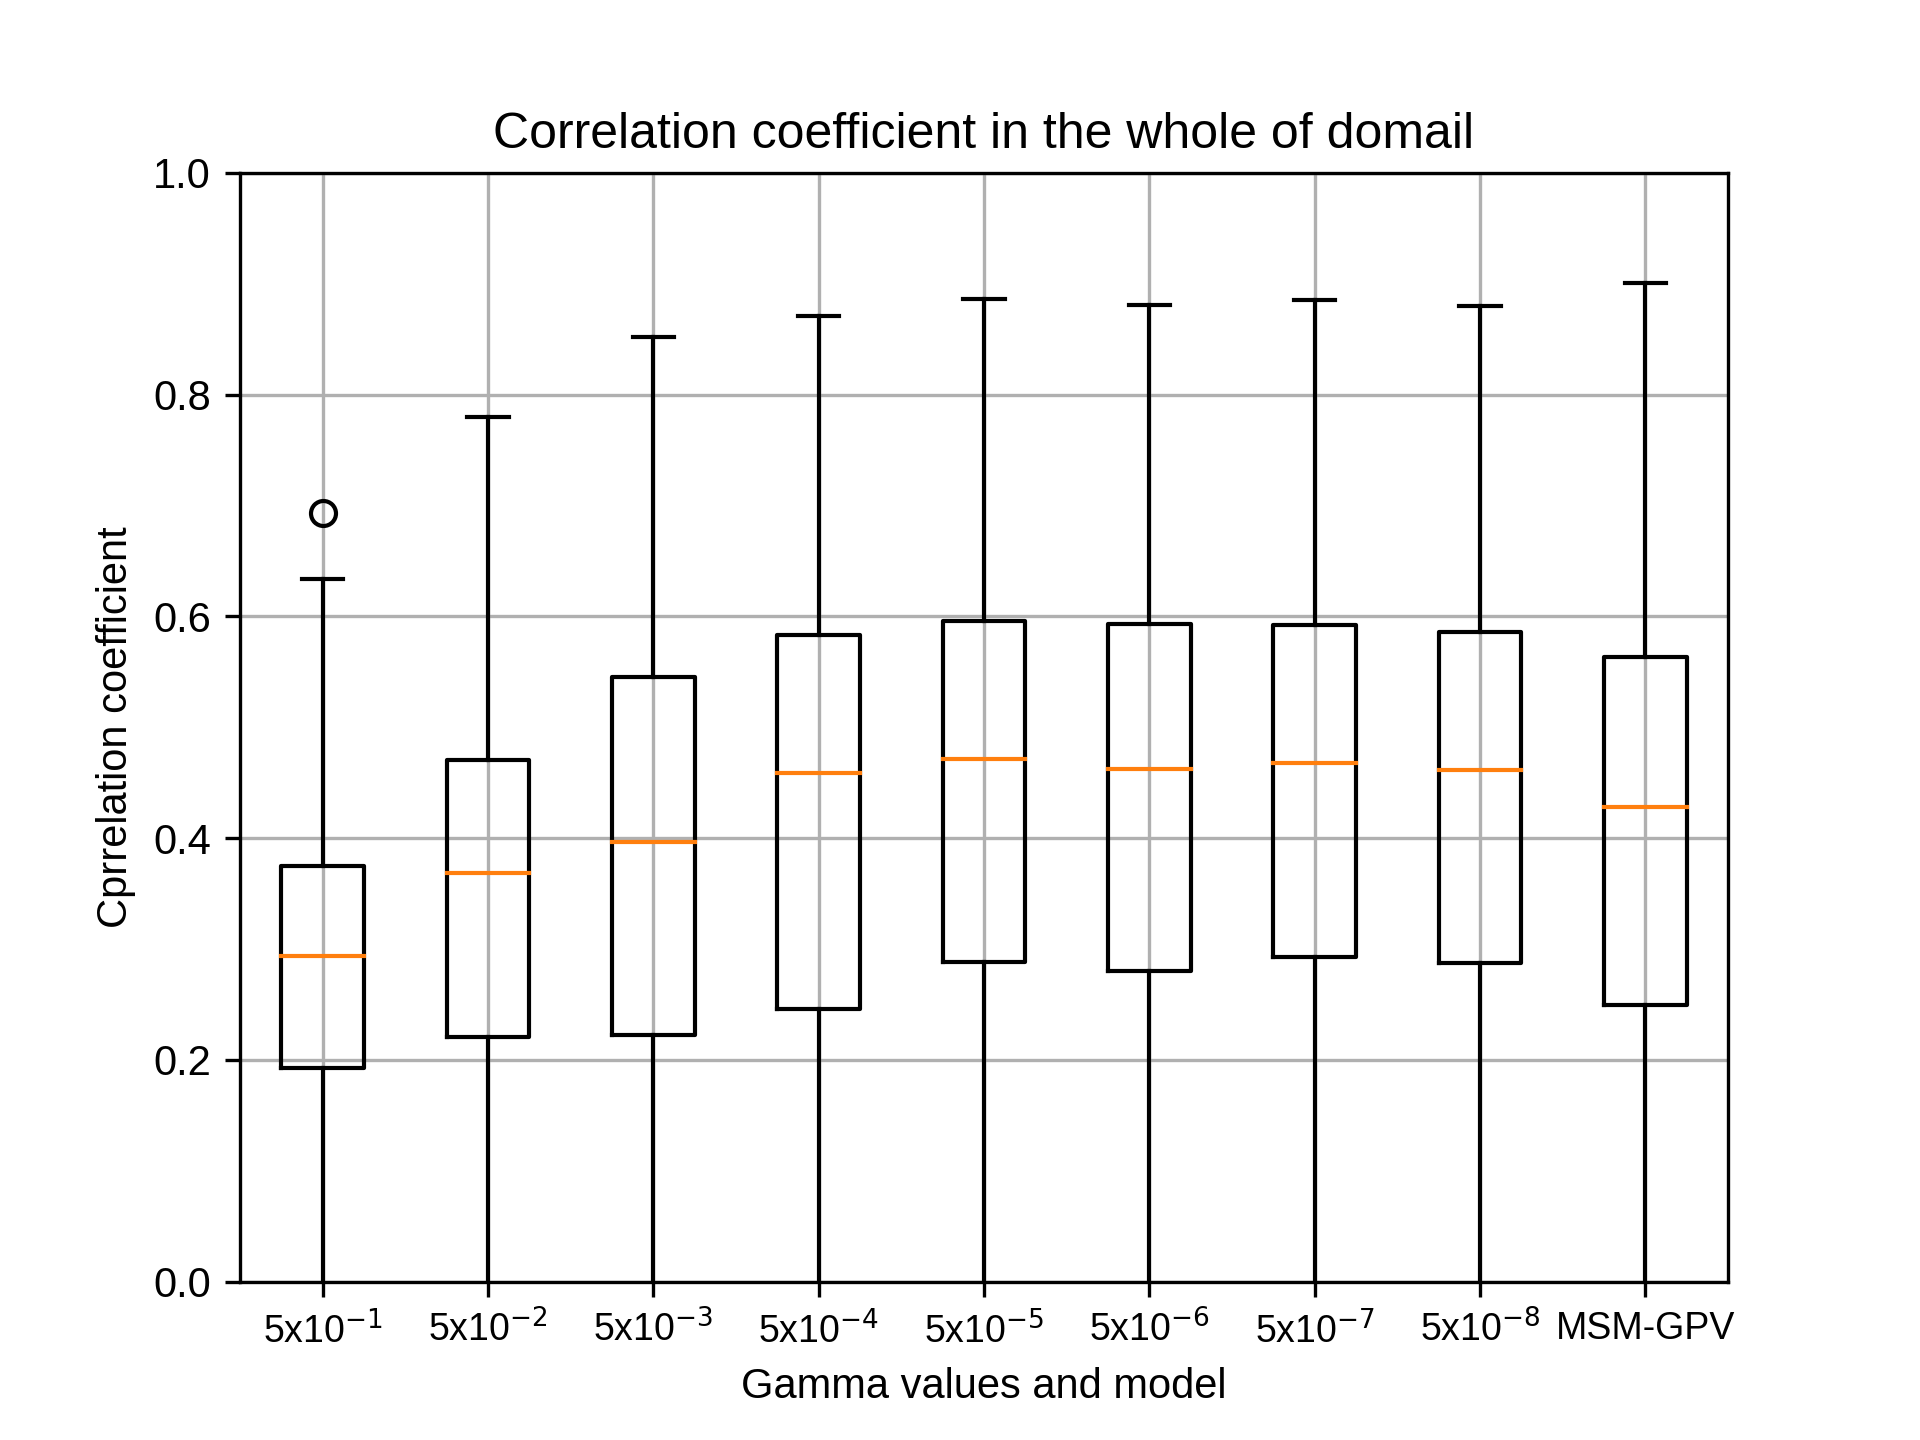
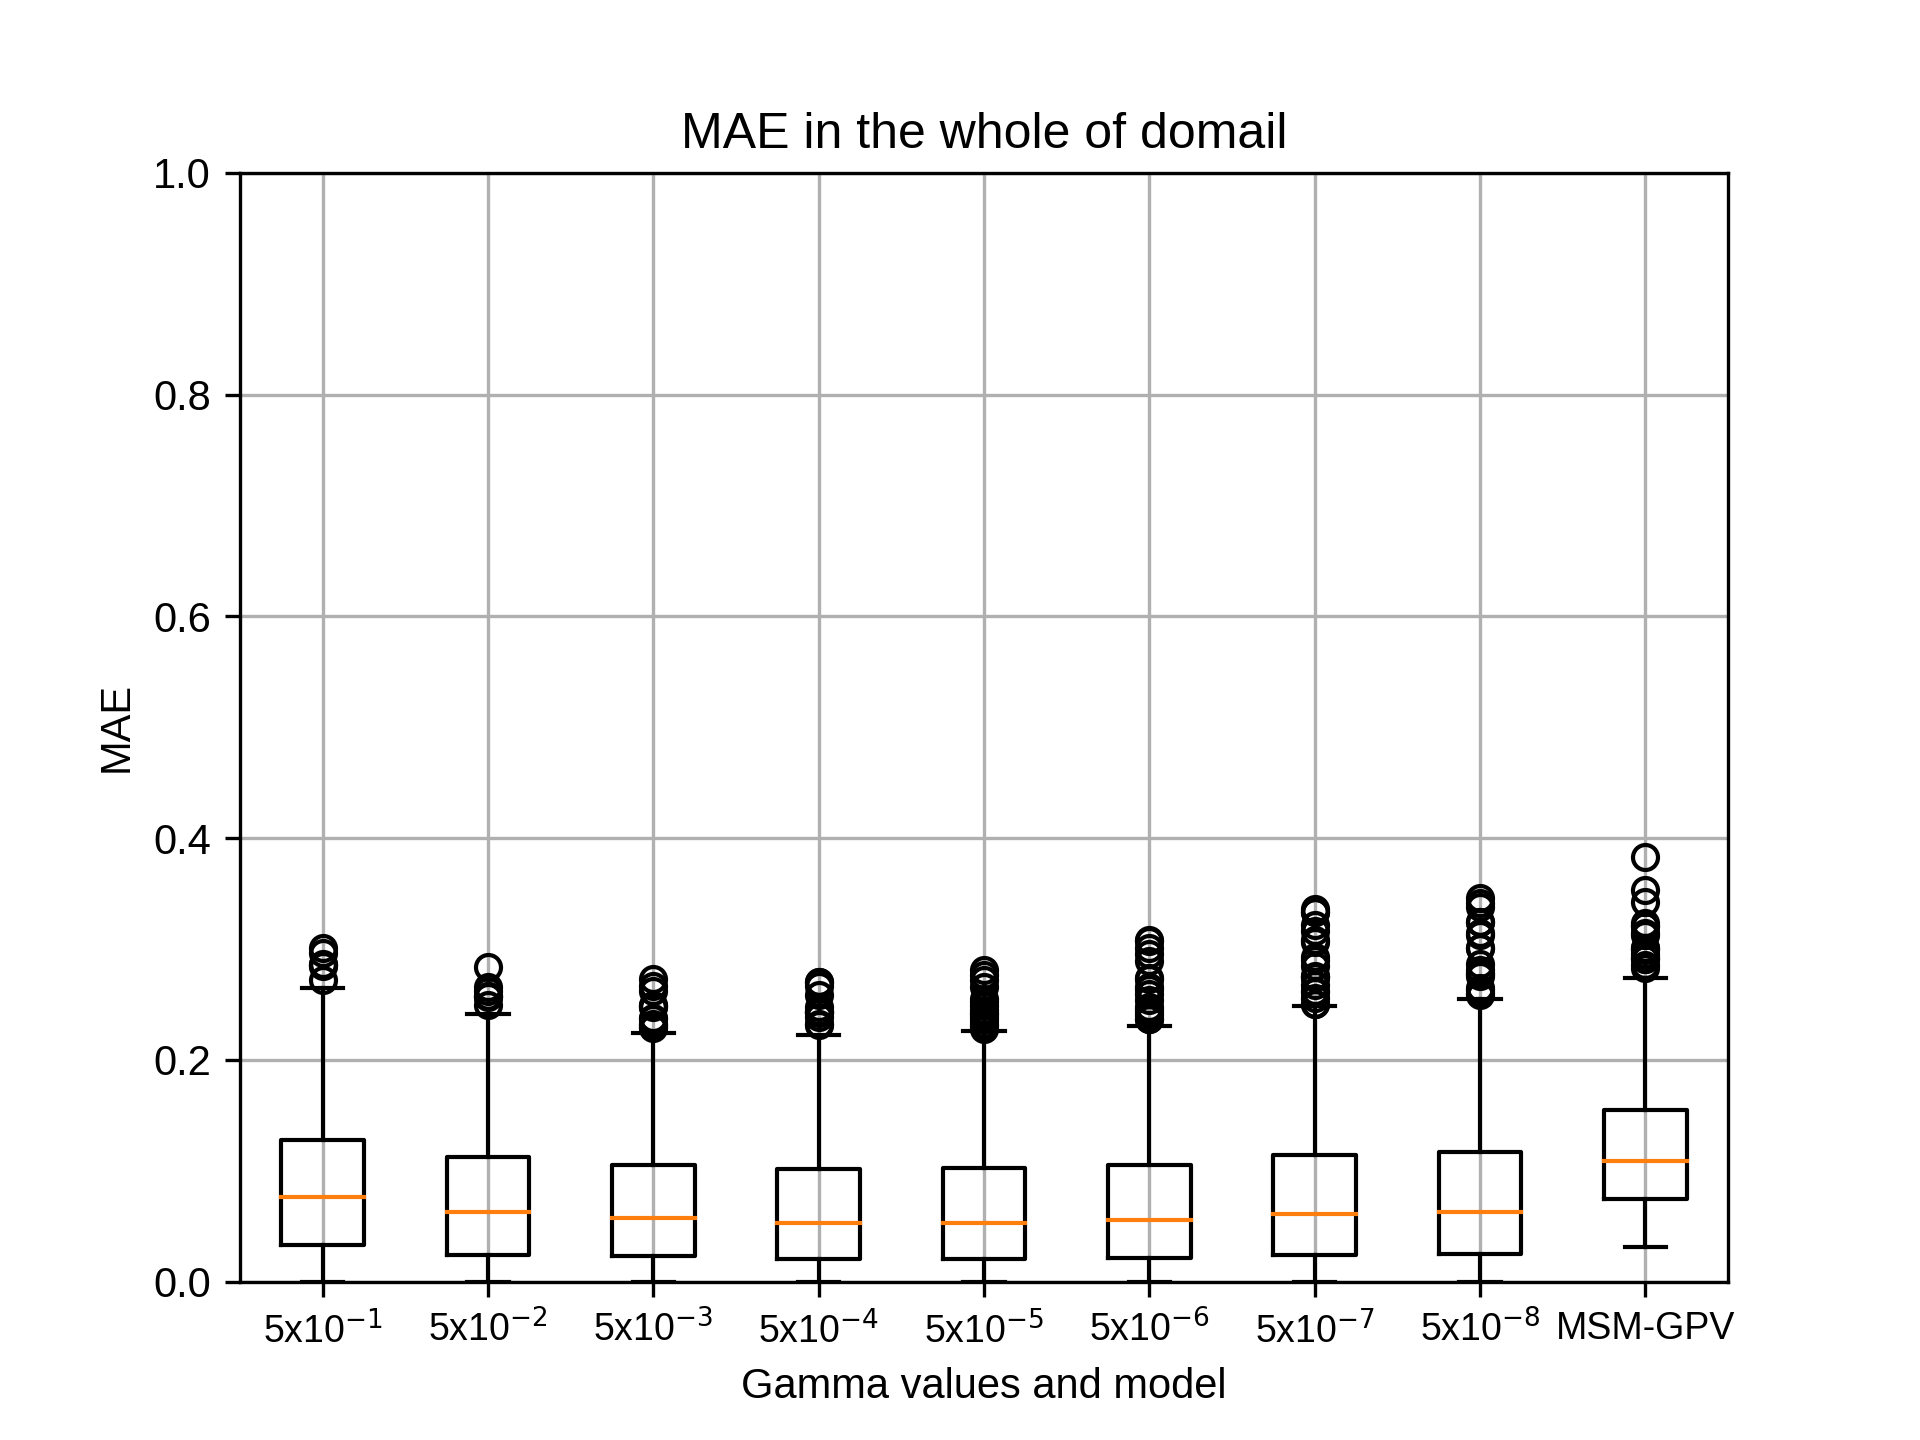
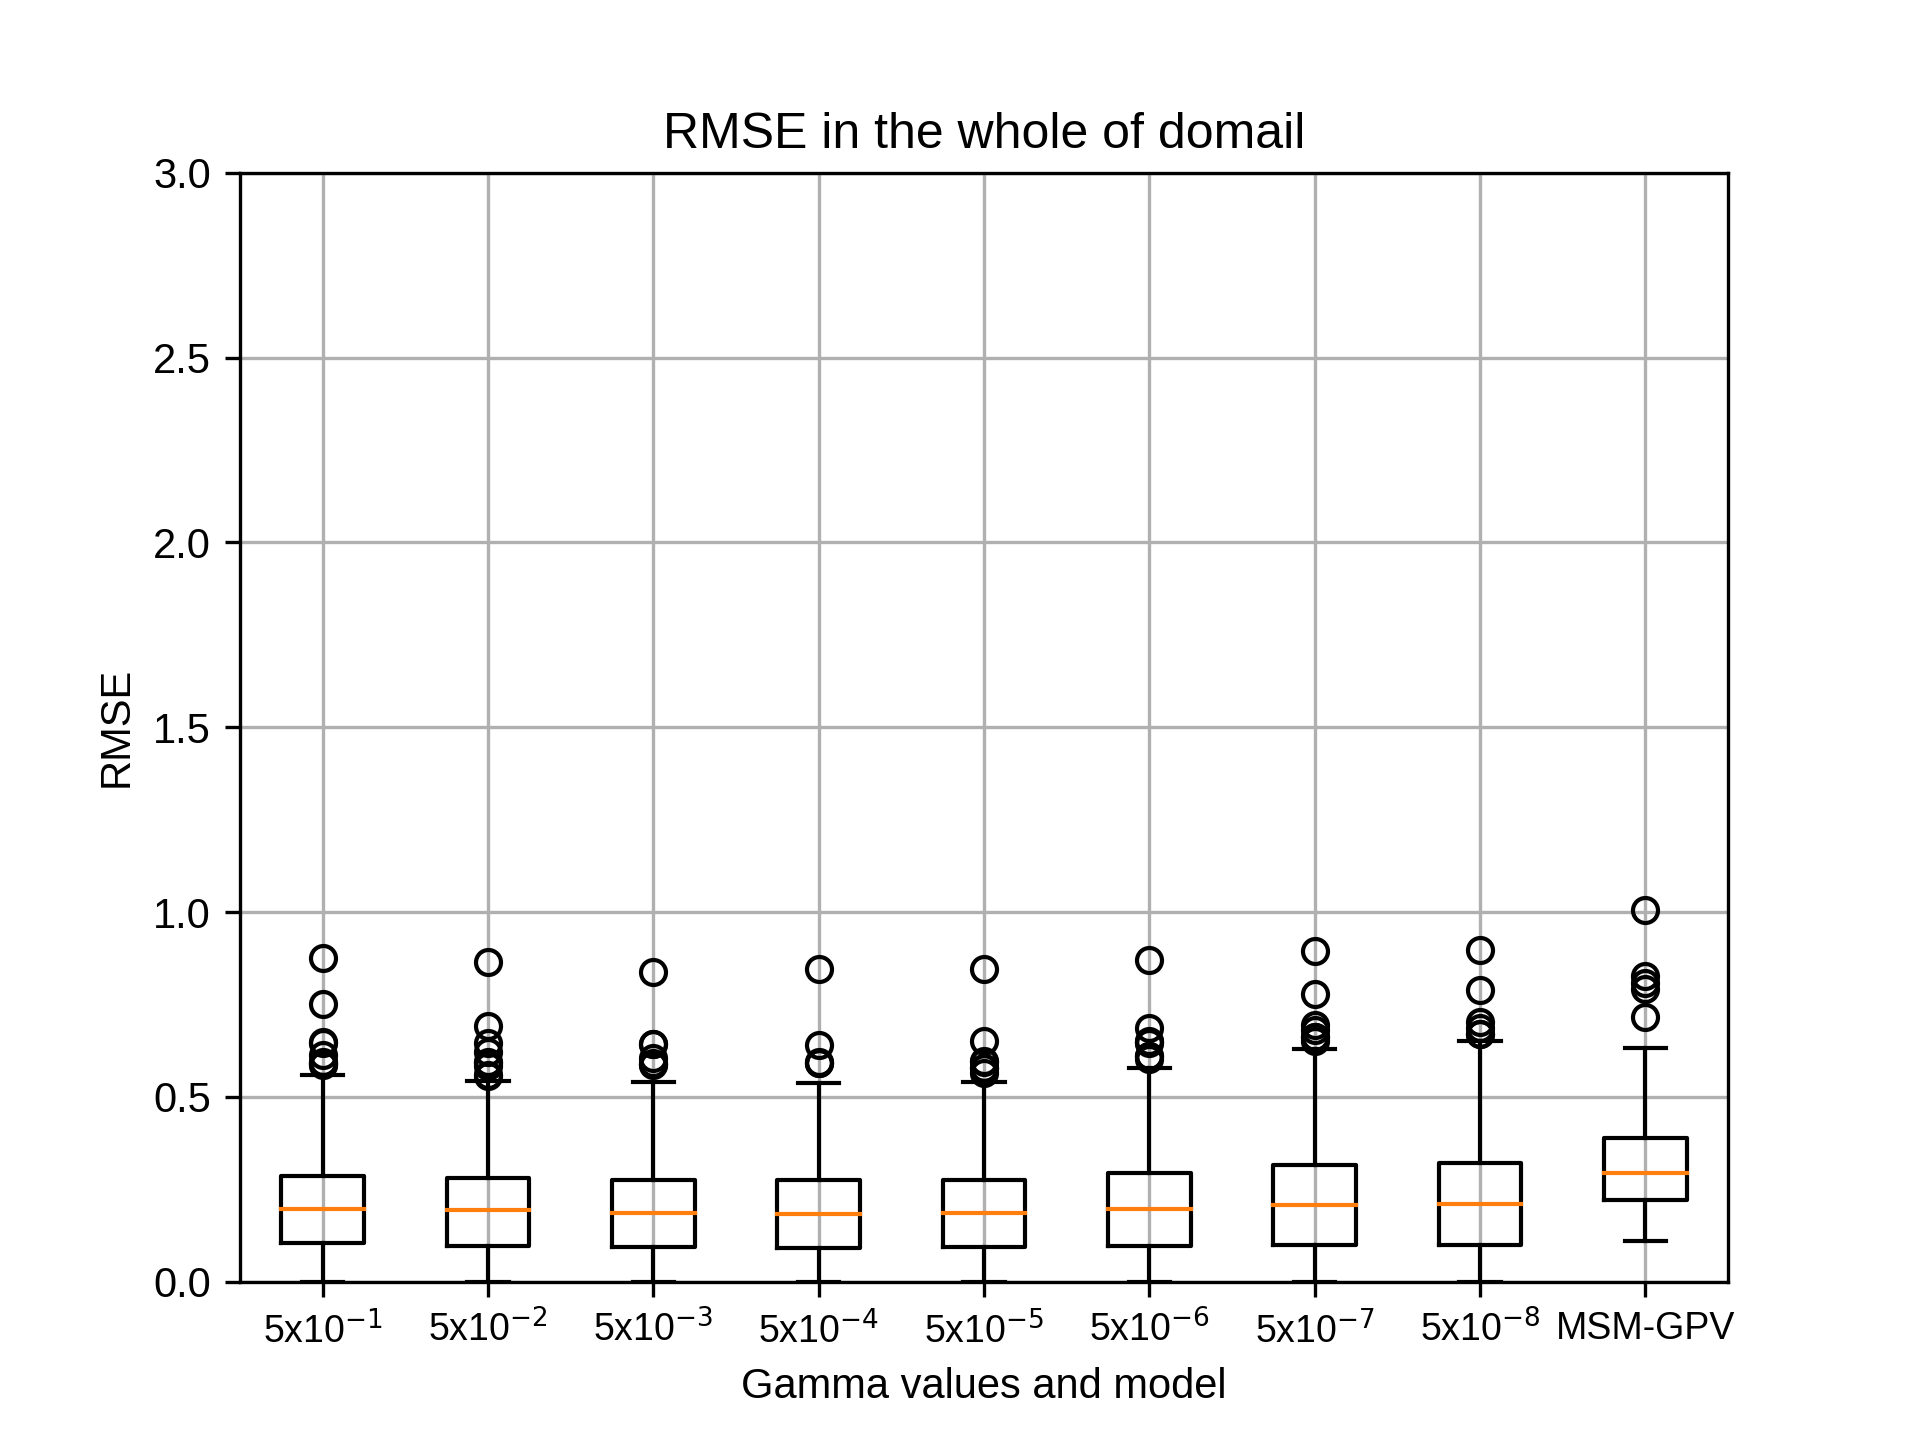
まずは1月のsiteA,rg2=4の結果です。
kobayashi_yusukeThursday, October 22nd, 2020 at 4:11:10 PM GMT+09:00
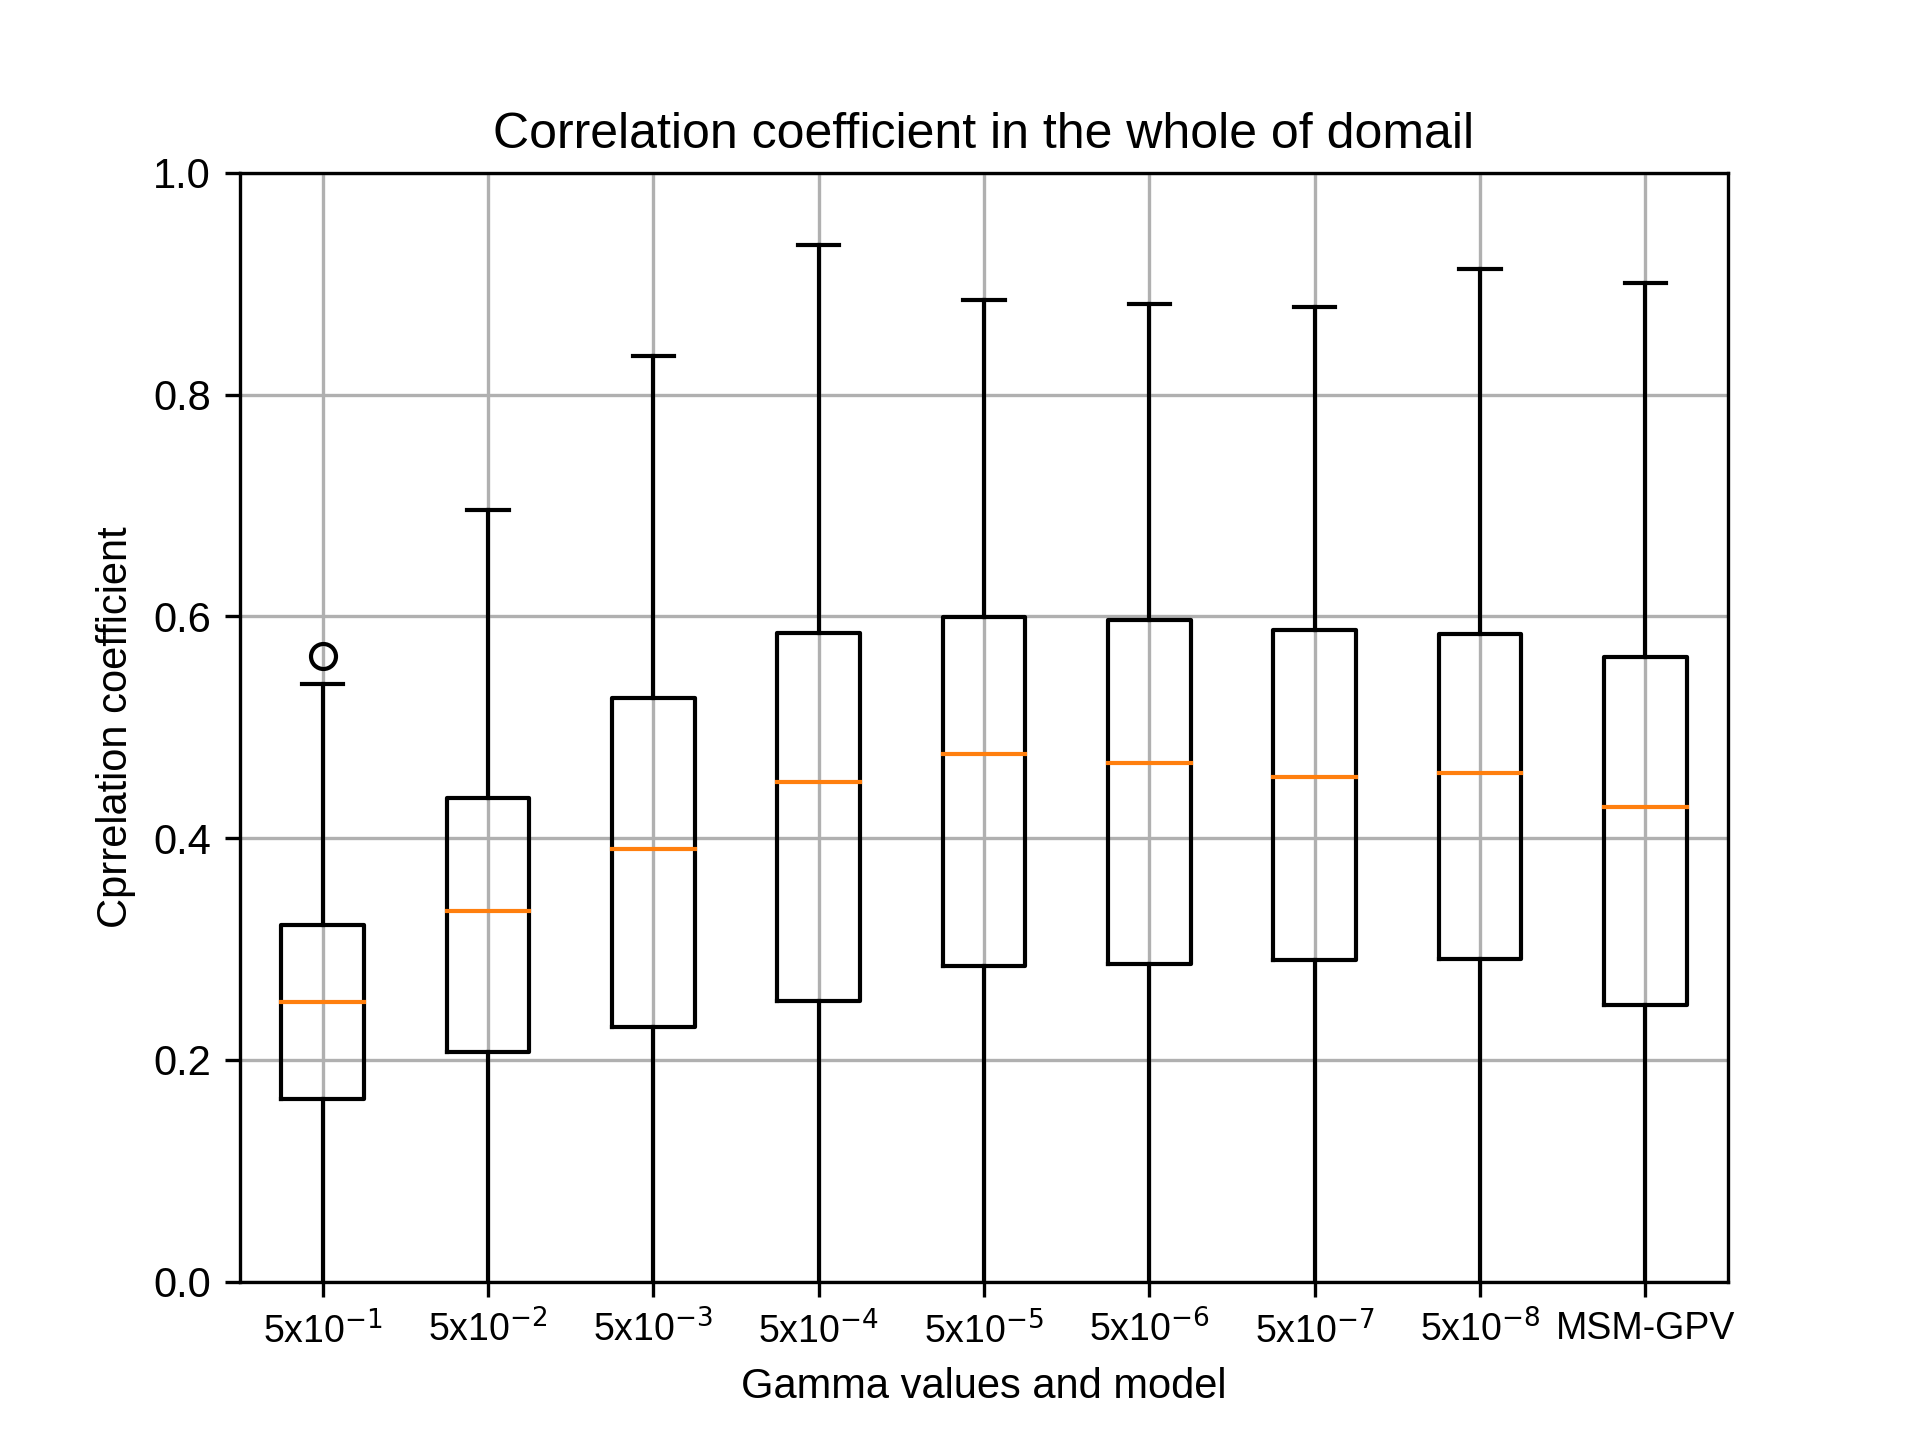
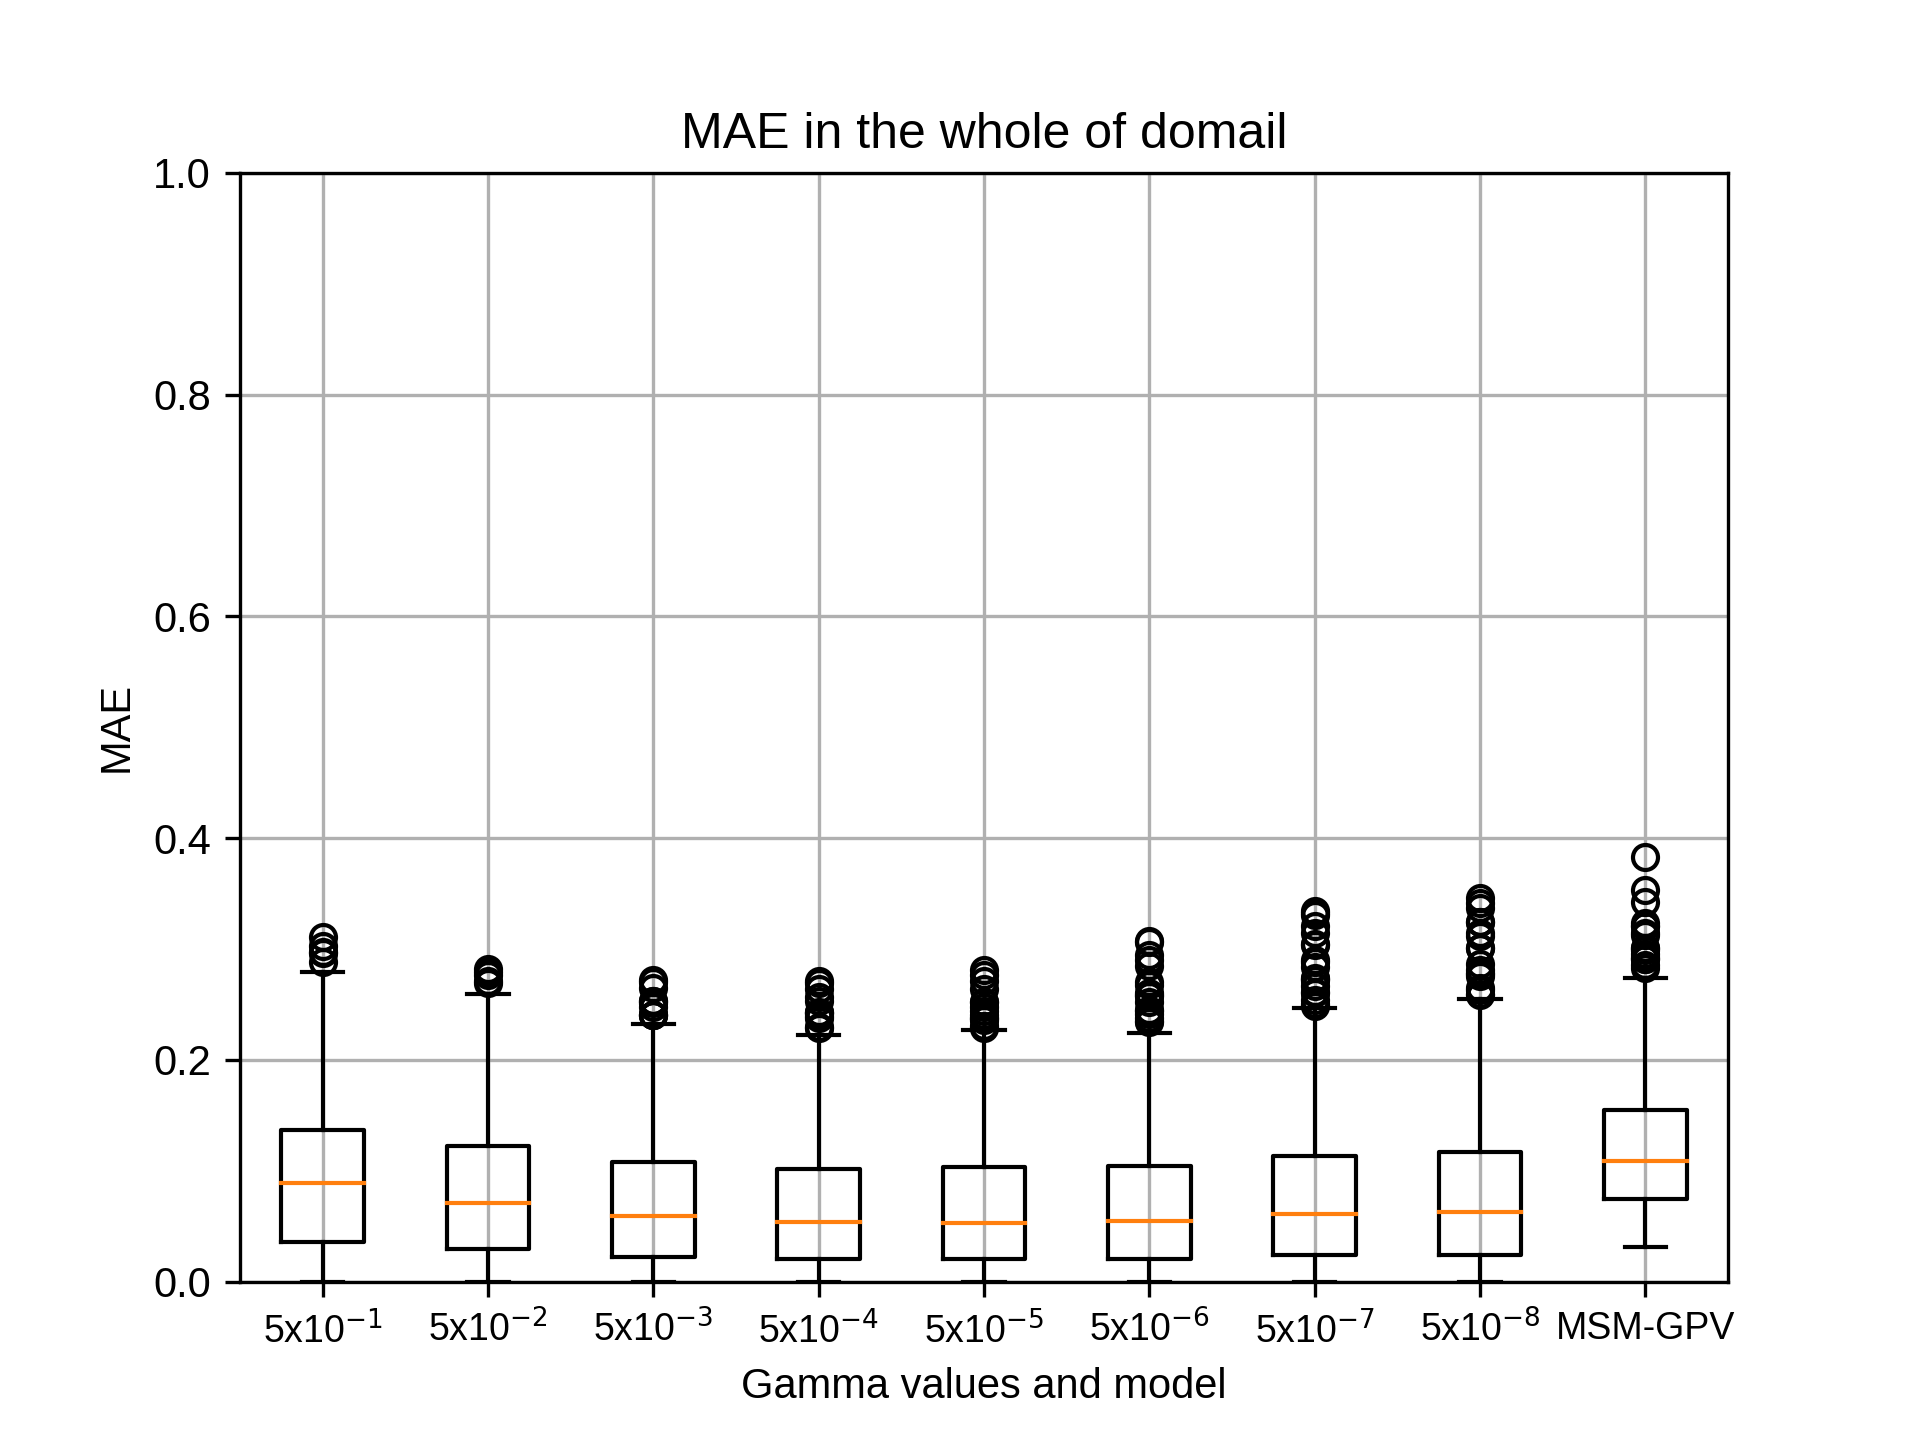
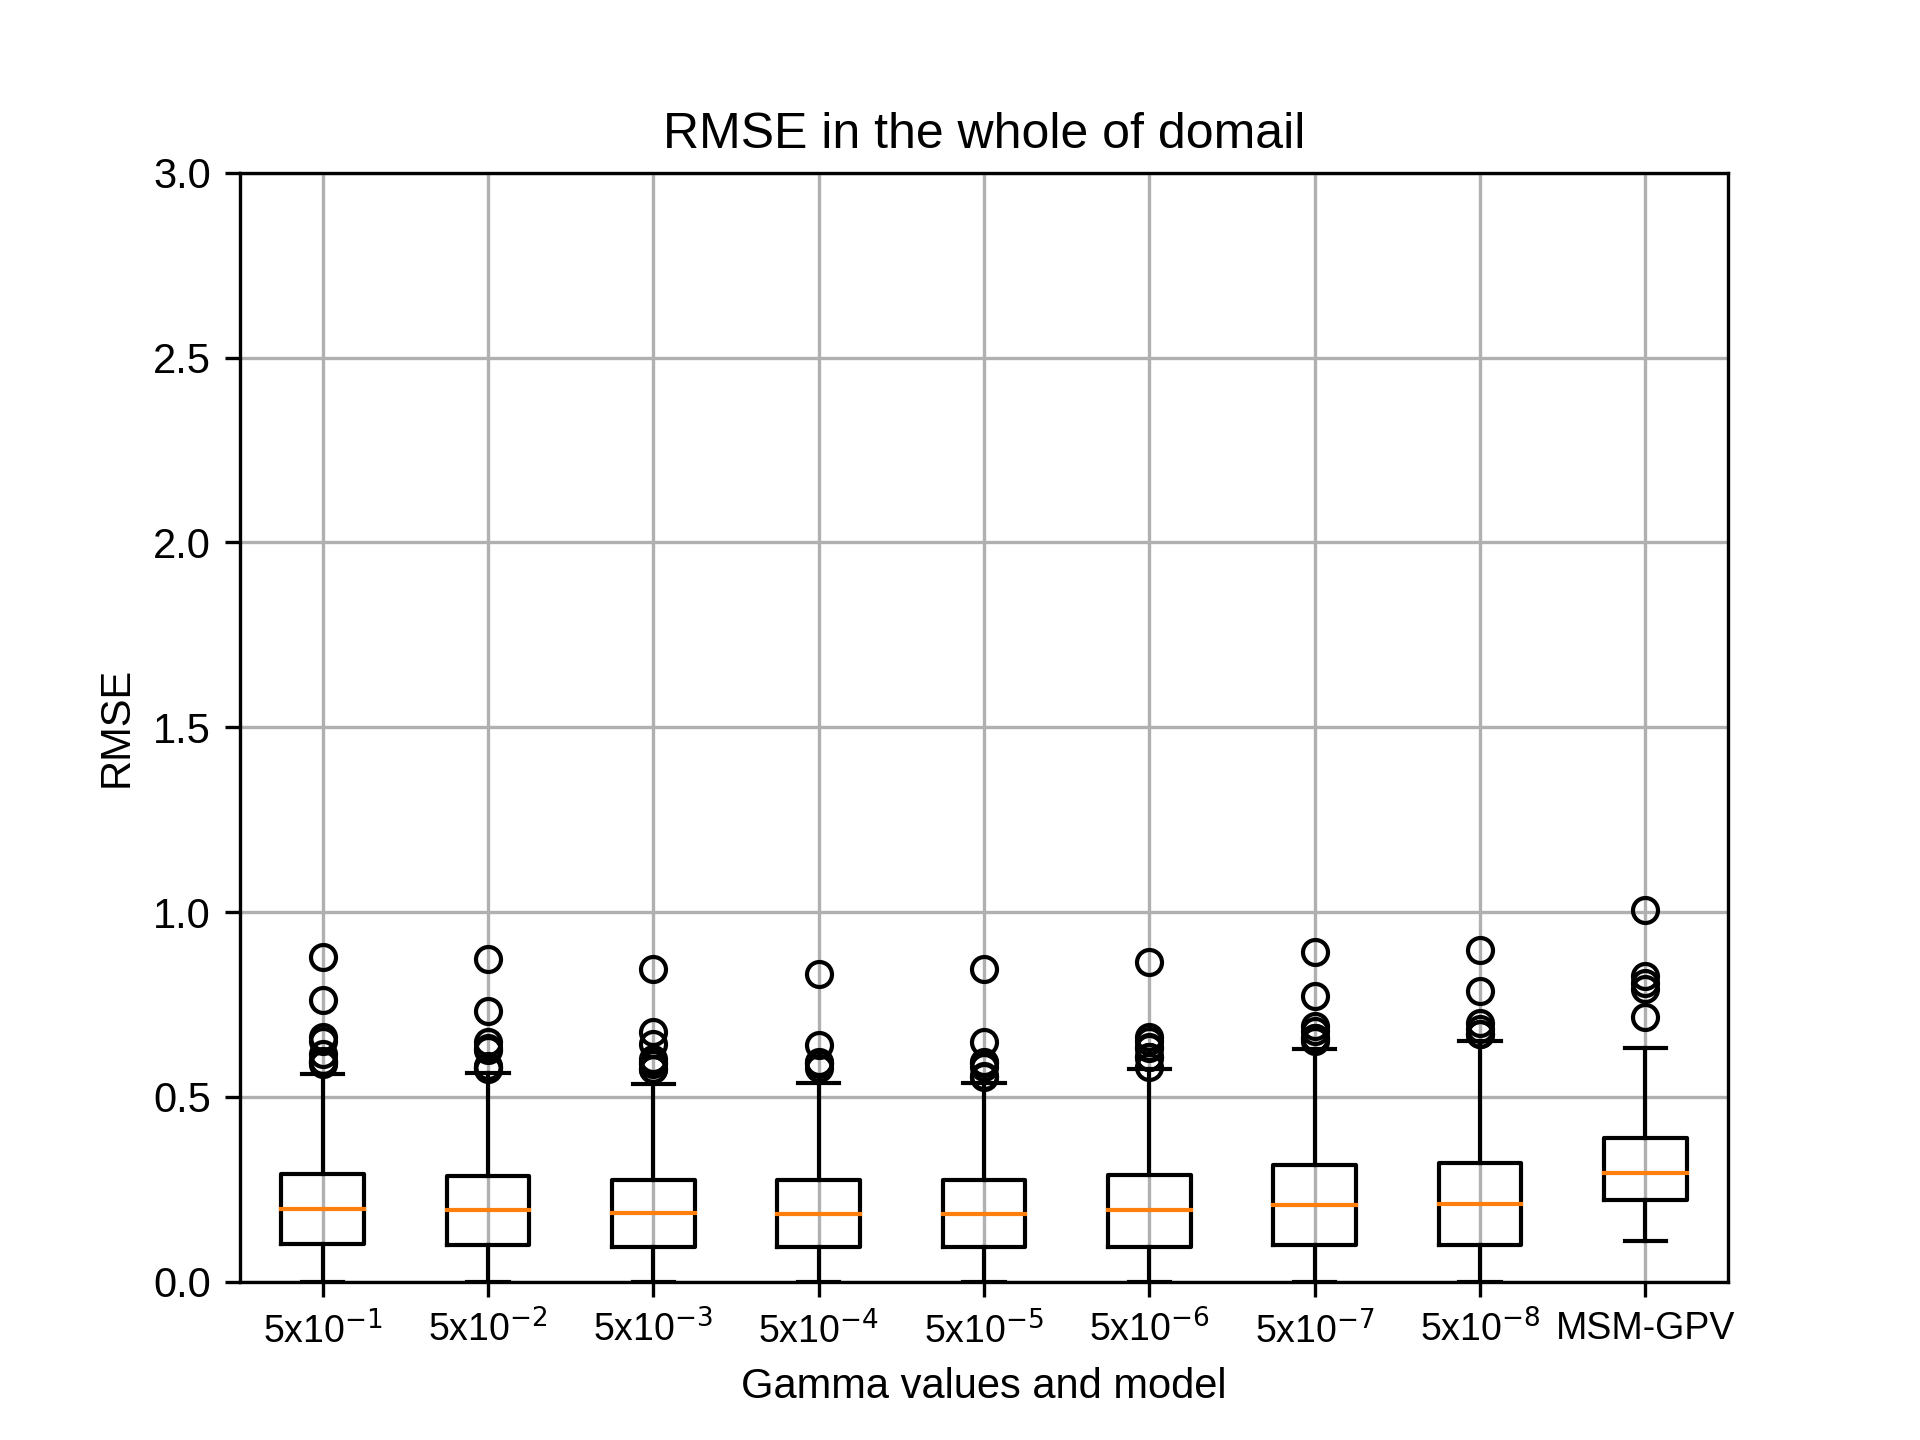
1月のsiteA,rg2=6の結果です。
kobayashi_yusukeThursday, October 22nd, 2020 at 4:11:34 PM GMT+09:00
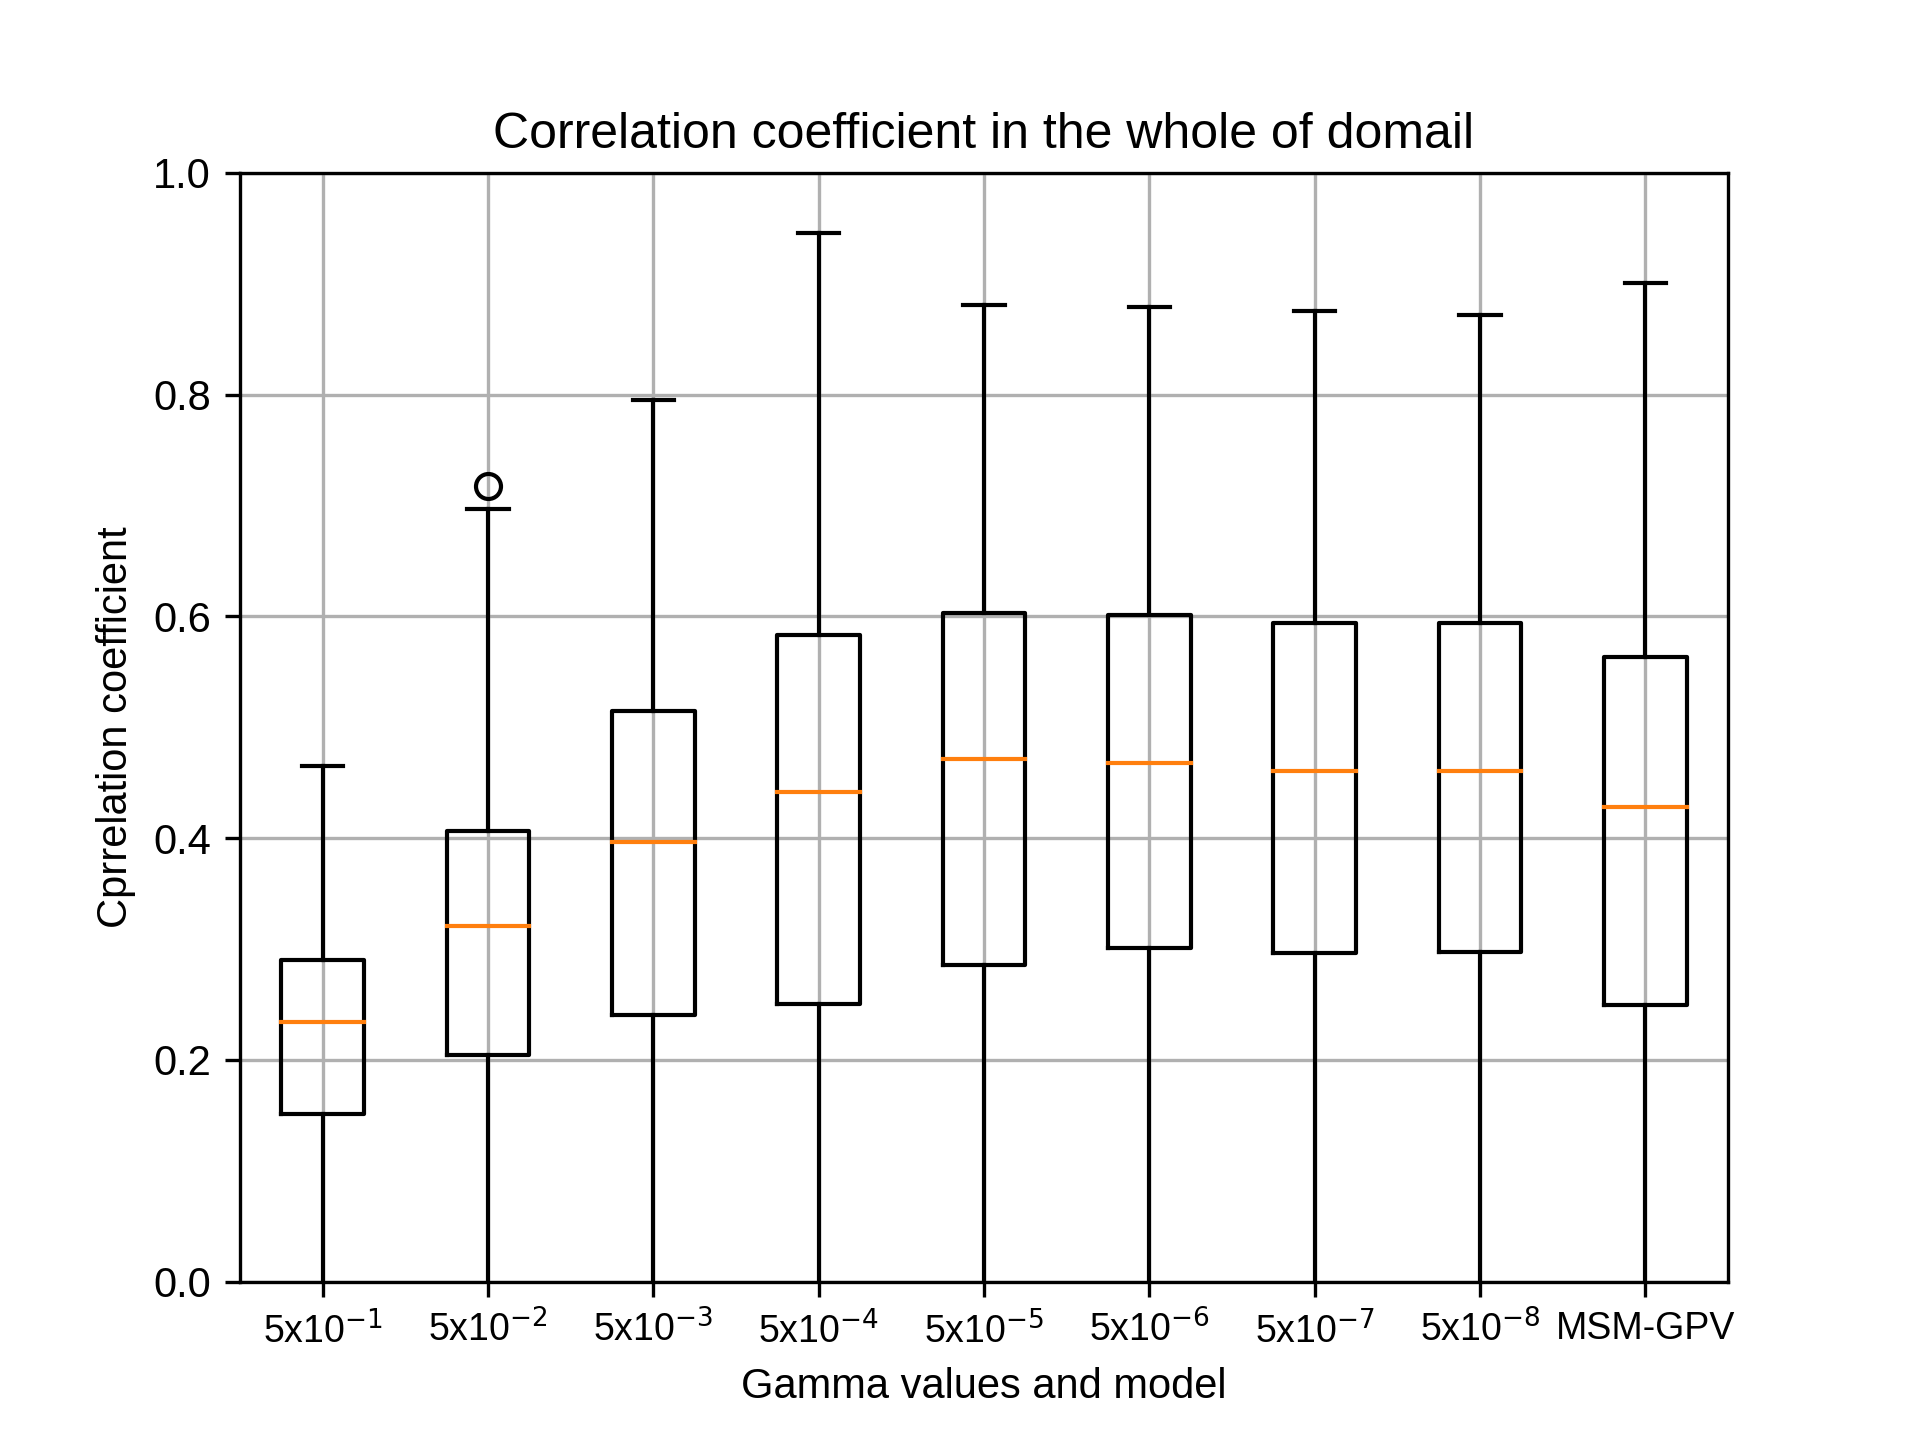
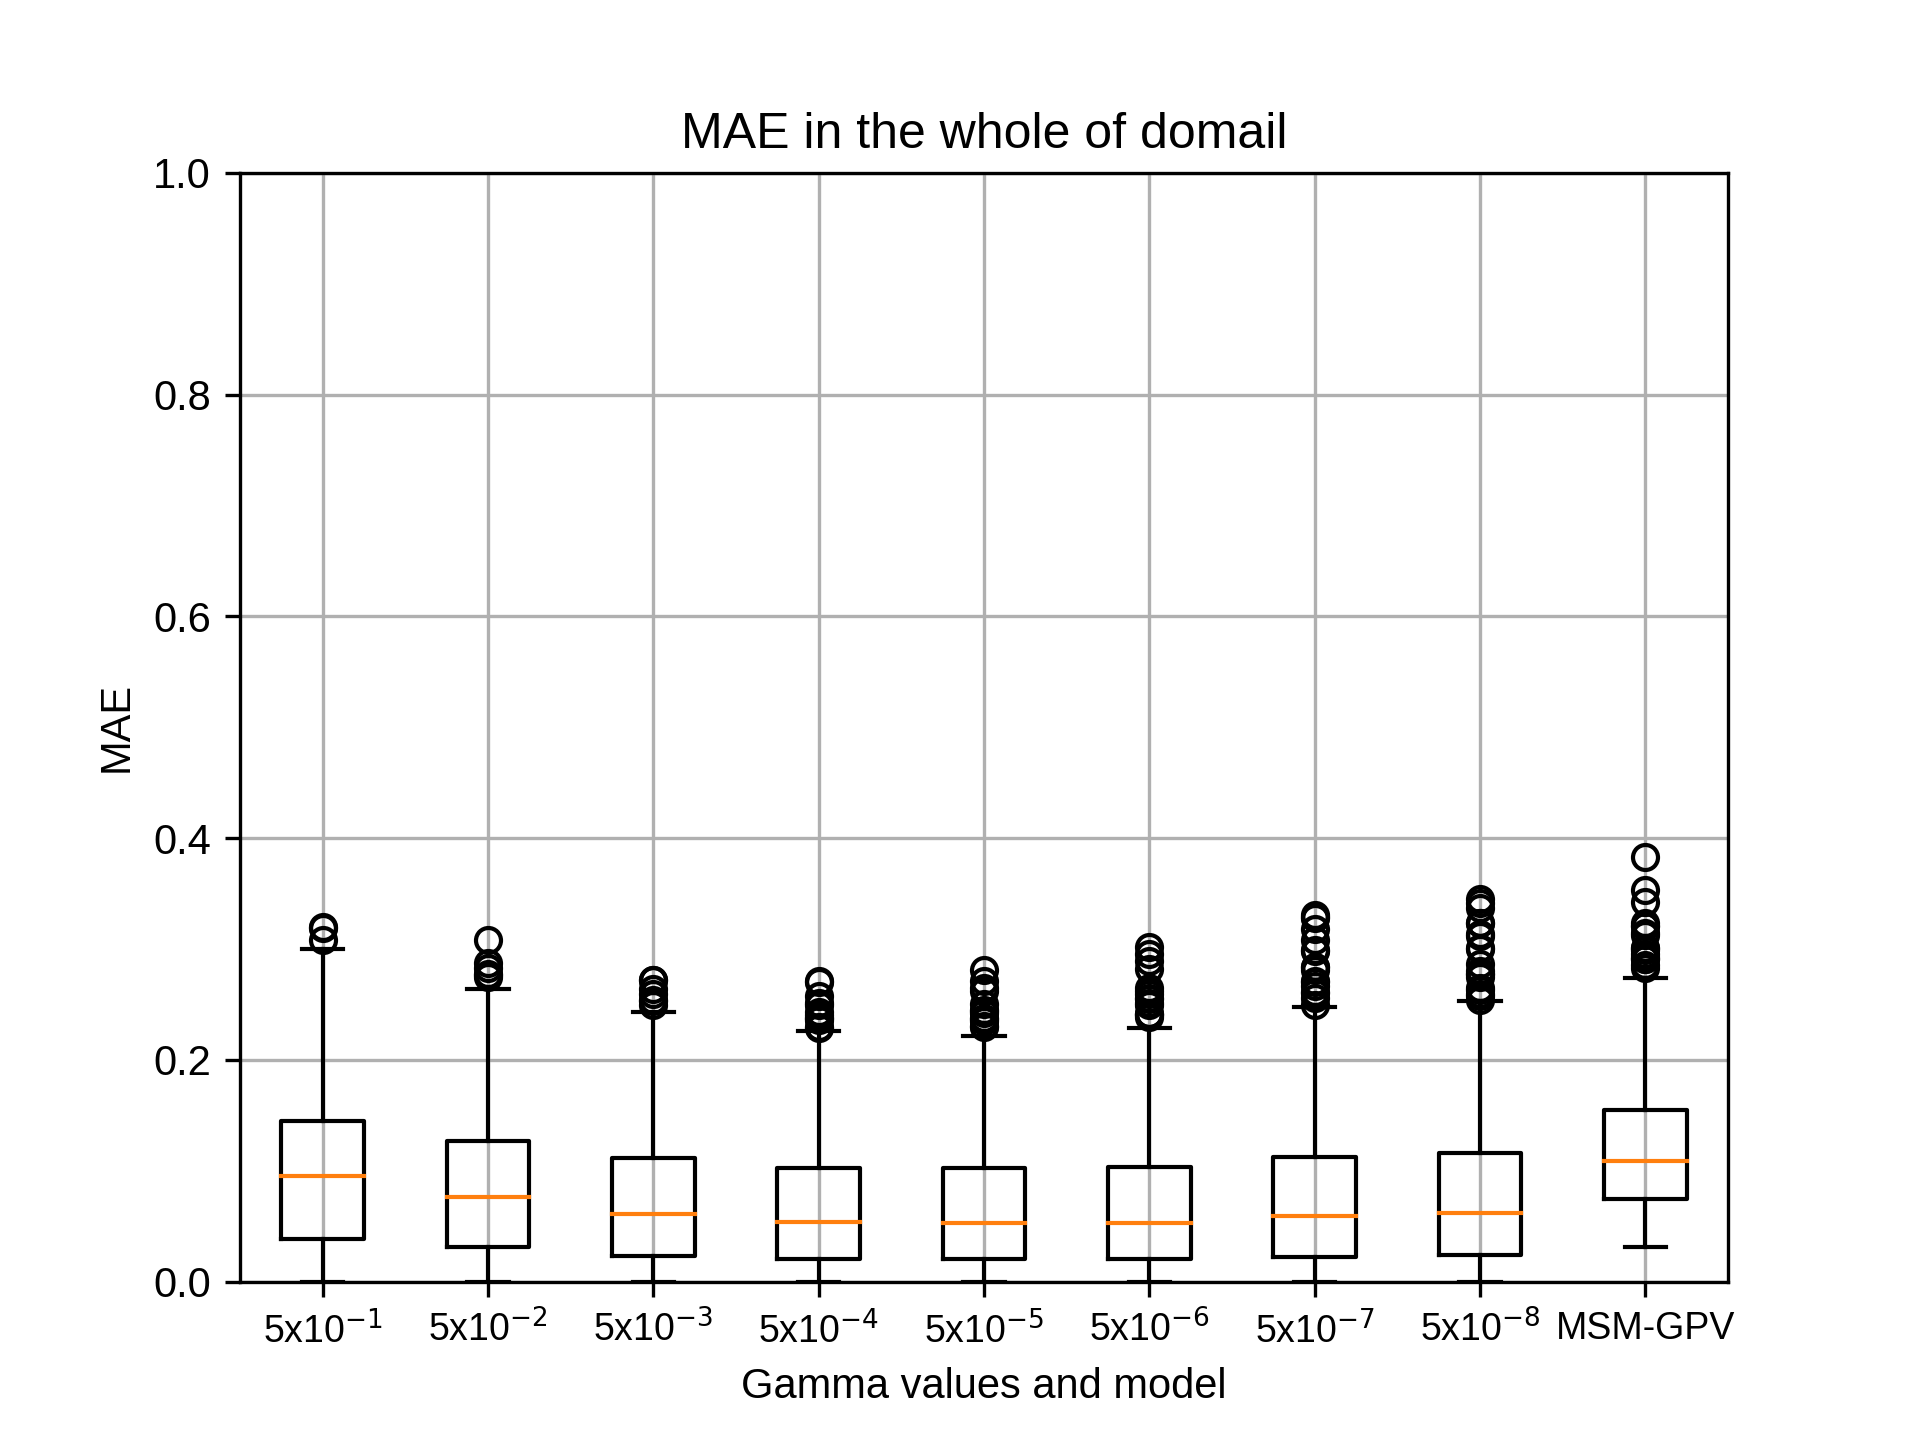
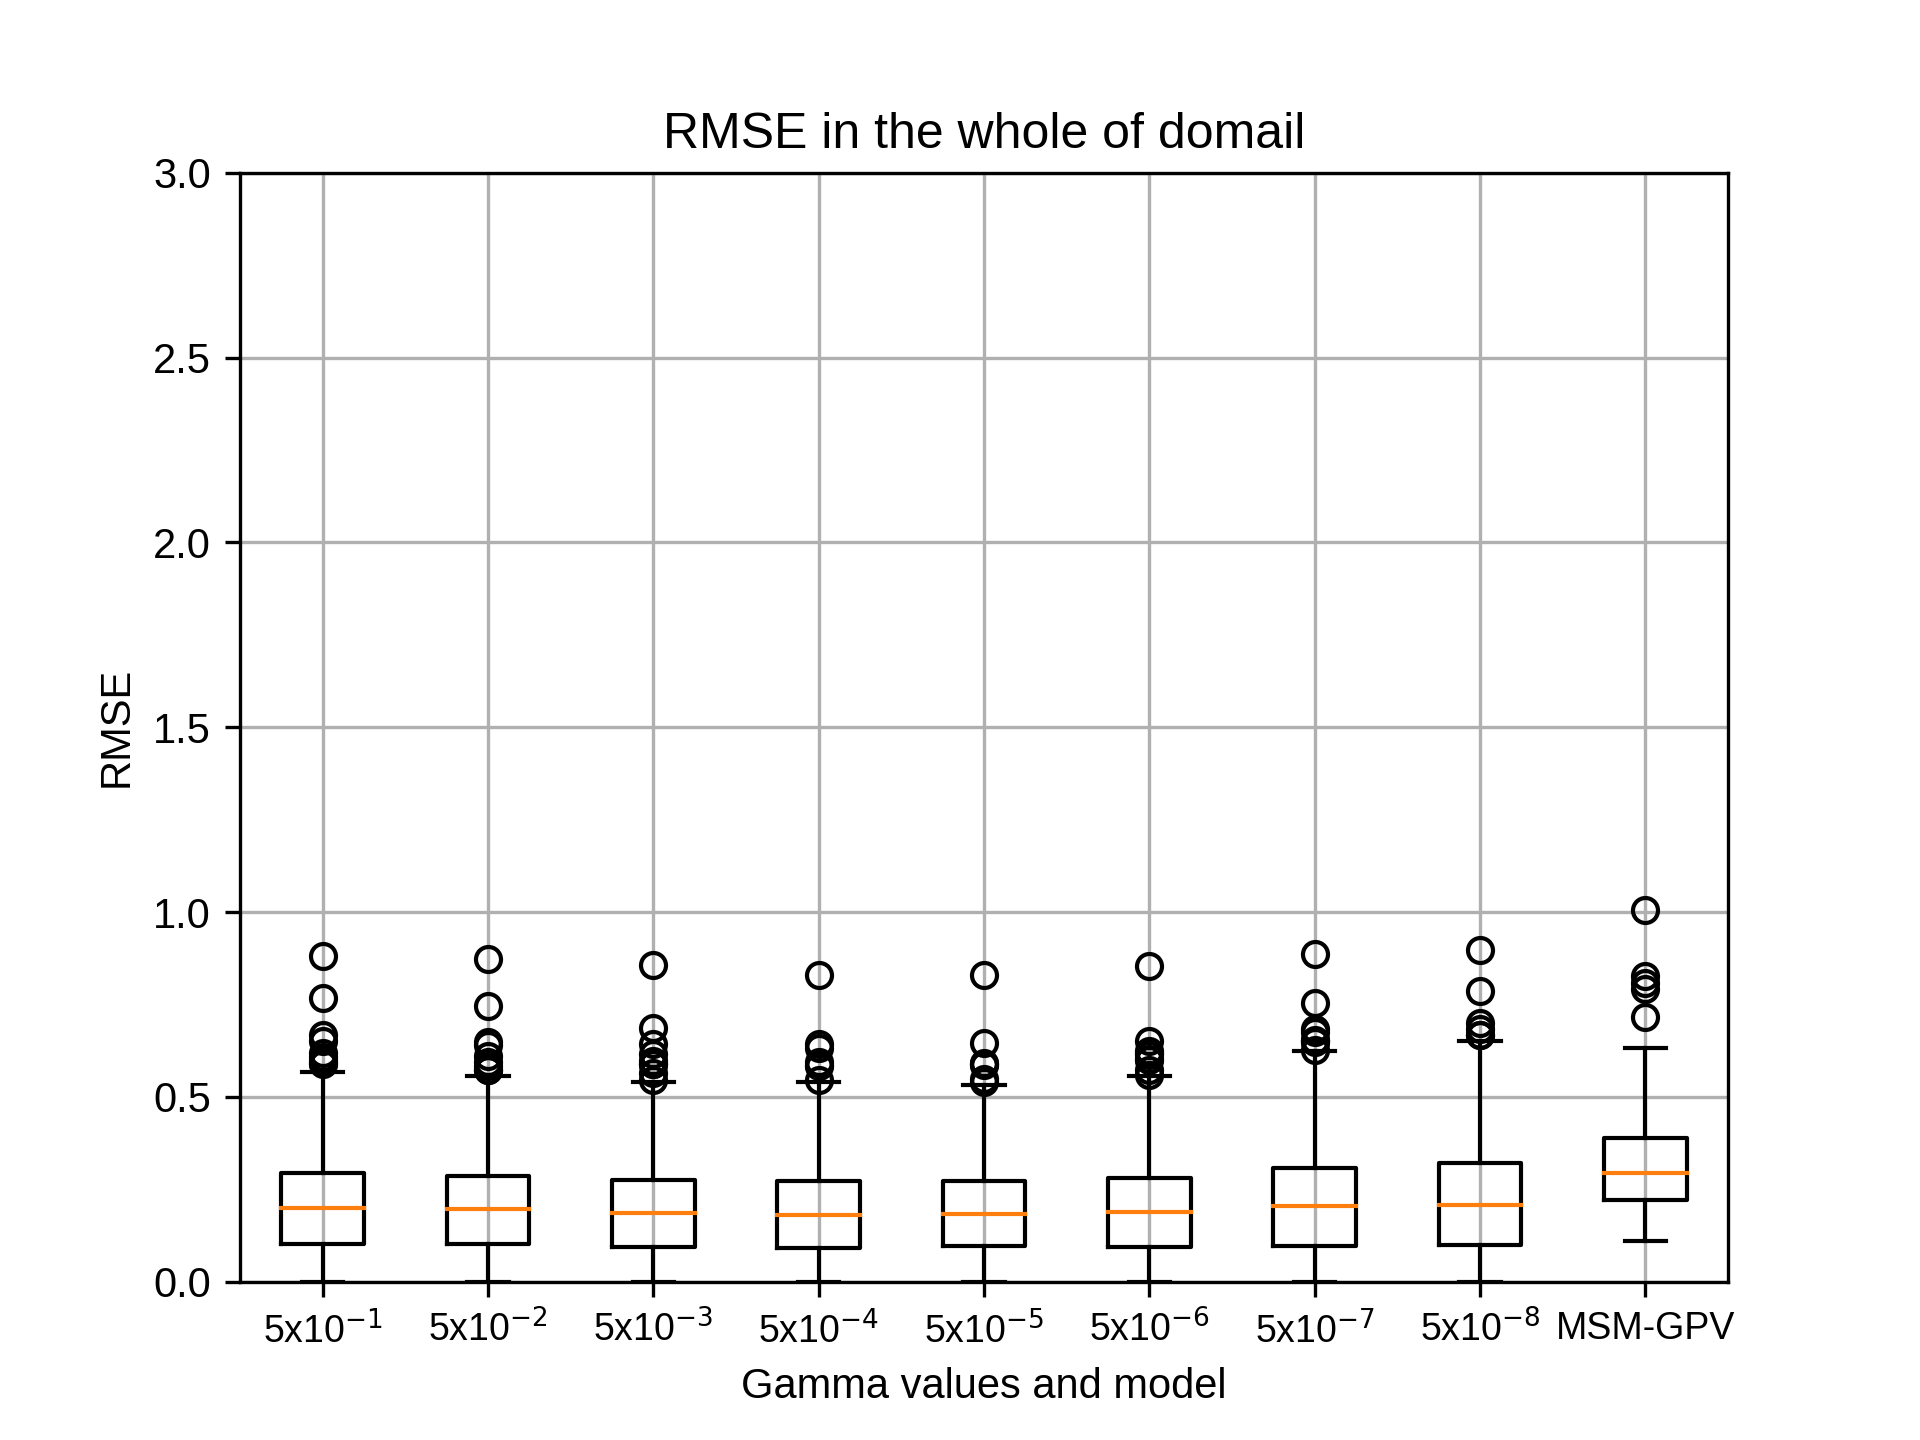
1月のsiteA,rg2=8の結果です。
kobayashi_yusukeThursday, October 22nd, 2020 at 4:11:56 PM GMT+09:00


1月のsiteA,rg2=10の結果です。
kobayashi_yusukeThursday, October 22nd, 2020 at 4:12:16 PM GMT+09:00

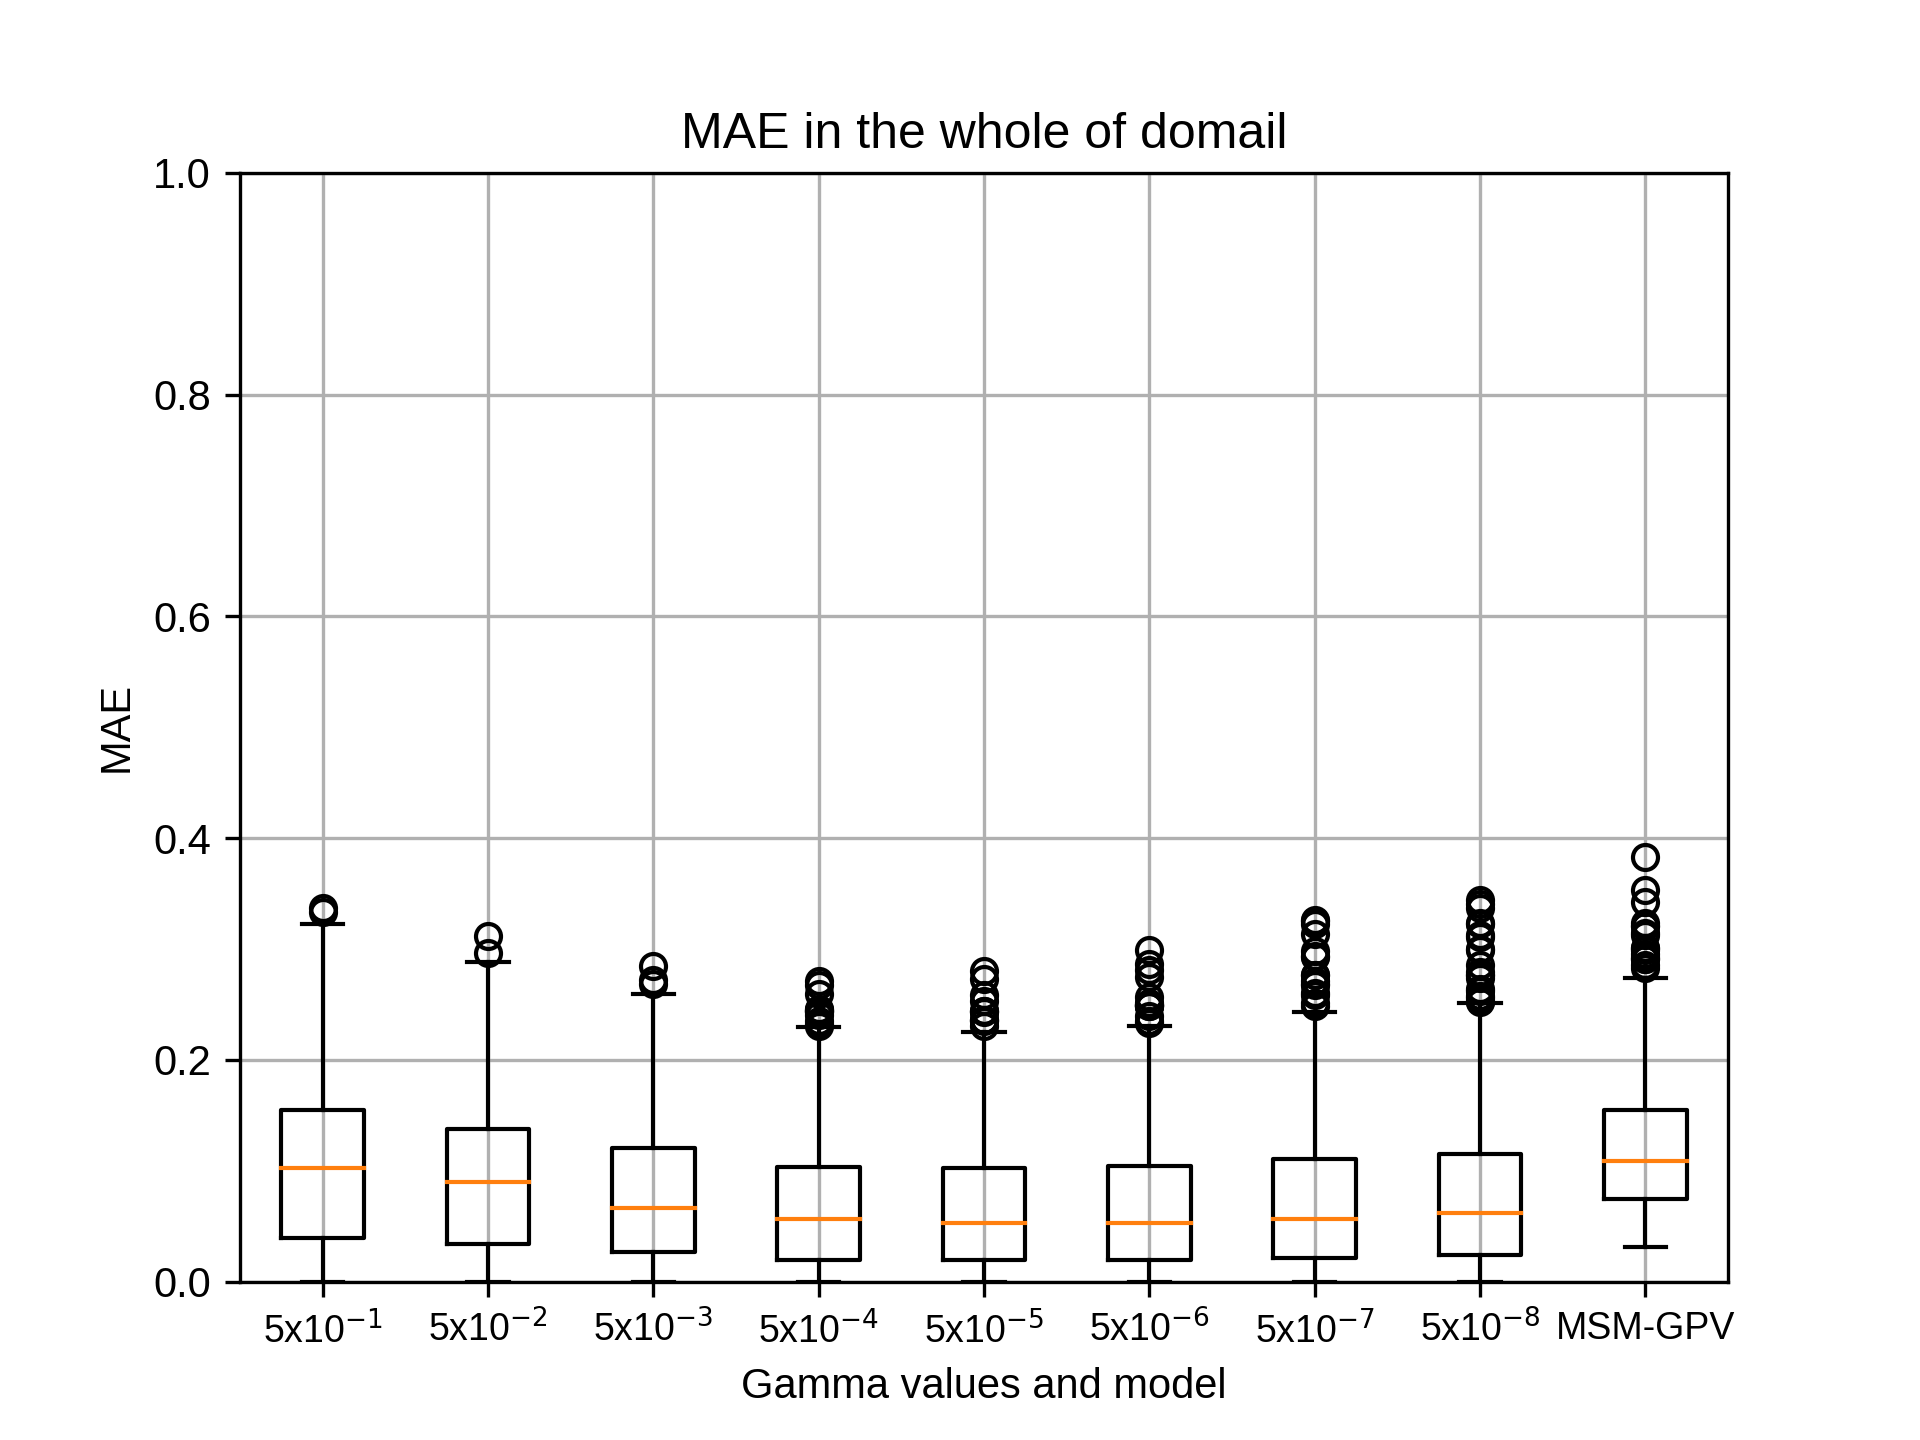
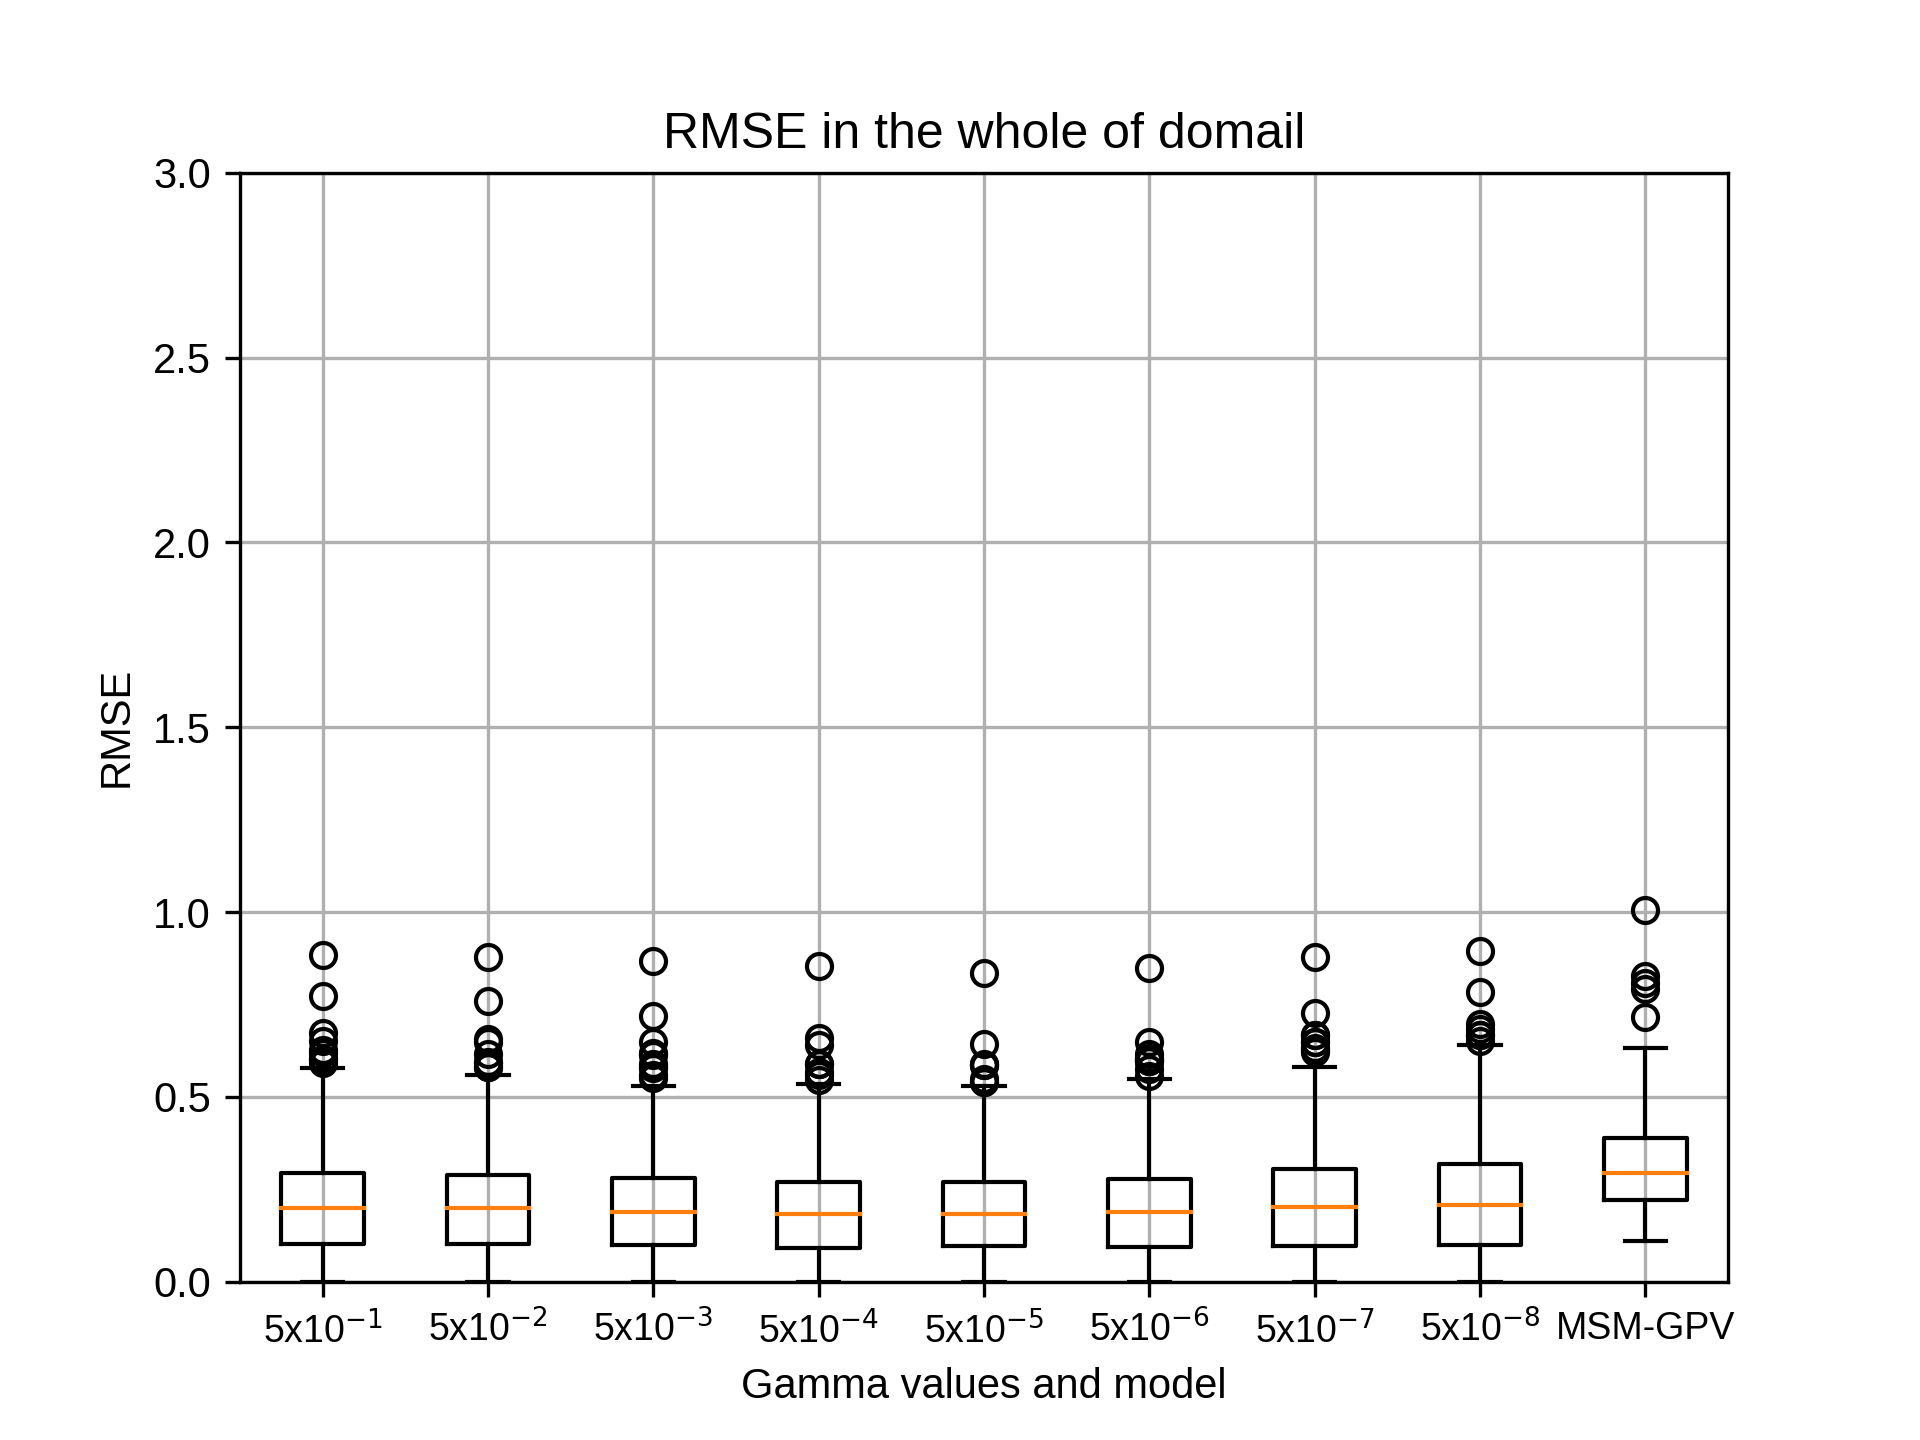
1月のsiteA,rg2=12の結果です。
1月のsiteAではrg2=10でgammaが5x10⁻⁶のとき、相関係数の中央値が最も高くなりました。
1月のsiteAではrg2=10でgammaが5x10⁻⁶のとき、相関係数の中央値が最も高くなりました。
kobayashi_yusukeThursday, October 22nd, 2020 at 4:12:46 PM GMT+09:00
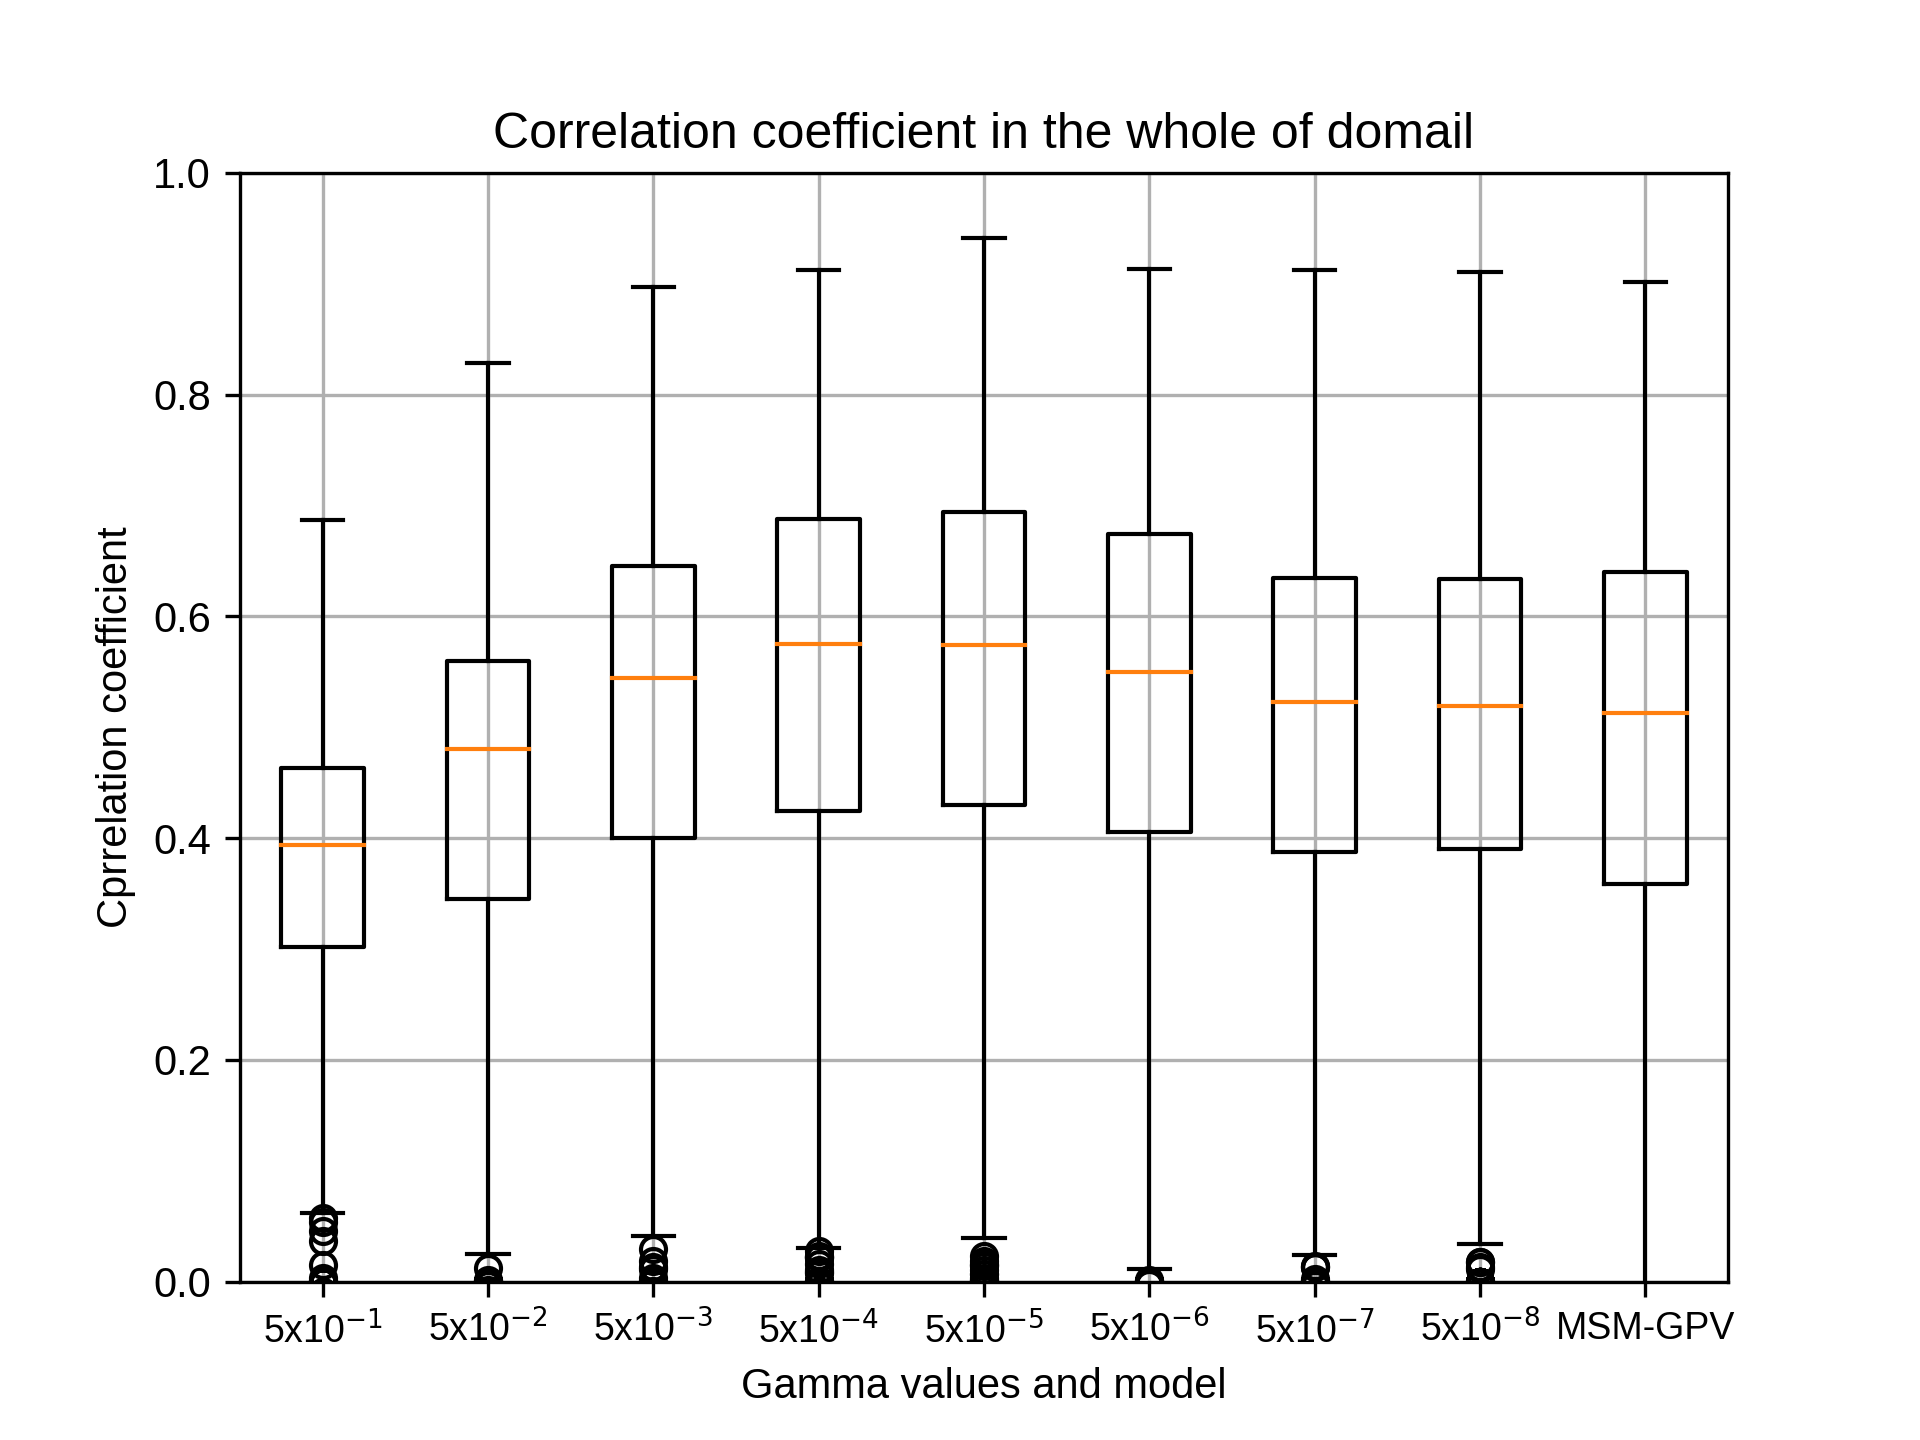
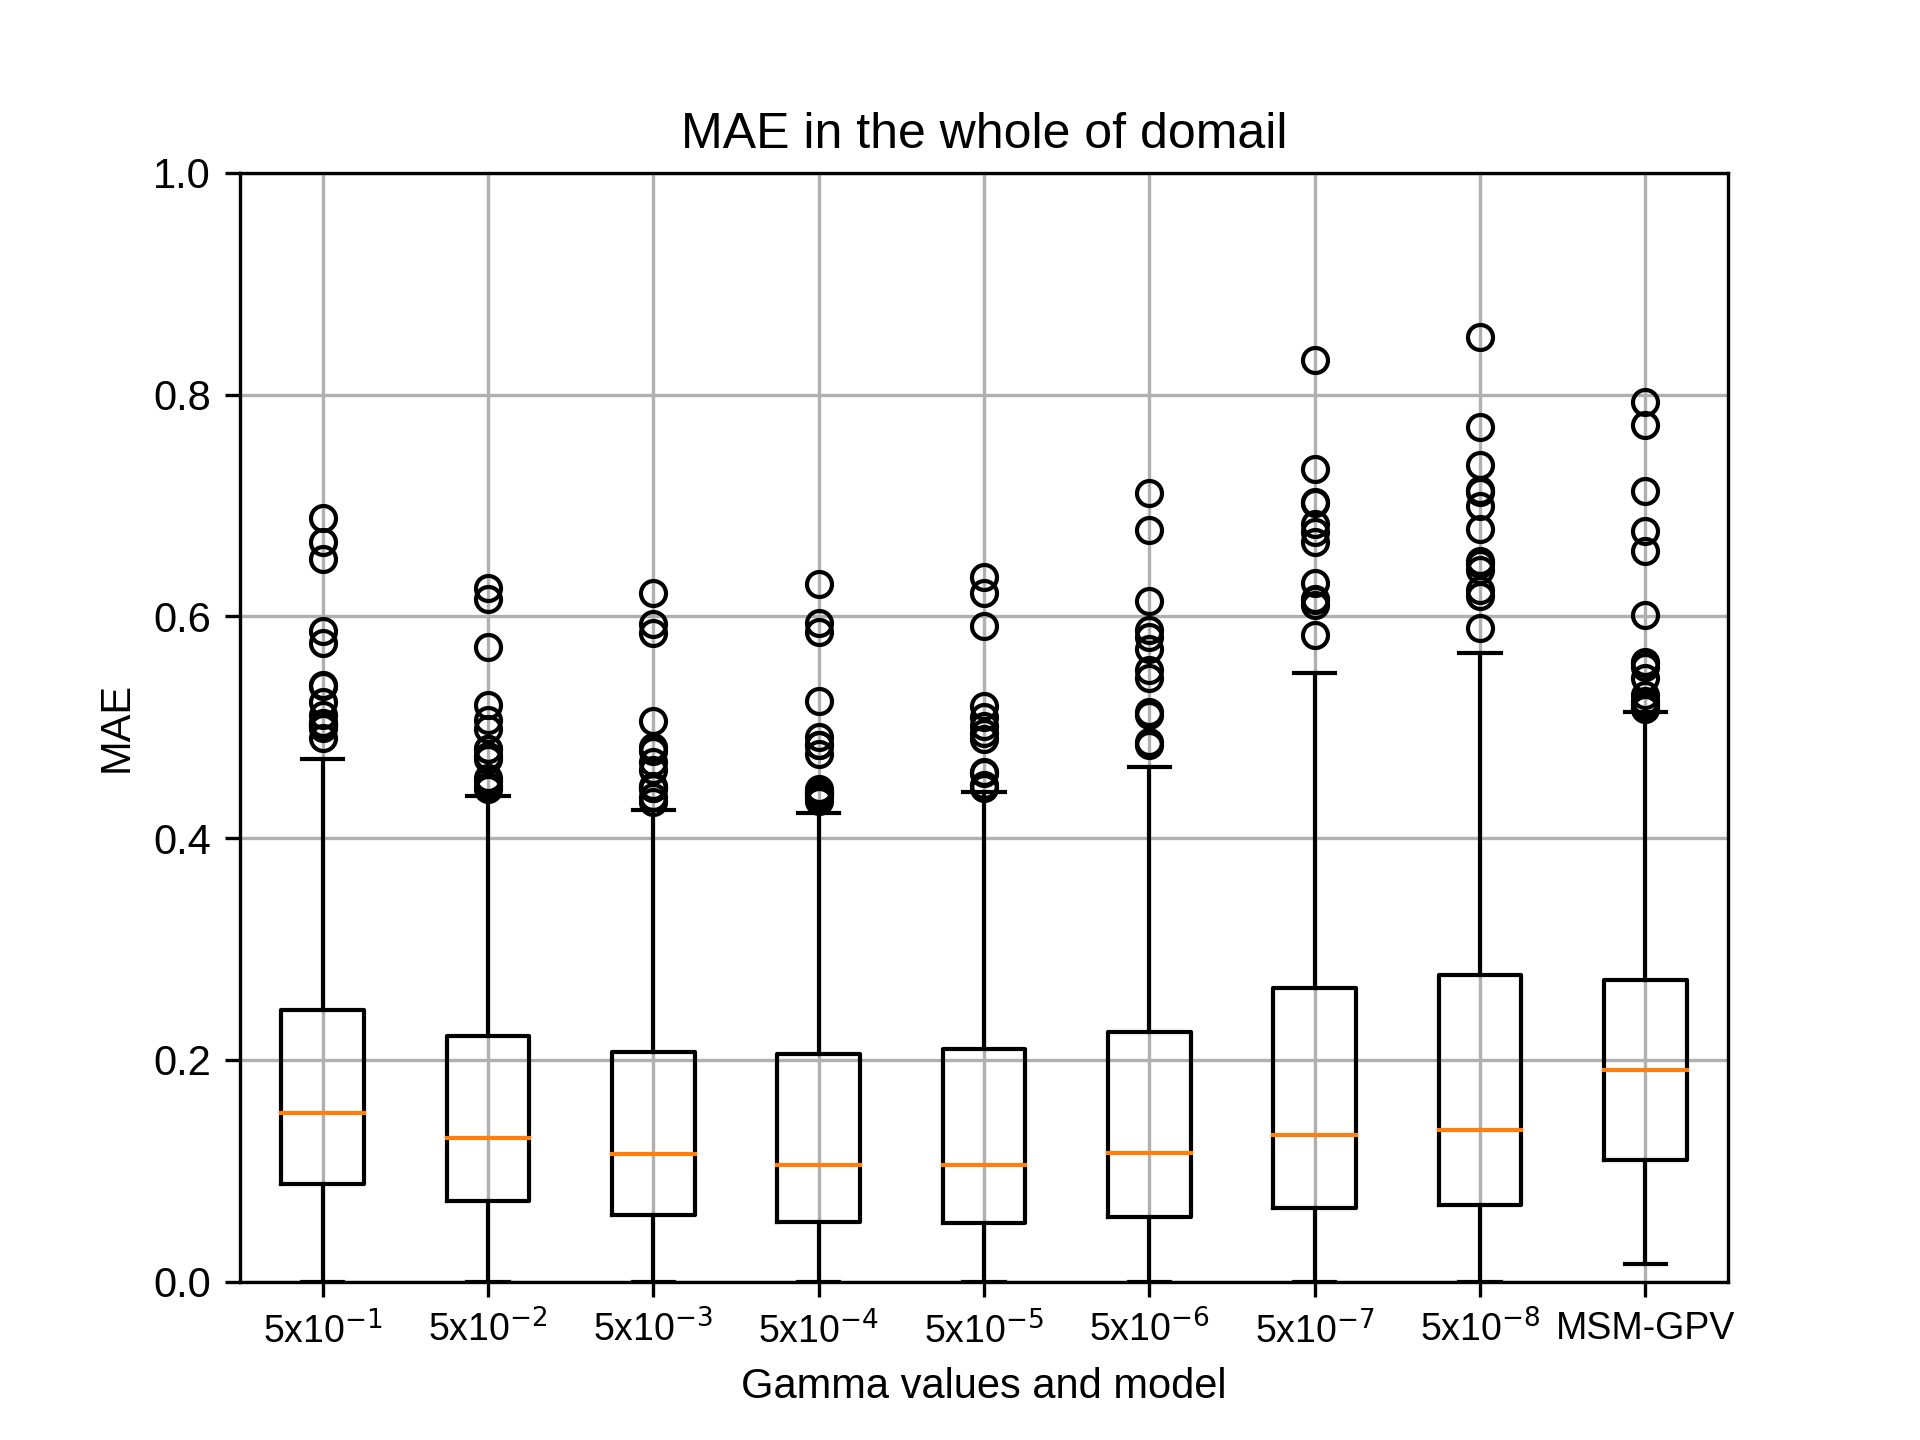
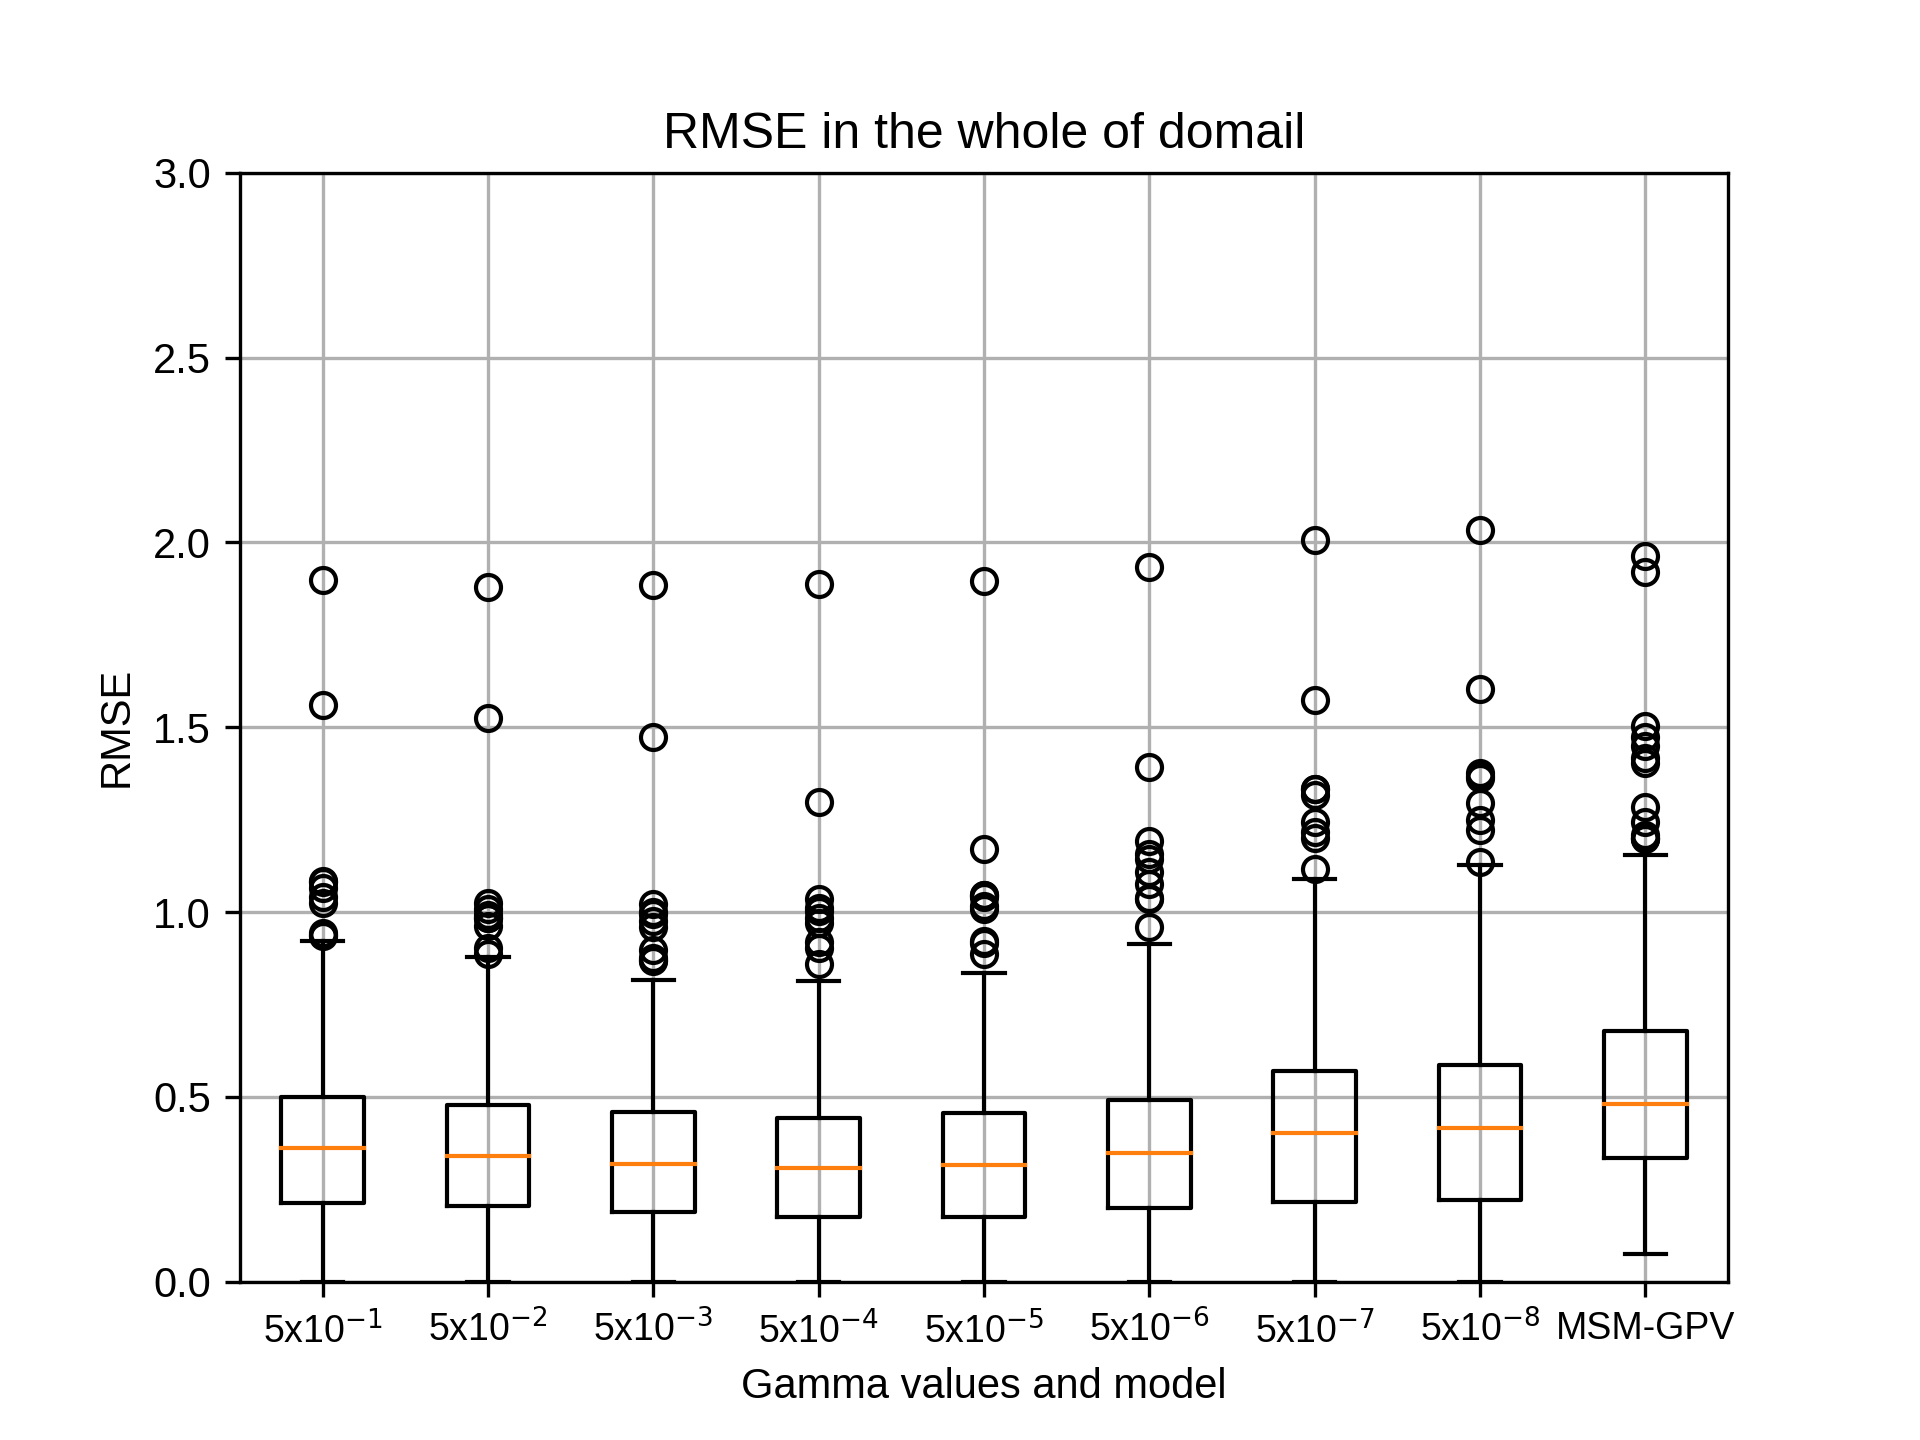
1月のsiteB,rg2=4の結果です。
kobayashi_yusukeThursday, October 22nd, 2020 at 4:13:00 PM GMT+09:00
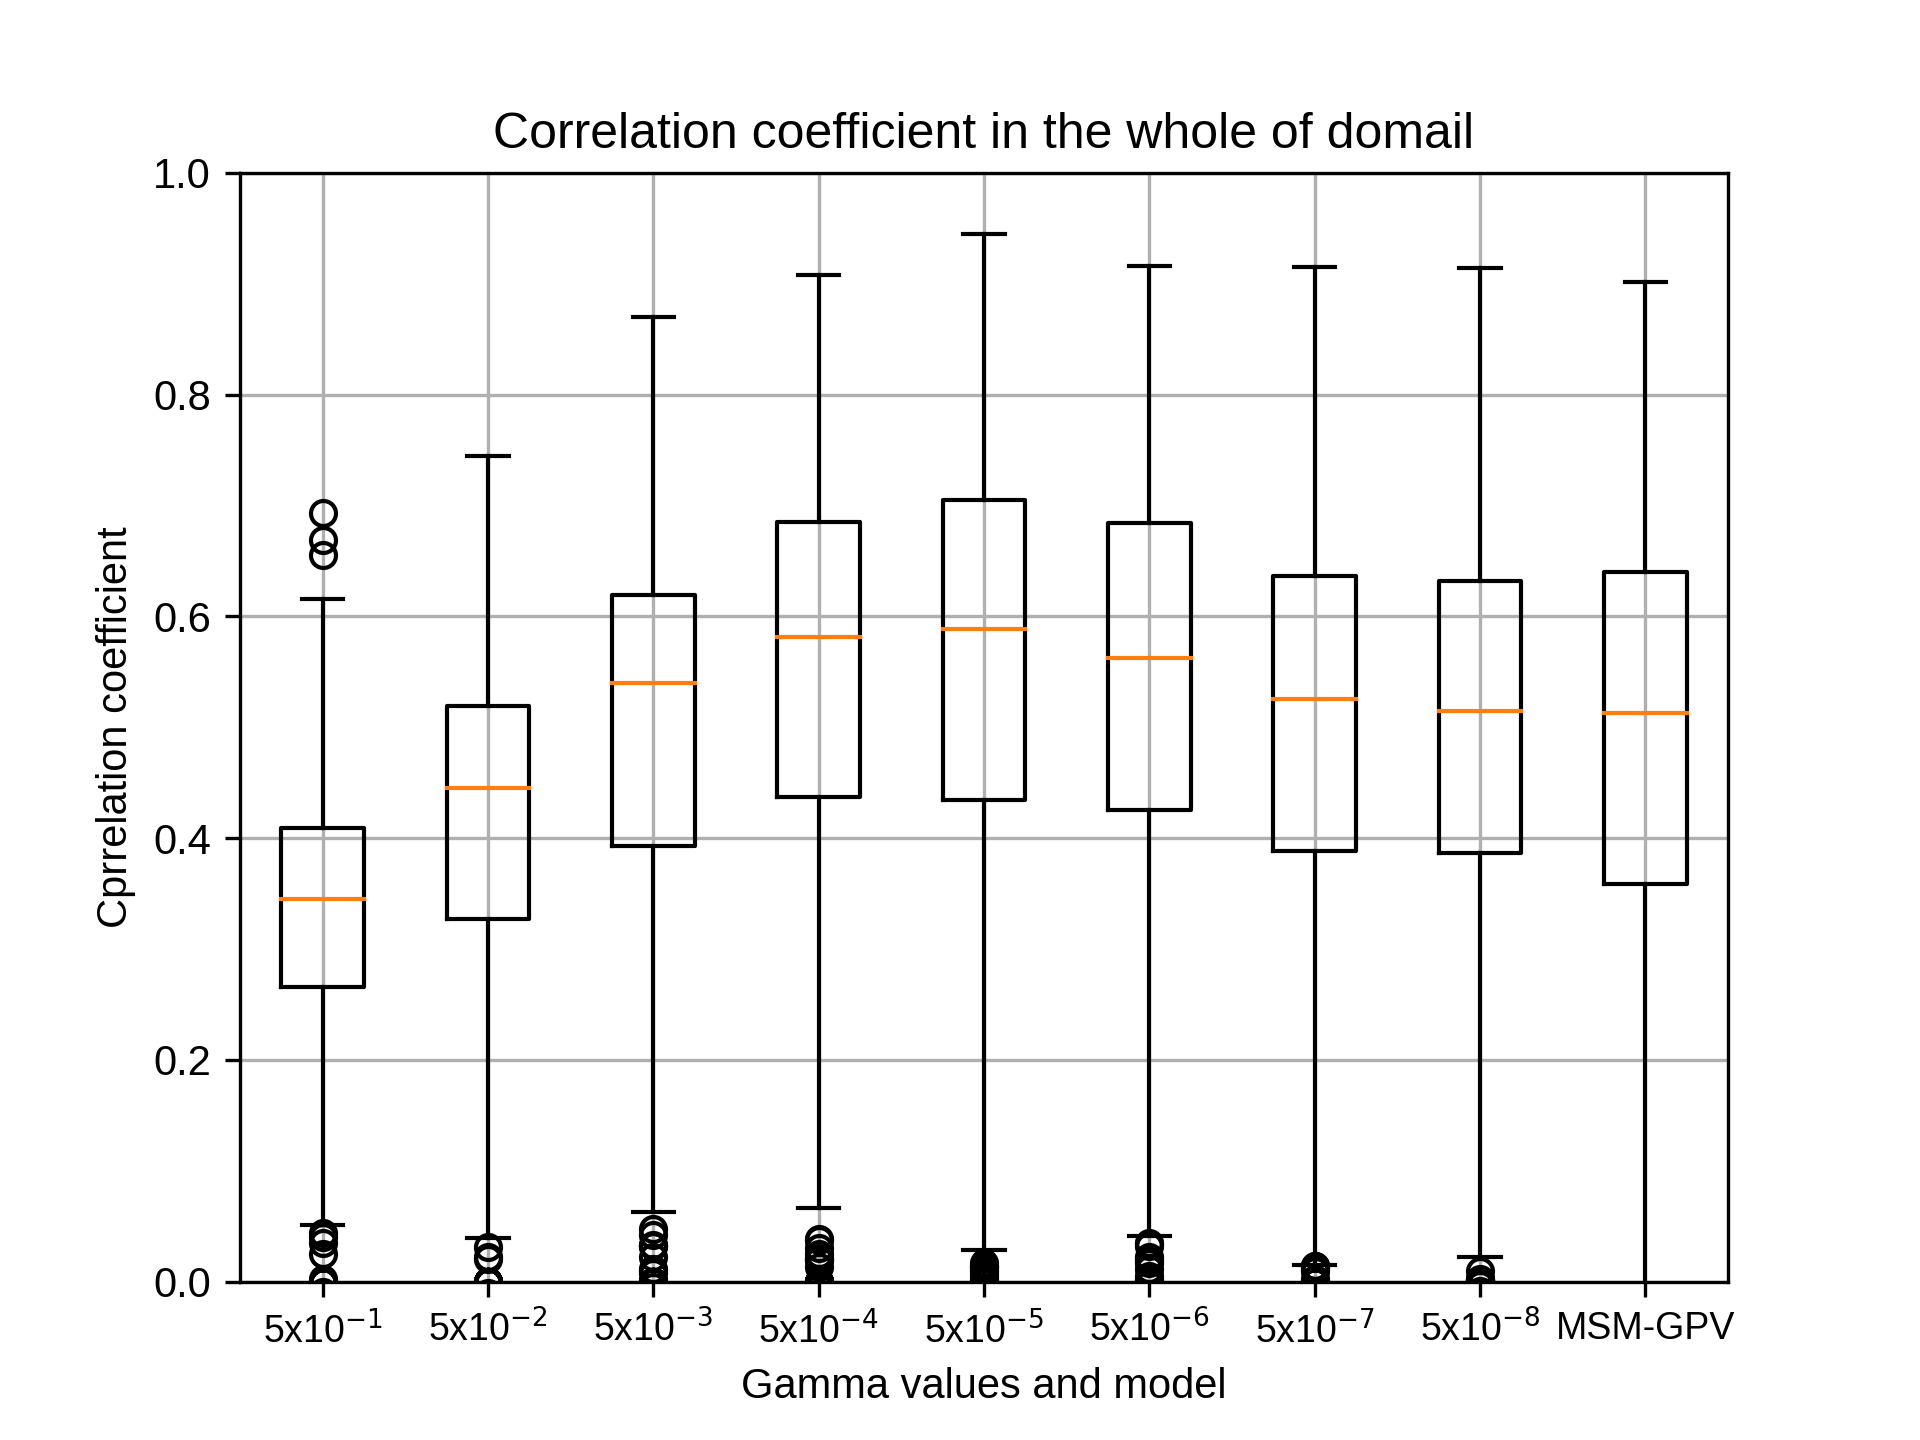
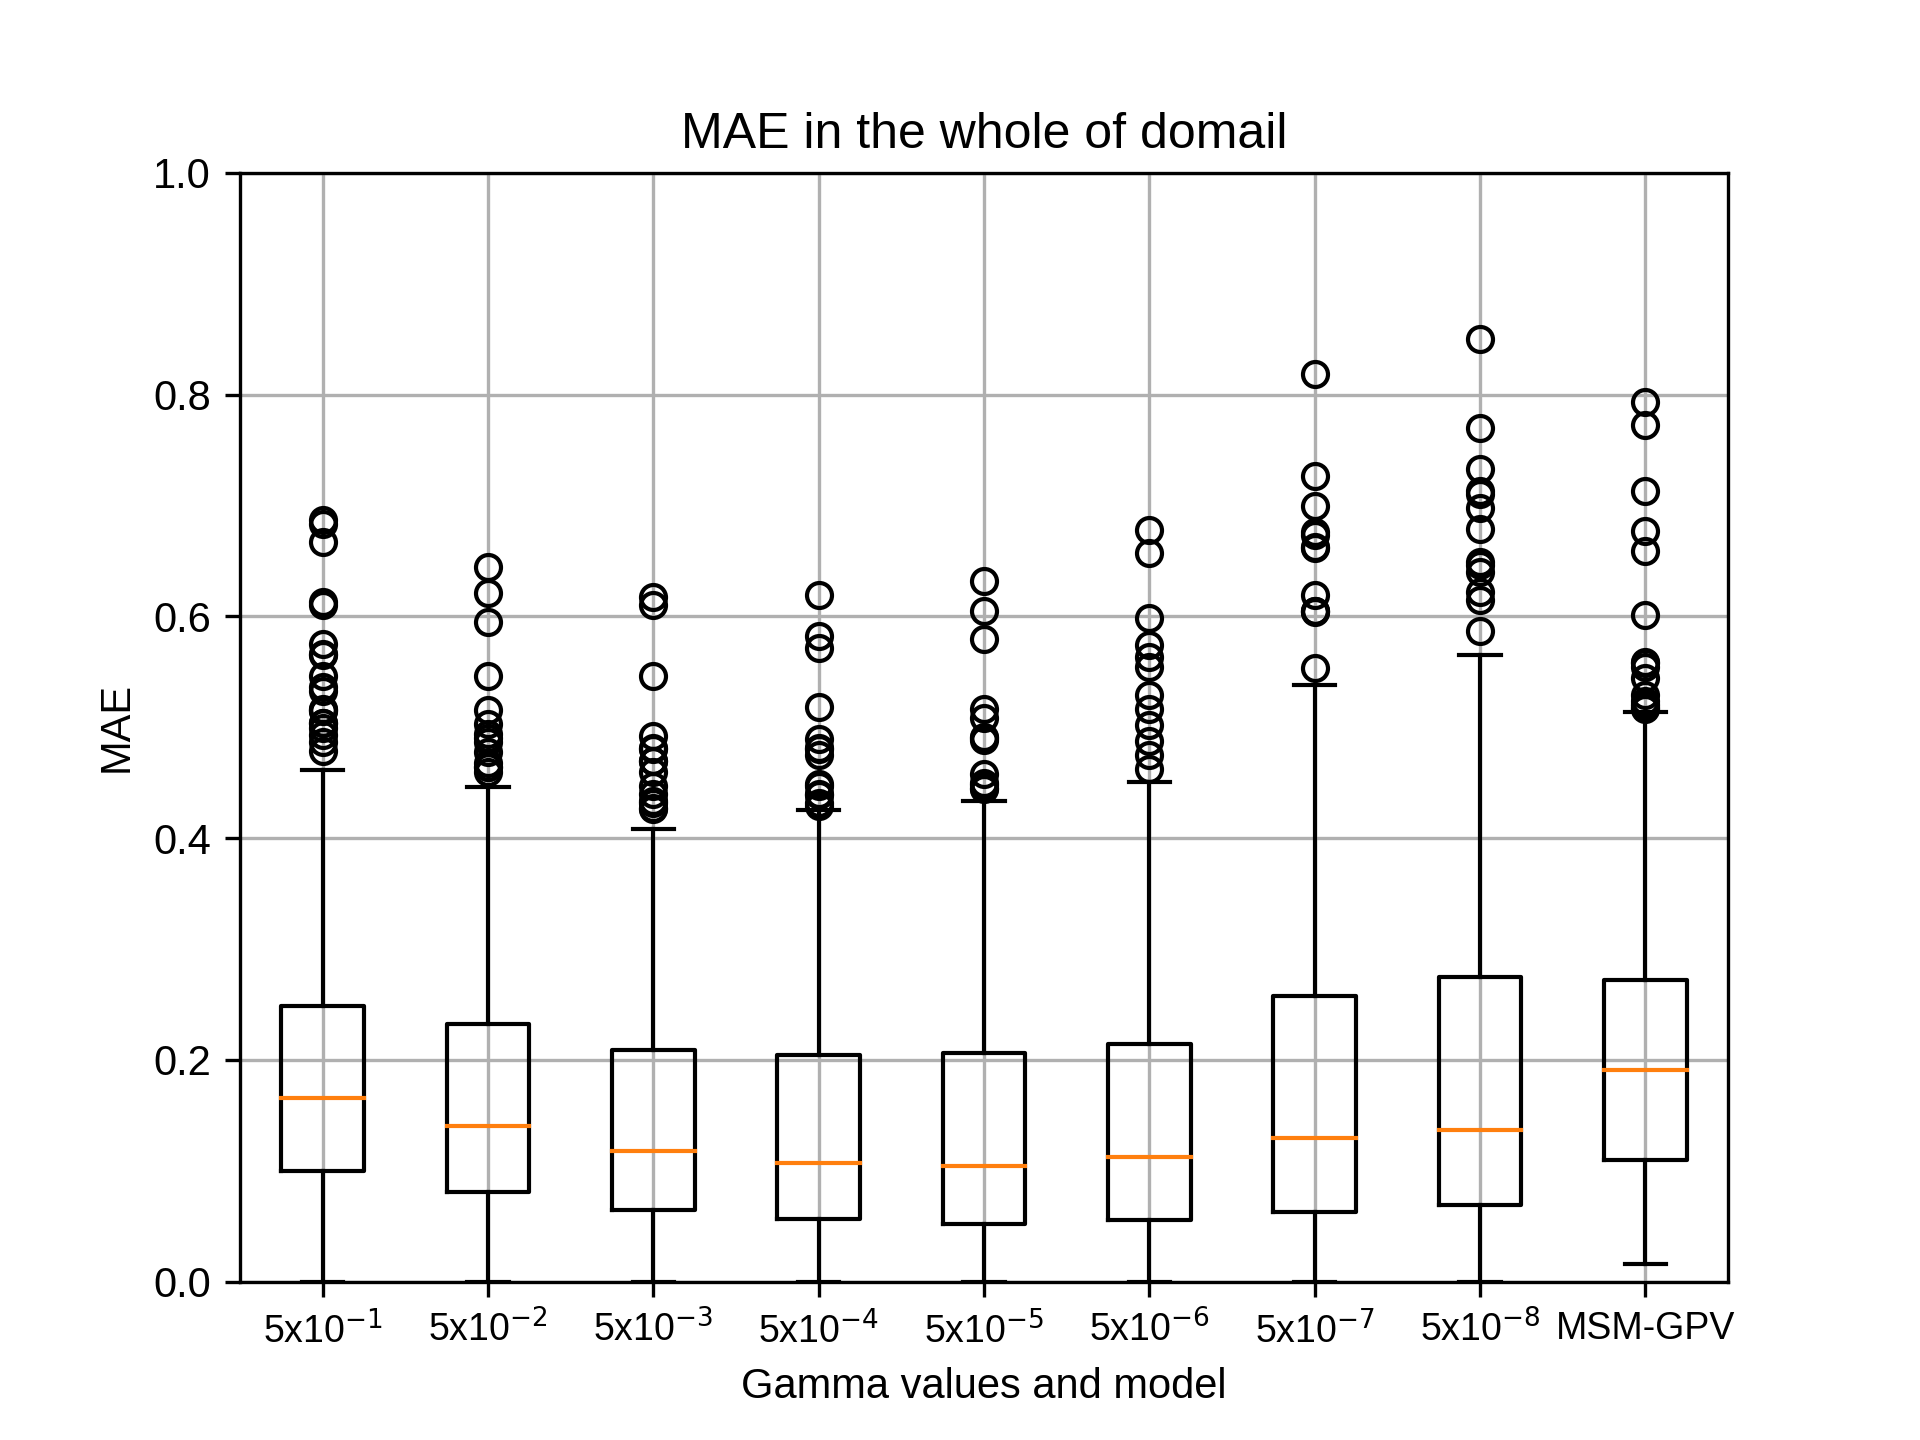
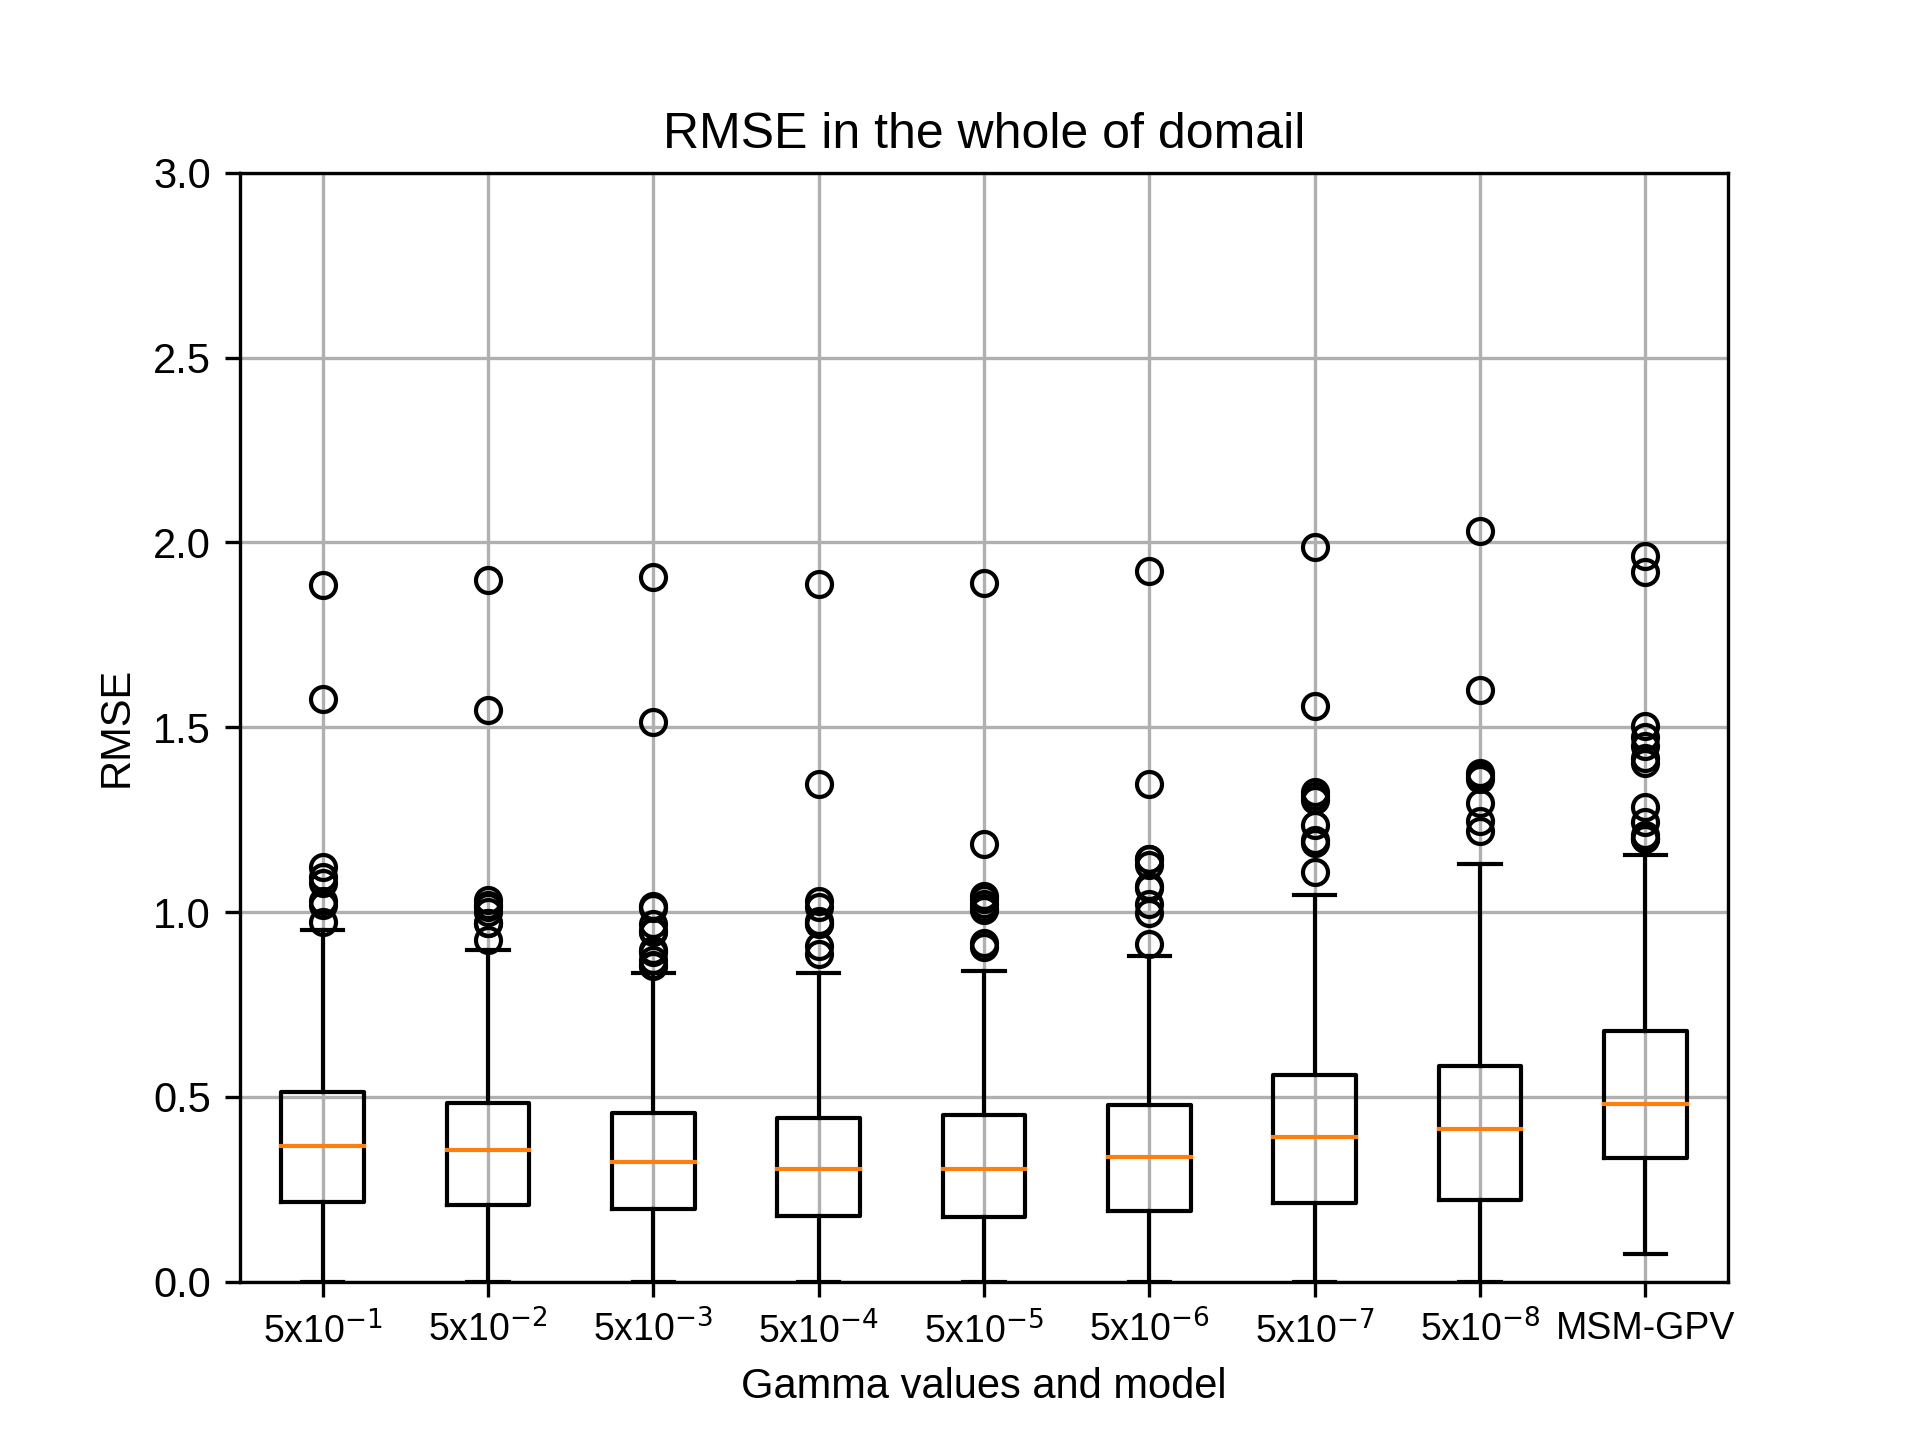
1月のsiteB,rg2=6の結果です。
kobayashi_yusukeThursday, October 22nd, 2020 at 4:13:18 PM GMT+09:00
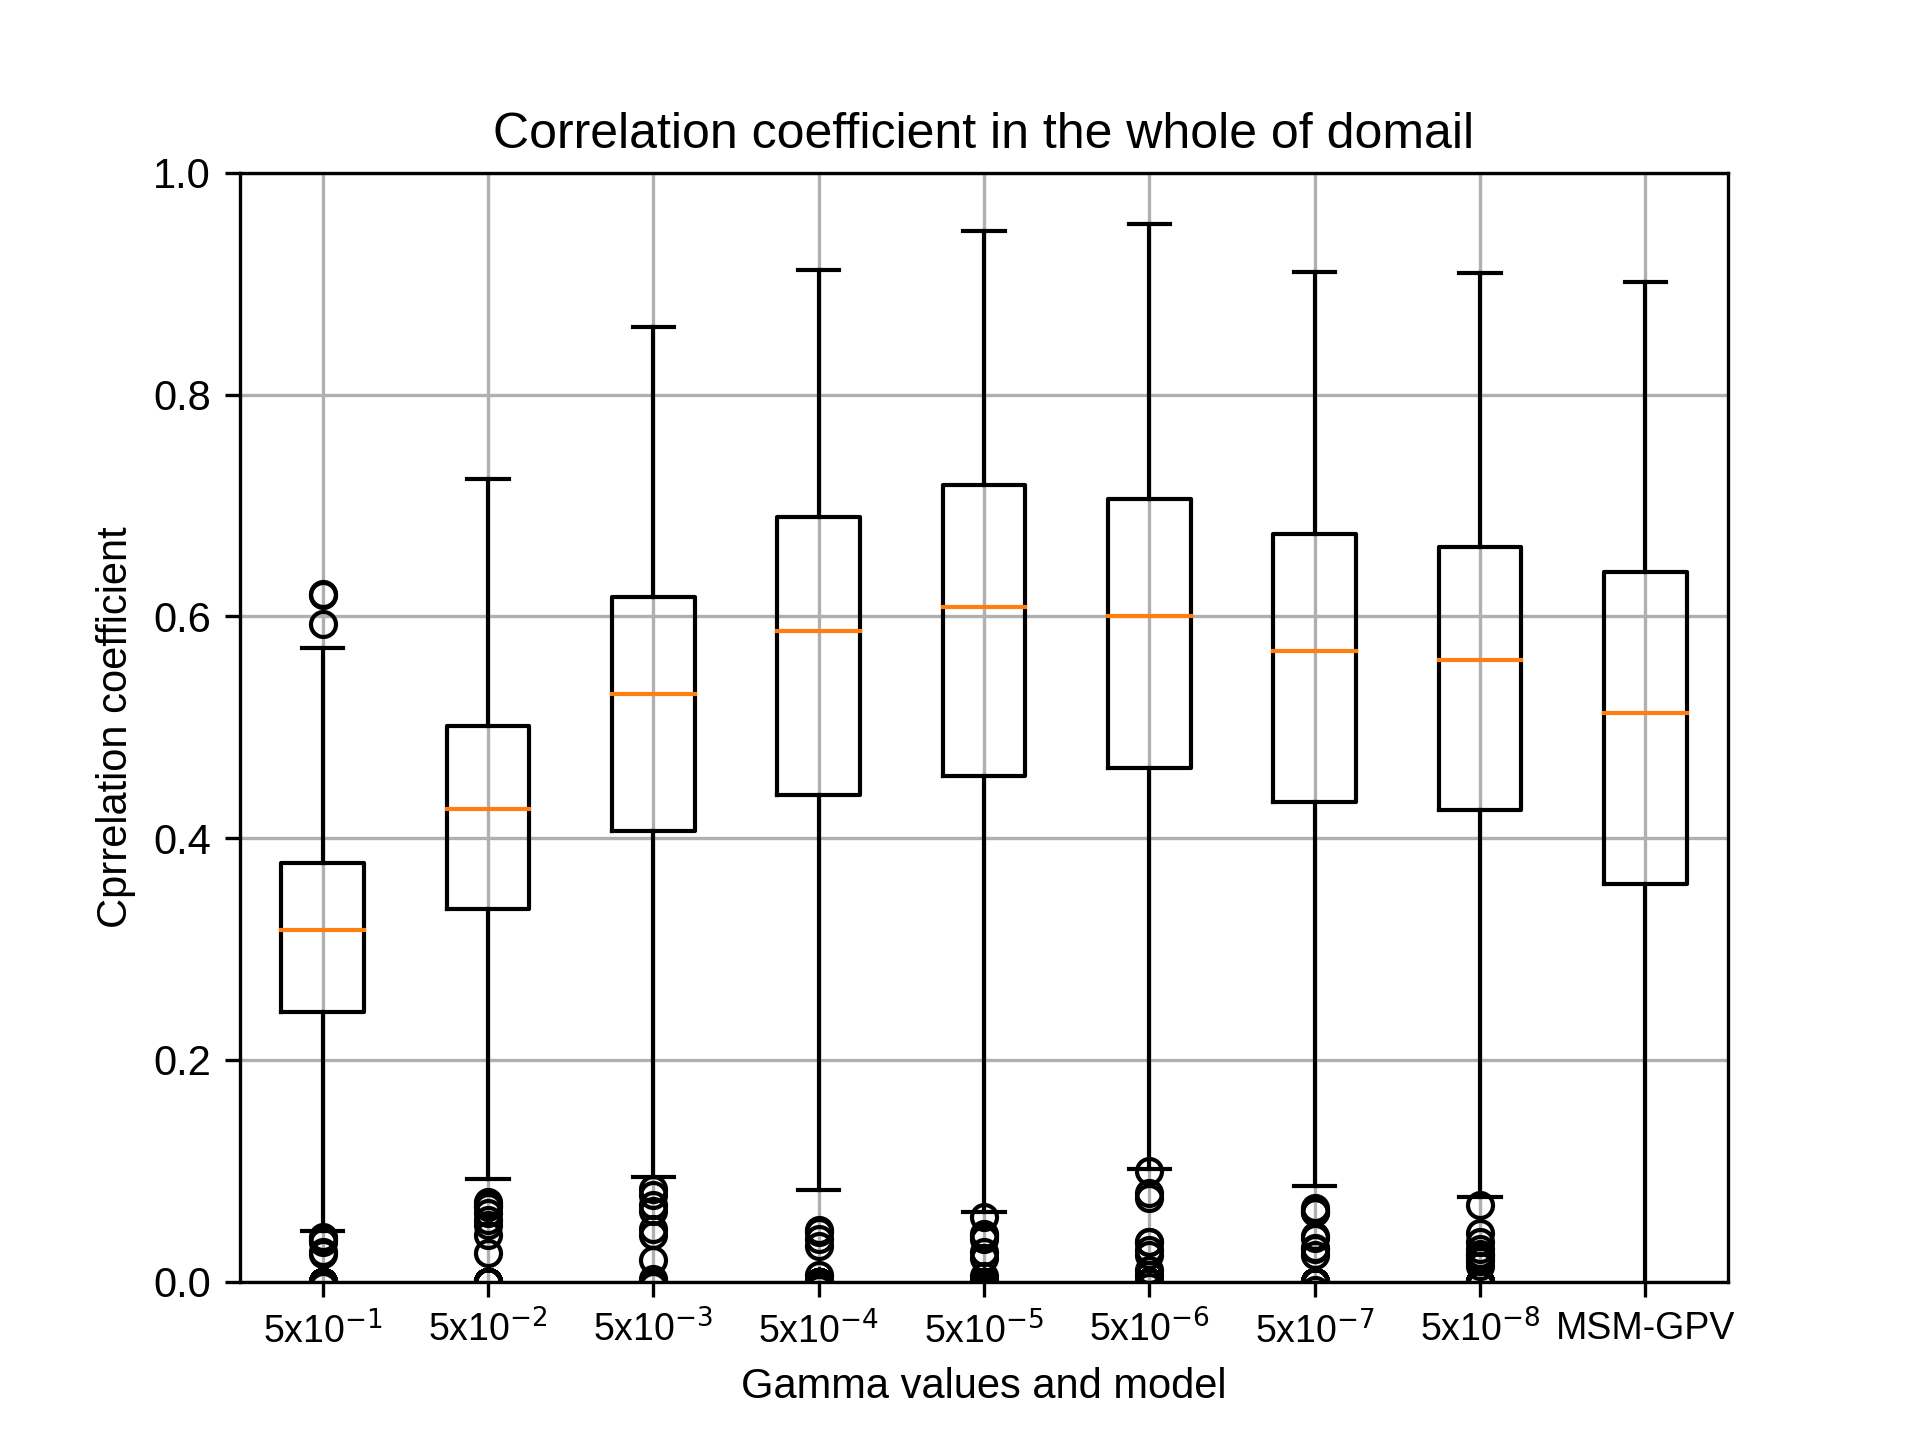
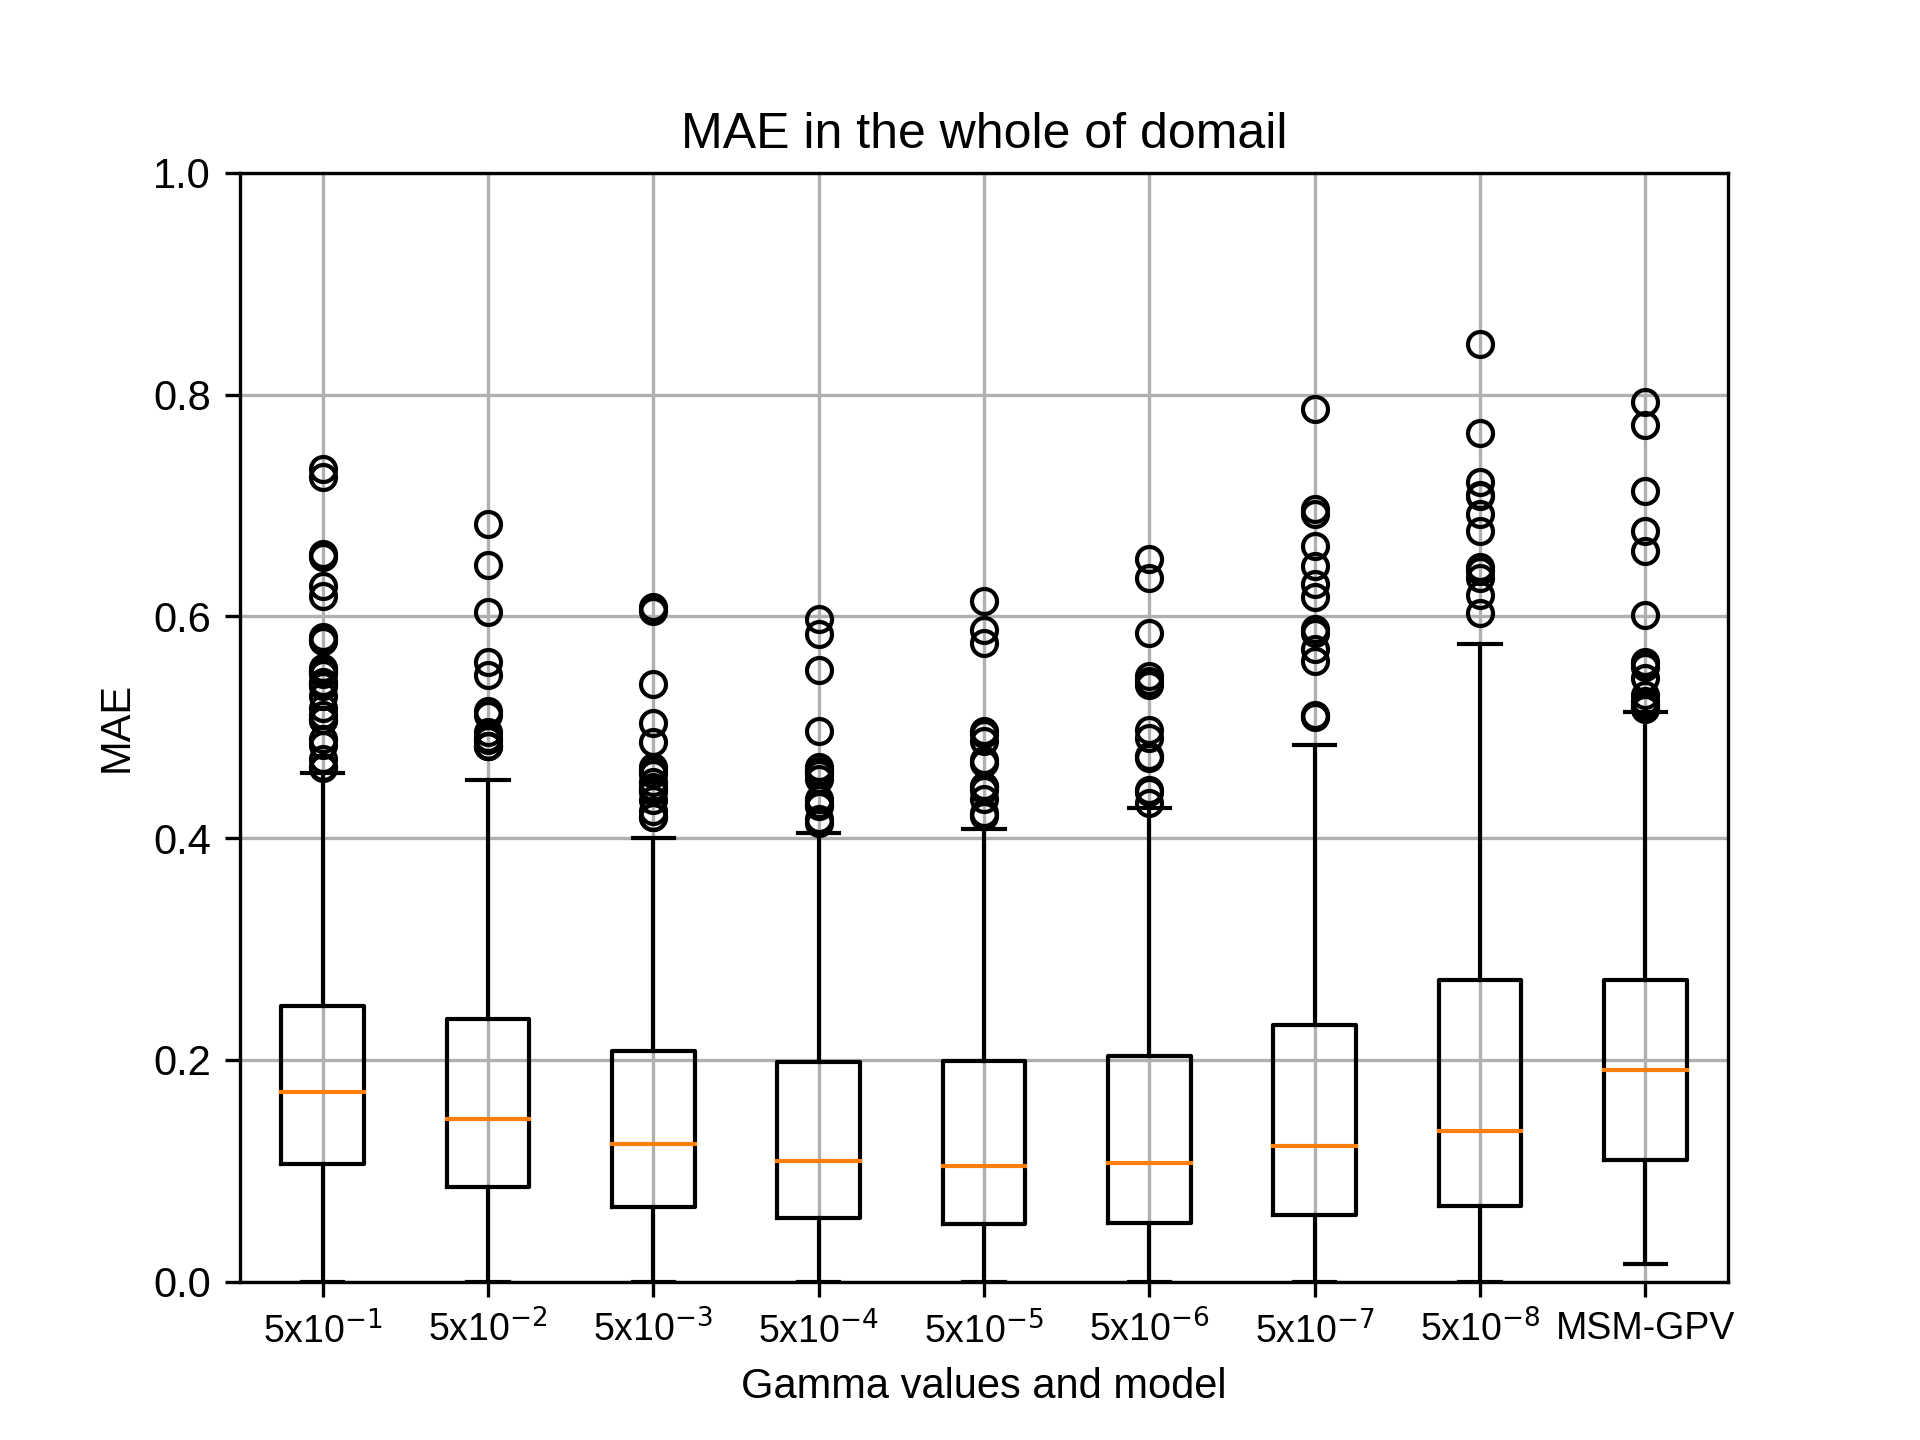
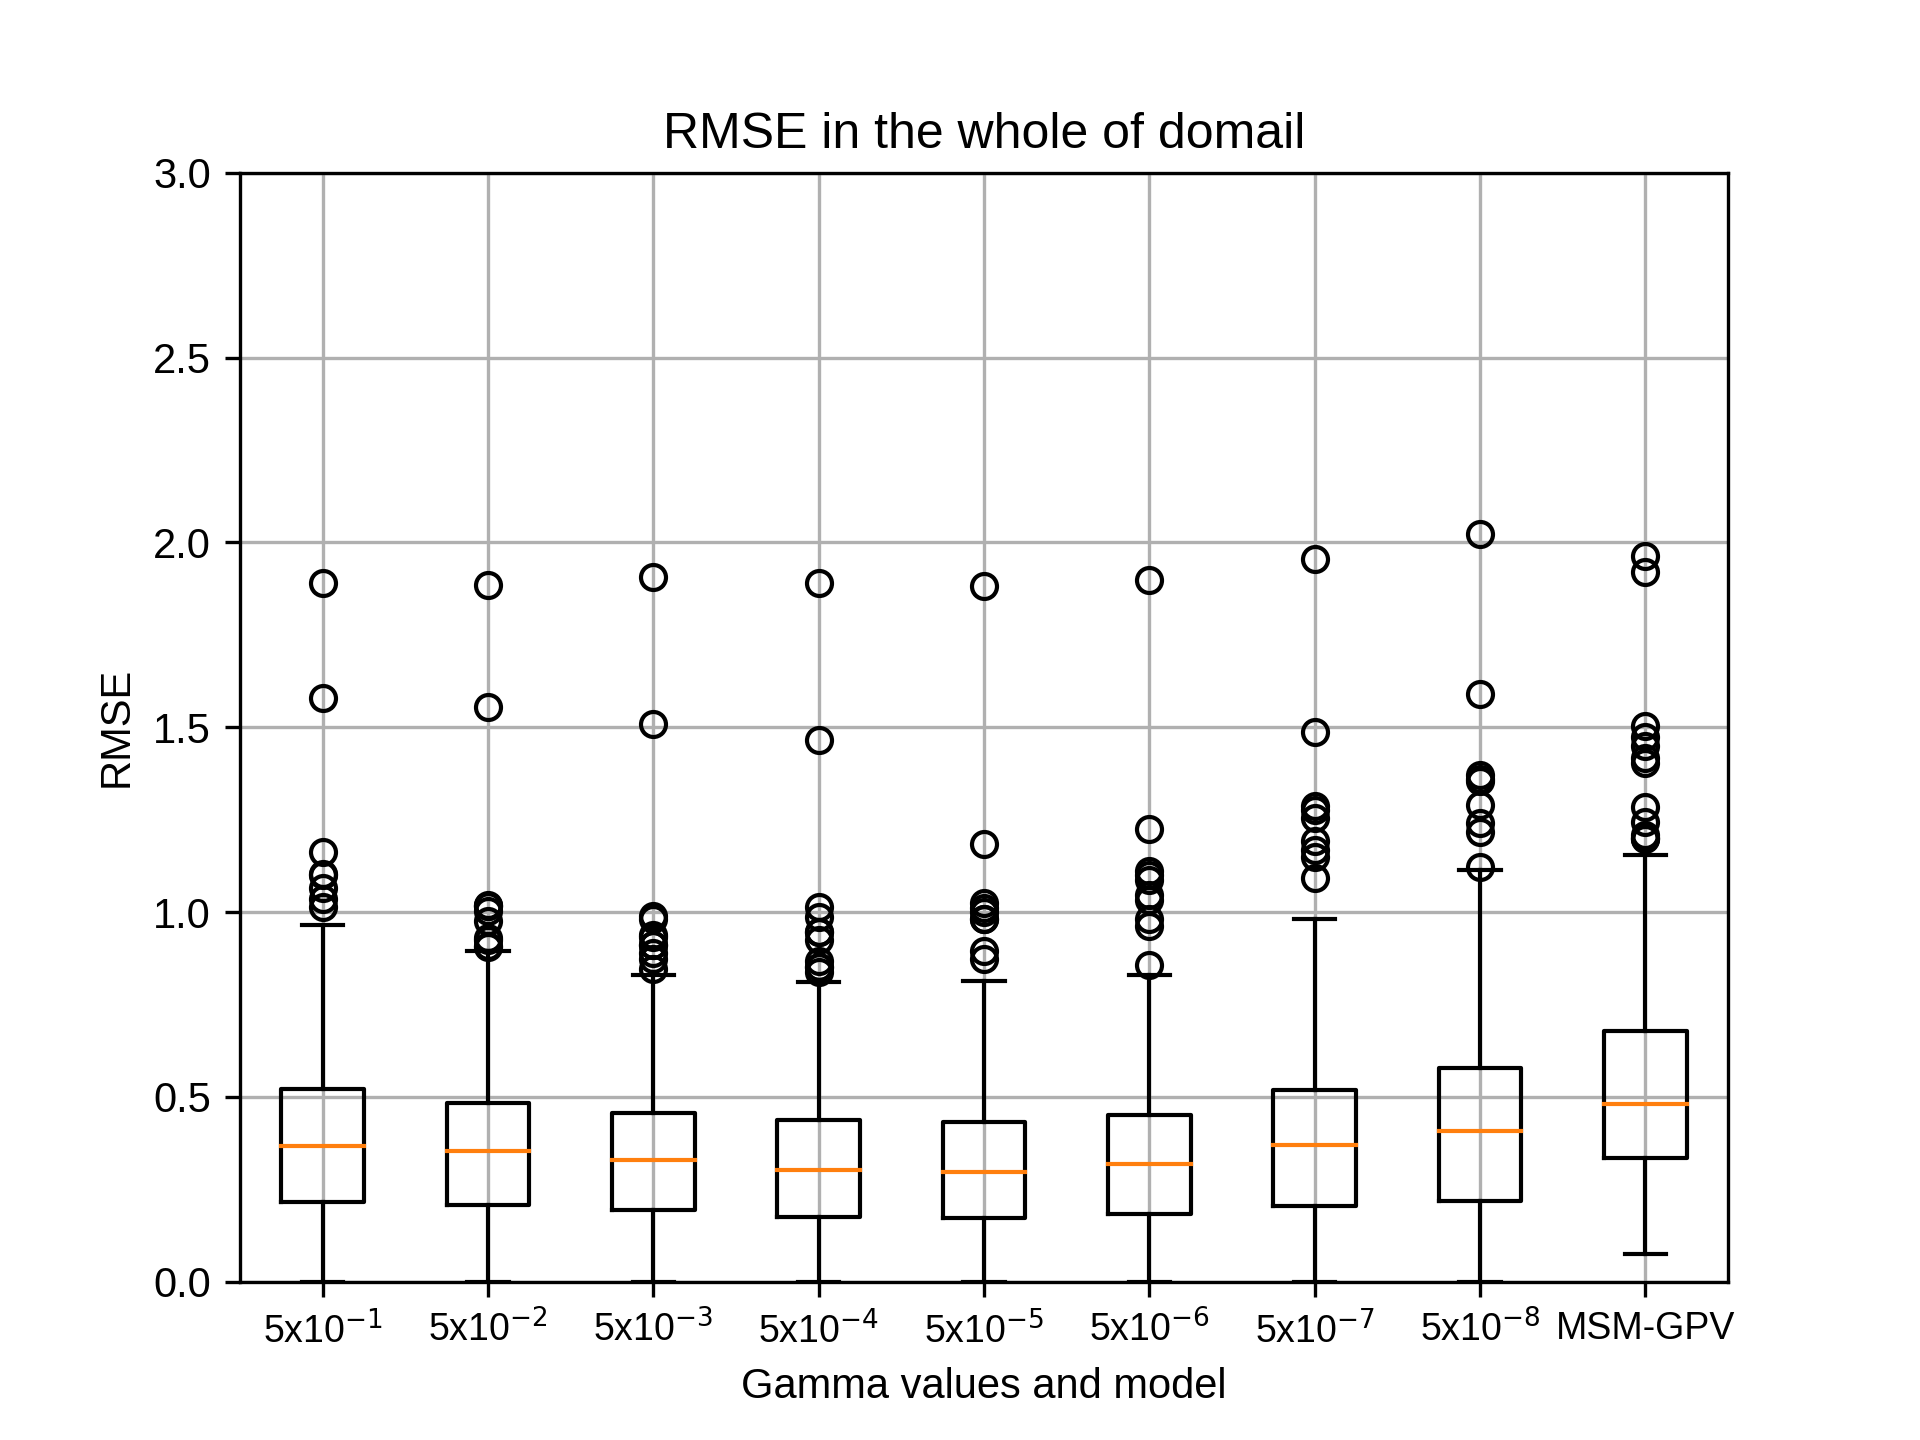
1月のsiteB,rg2=8の結果です。
kobayashi_yusukeThursday, October 22nd, 2020 at 4:13:39 PM GMT+09:00

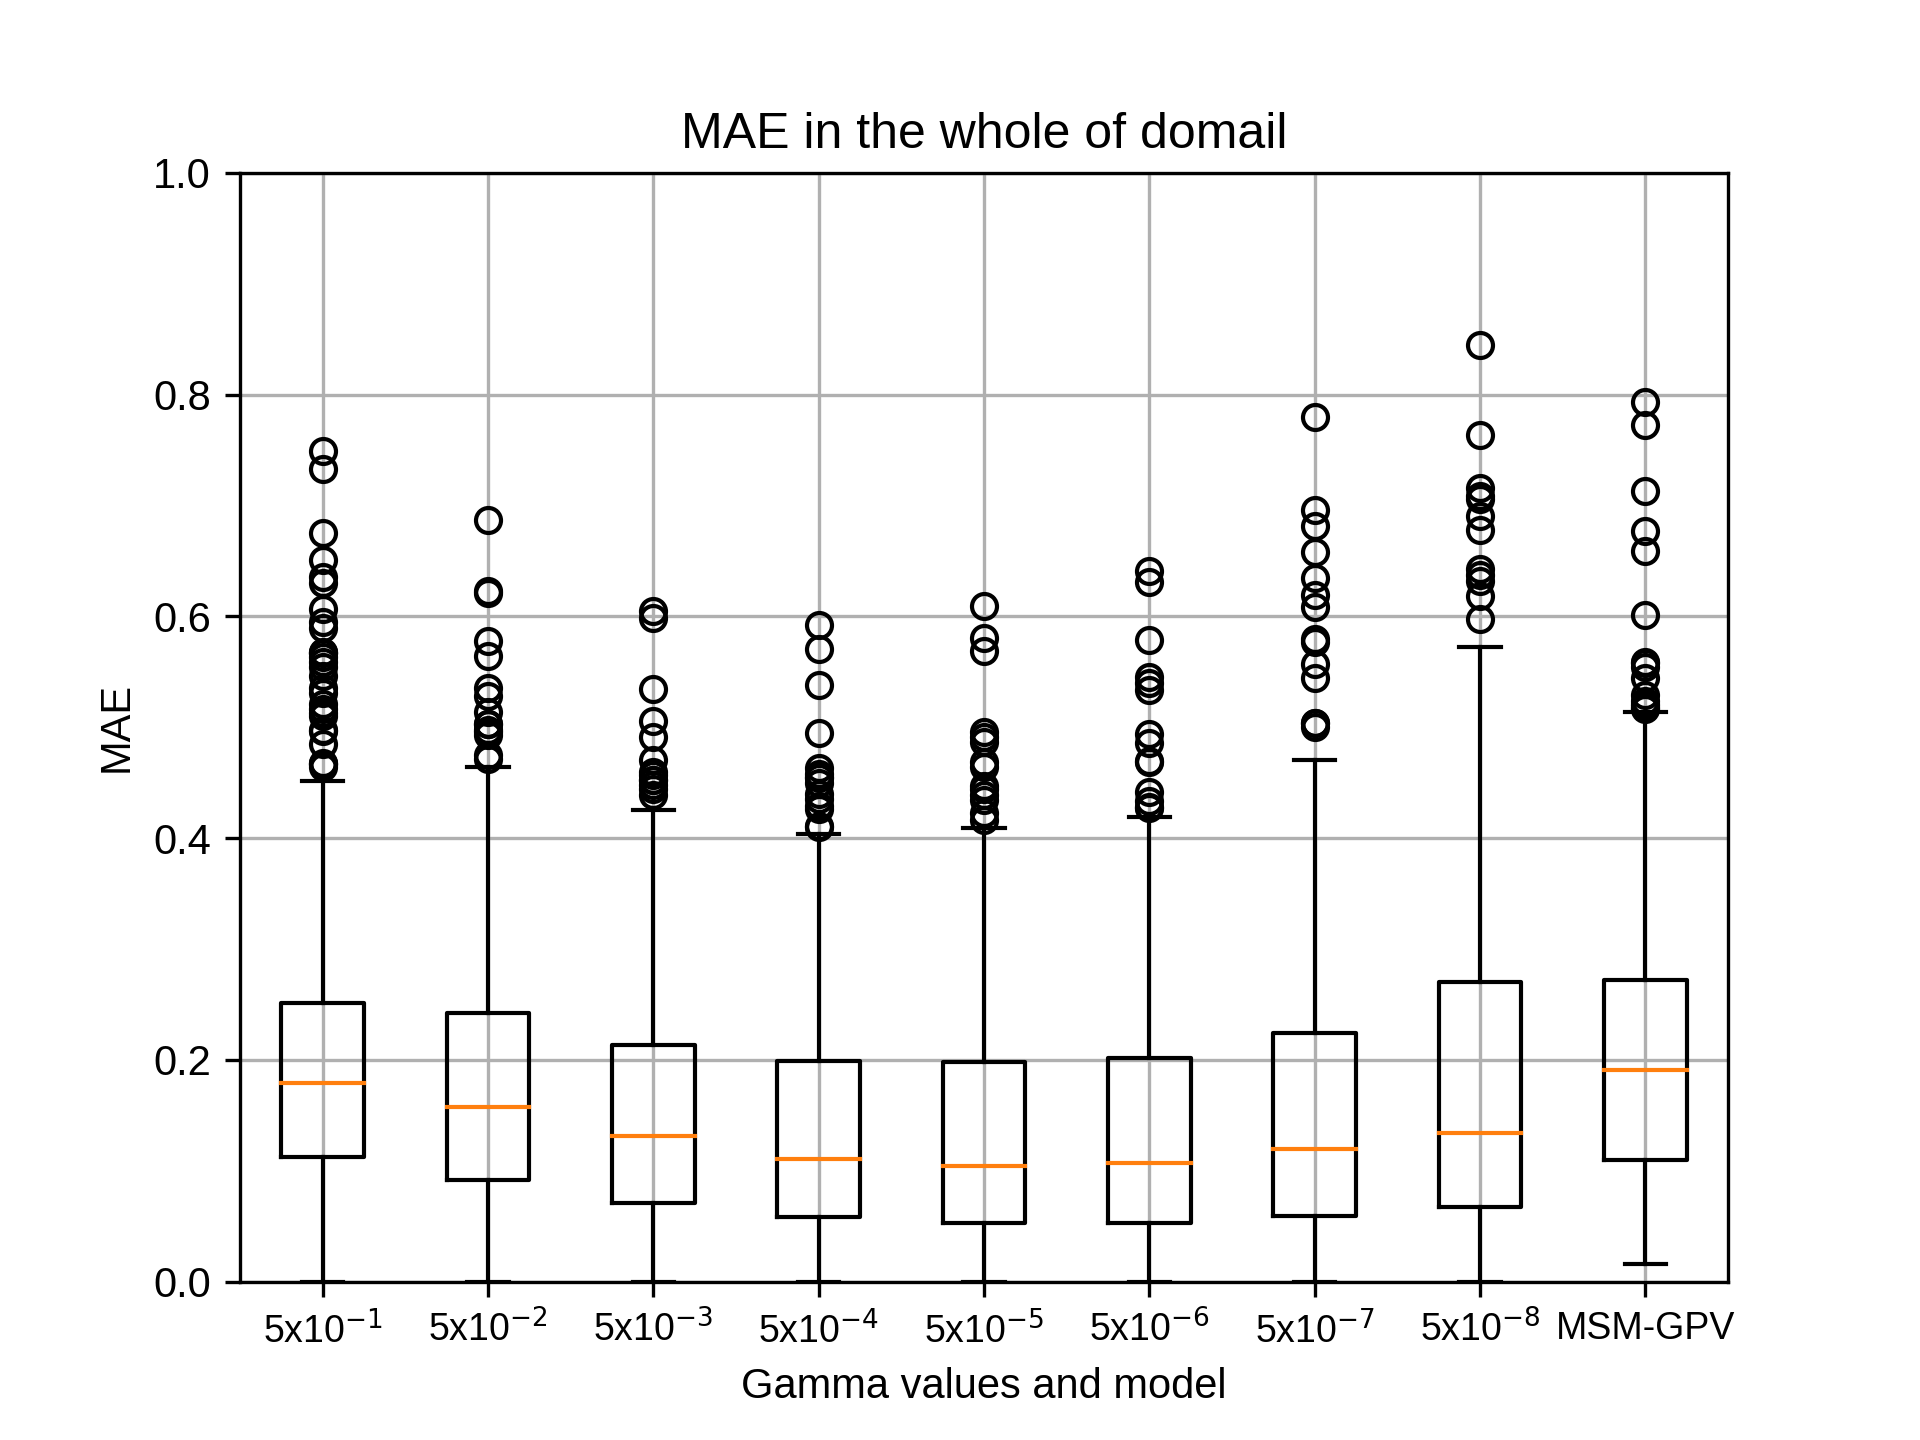

1月のsiteB,rg2=10の結果です。
kobayashi_yusukeThursday, October 22nd, 2020 at 4:14:00 PM GMT+09:00
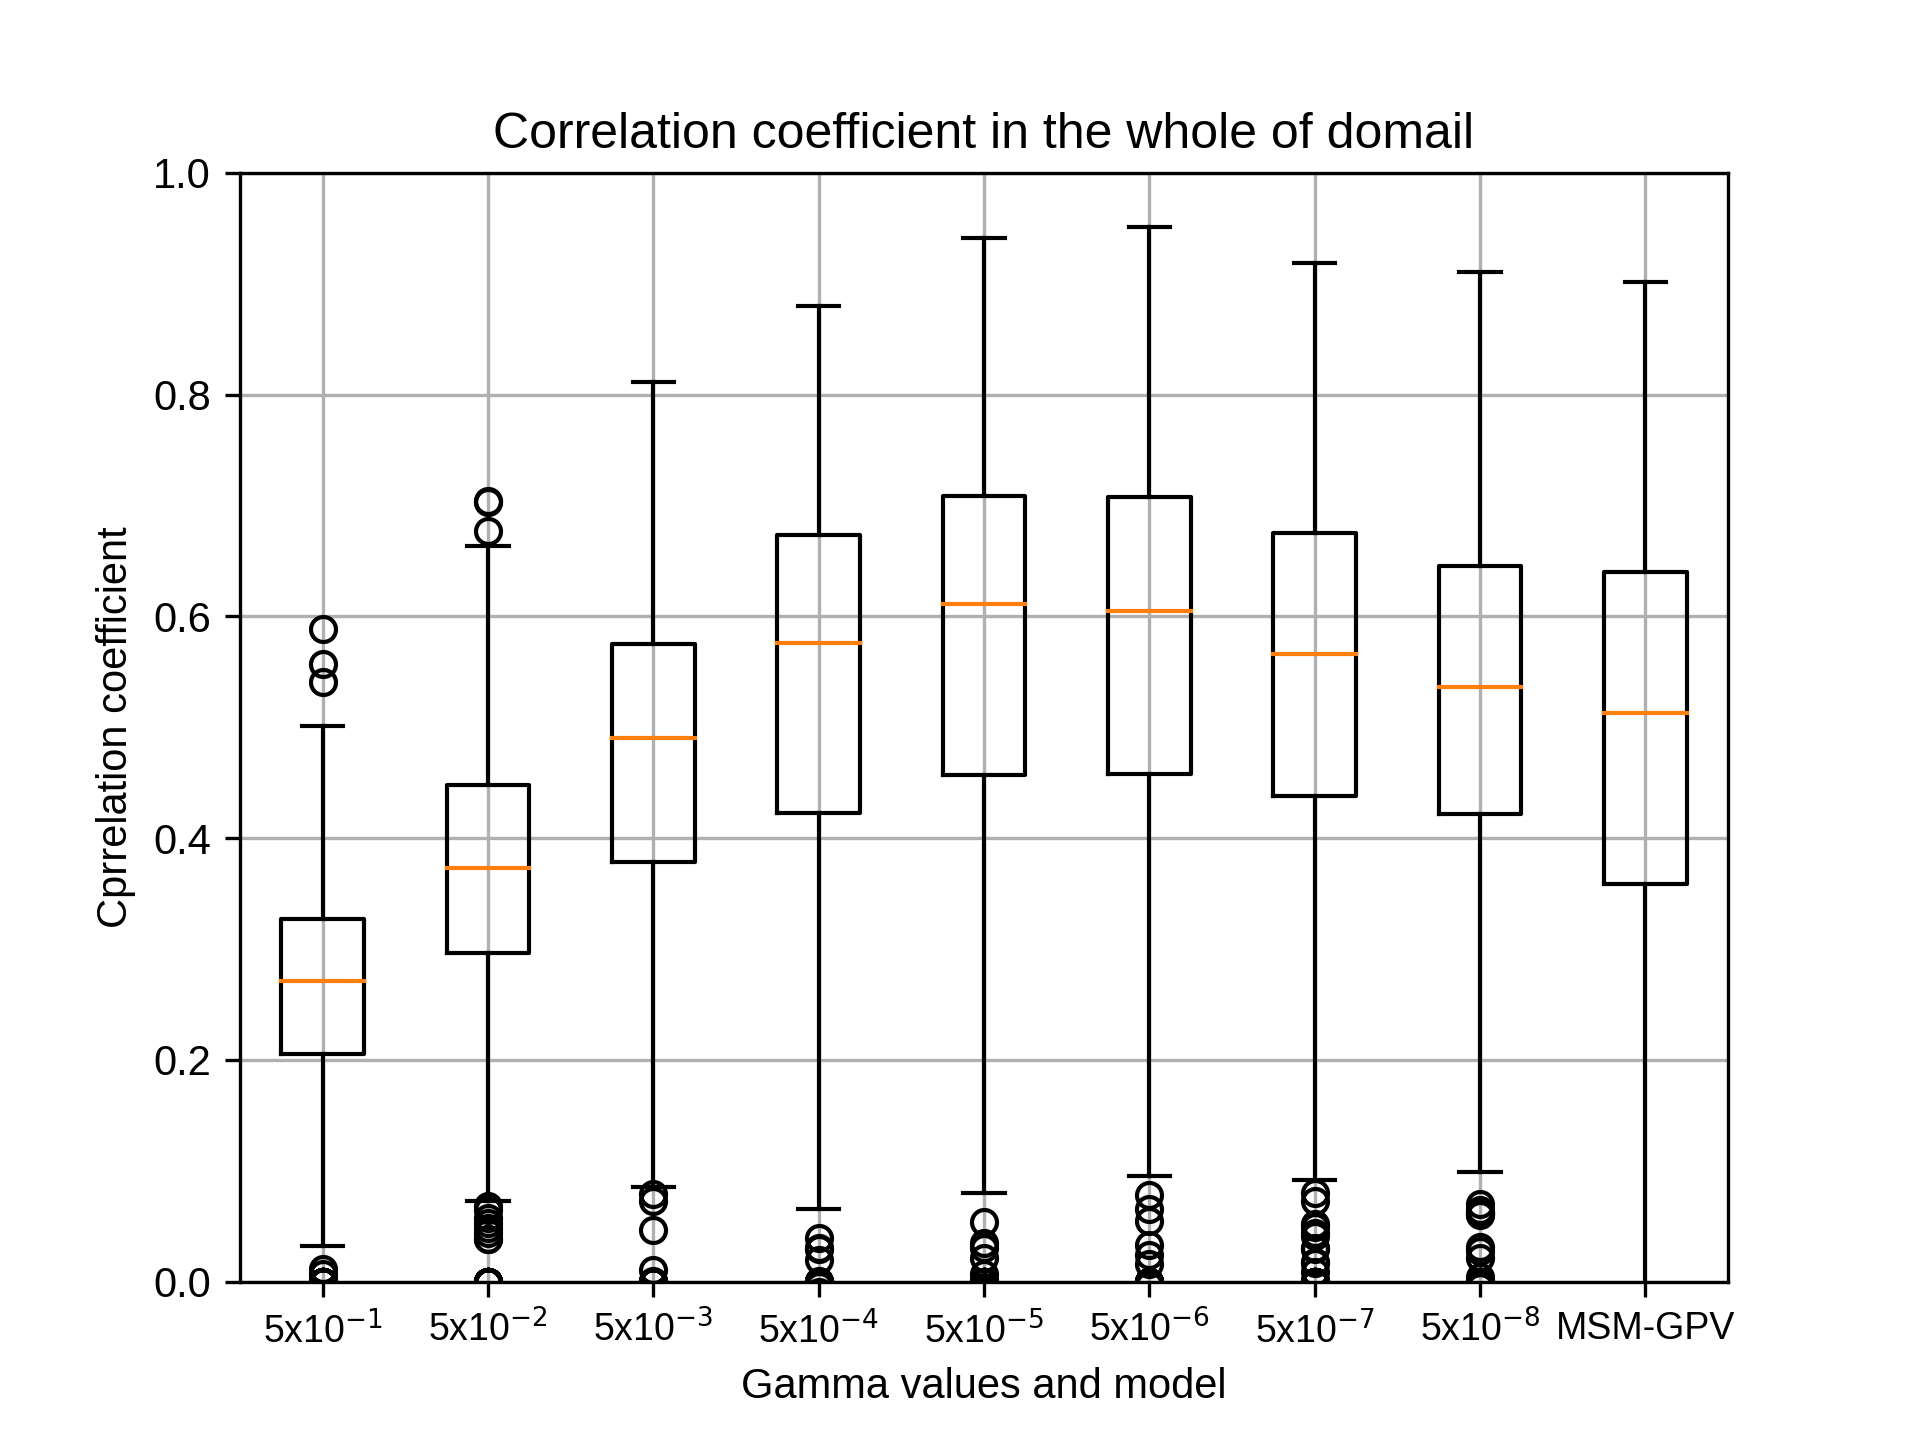


1月のsiteB,rg2=12の結果です。
1月のsiteBではrg2=12でgammaが5x10⁻⁵のとき、相関係数の中央値が最も高くなりました。
1月のsiteBではrg2=12でgammaが5x10⁻⁵のとき、相関係数の中央値が最も高くなりました。
kobayashi_yusukeThursday, October 22nd, 2020 at 4:14:17 PM GMT+09:00
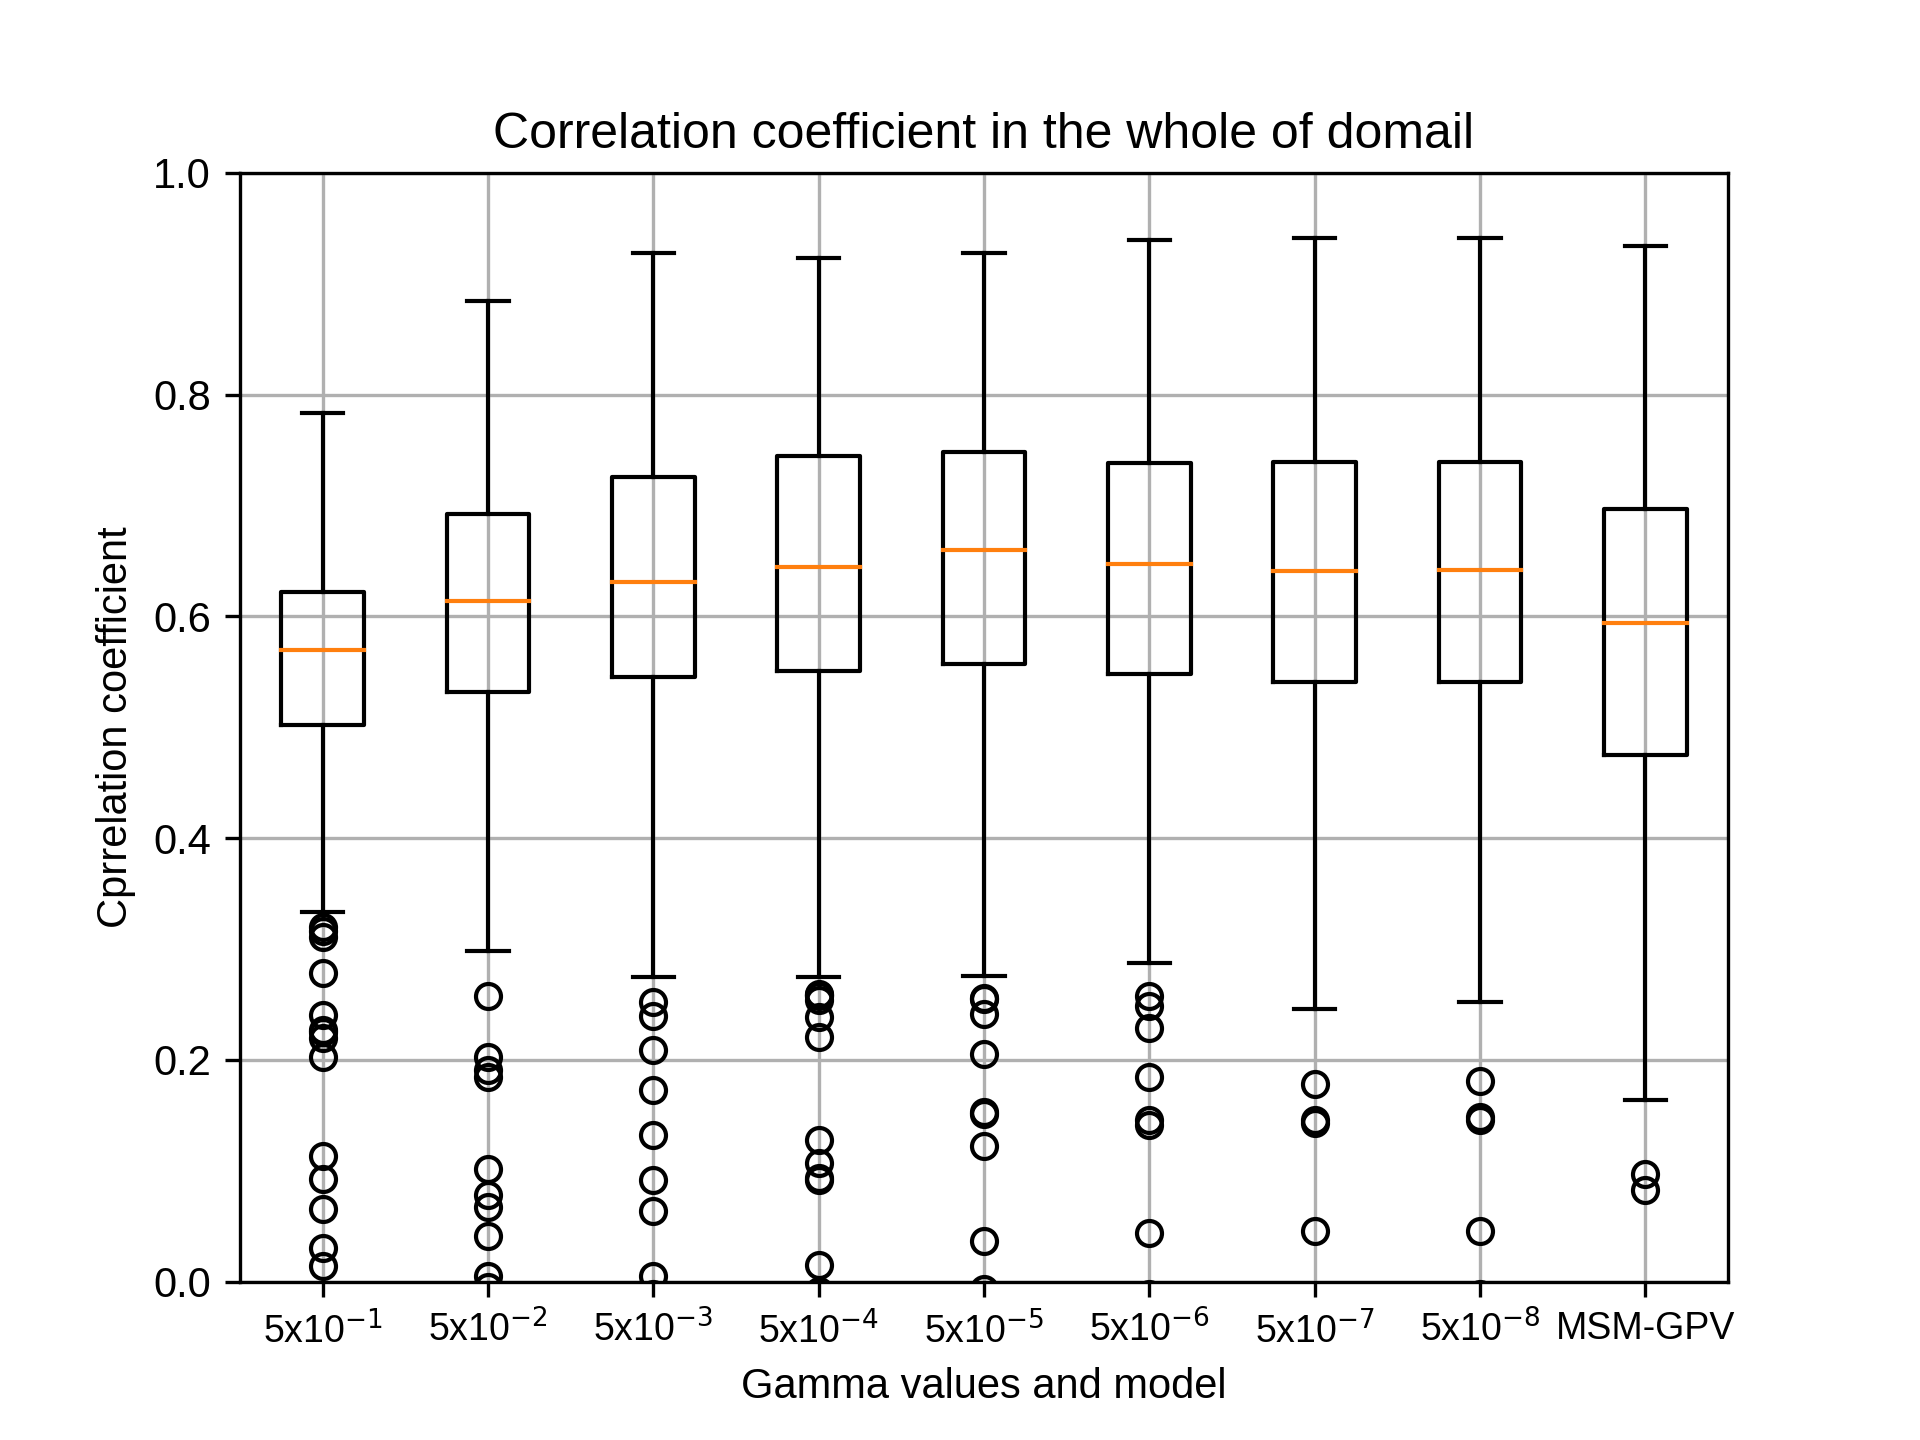
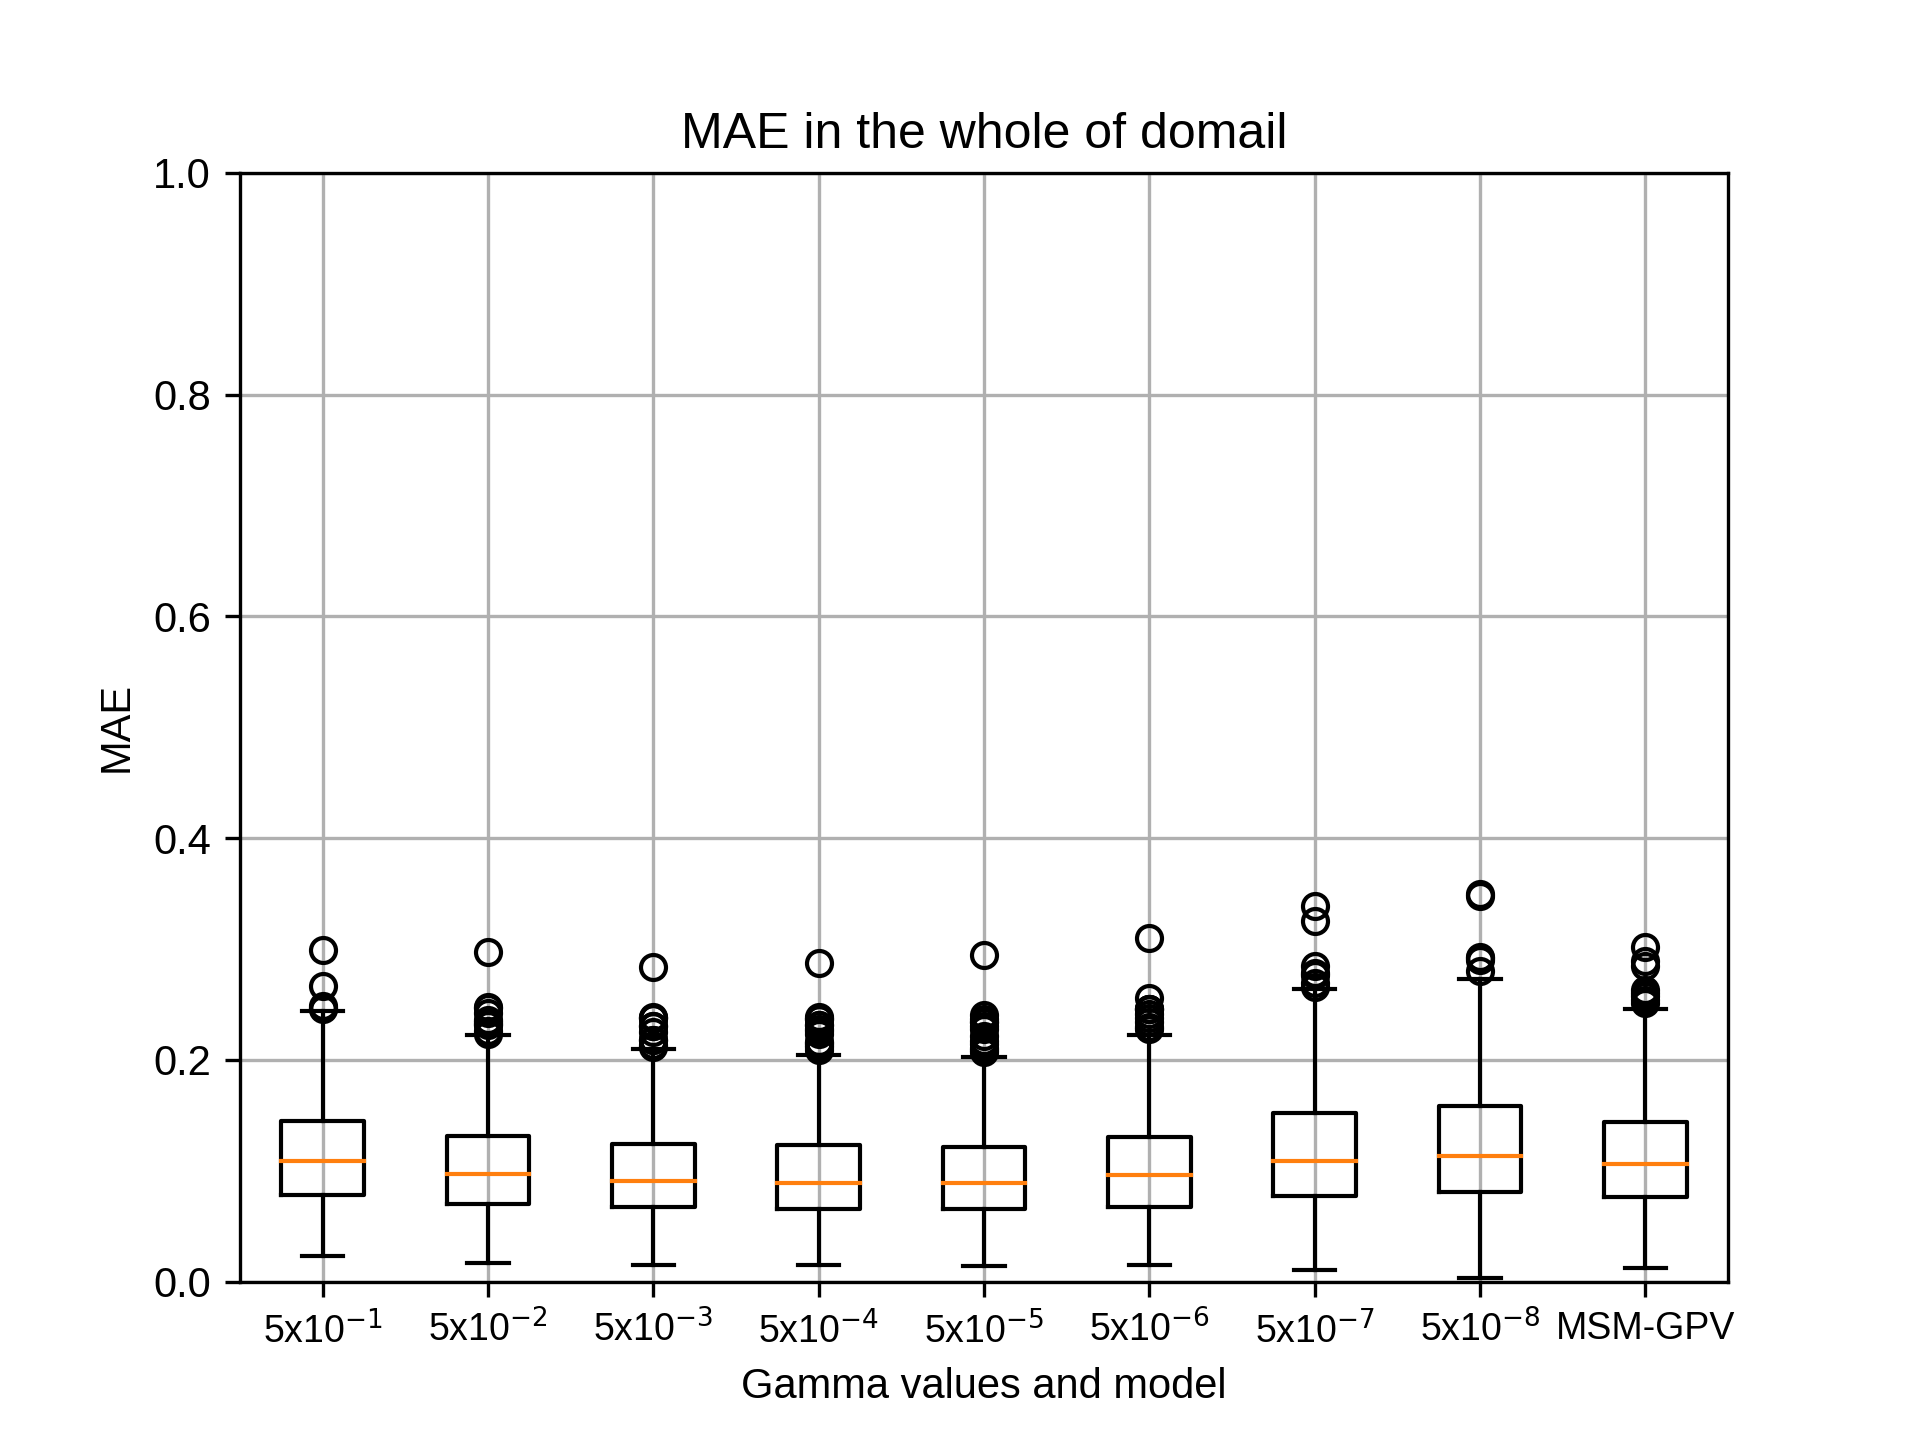

1月のsiteC,rg2=4の結果です。
kobayashi_yusukeThursday, October 22nd, 2020 at 4:14:35 PM GMT+09:00
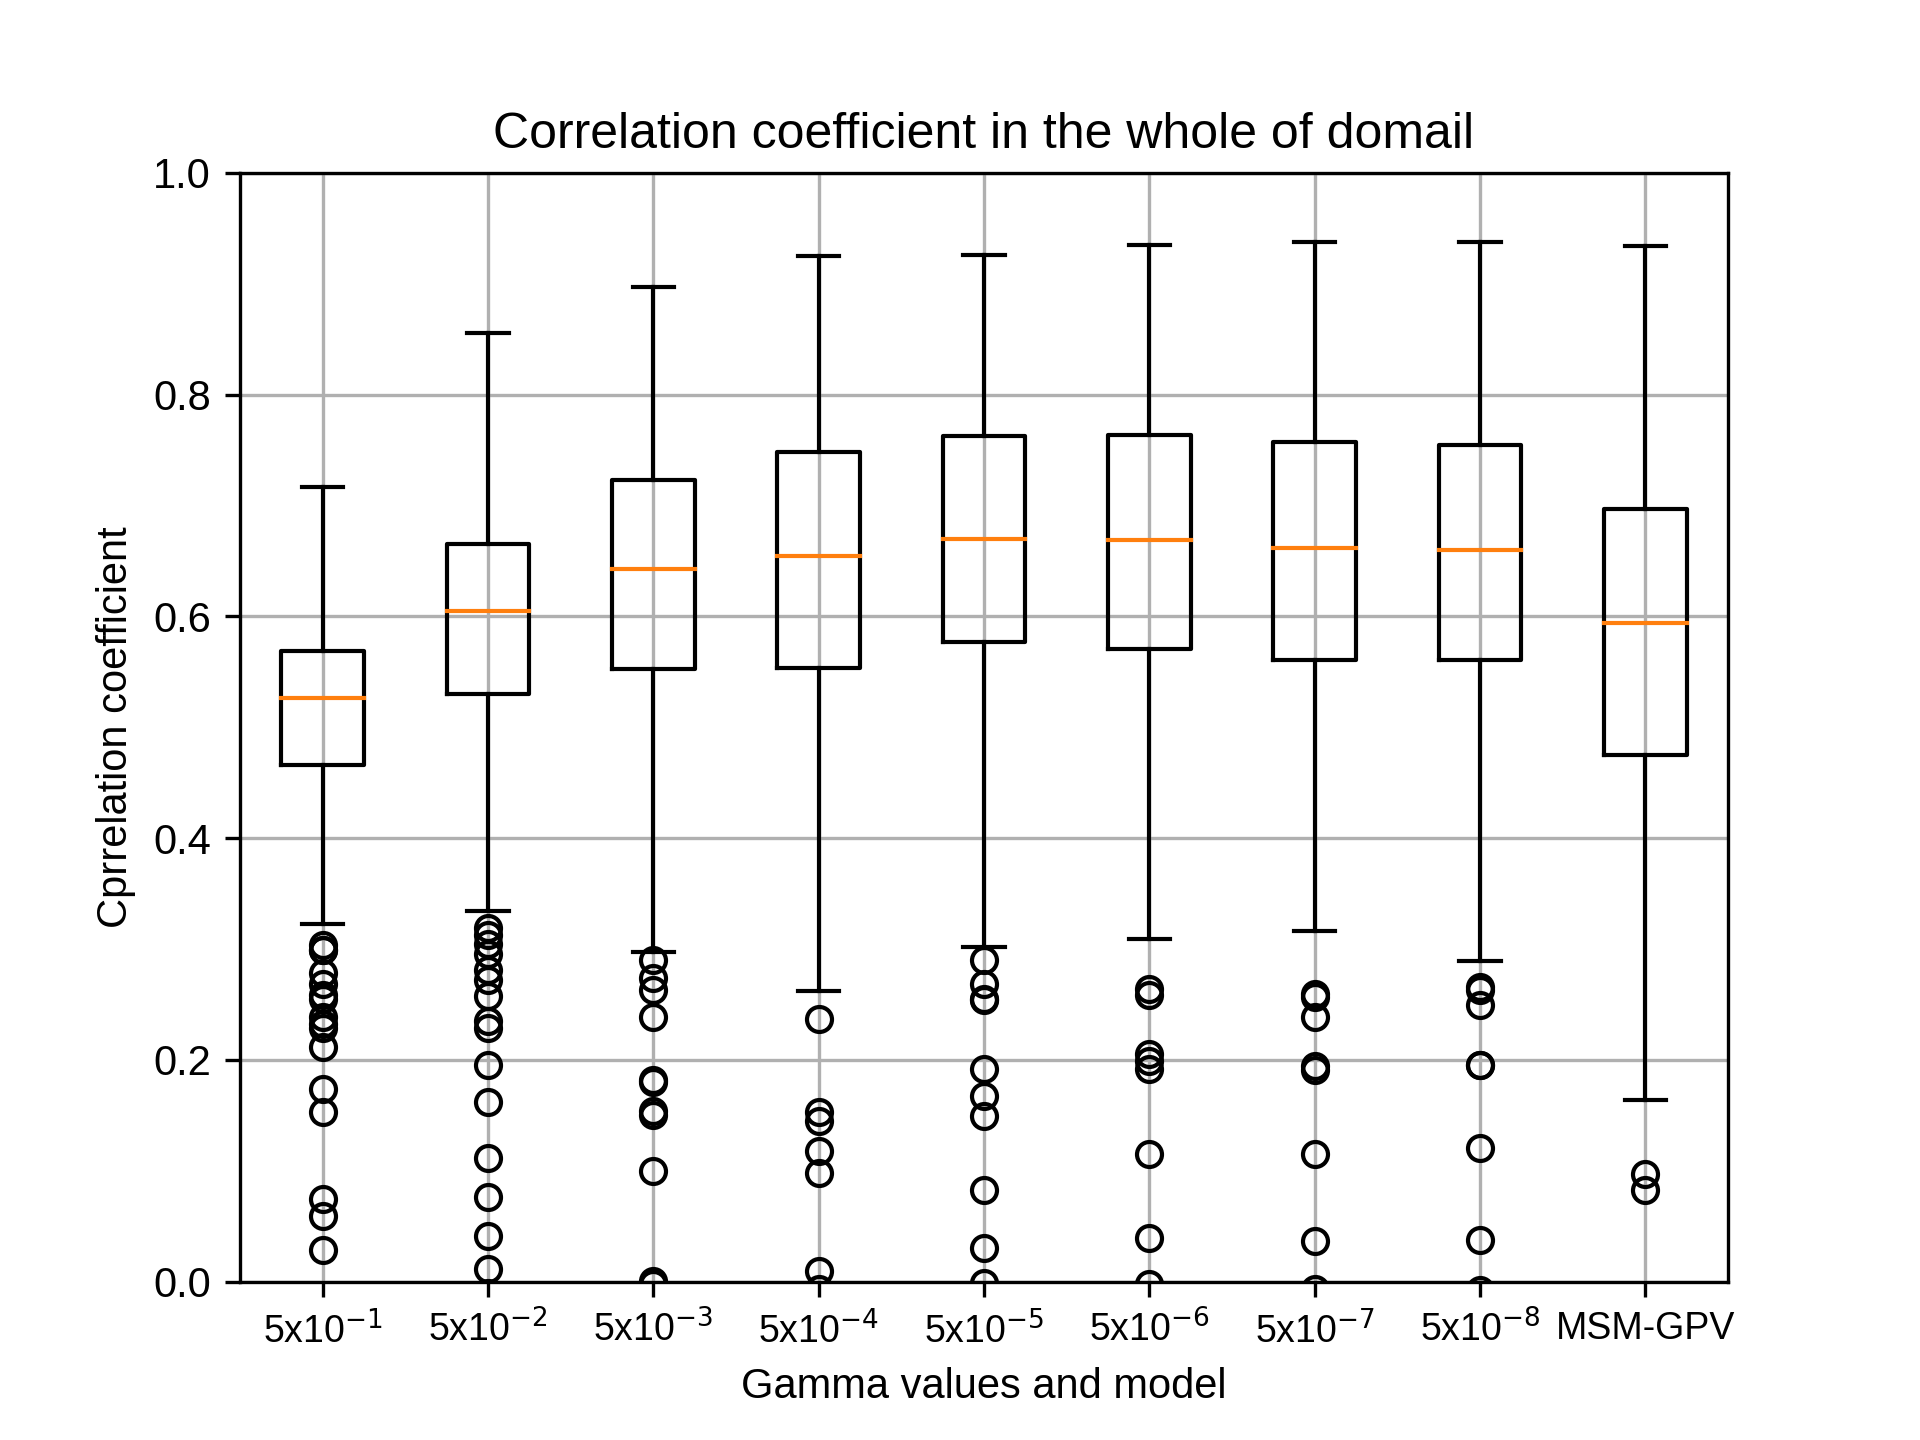
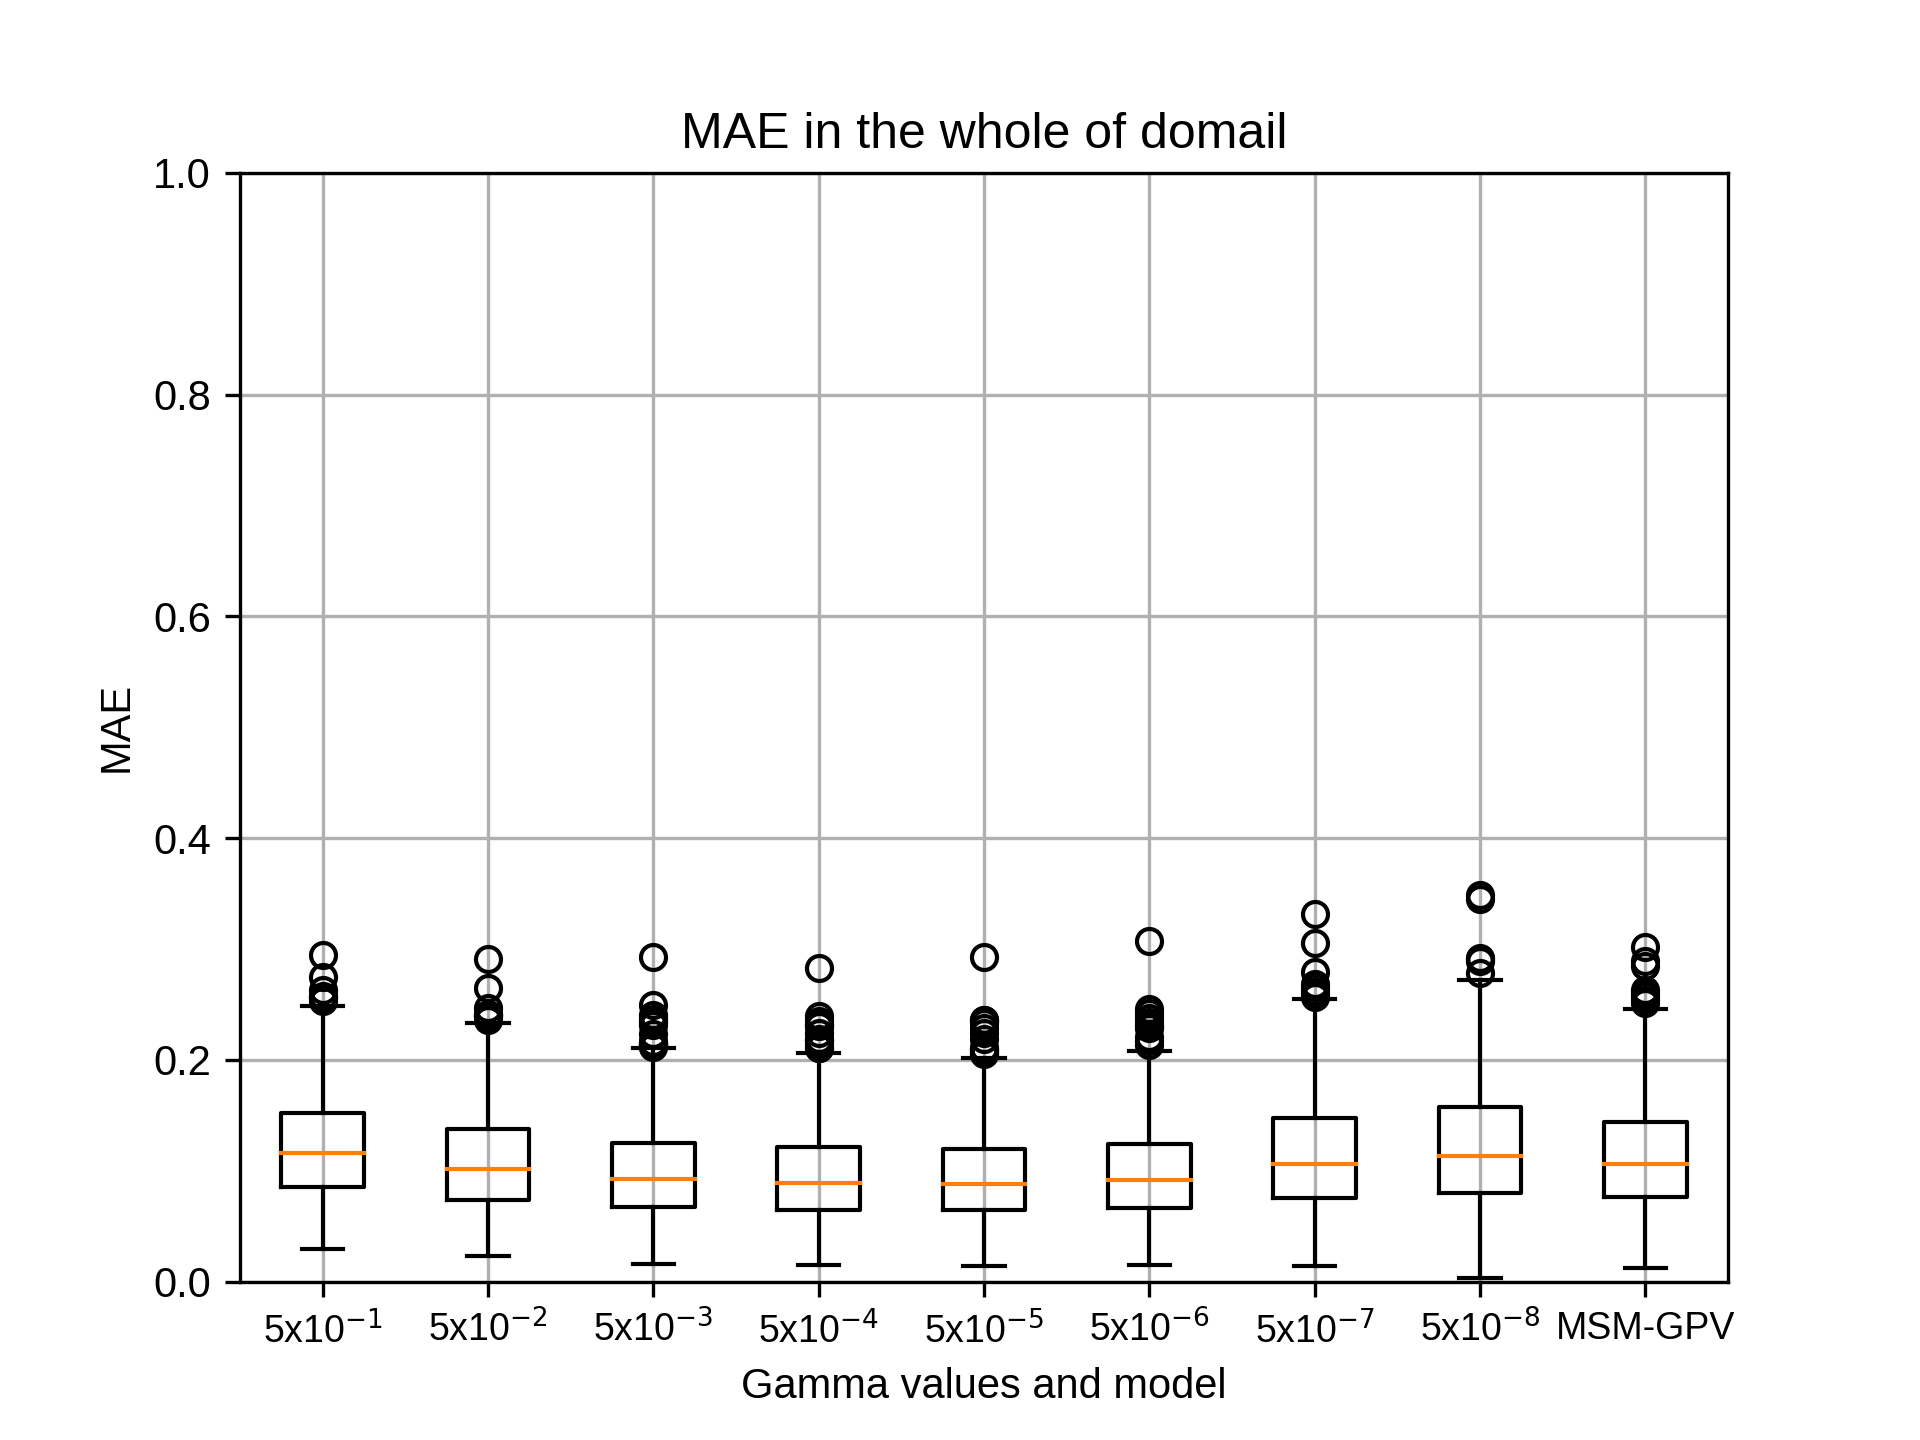
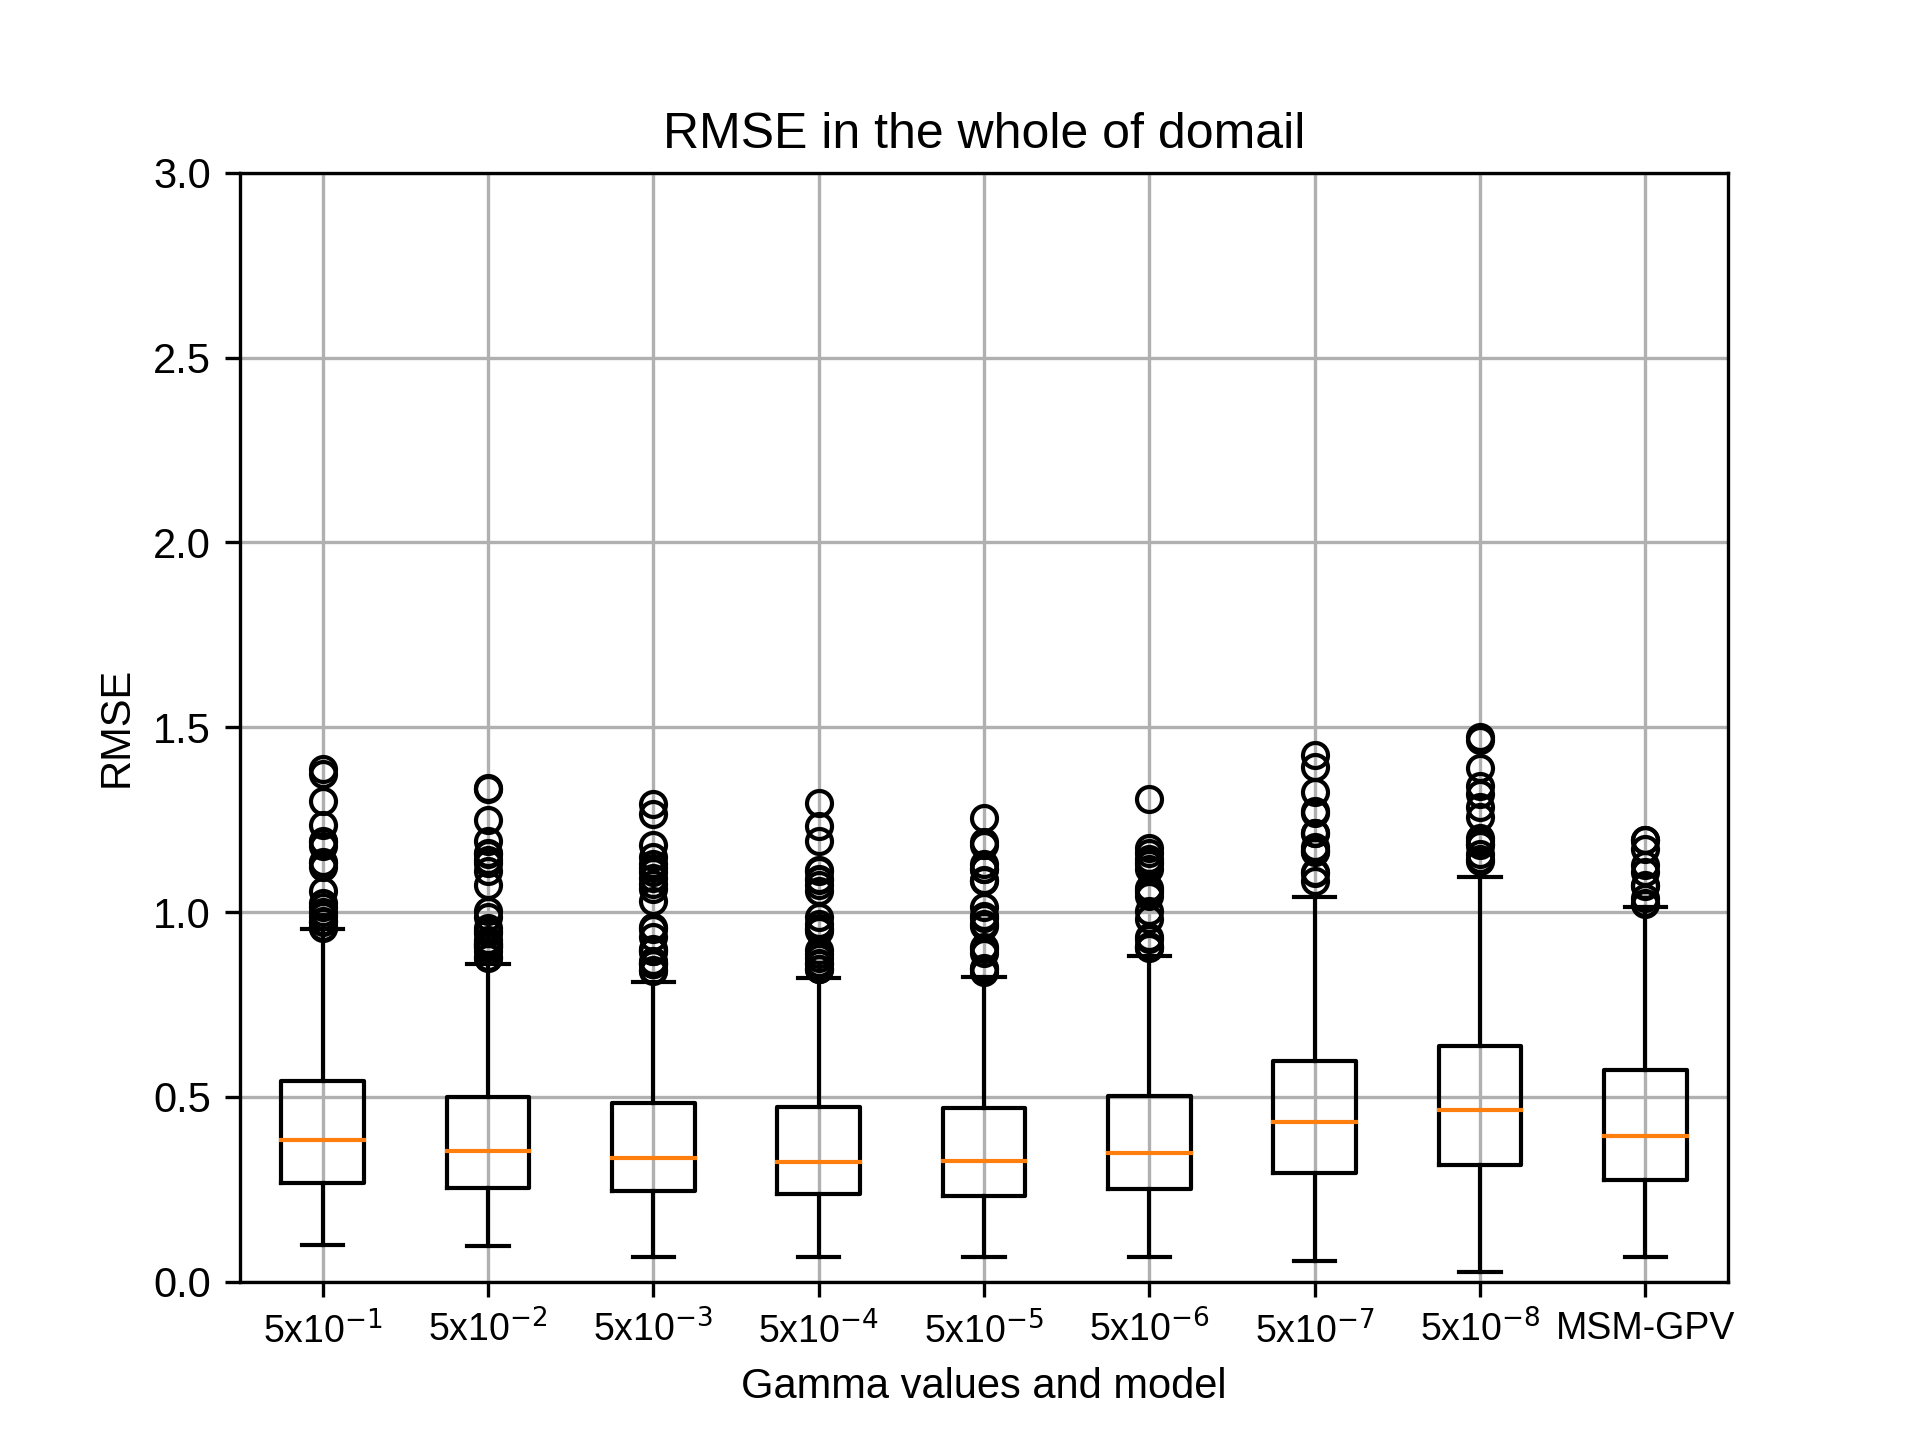
1月のsiteC,rg2=6の結果です。
kobayashi_yusukeThursday, October 22nd, 2020 at 4:14:51 PM GMT+09:00
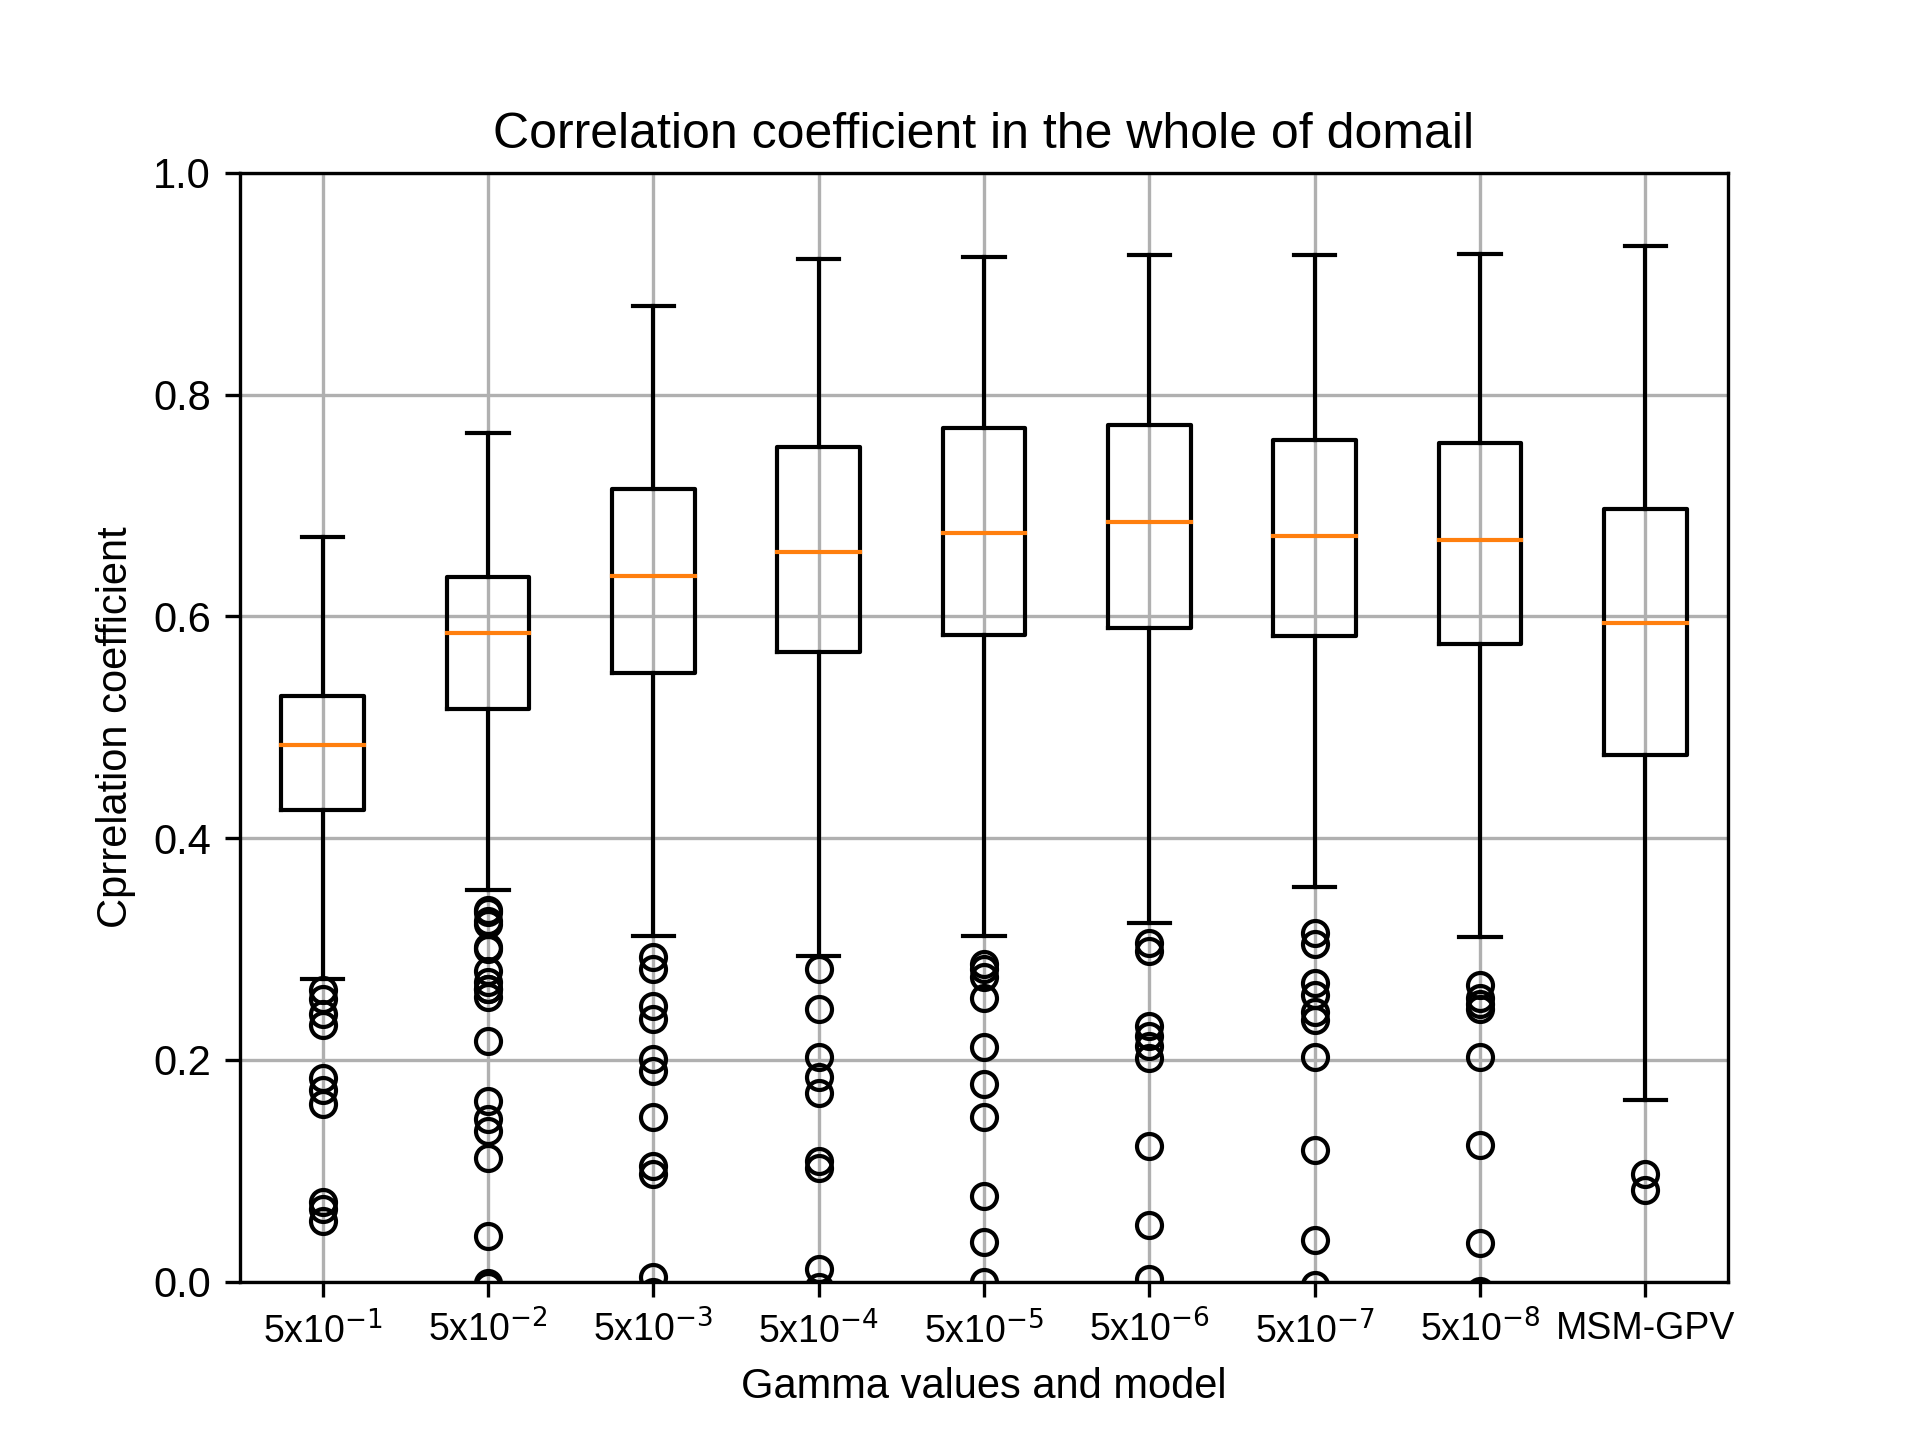
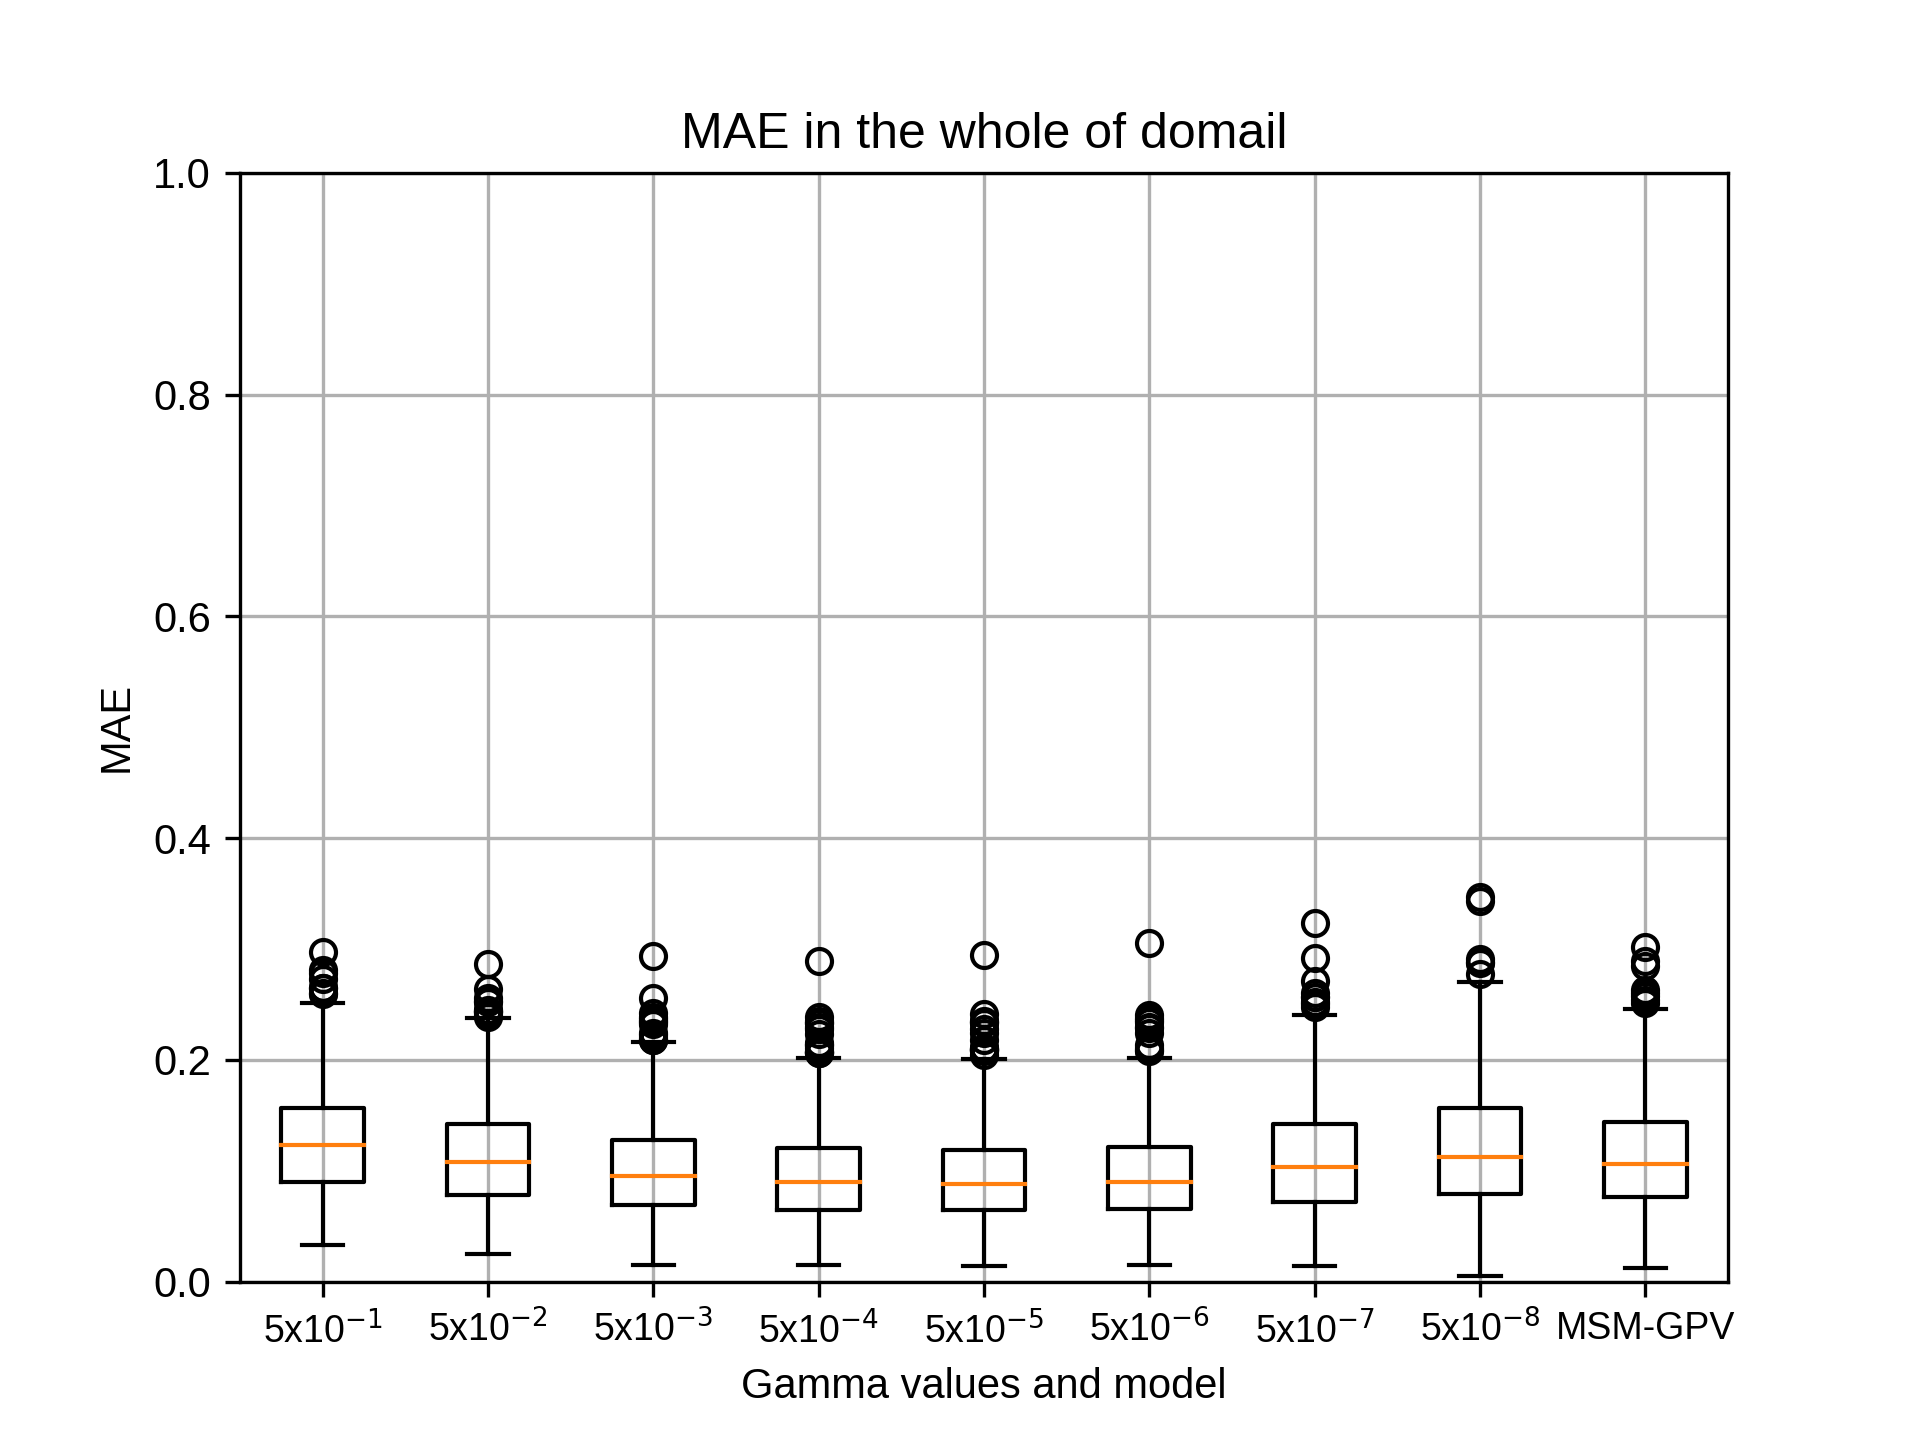
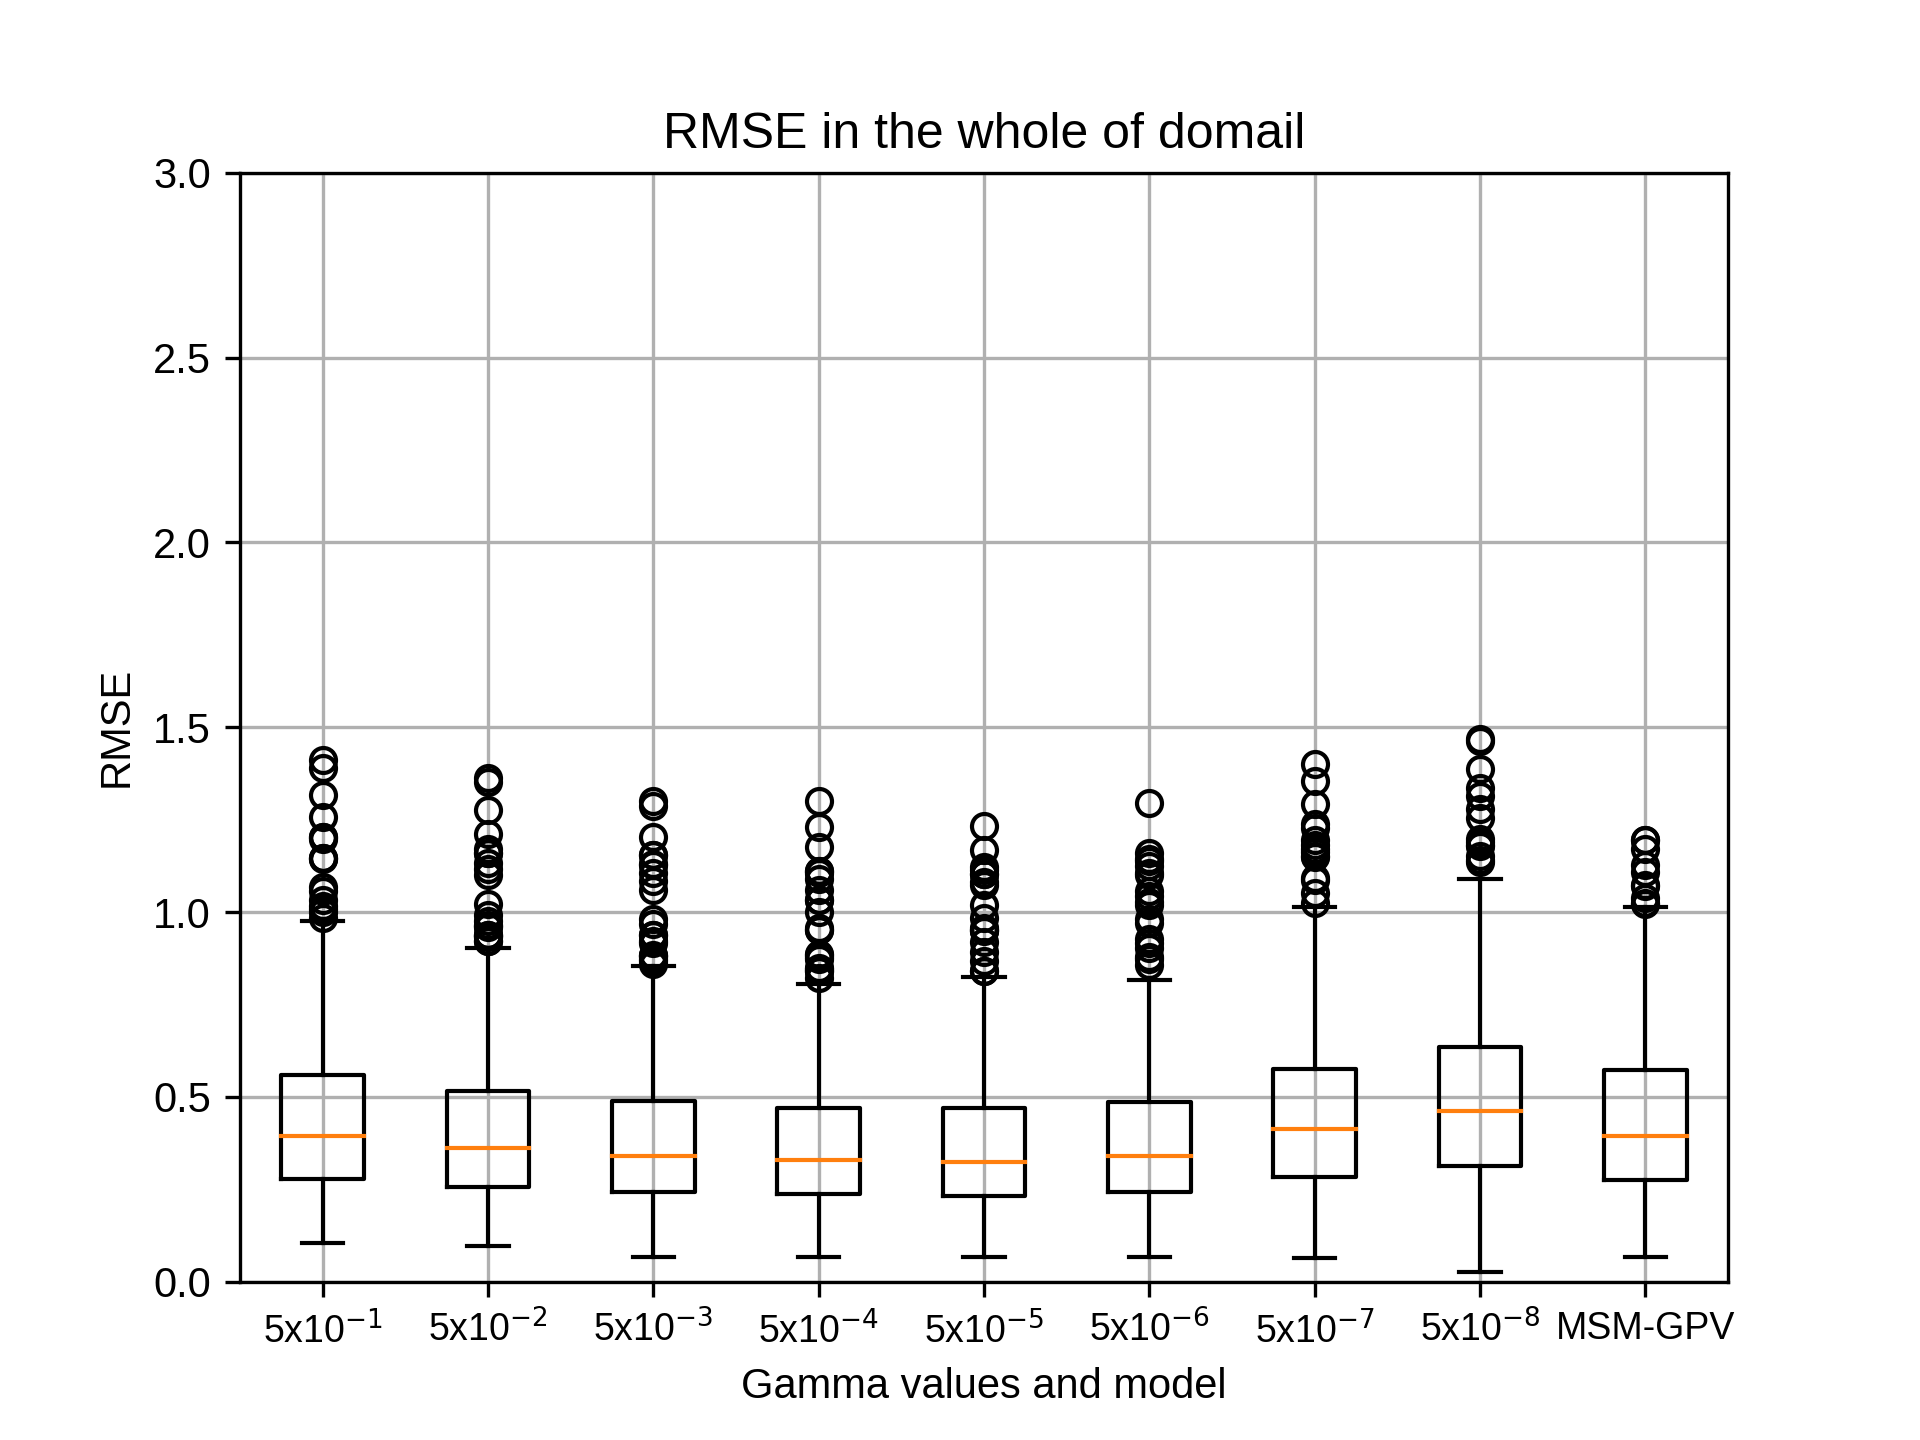
1月のsiteC,rg2=8の結果です。
kobayashi_yusukeThursday, October 22nd, 2020 at 4:16:34 PM GMT+09:00
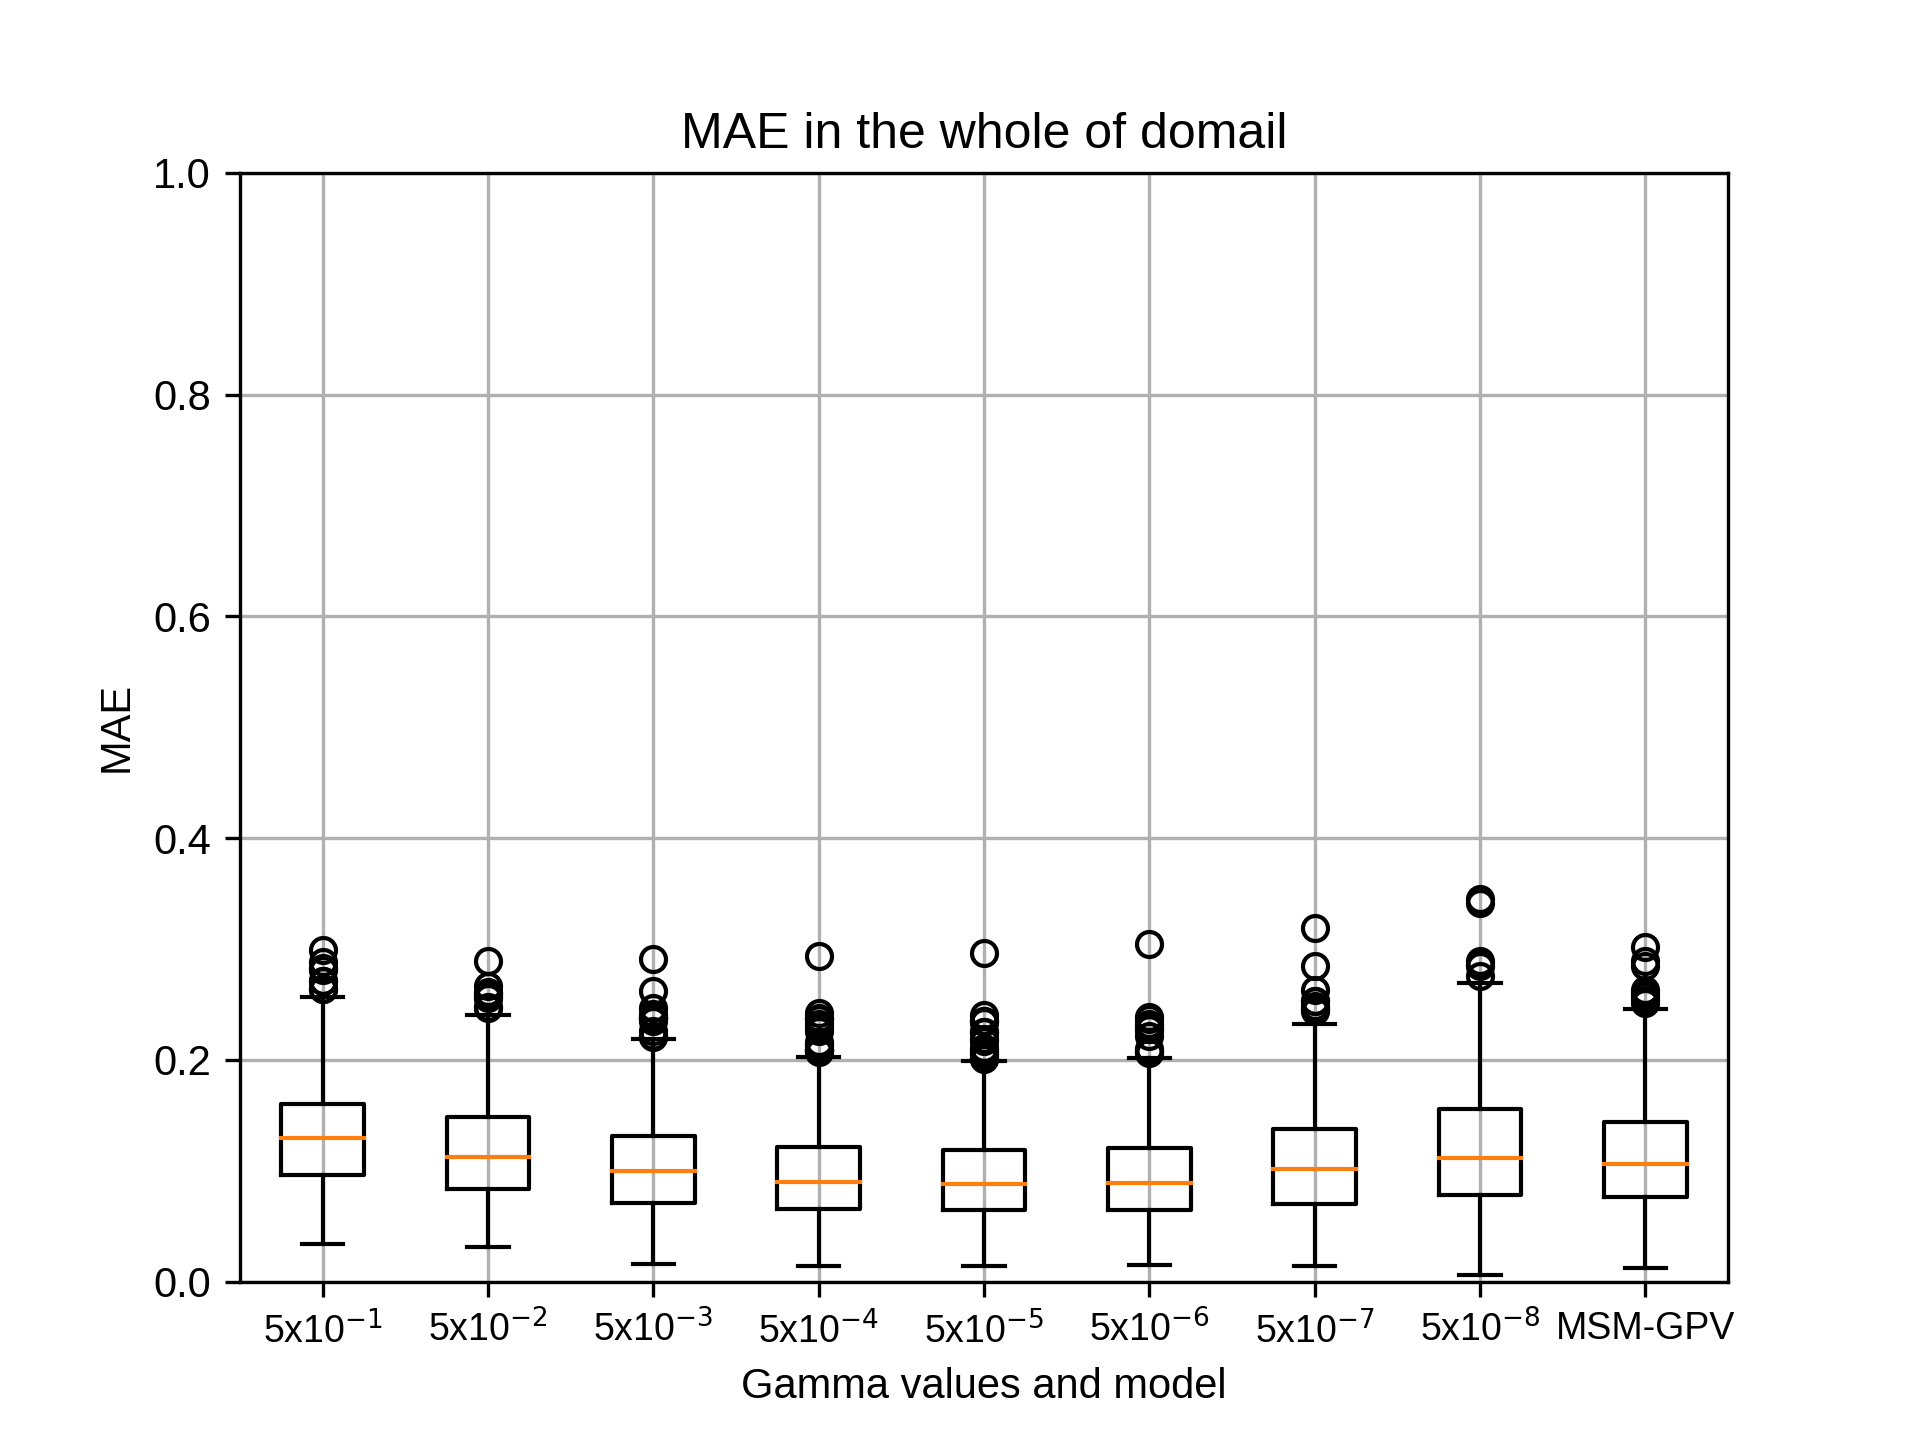
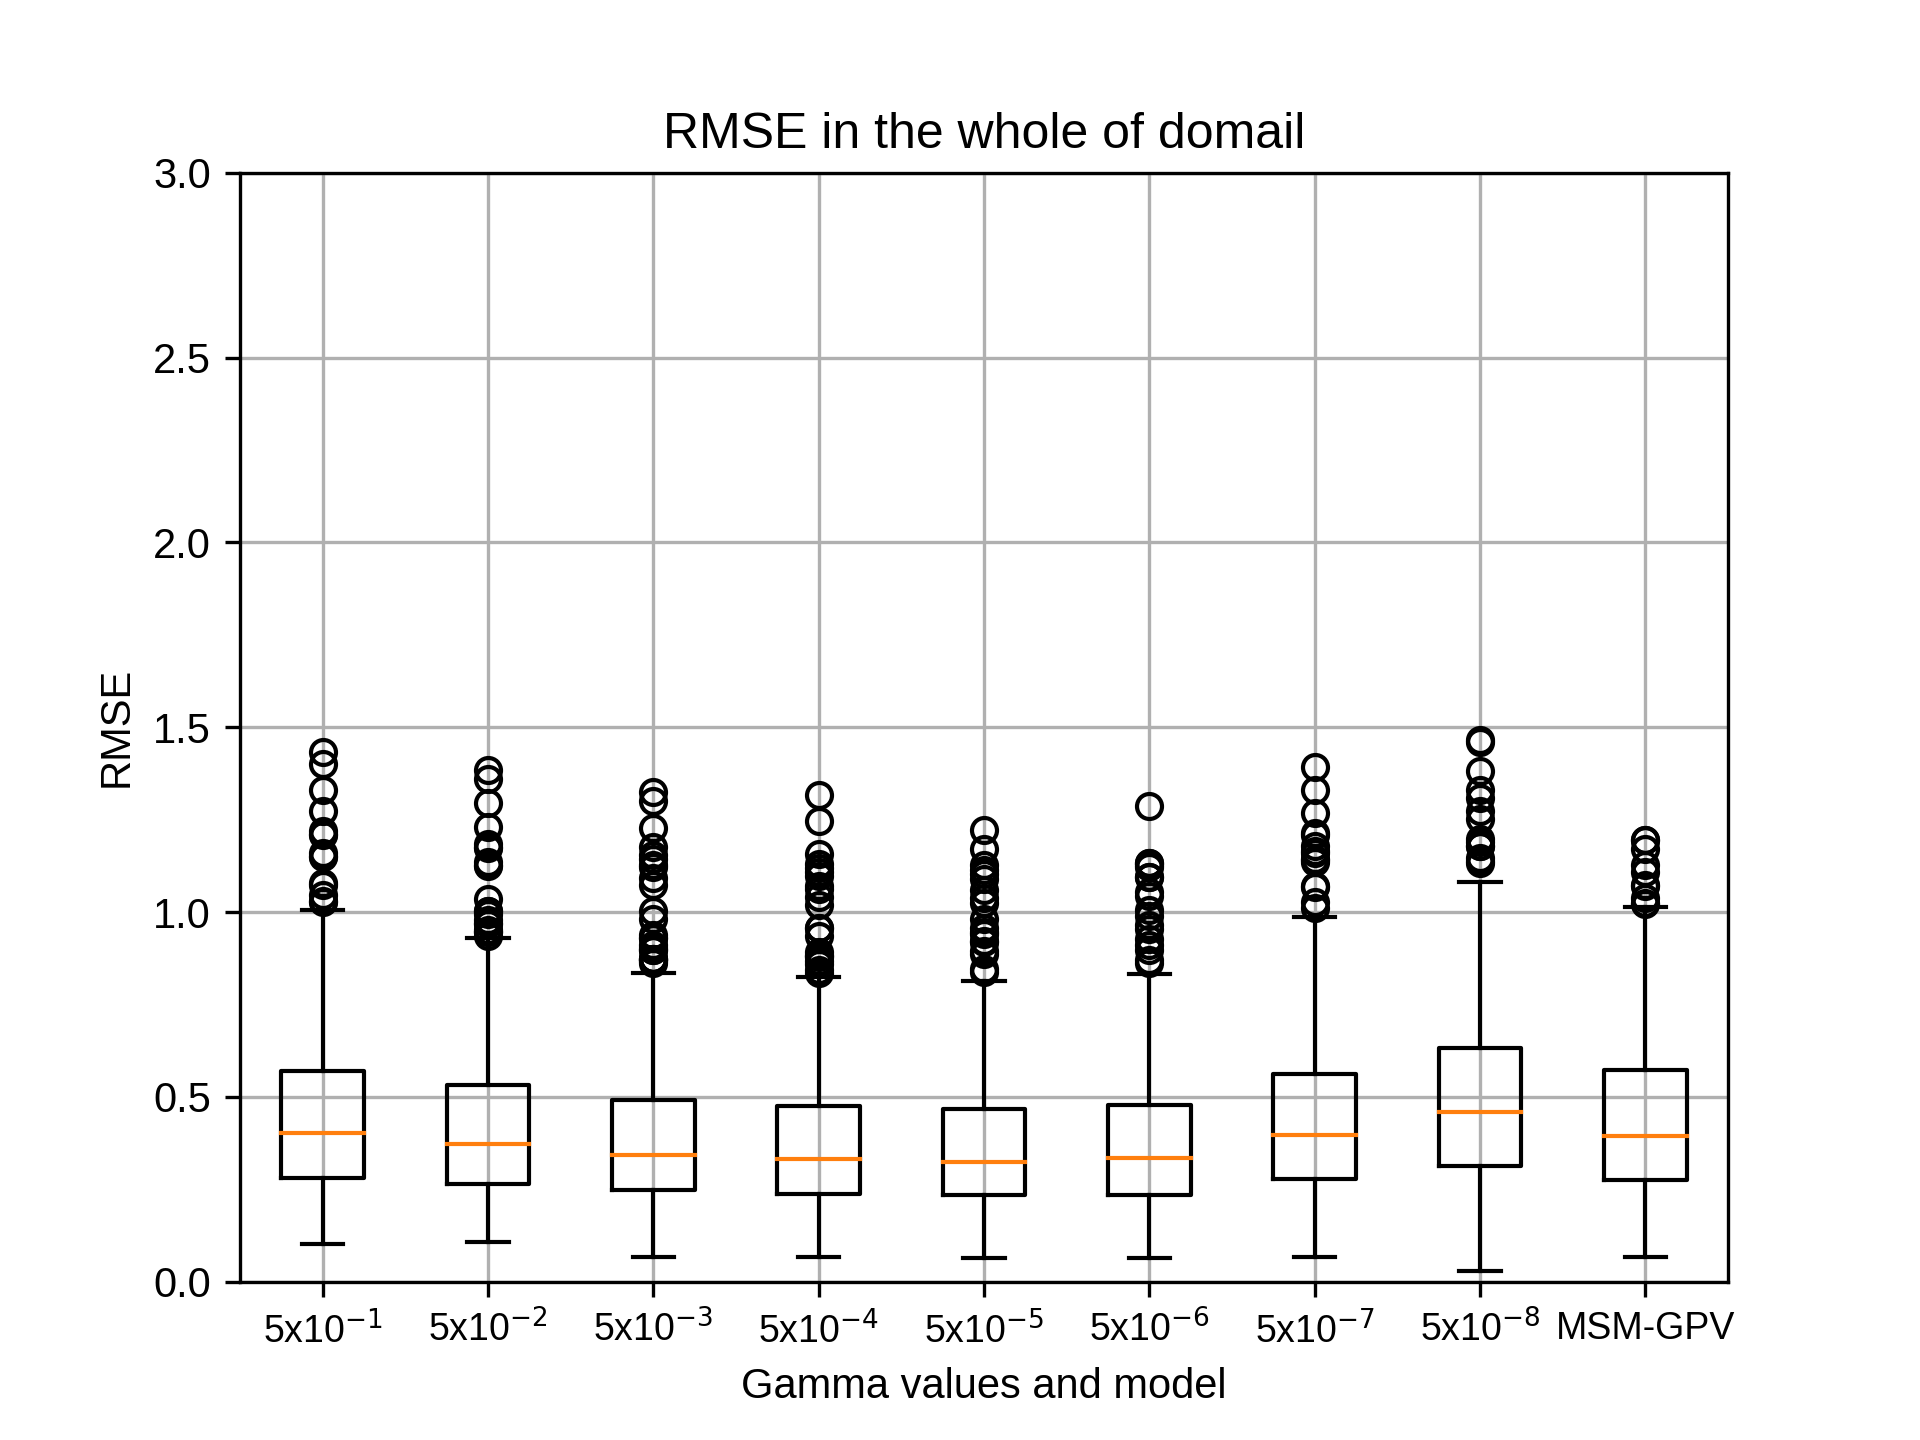
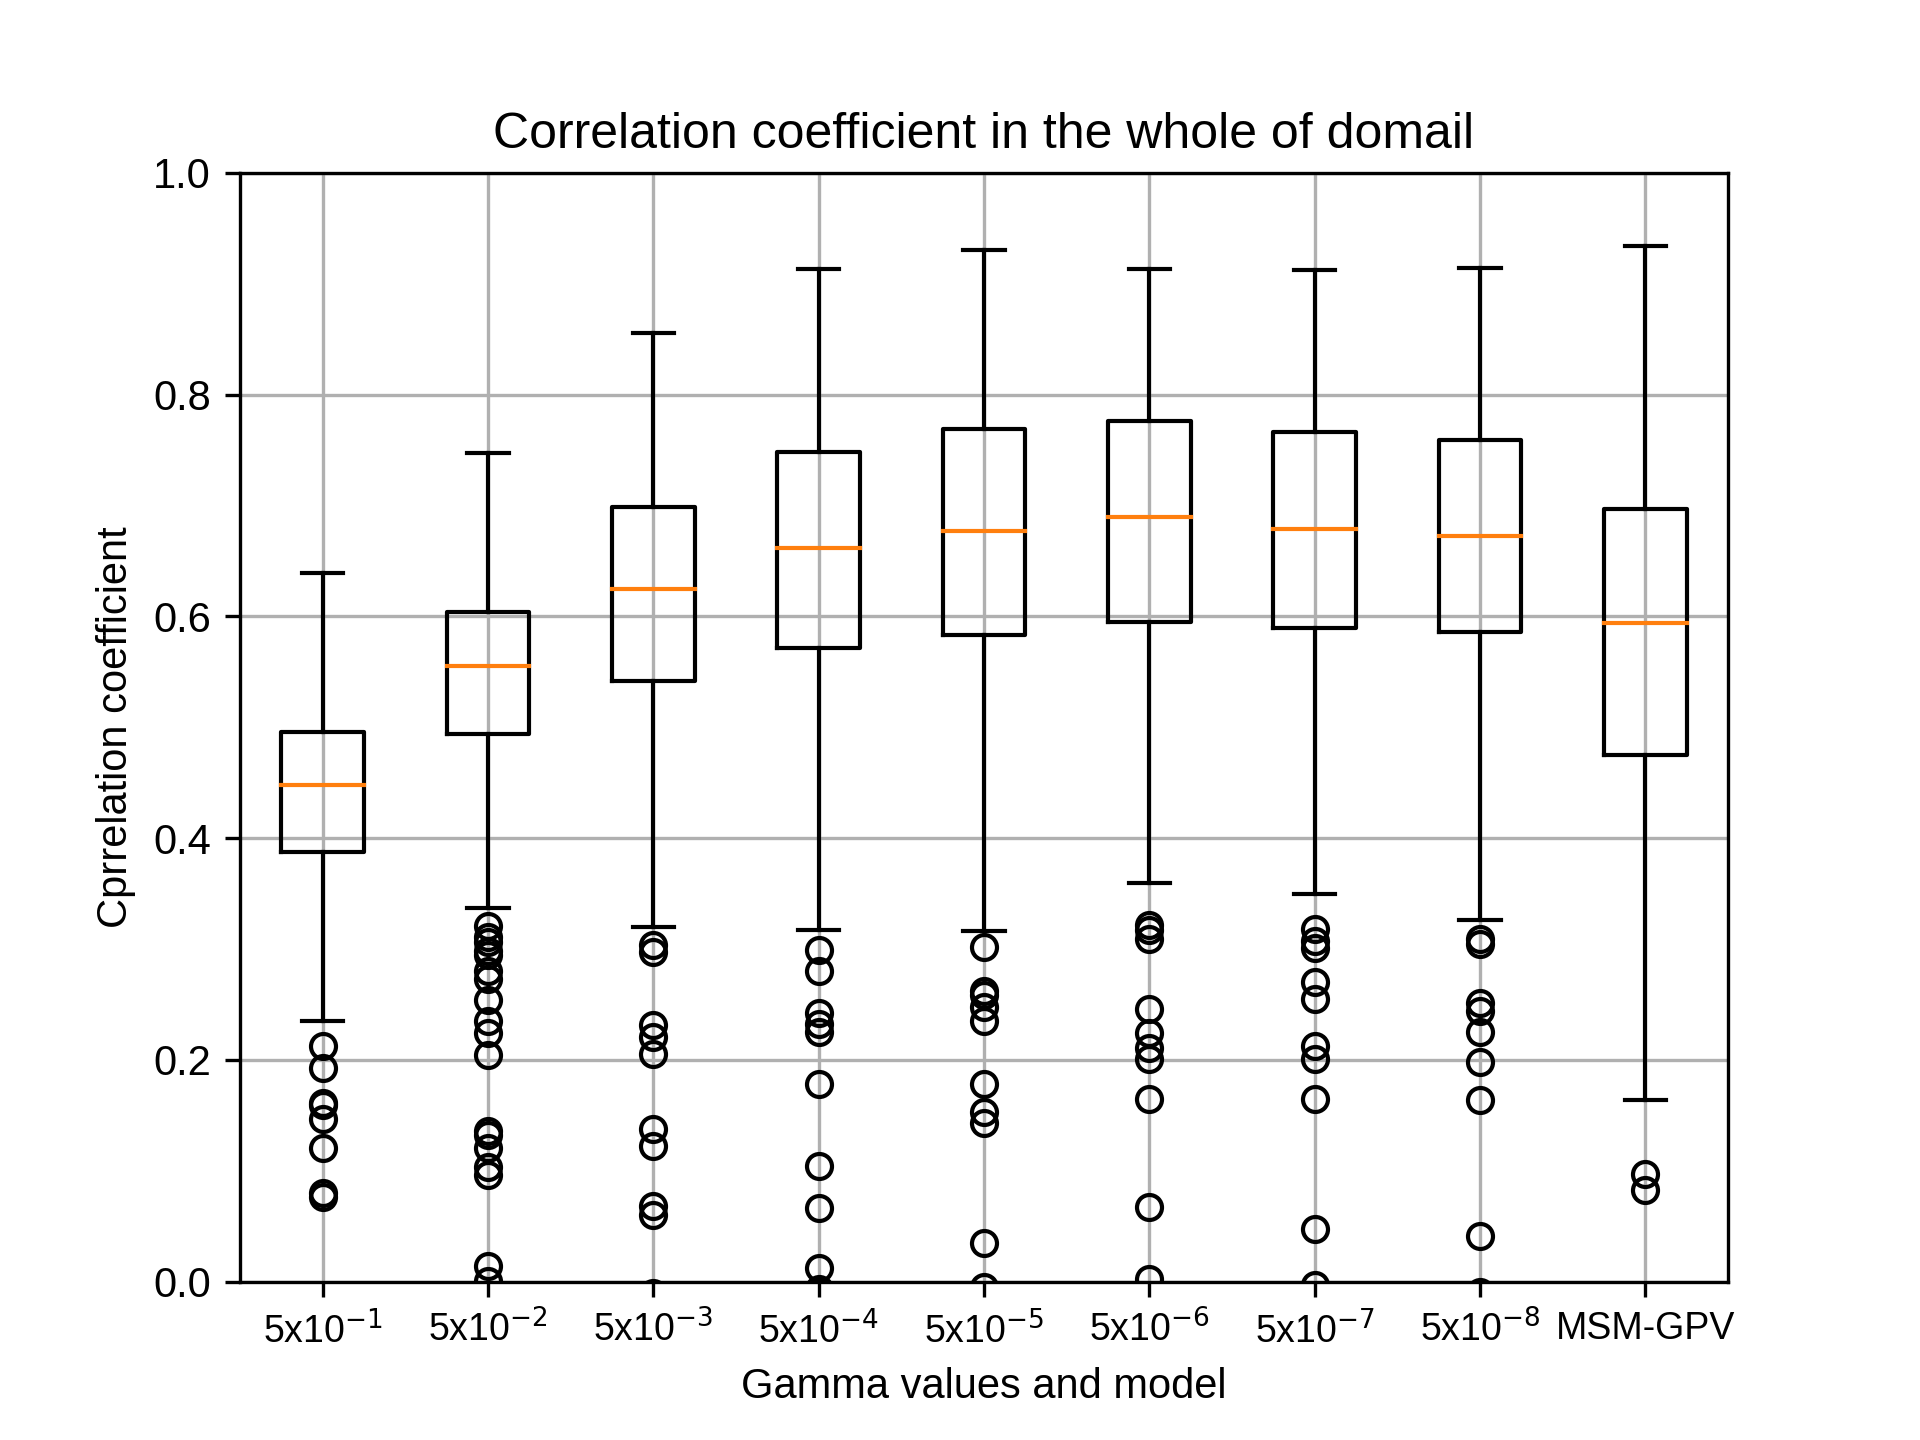
1月のsiteC,rg2=10の結果です。
kobayashi_yusukeThursday, October 22nd, 2020 at 4:16:53 PM GMT+09:00

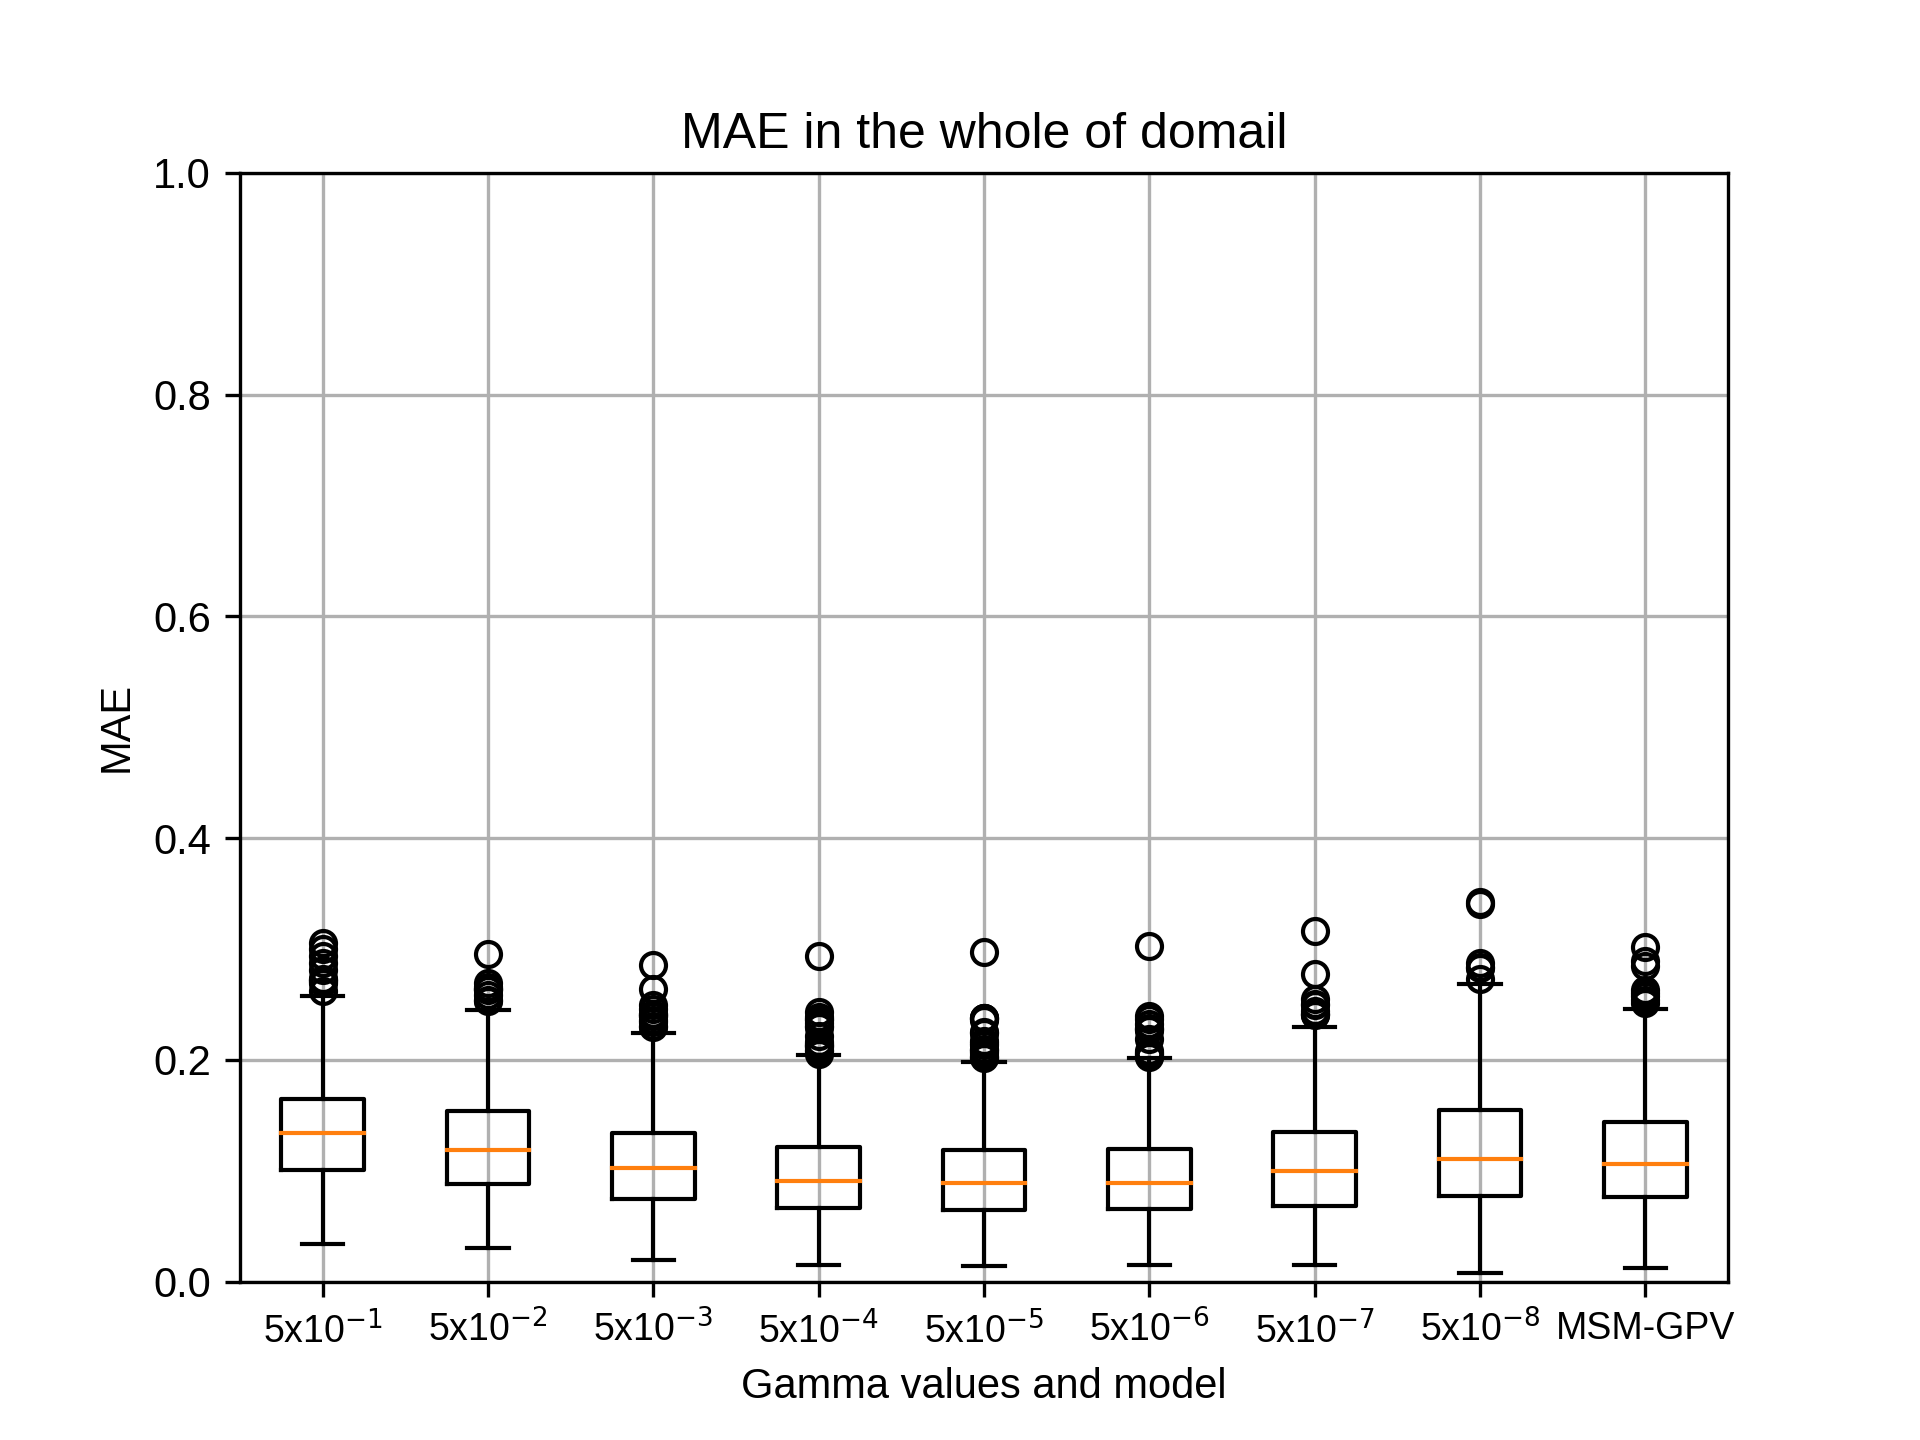
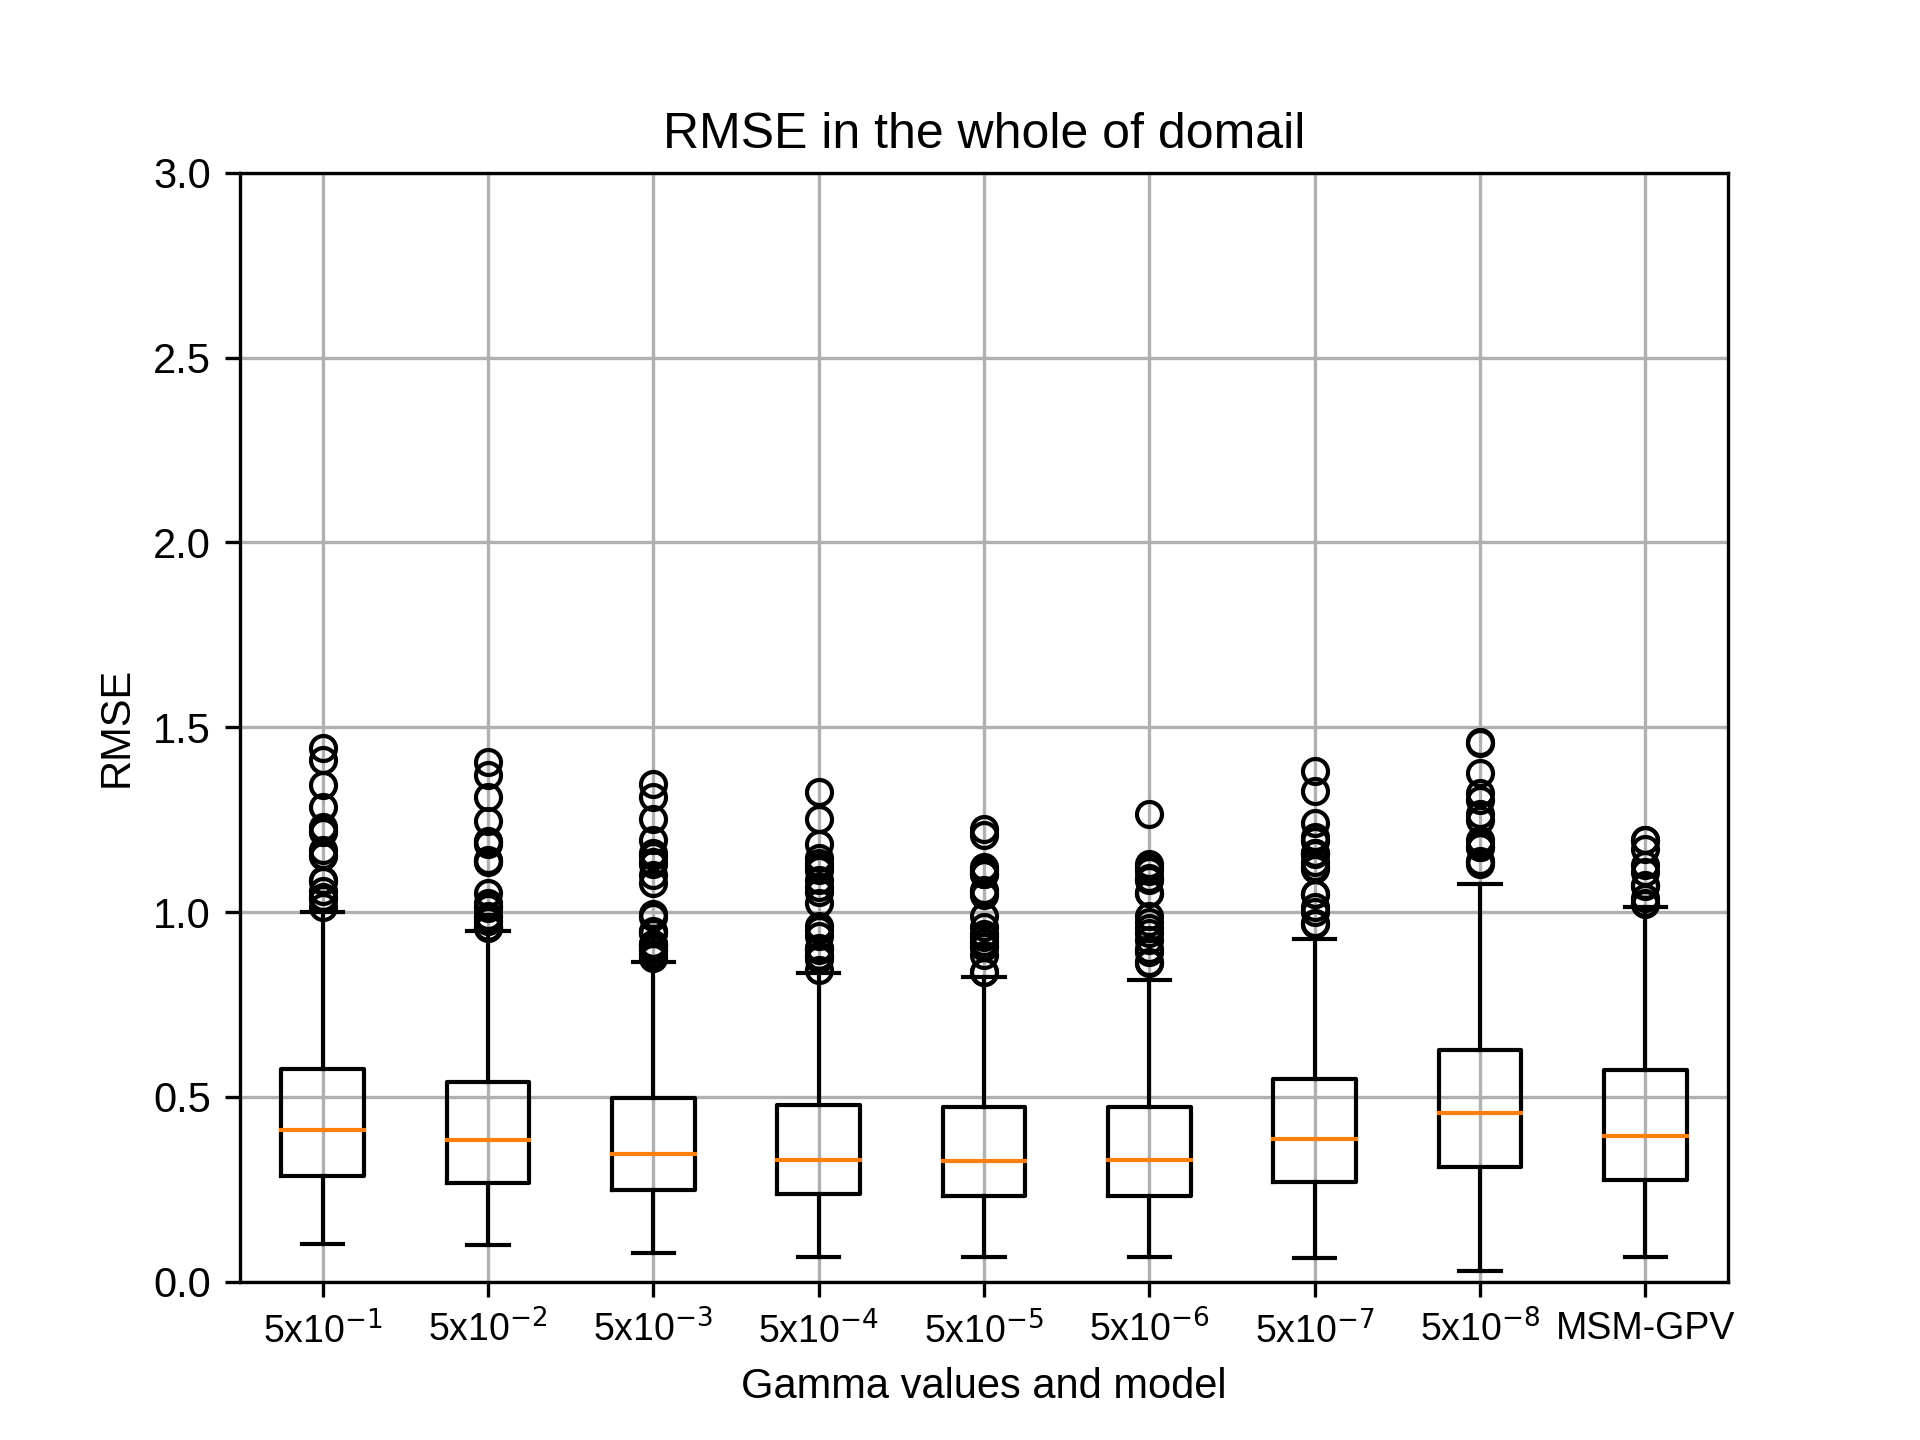
1月のsiteC,rg2=12の結果です。
1月のsiteCではrg2=12でgammaが5x10⁻⁶のとき、相関係数の中央値が最も高くなりました。
1月のsiteCではrg2=12でgammaが5x10⁻⁶のとき、相関係数の中央値が最も高くなりました。
kobayashi_yusukeThursday, October 22nd, 2020 at 4:17:07 PM GMT+09:00
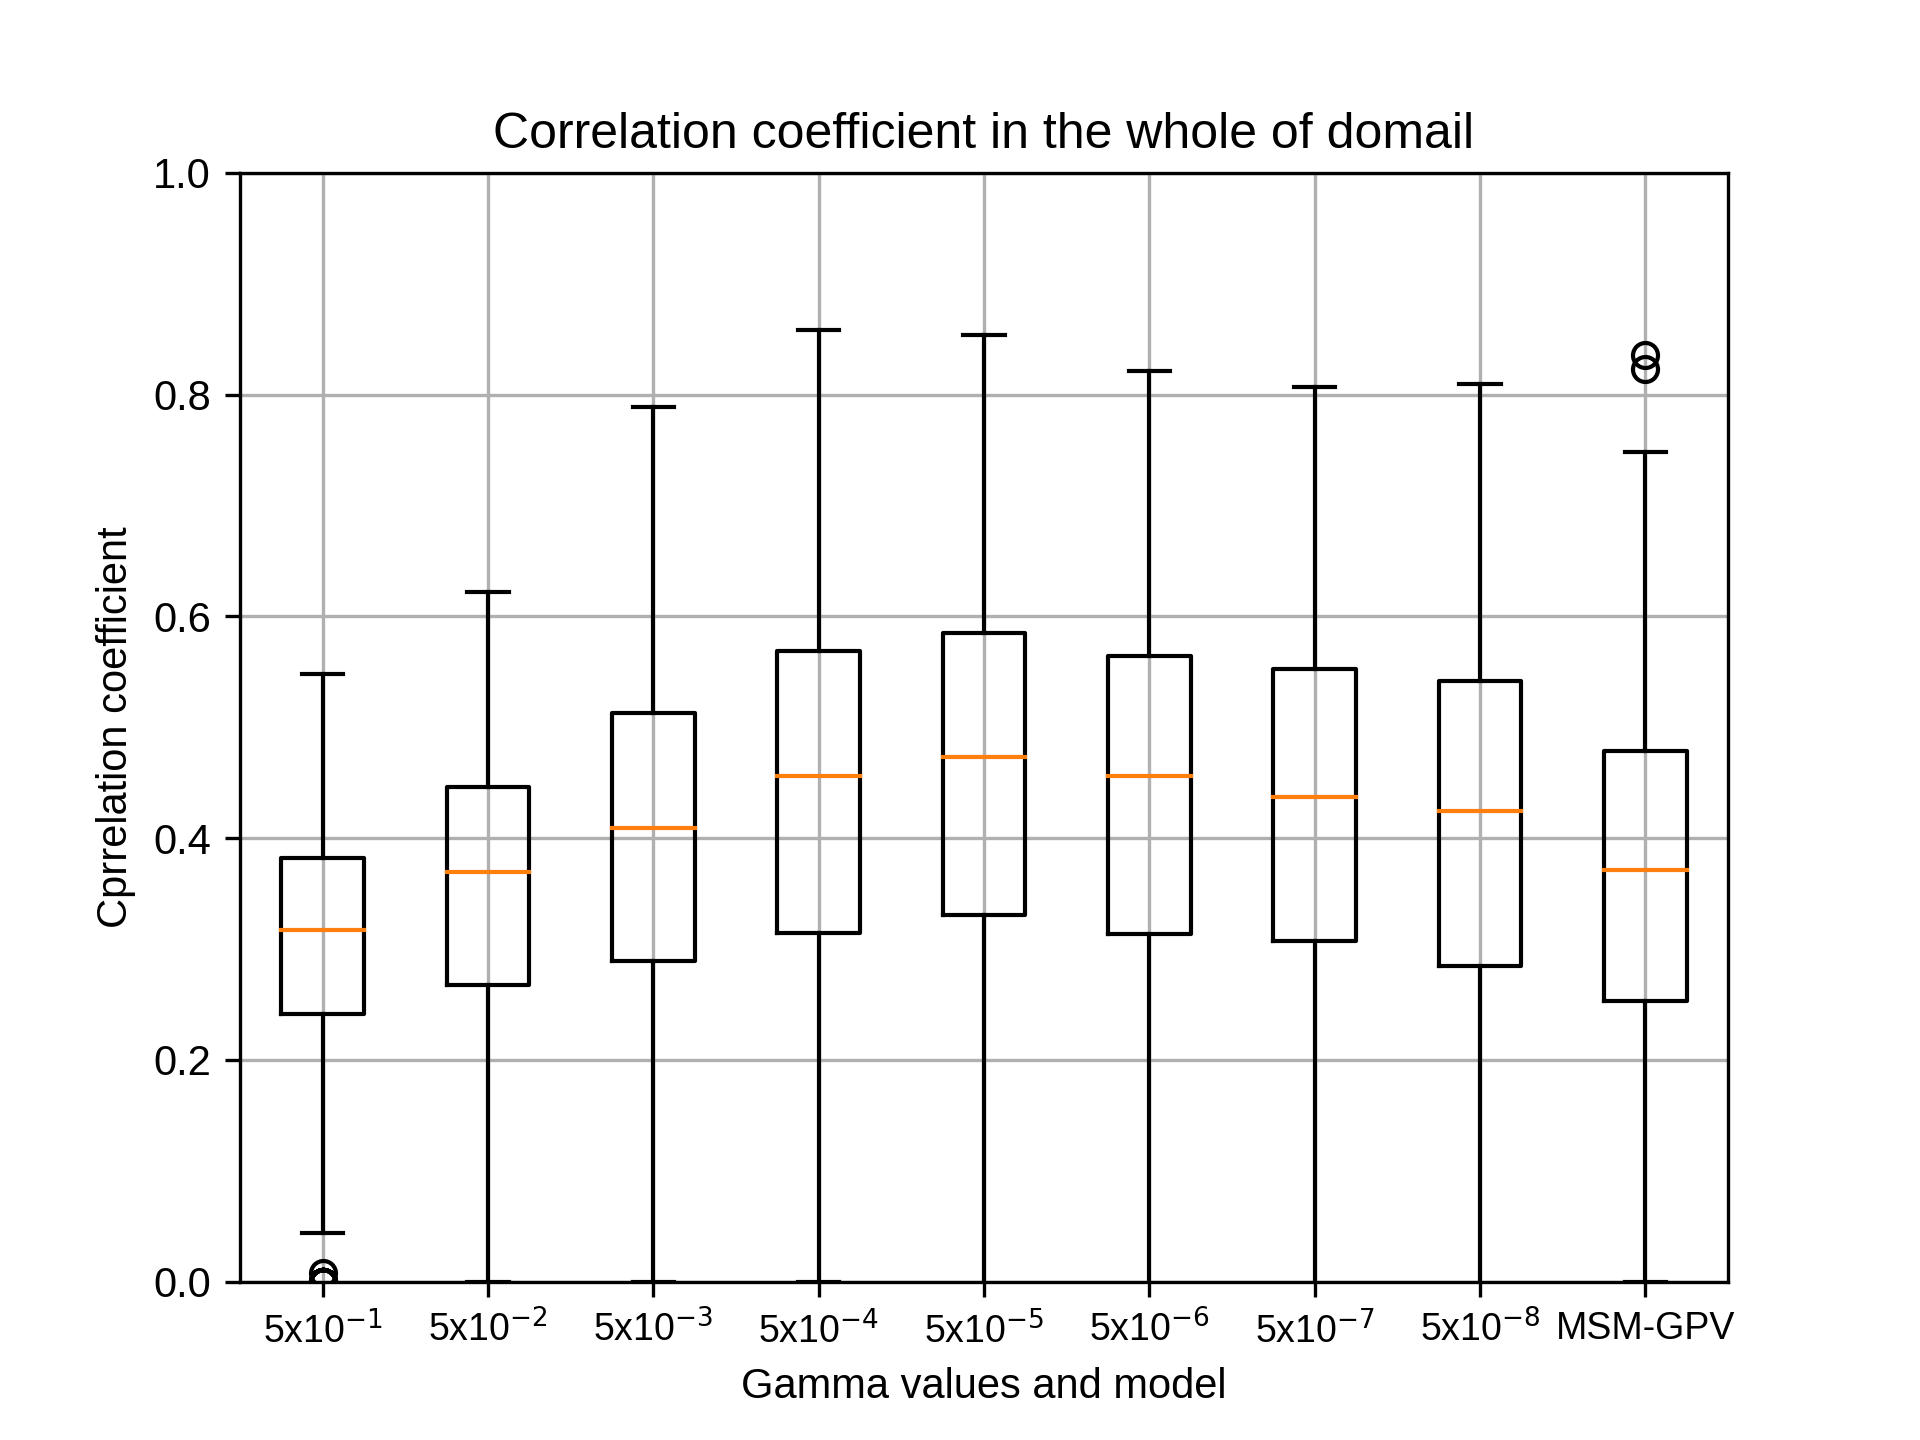
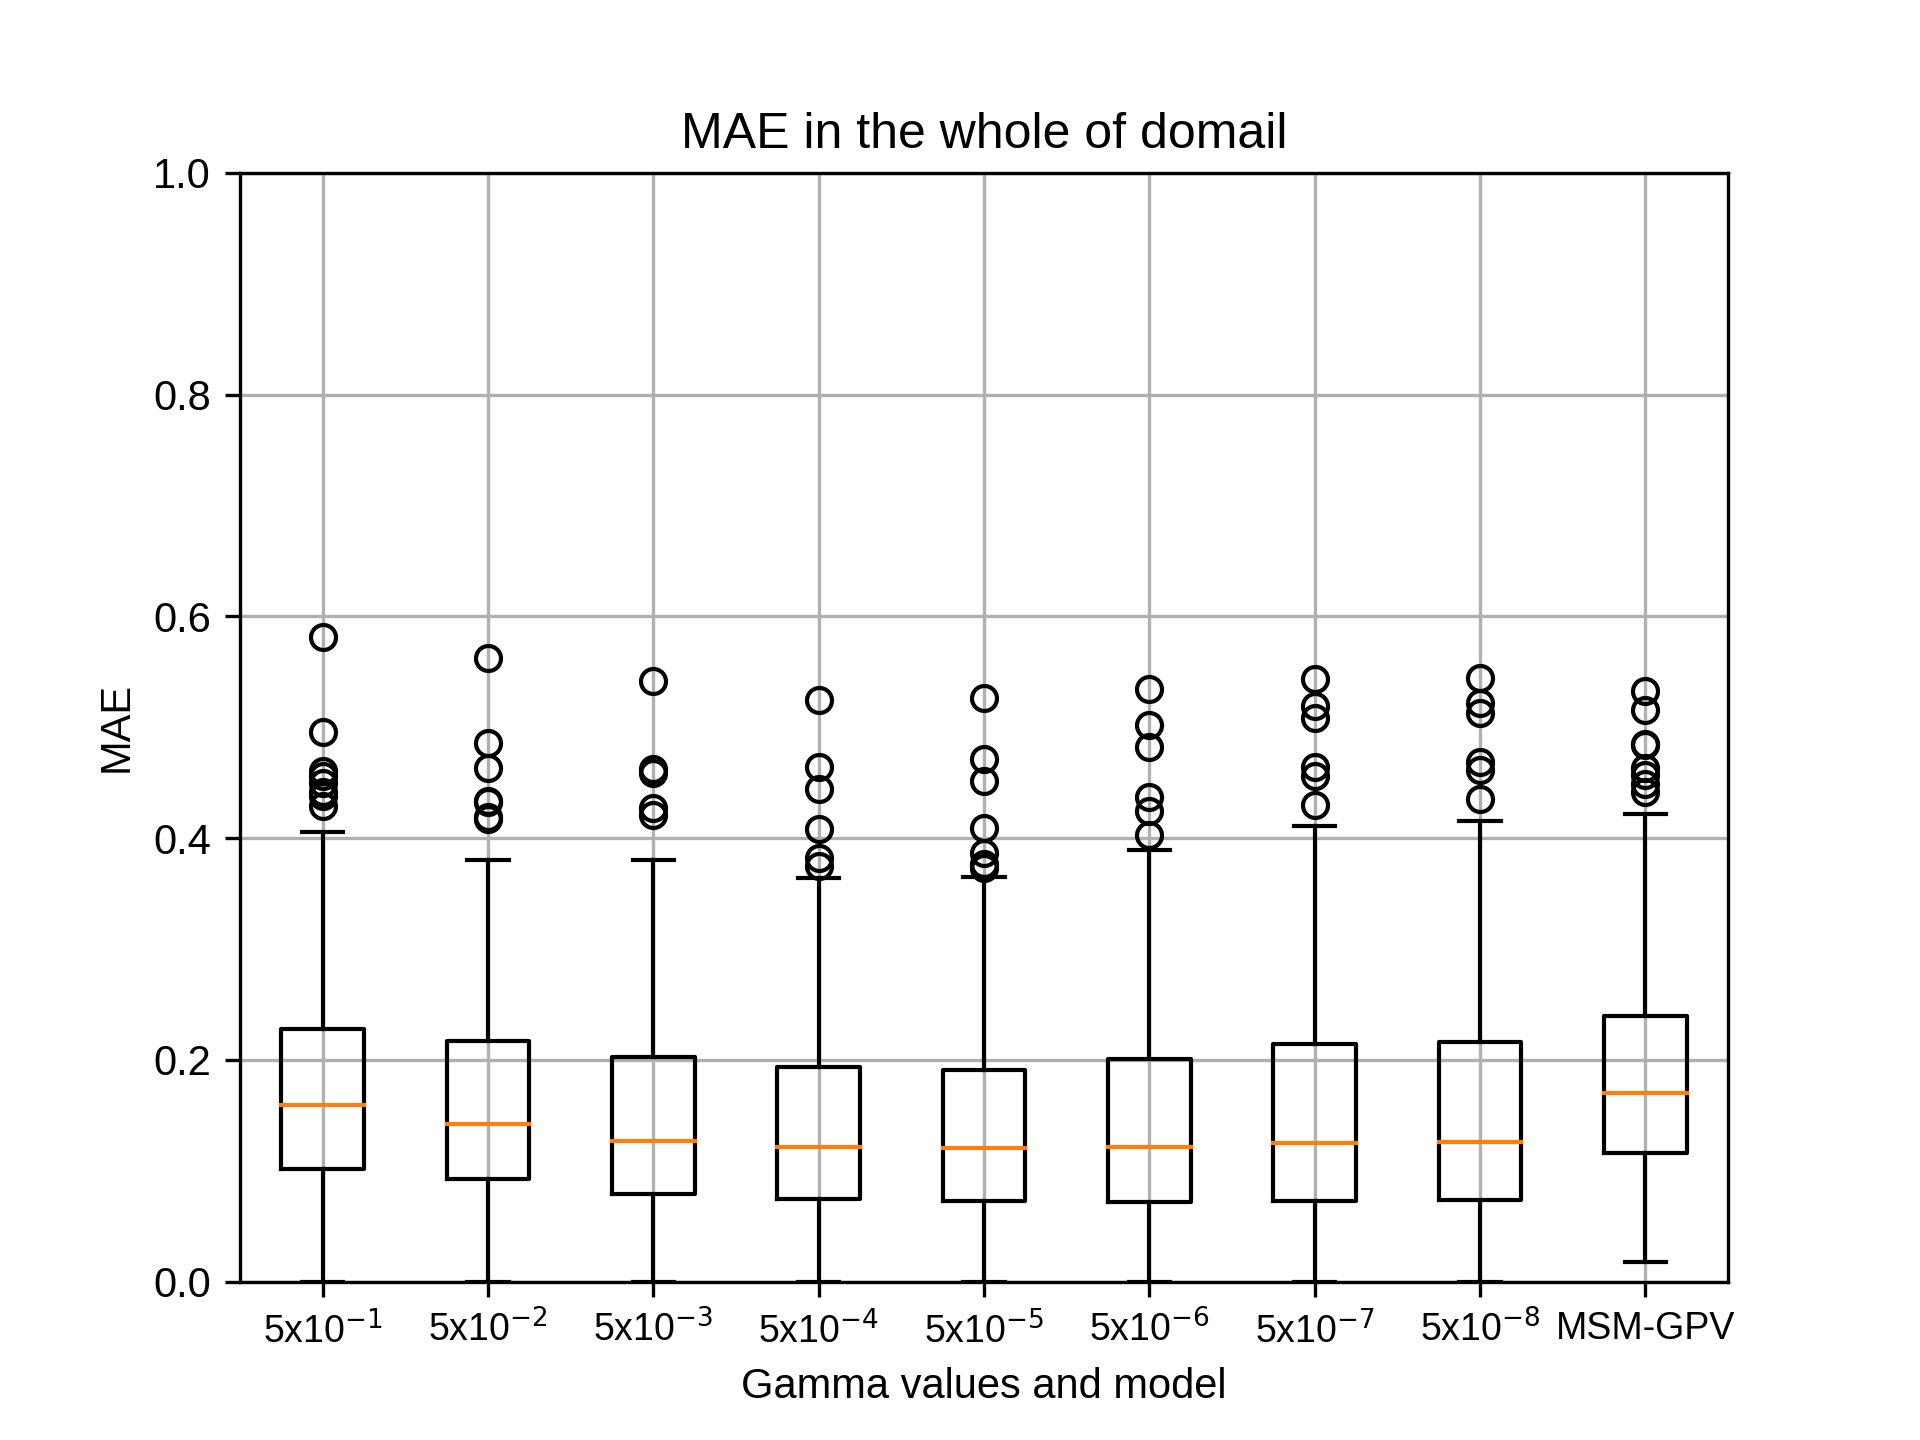
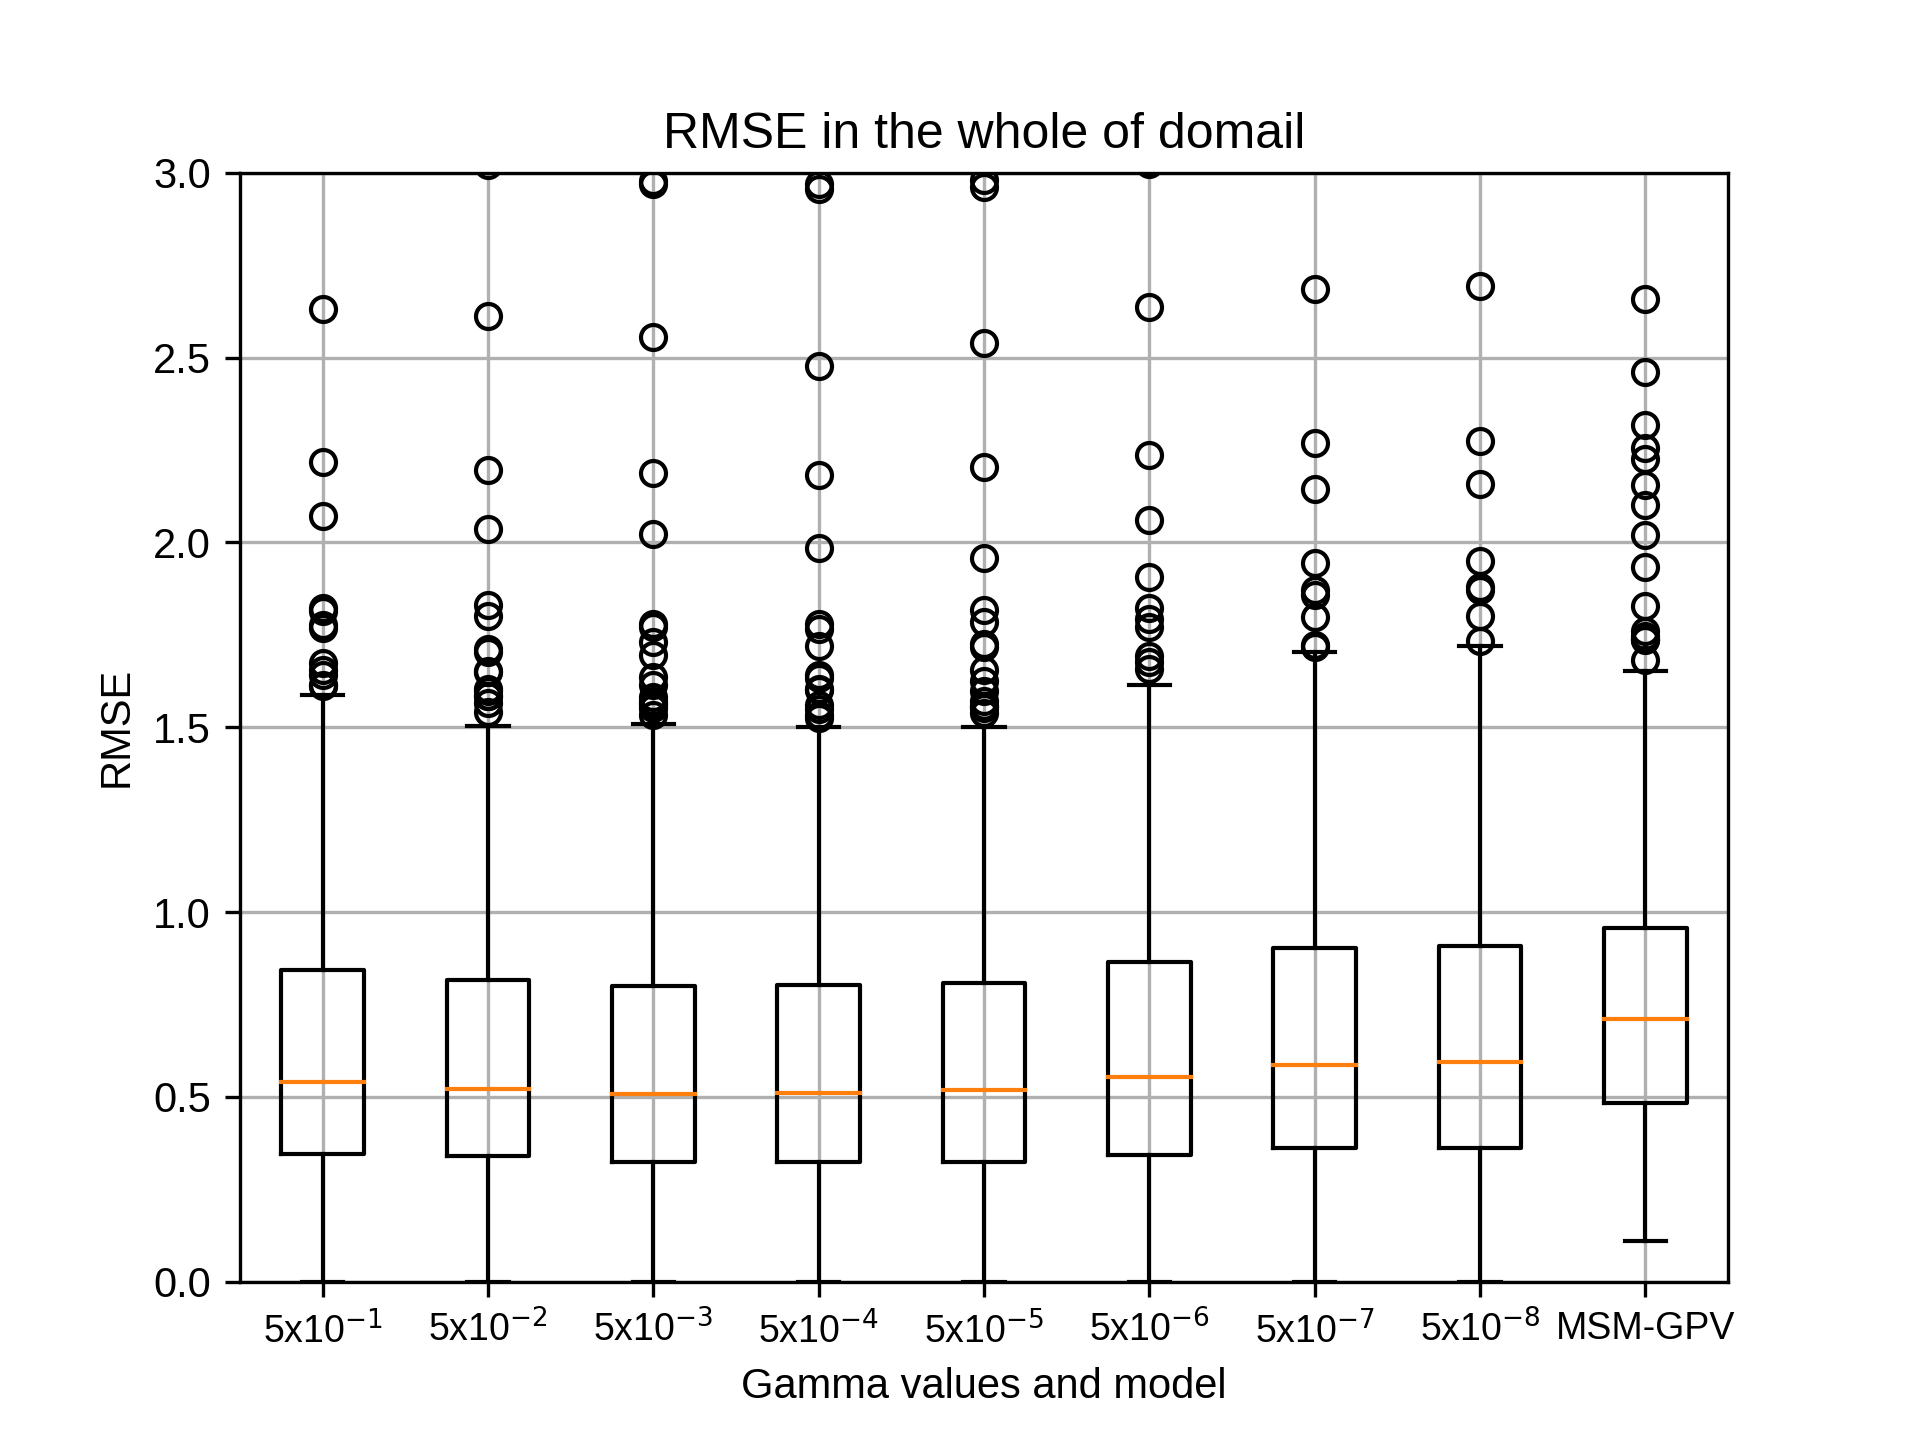
1月のsiteD,rg2=4の結果です。
kobayashi_yusukeThursday, October 22nd, 2020 at 4:17:27 PM GMT+09:00
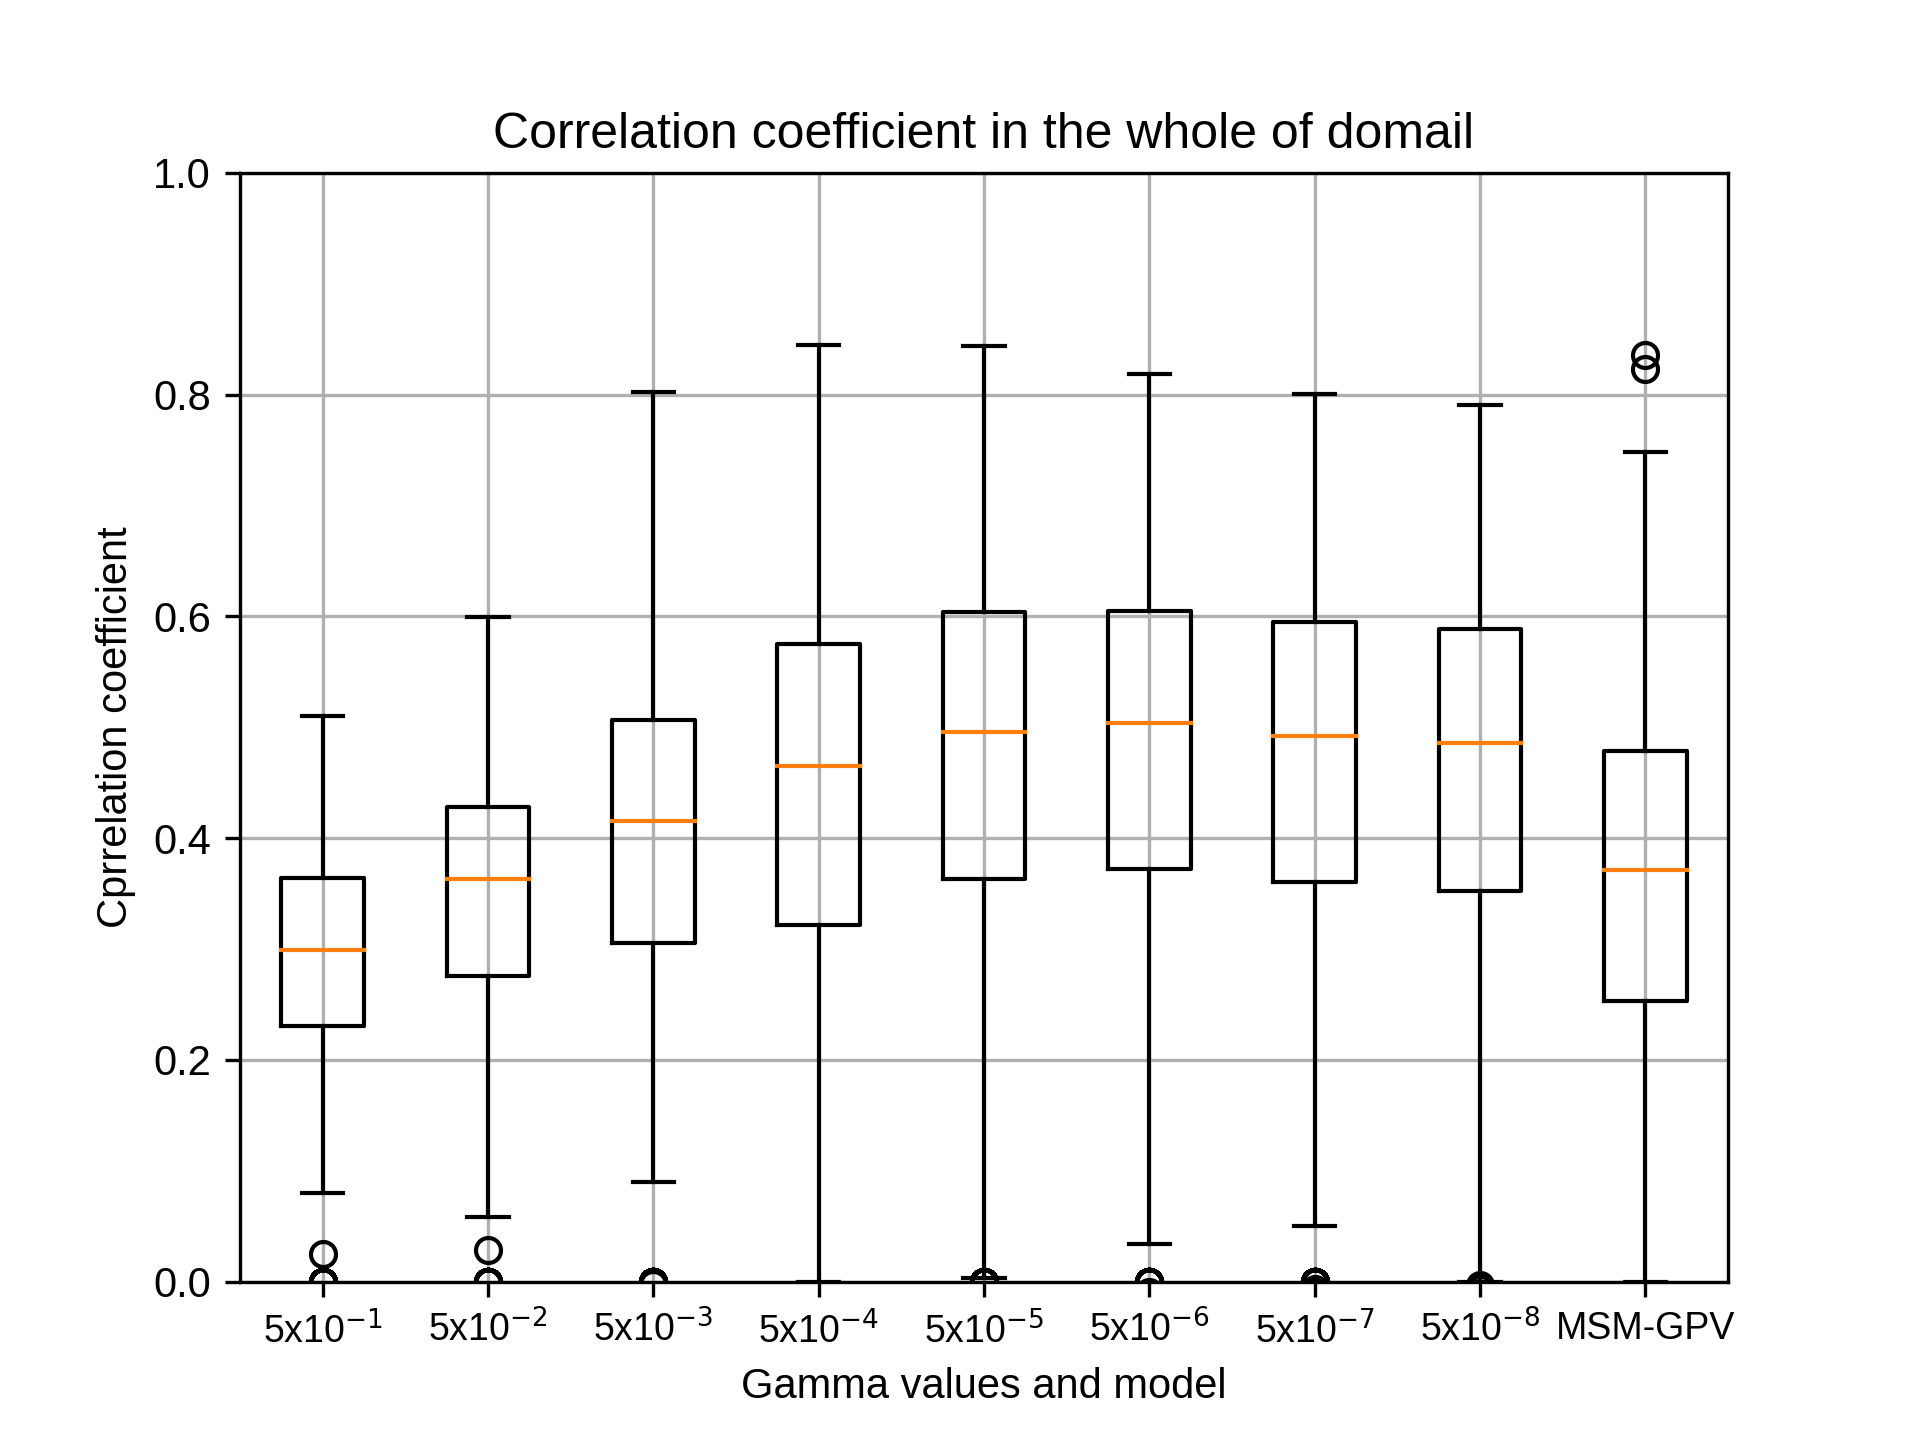
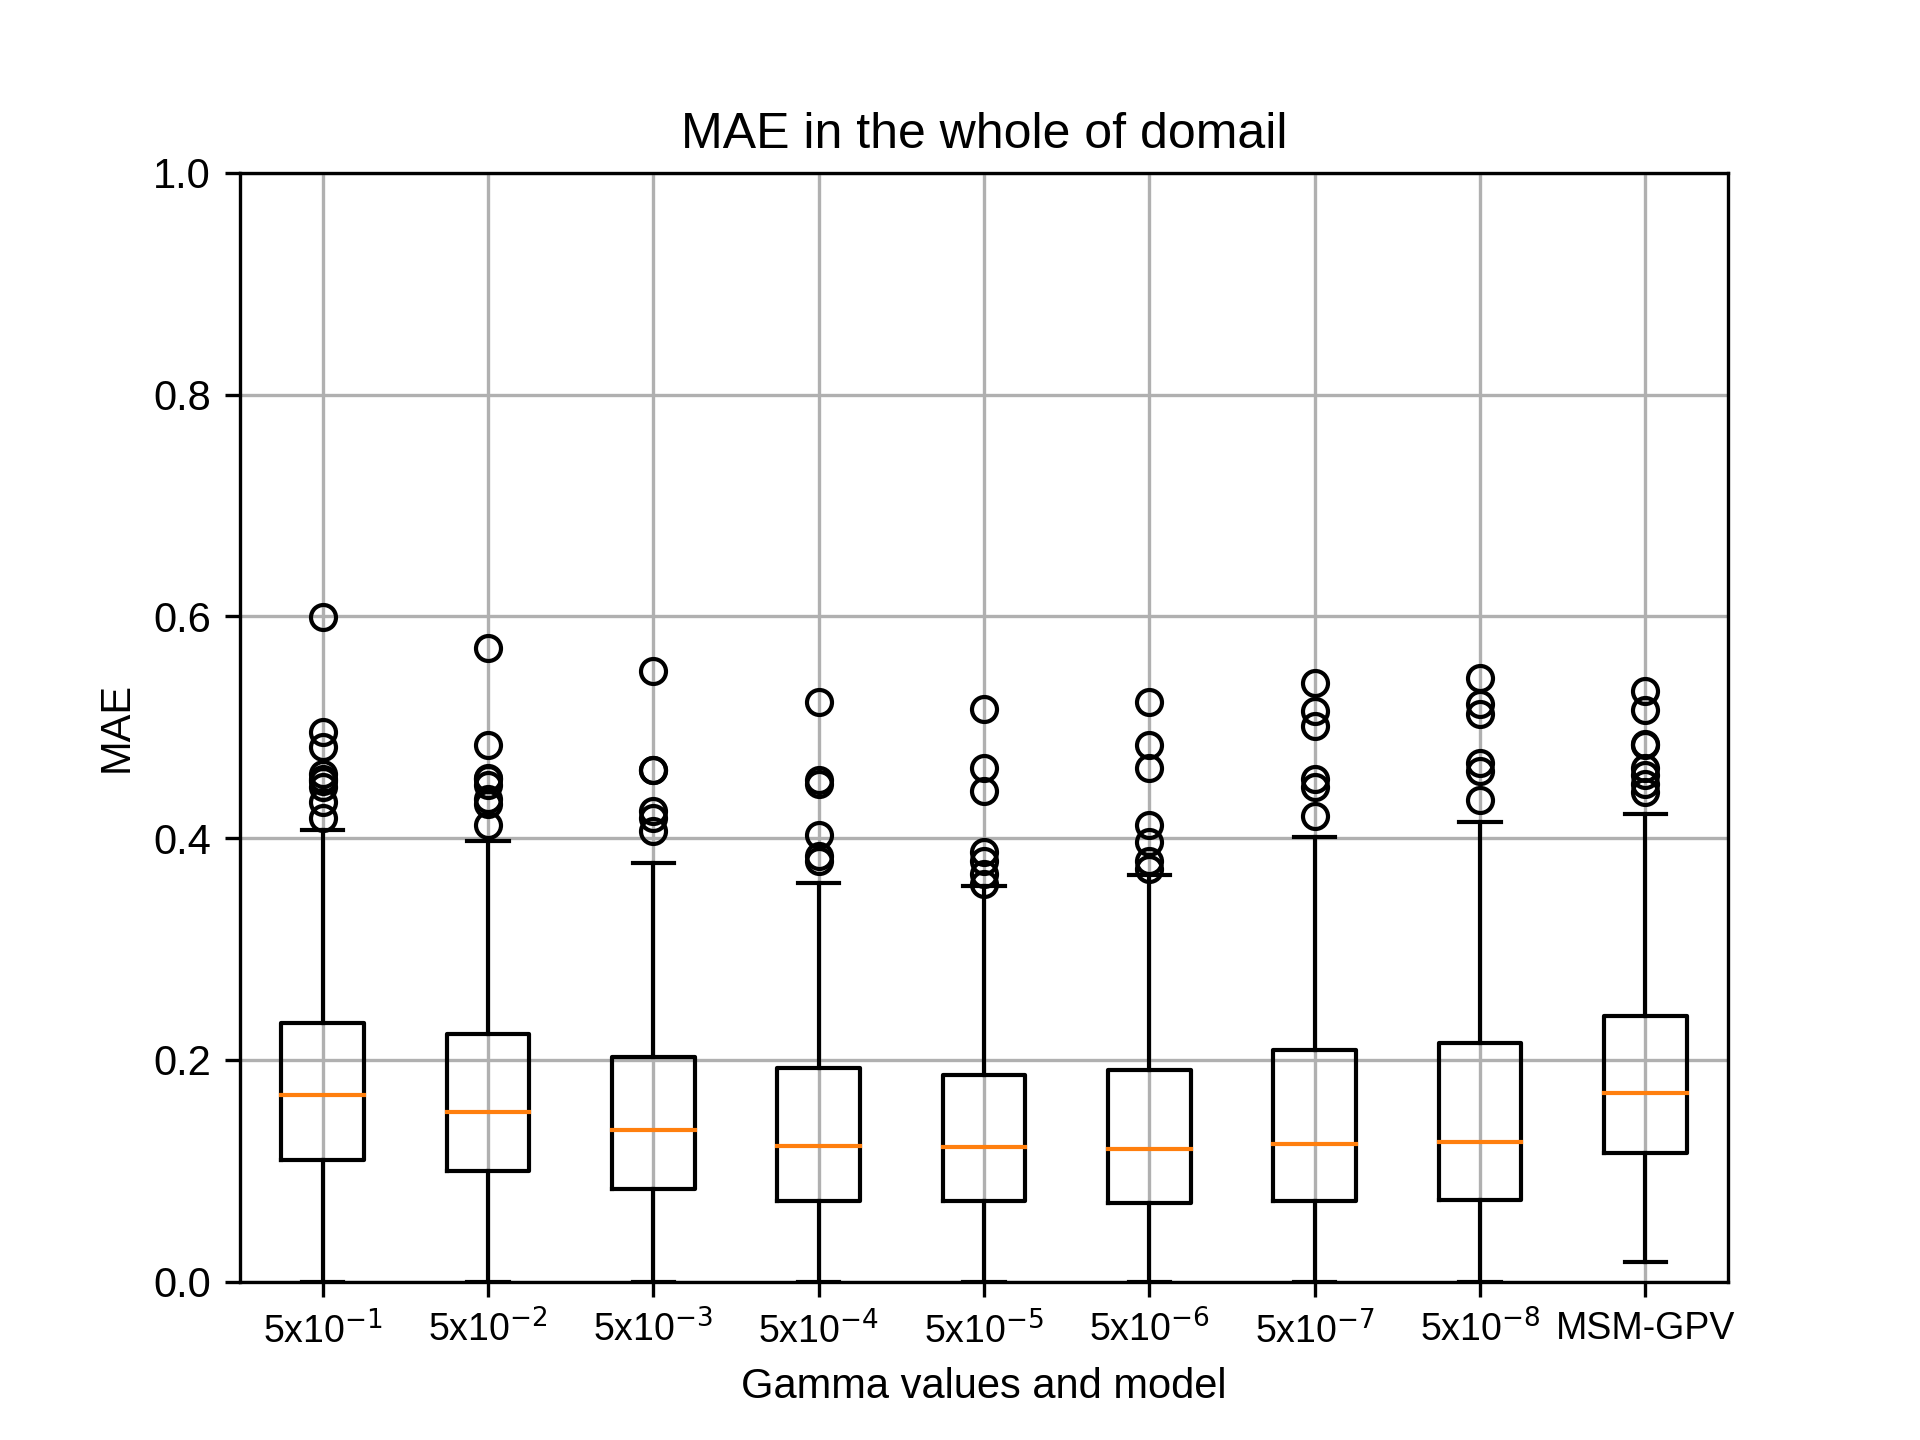
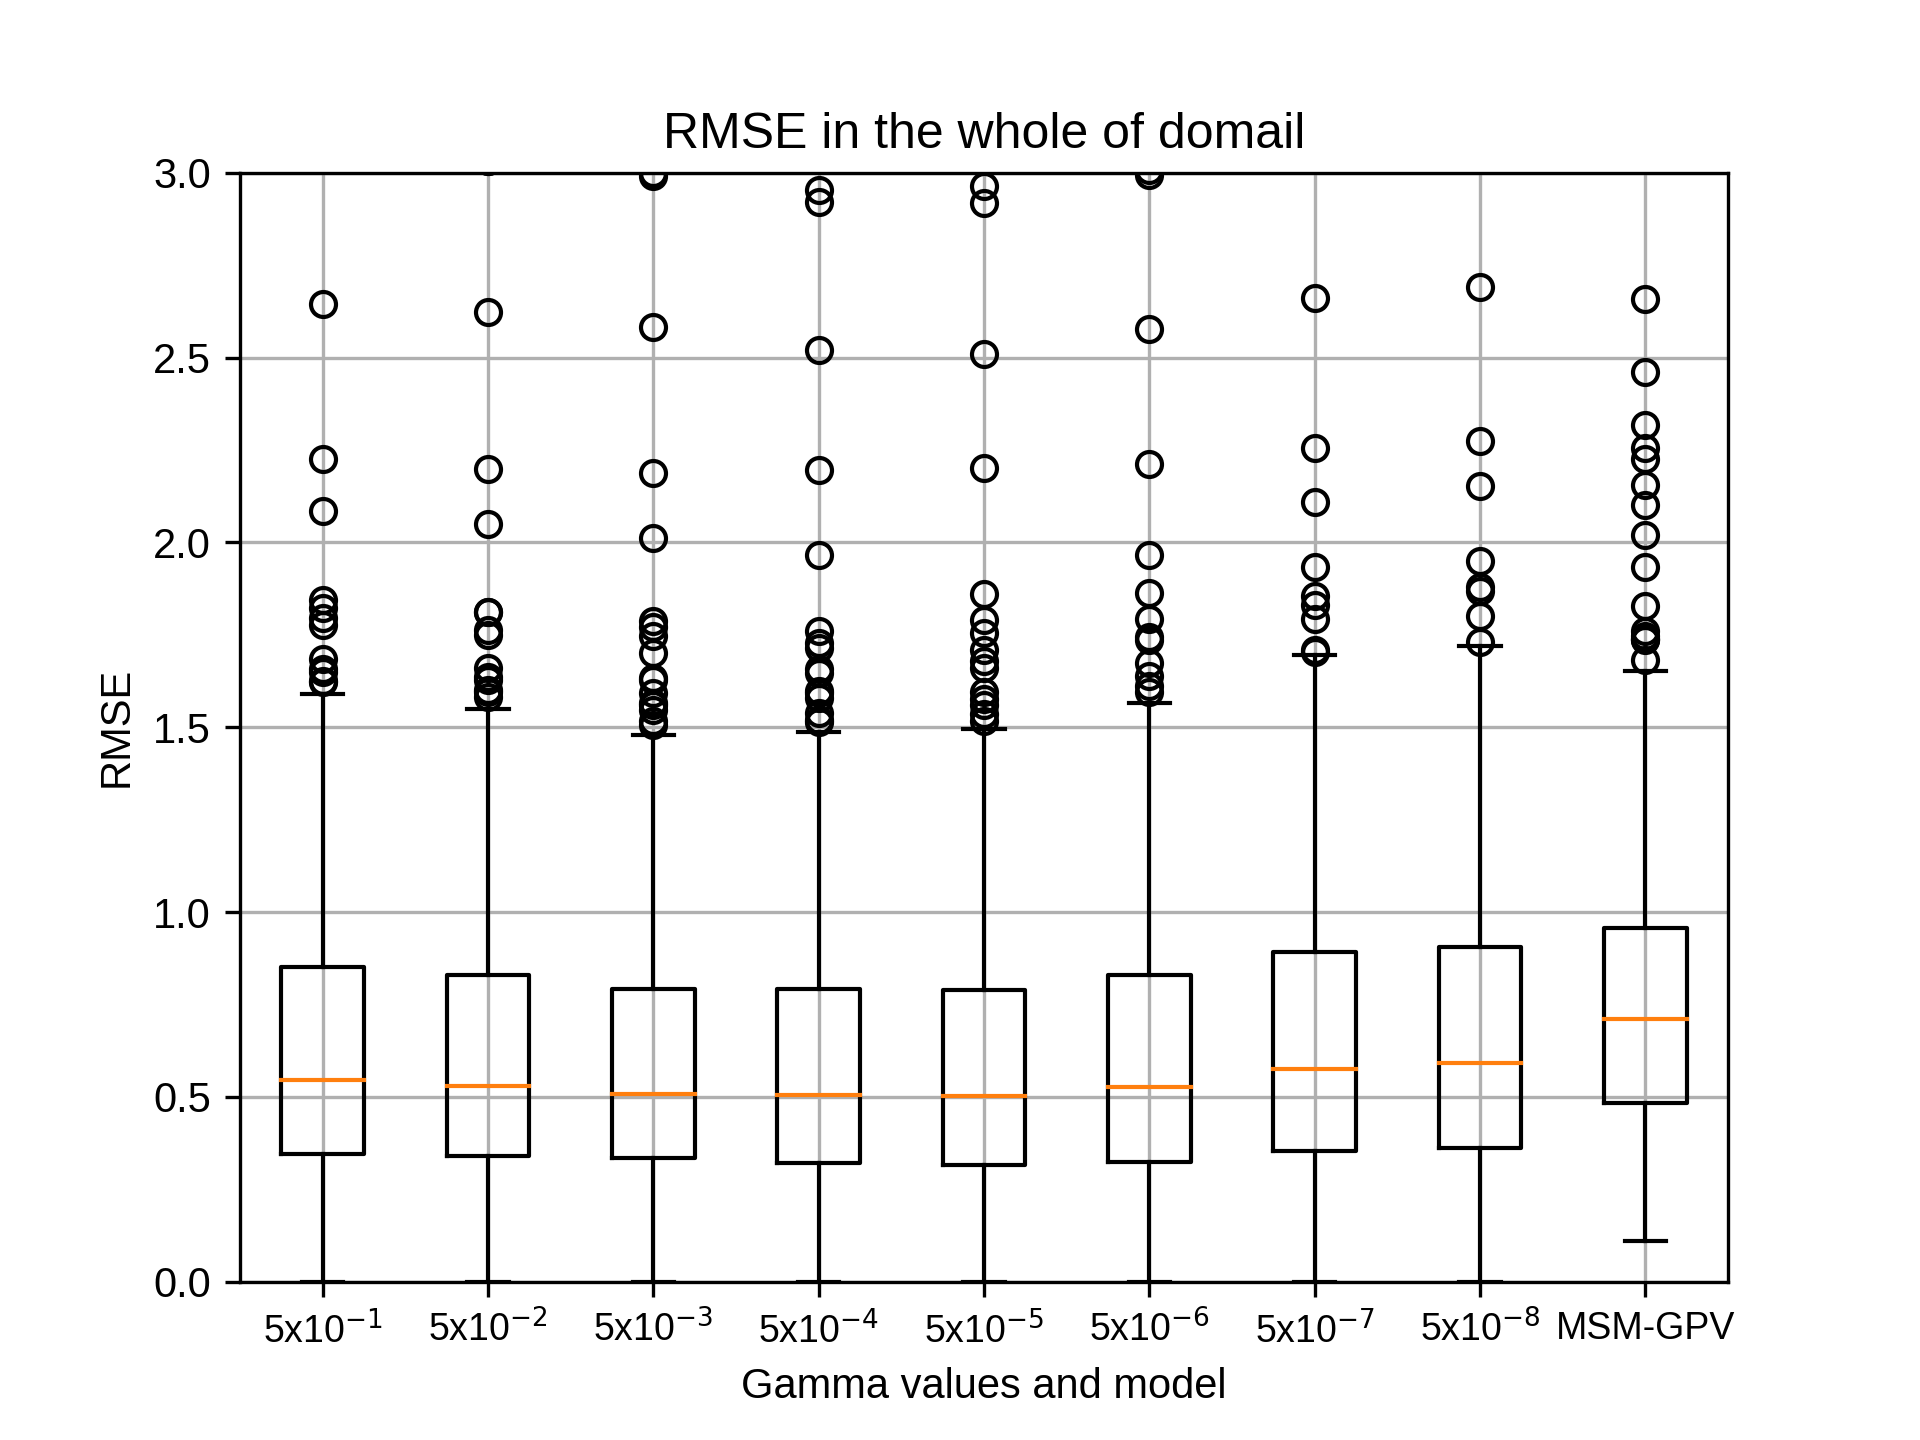
1月のsiteD,rg2=6の結果です。
kobayashi_yusukeThursday, October 22nd, 2020 at 4:17:43 PM GMT+09:00
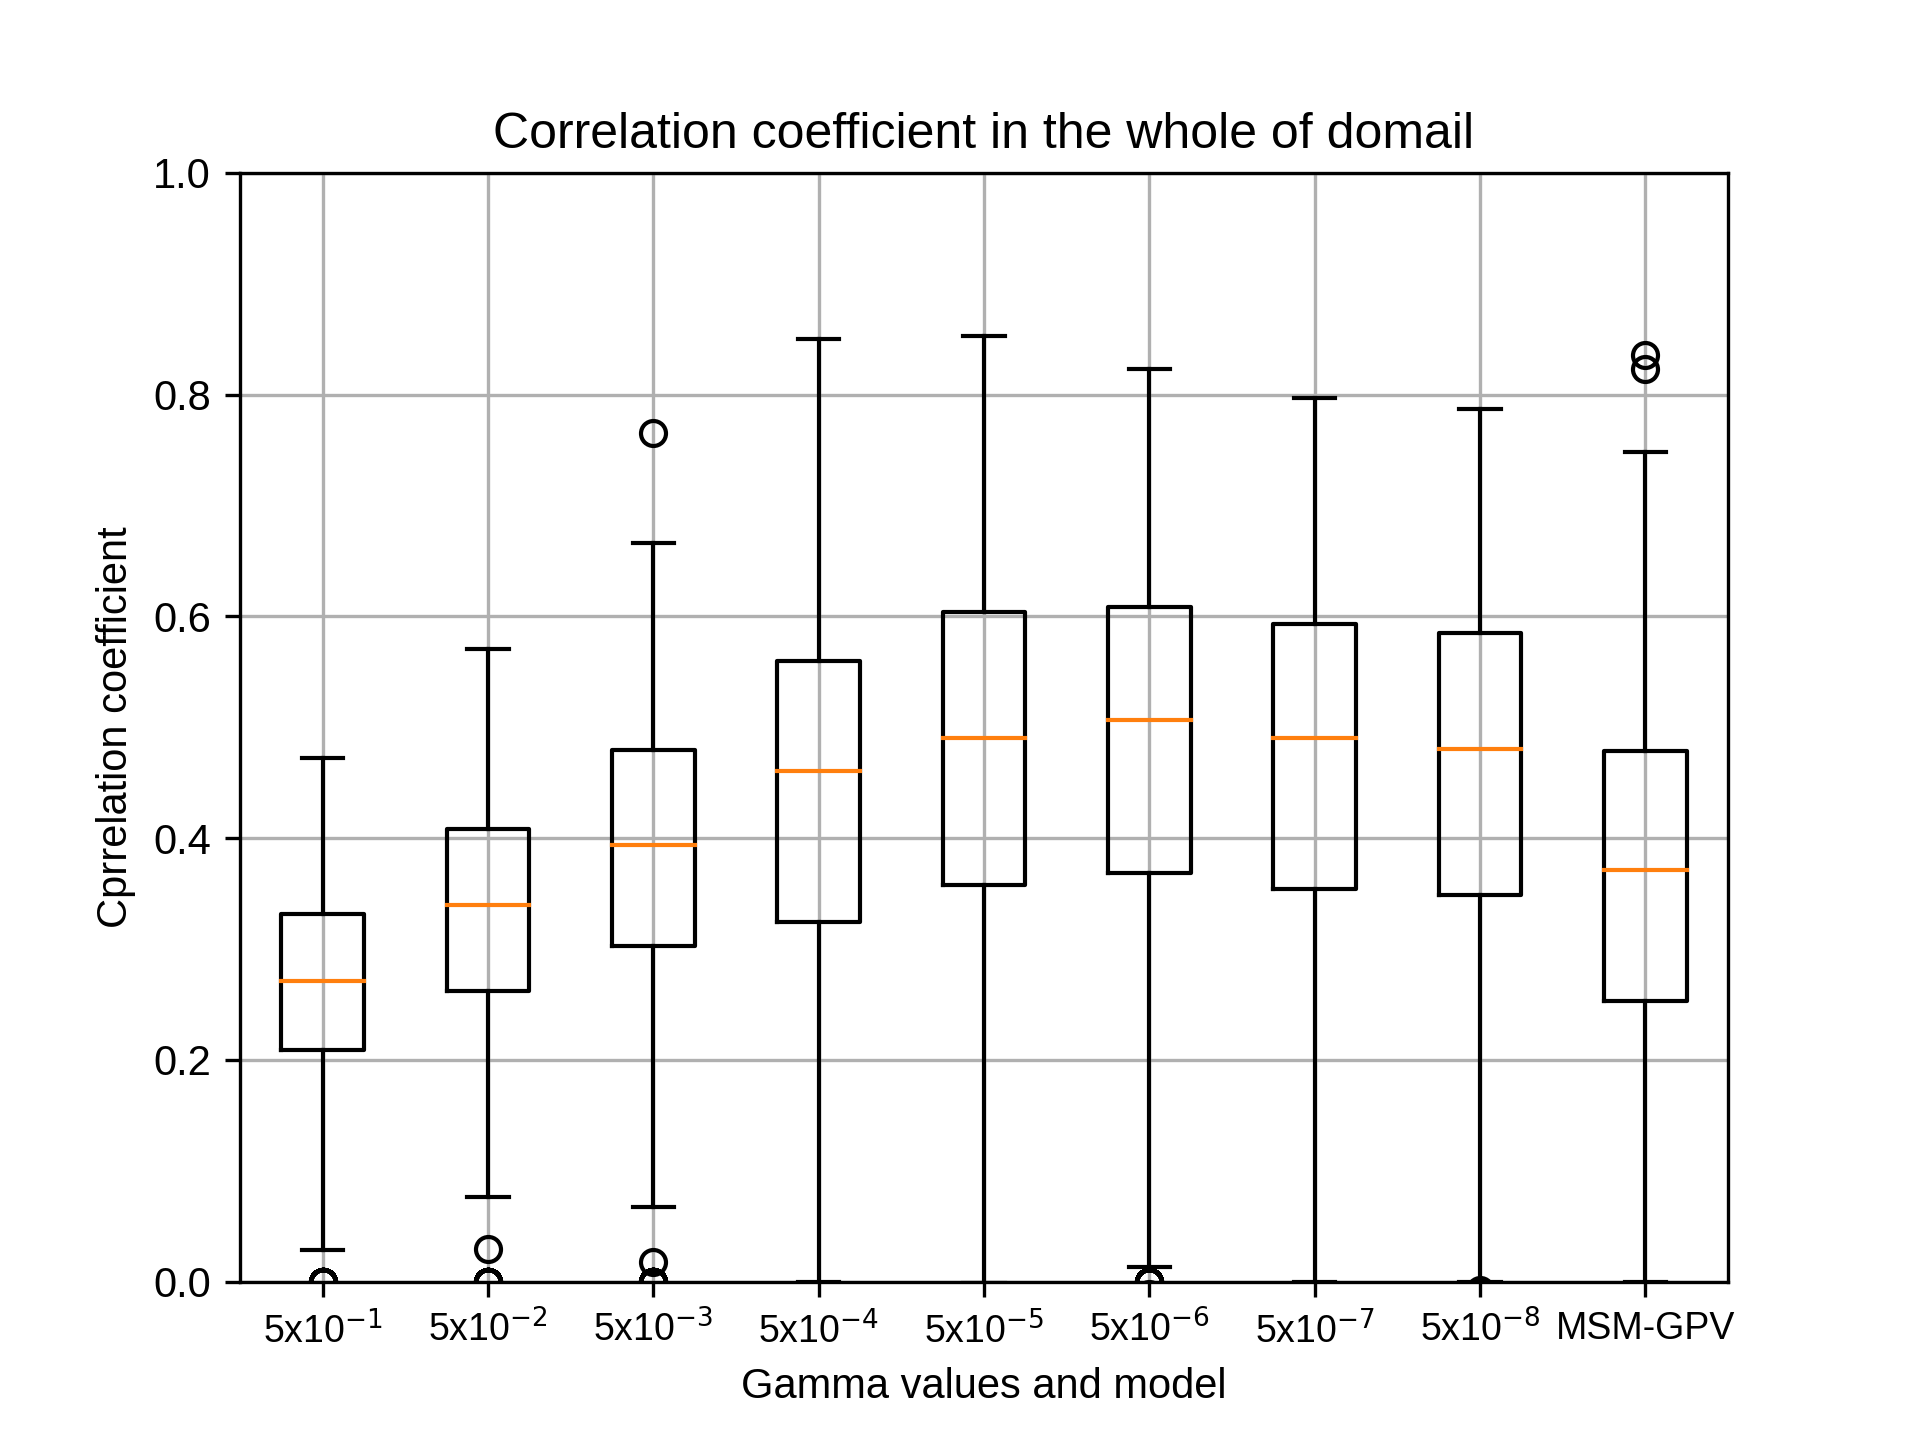
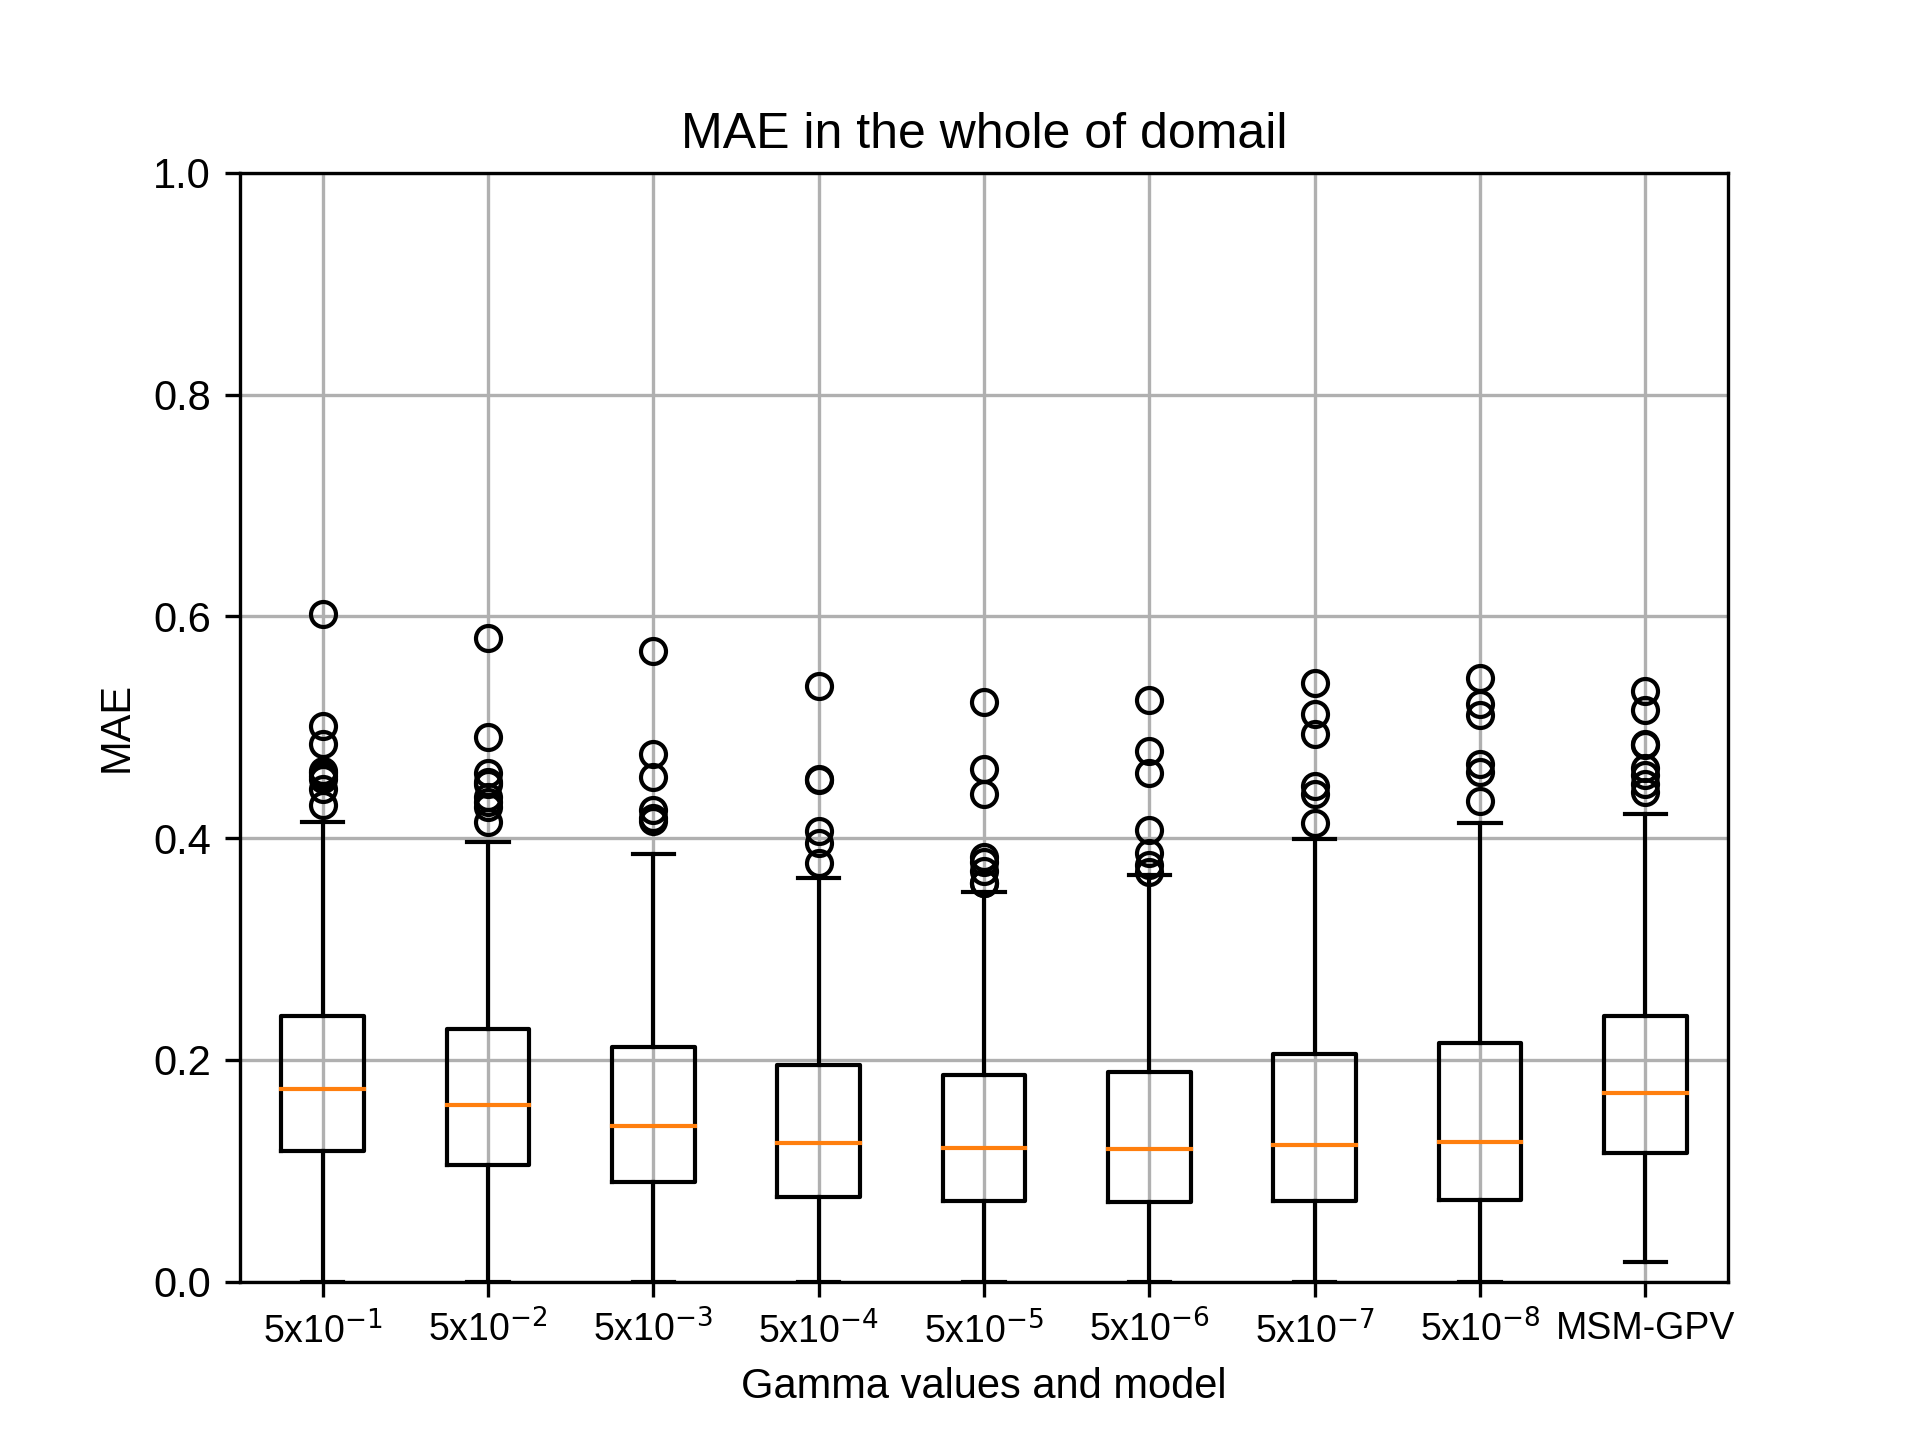
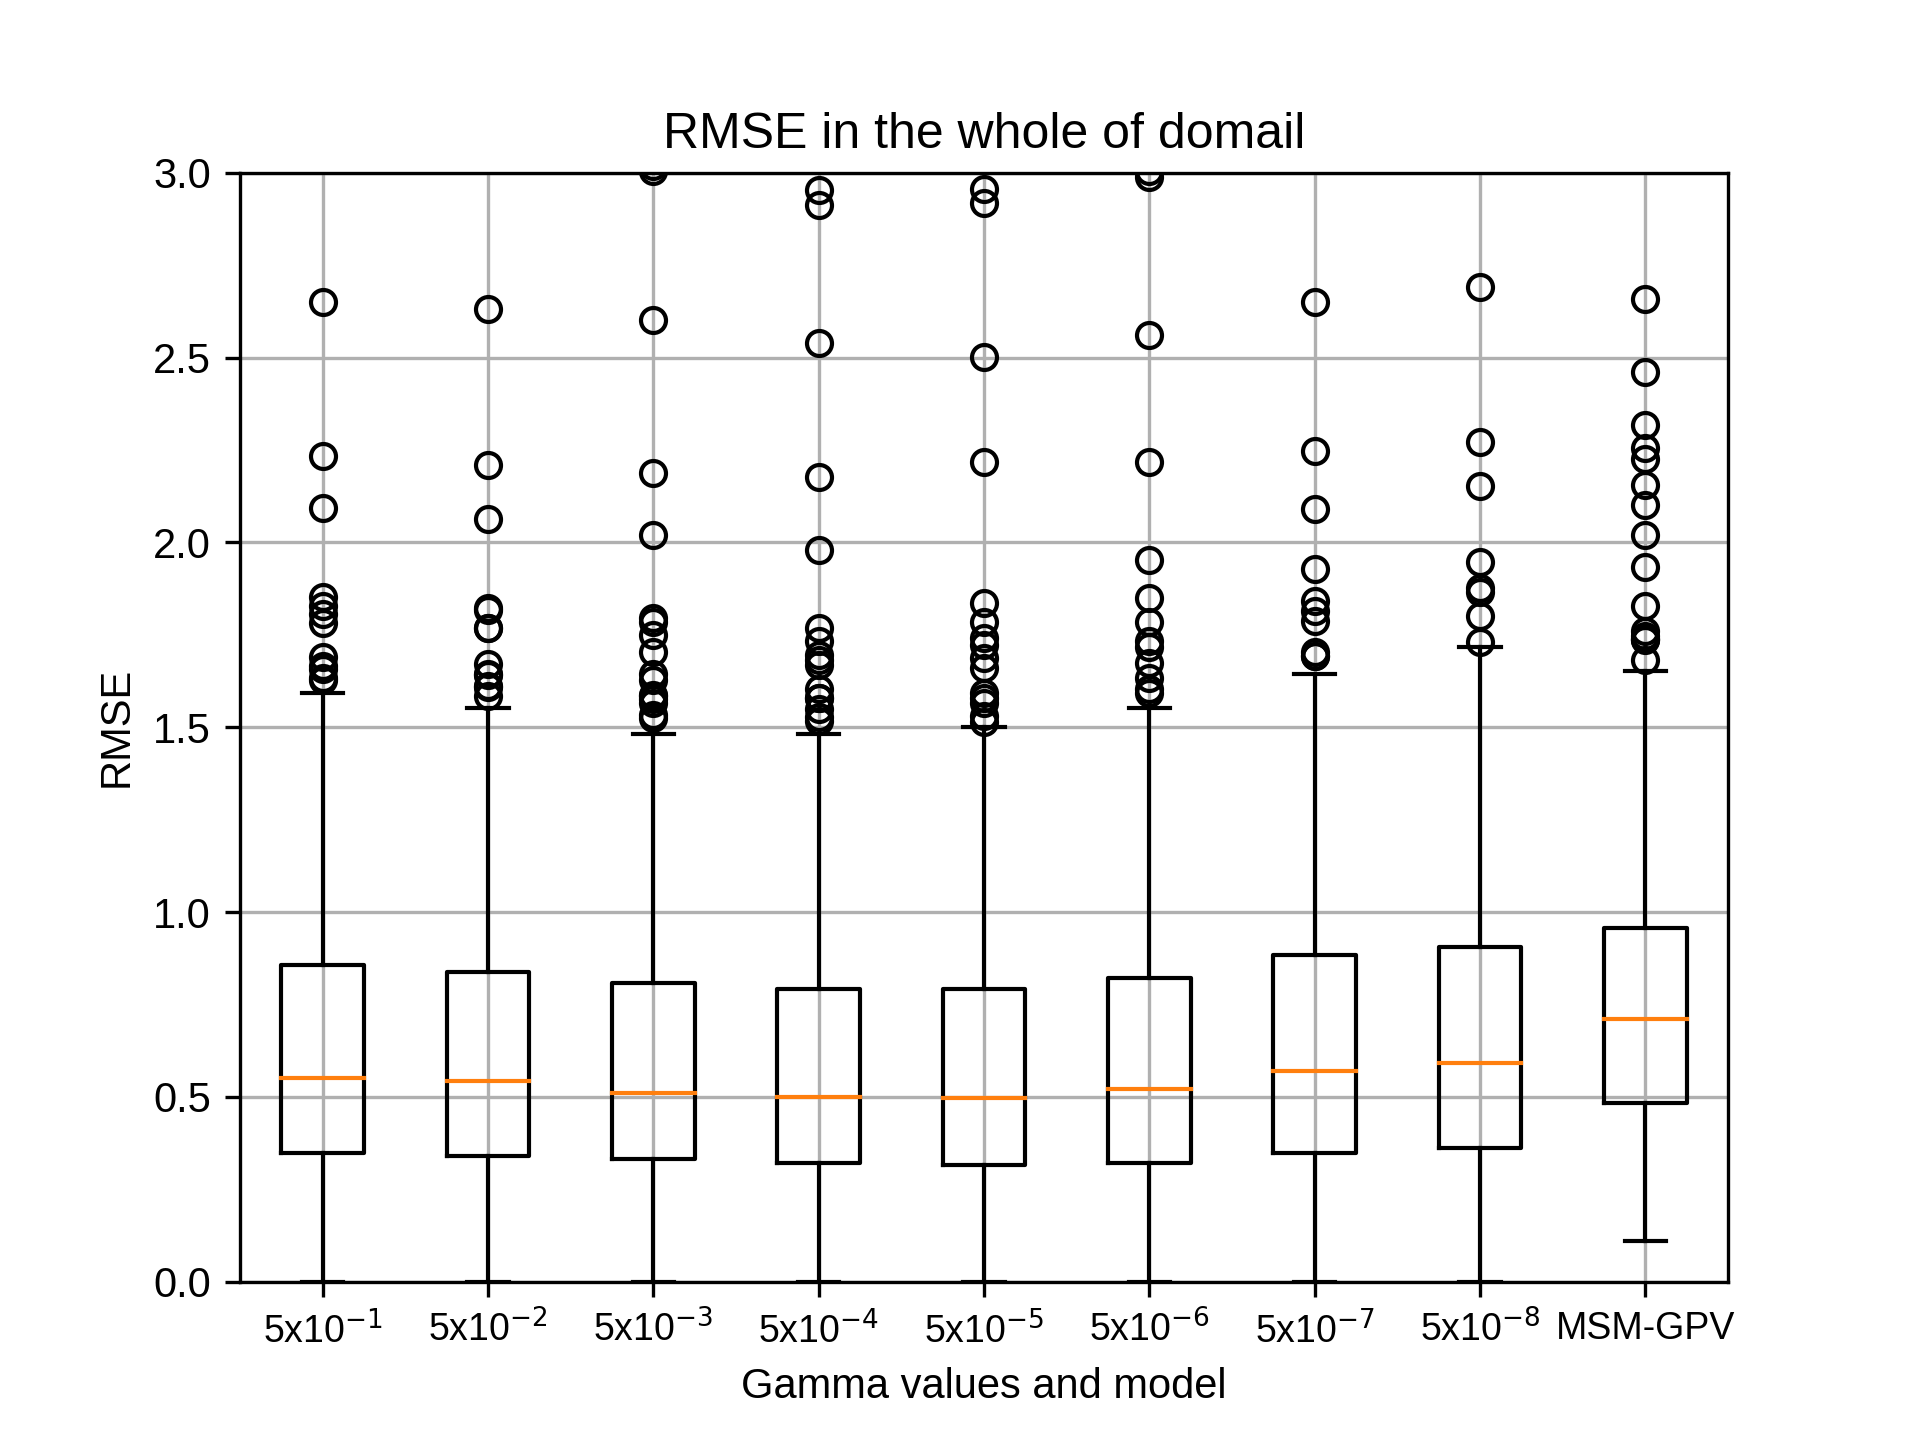
1月のsiteD,rg2=8の結果です。
kobayashi_yusukeThursday, October 22nd, 2020 at 4:18:03 PM GMT+09:00
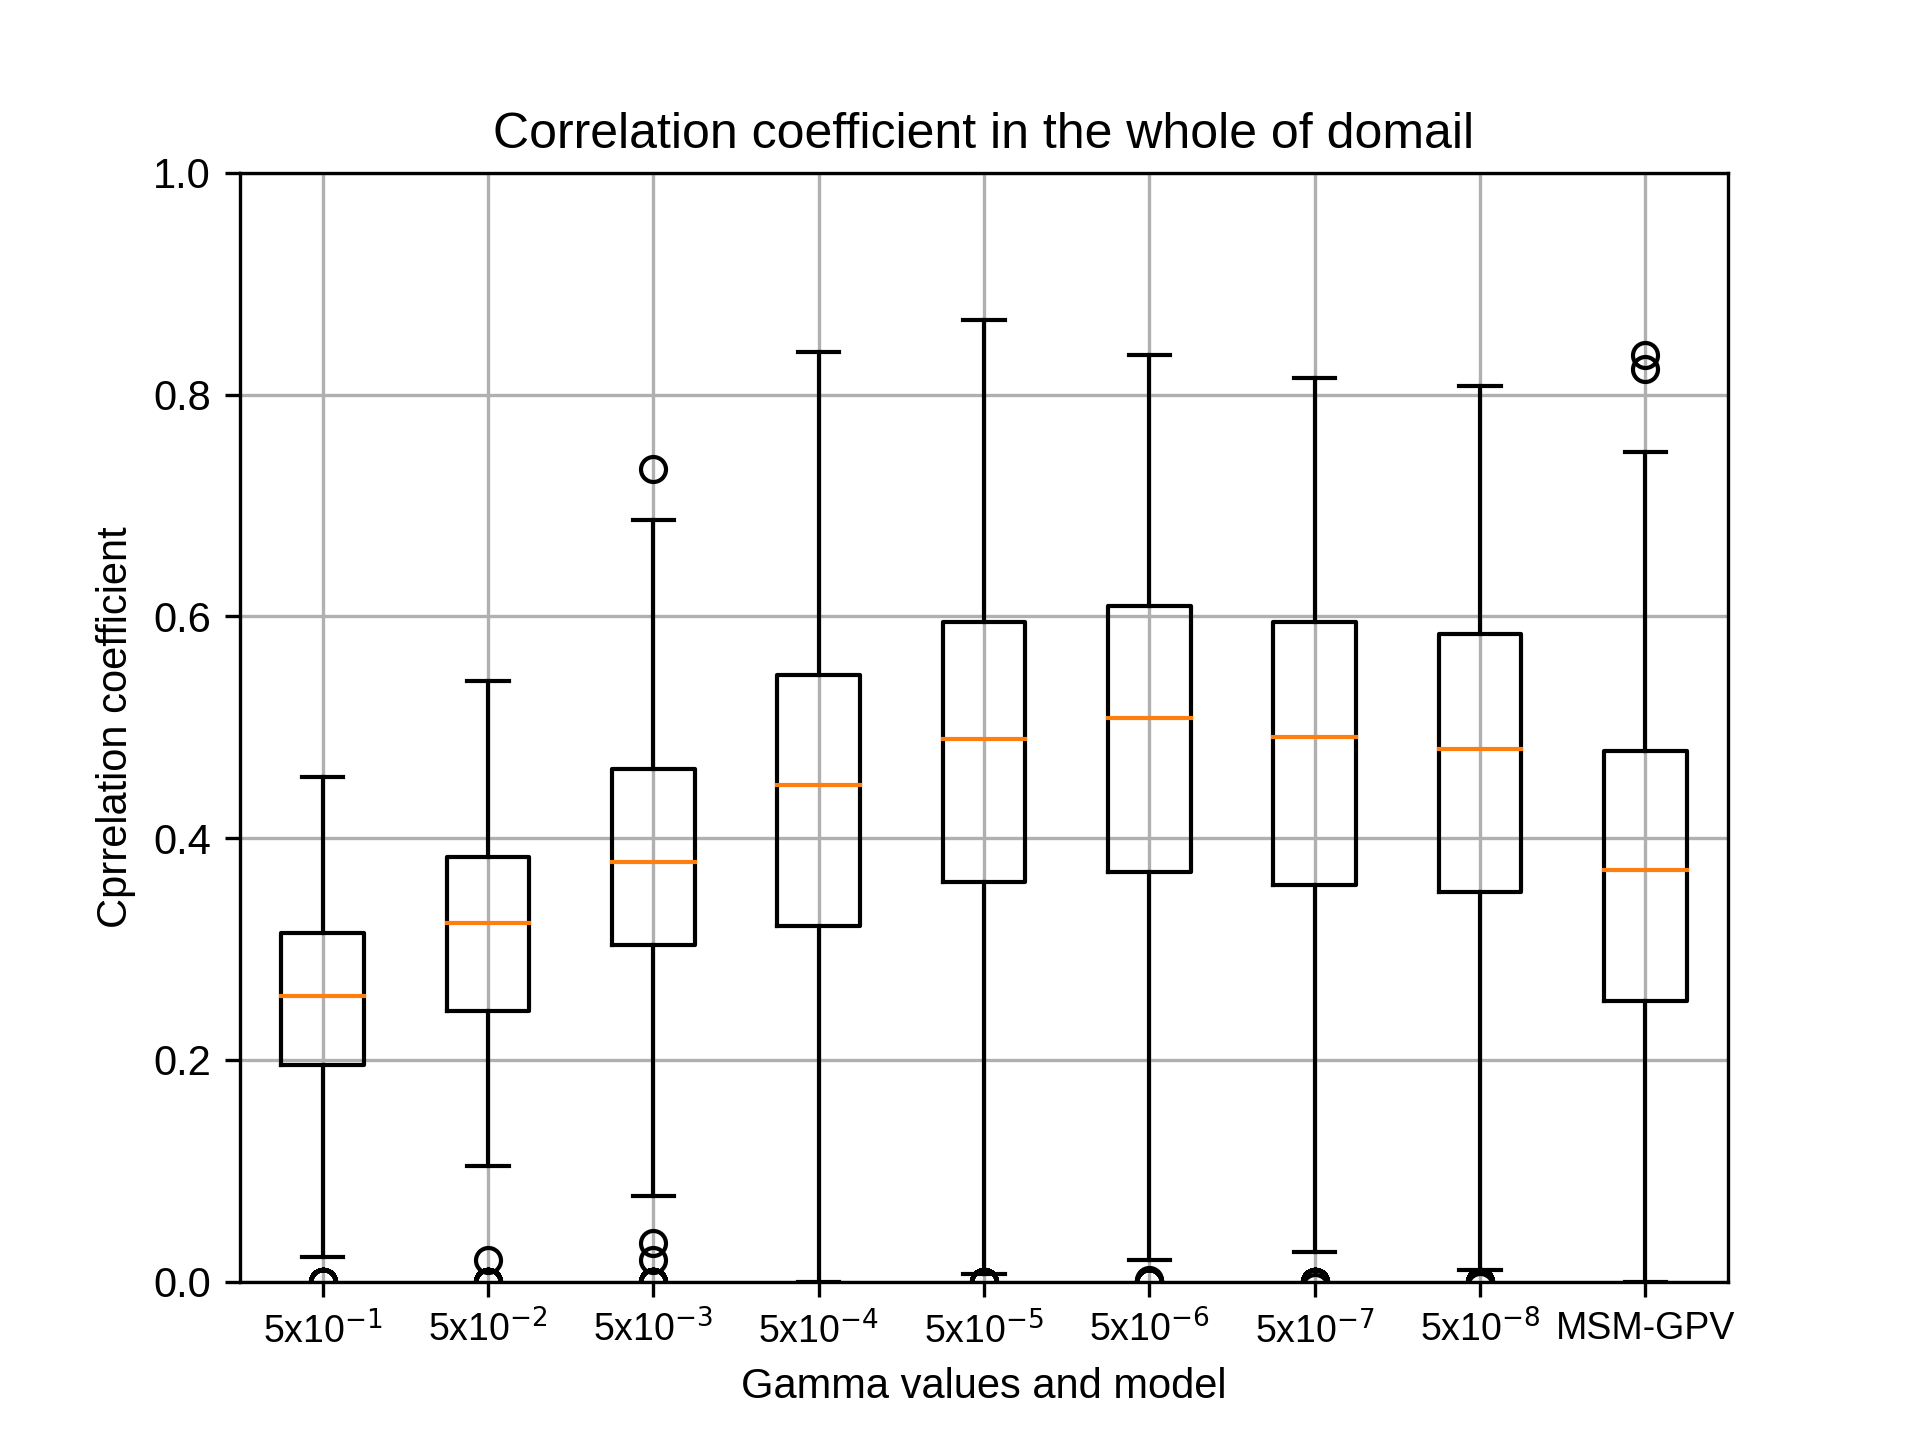


1月のsiteD,rg2=10の結果です。
kobayashi_yusukeThursday, October 22nd, 2020 at 4:18:20 PM GMT+09:00
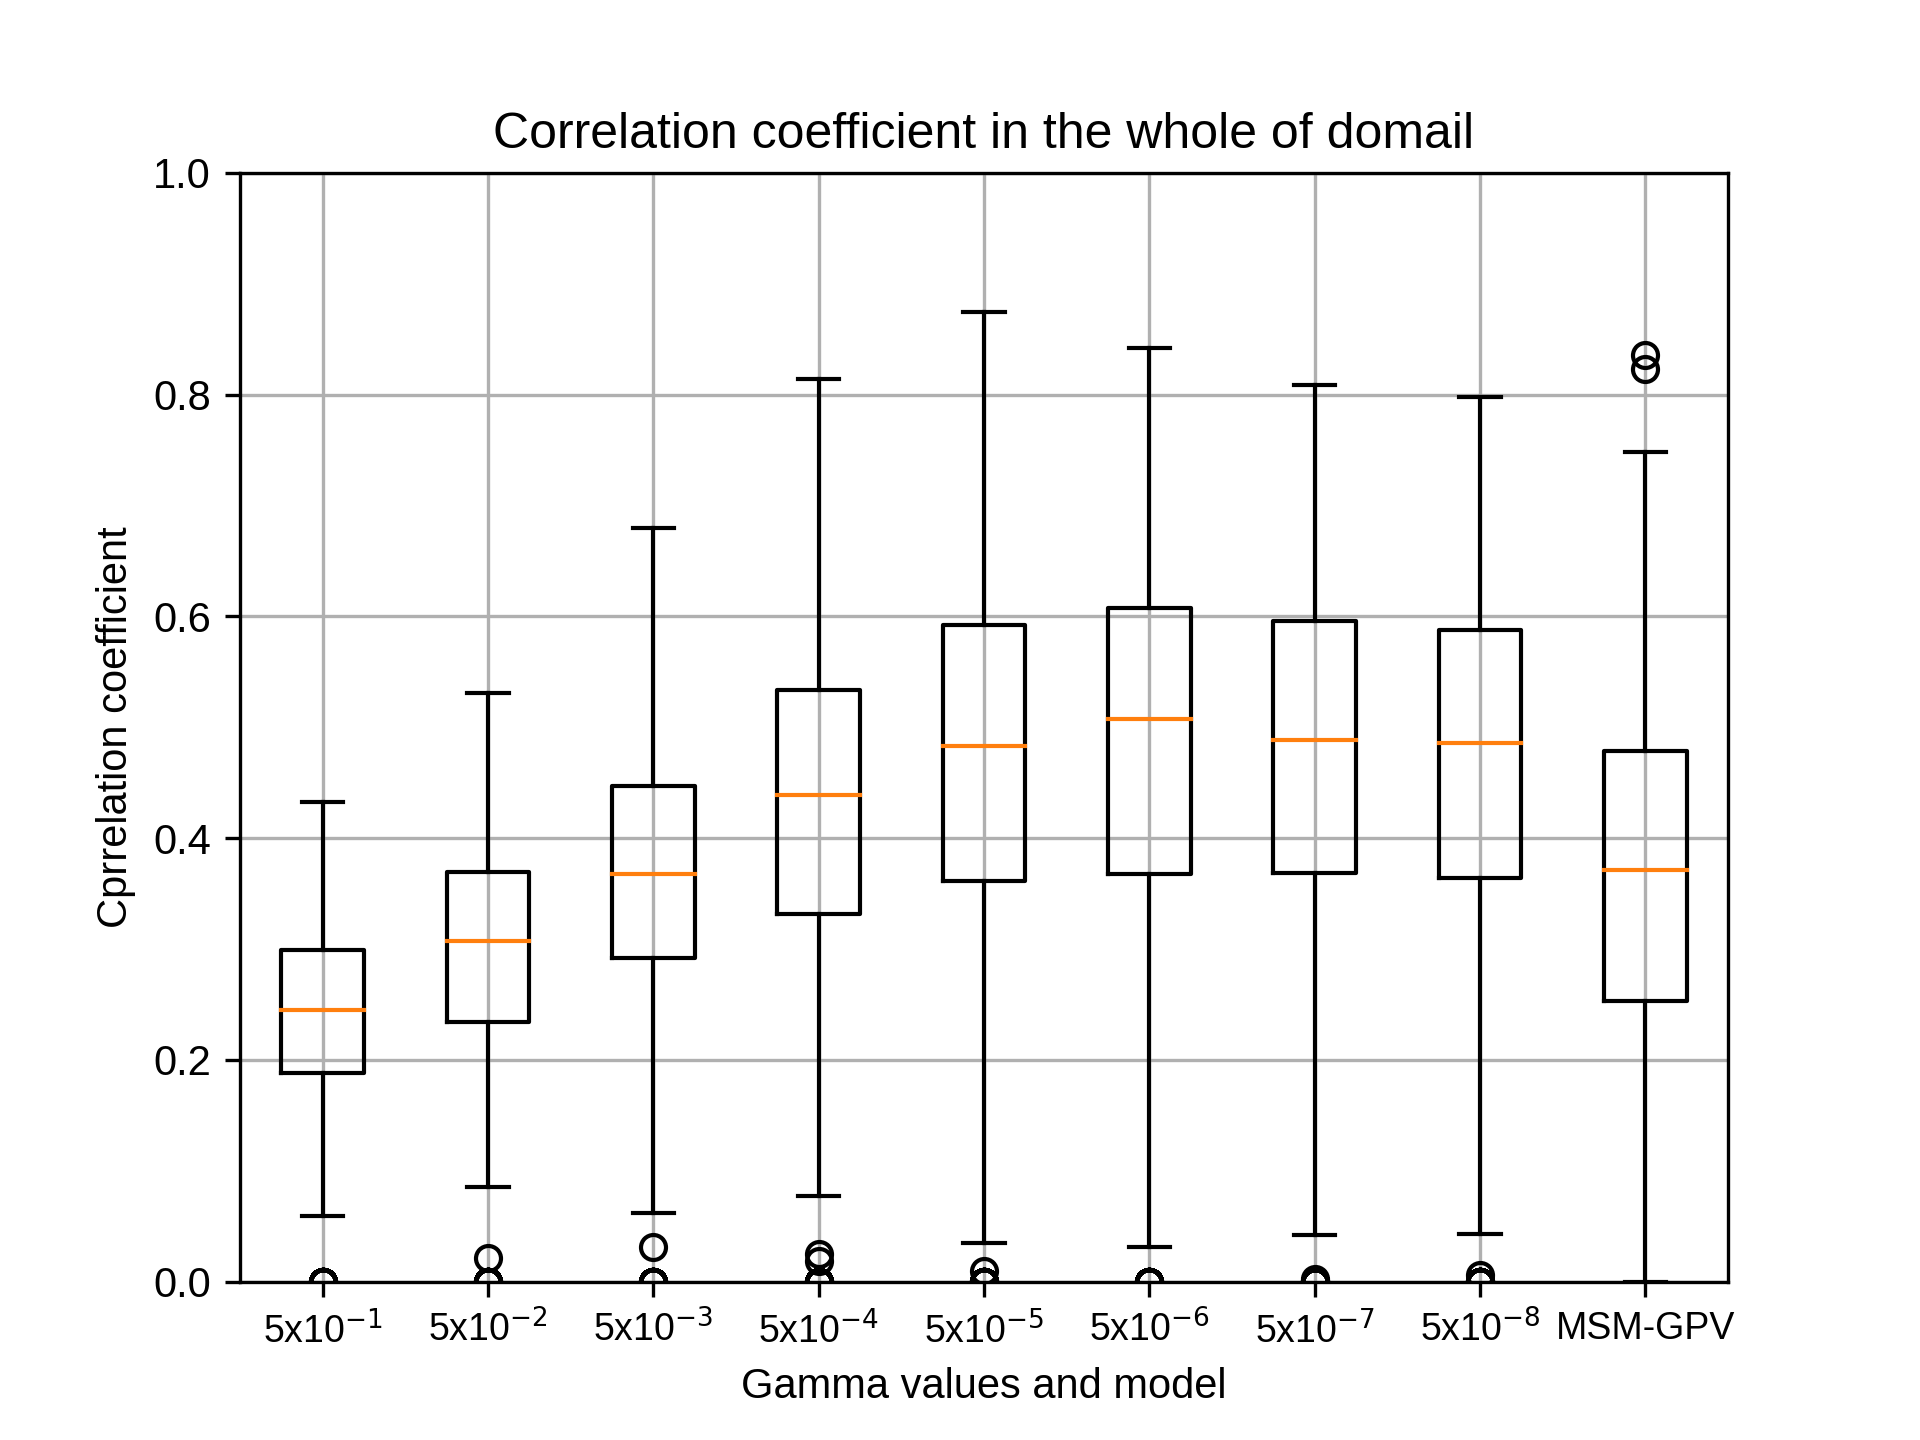
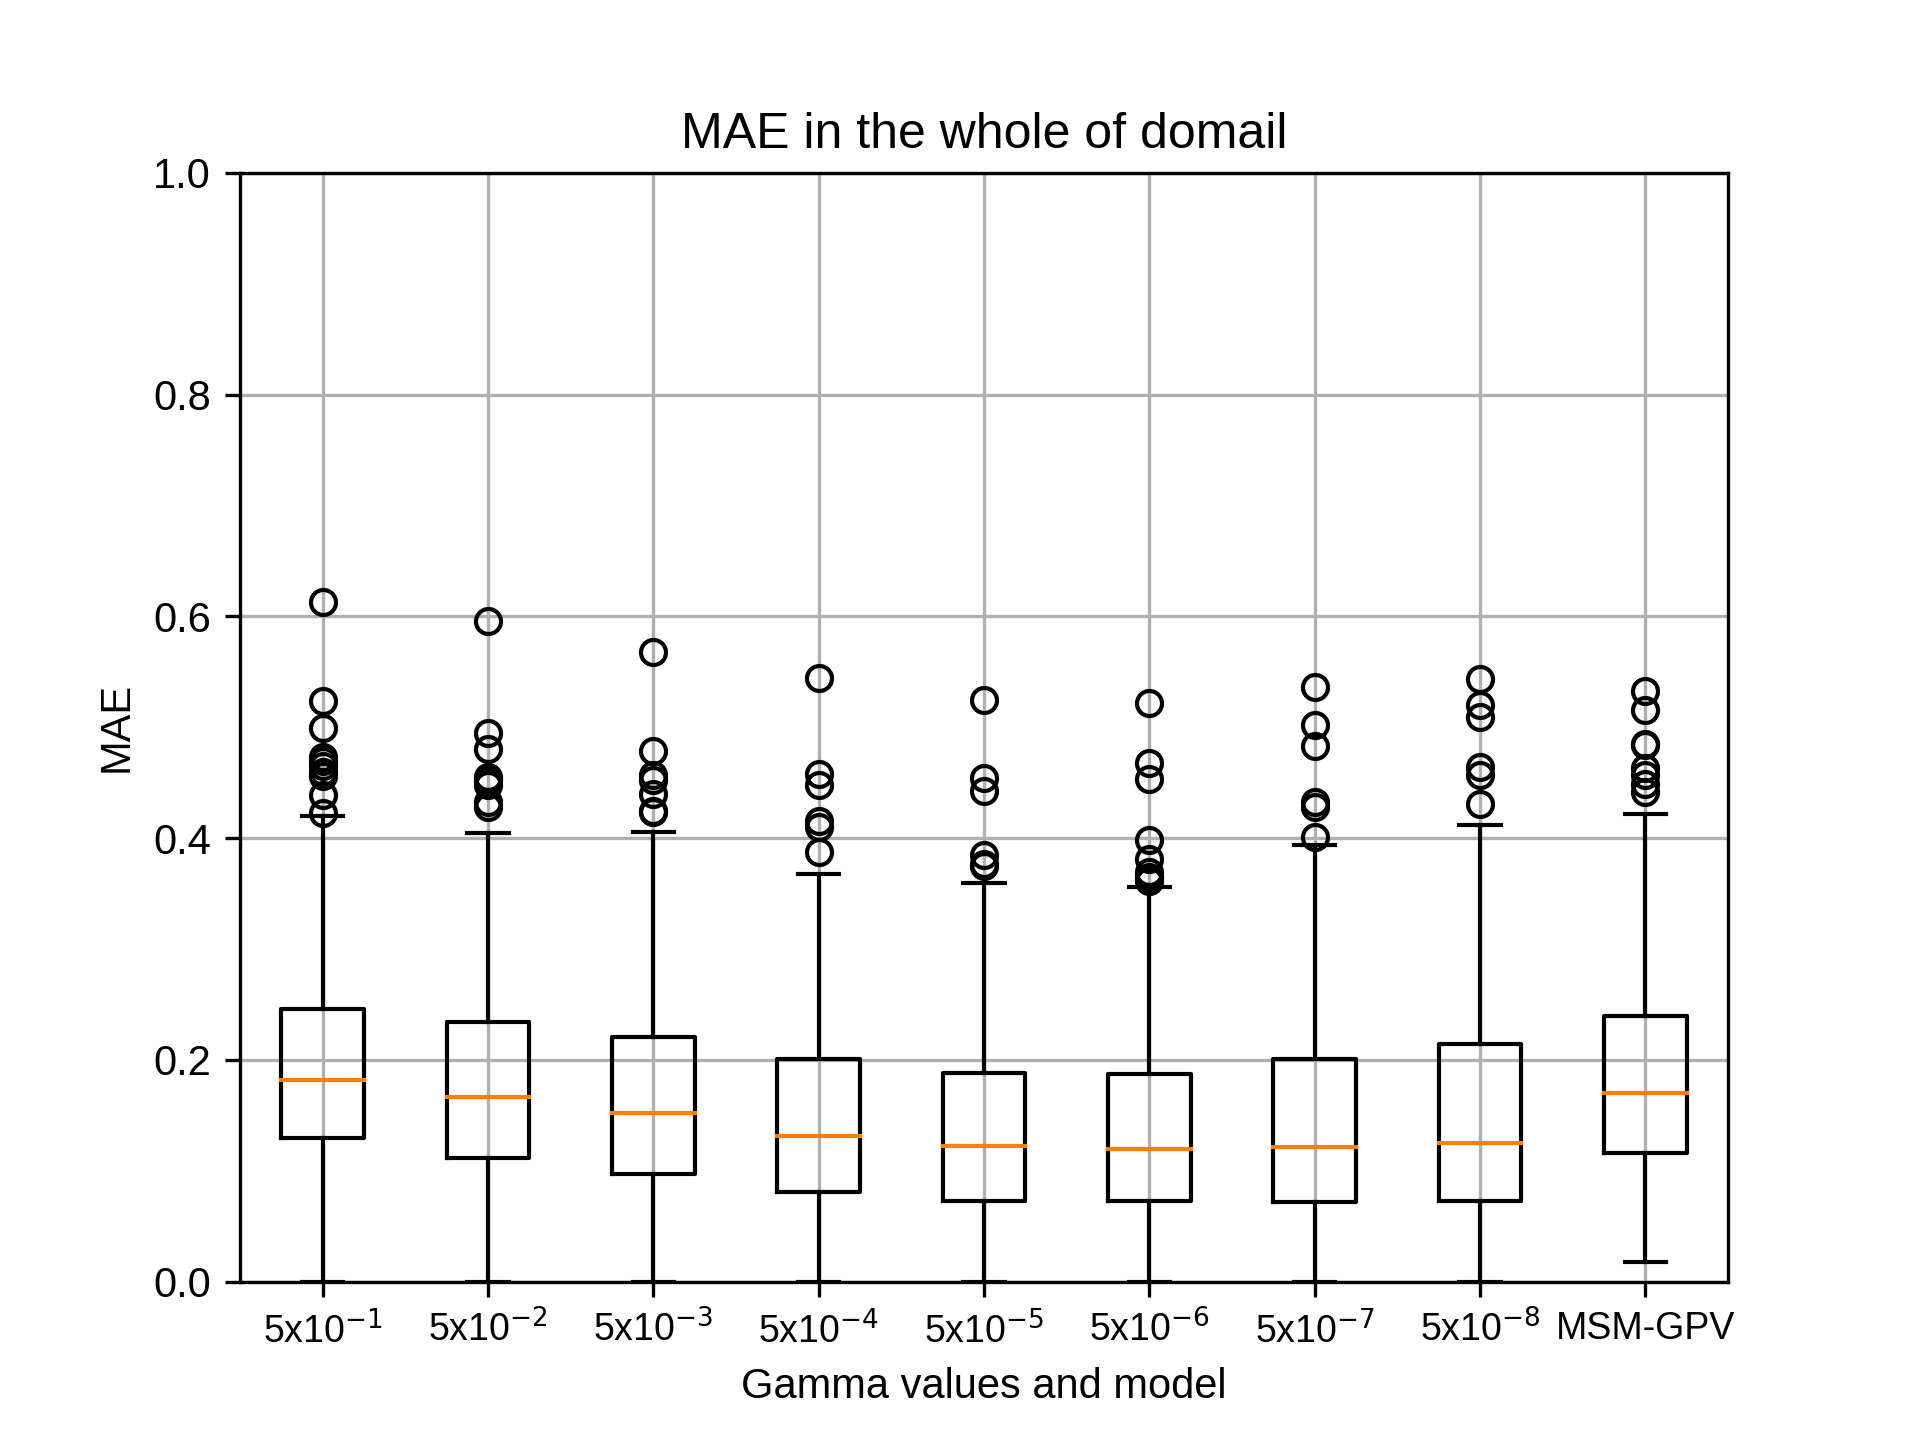
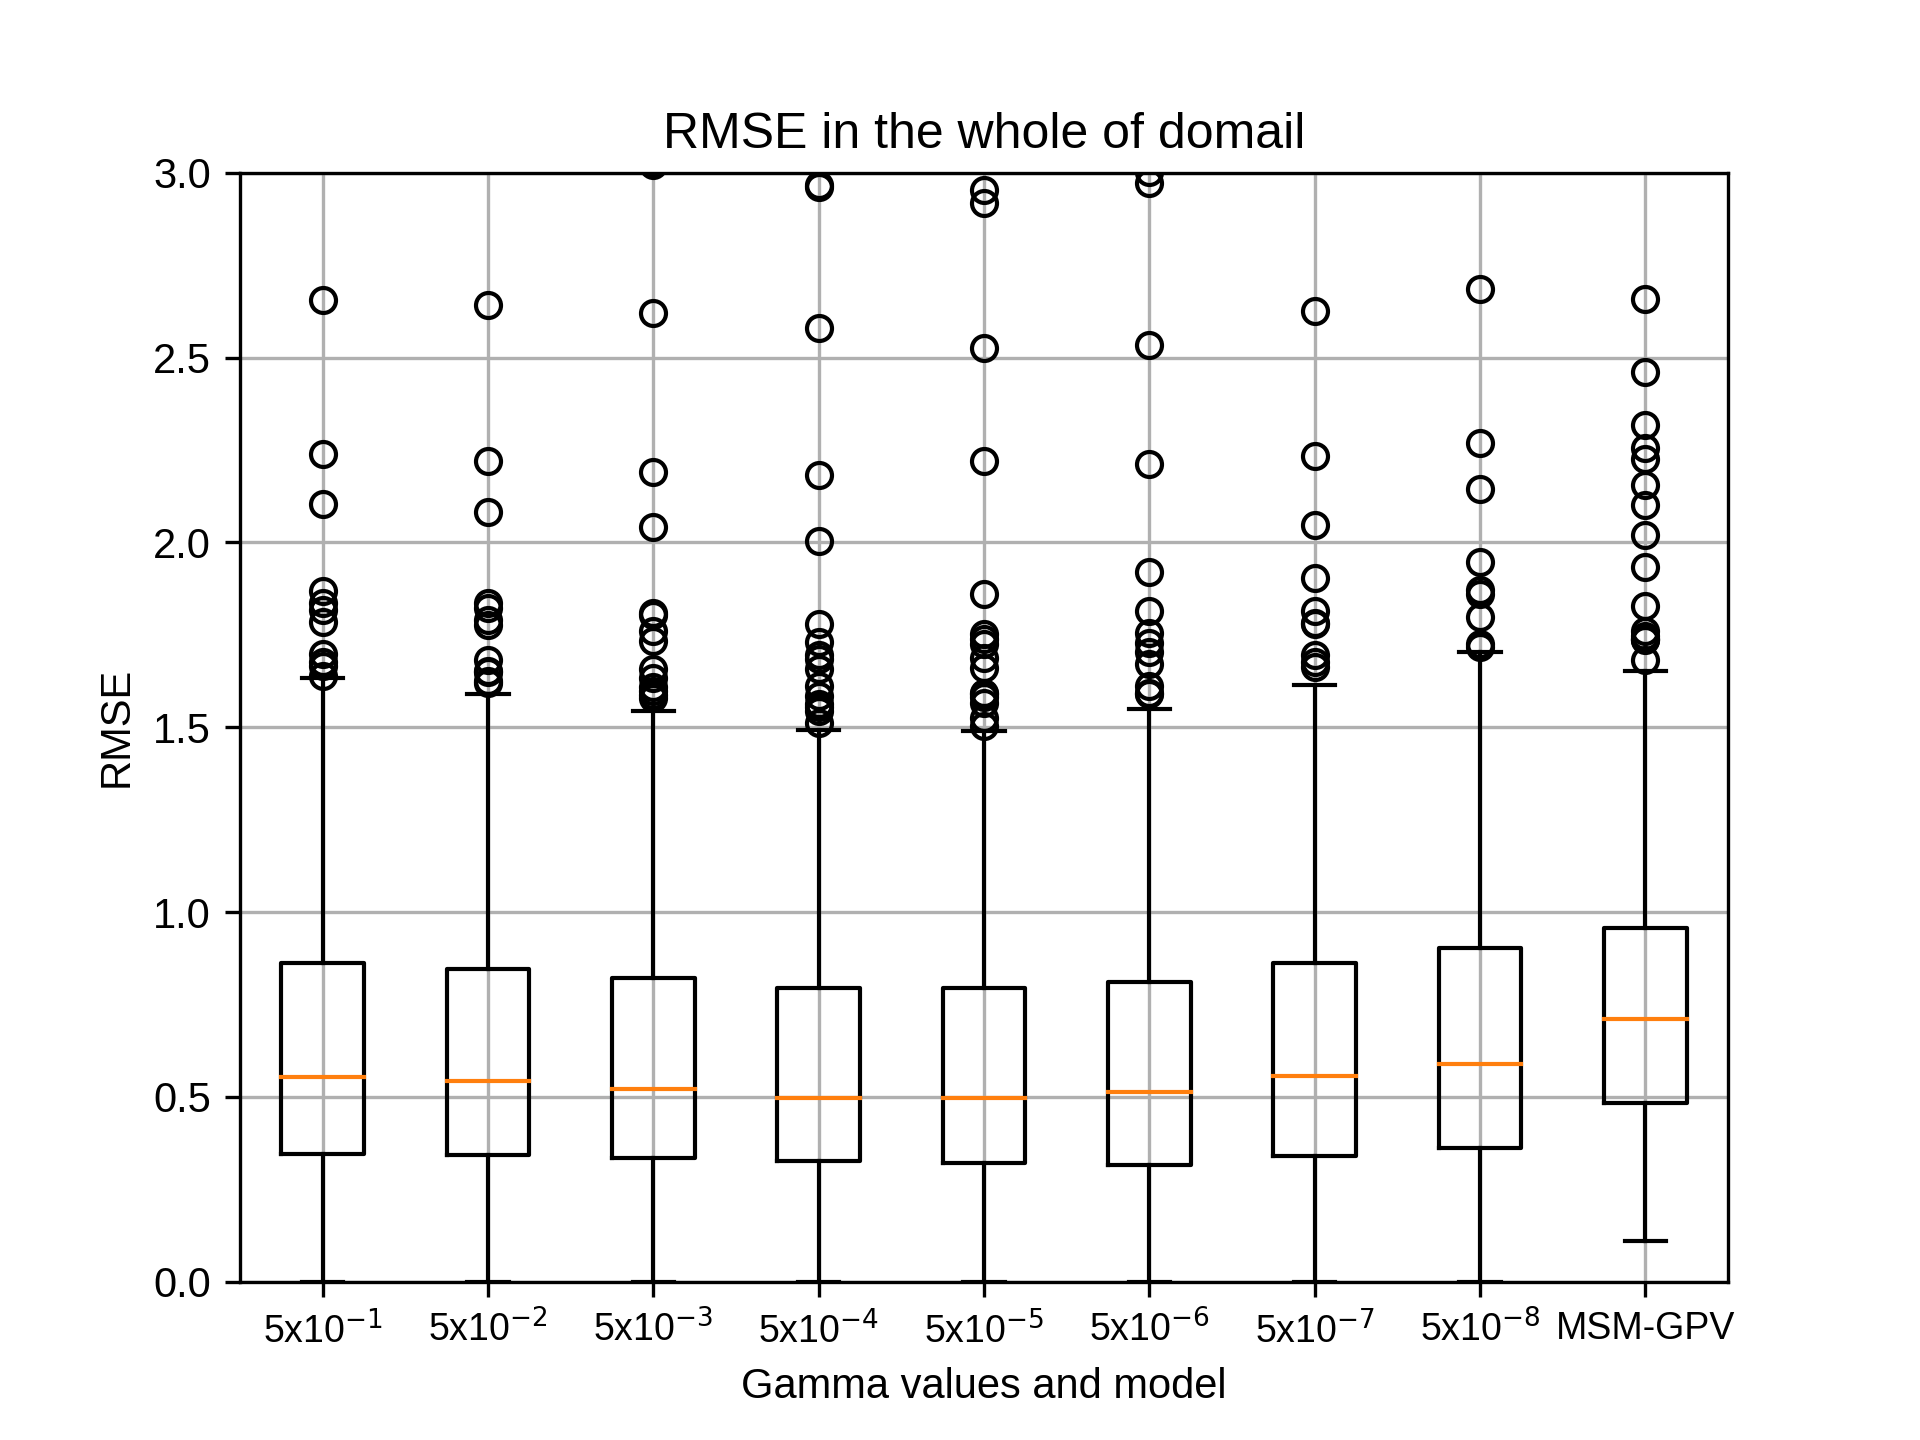
1月のsiteD,rg2=12の結果です。
1月のsiteDではrg2=10でgammaが5x10⁻⁶のとき、相関係数の中央値が最も高くなりました。
1月のsiteDではrg2=10でgammaが5x10⁻⁶のとき、相関係数の中央値が最も高くなりました。
kobayashi_yusukeThursday, October 22nd, 2020 at 4:18:38 PM GMT+09:00
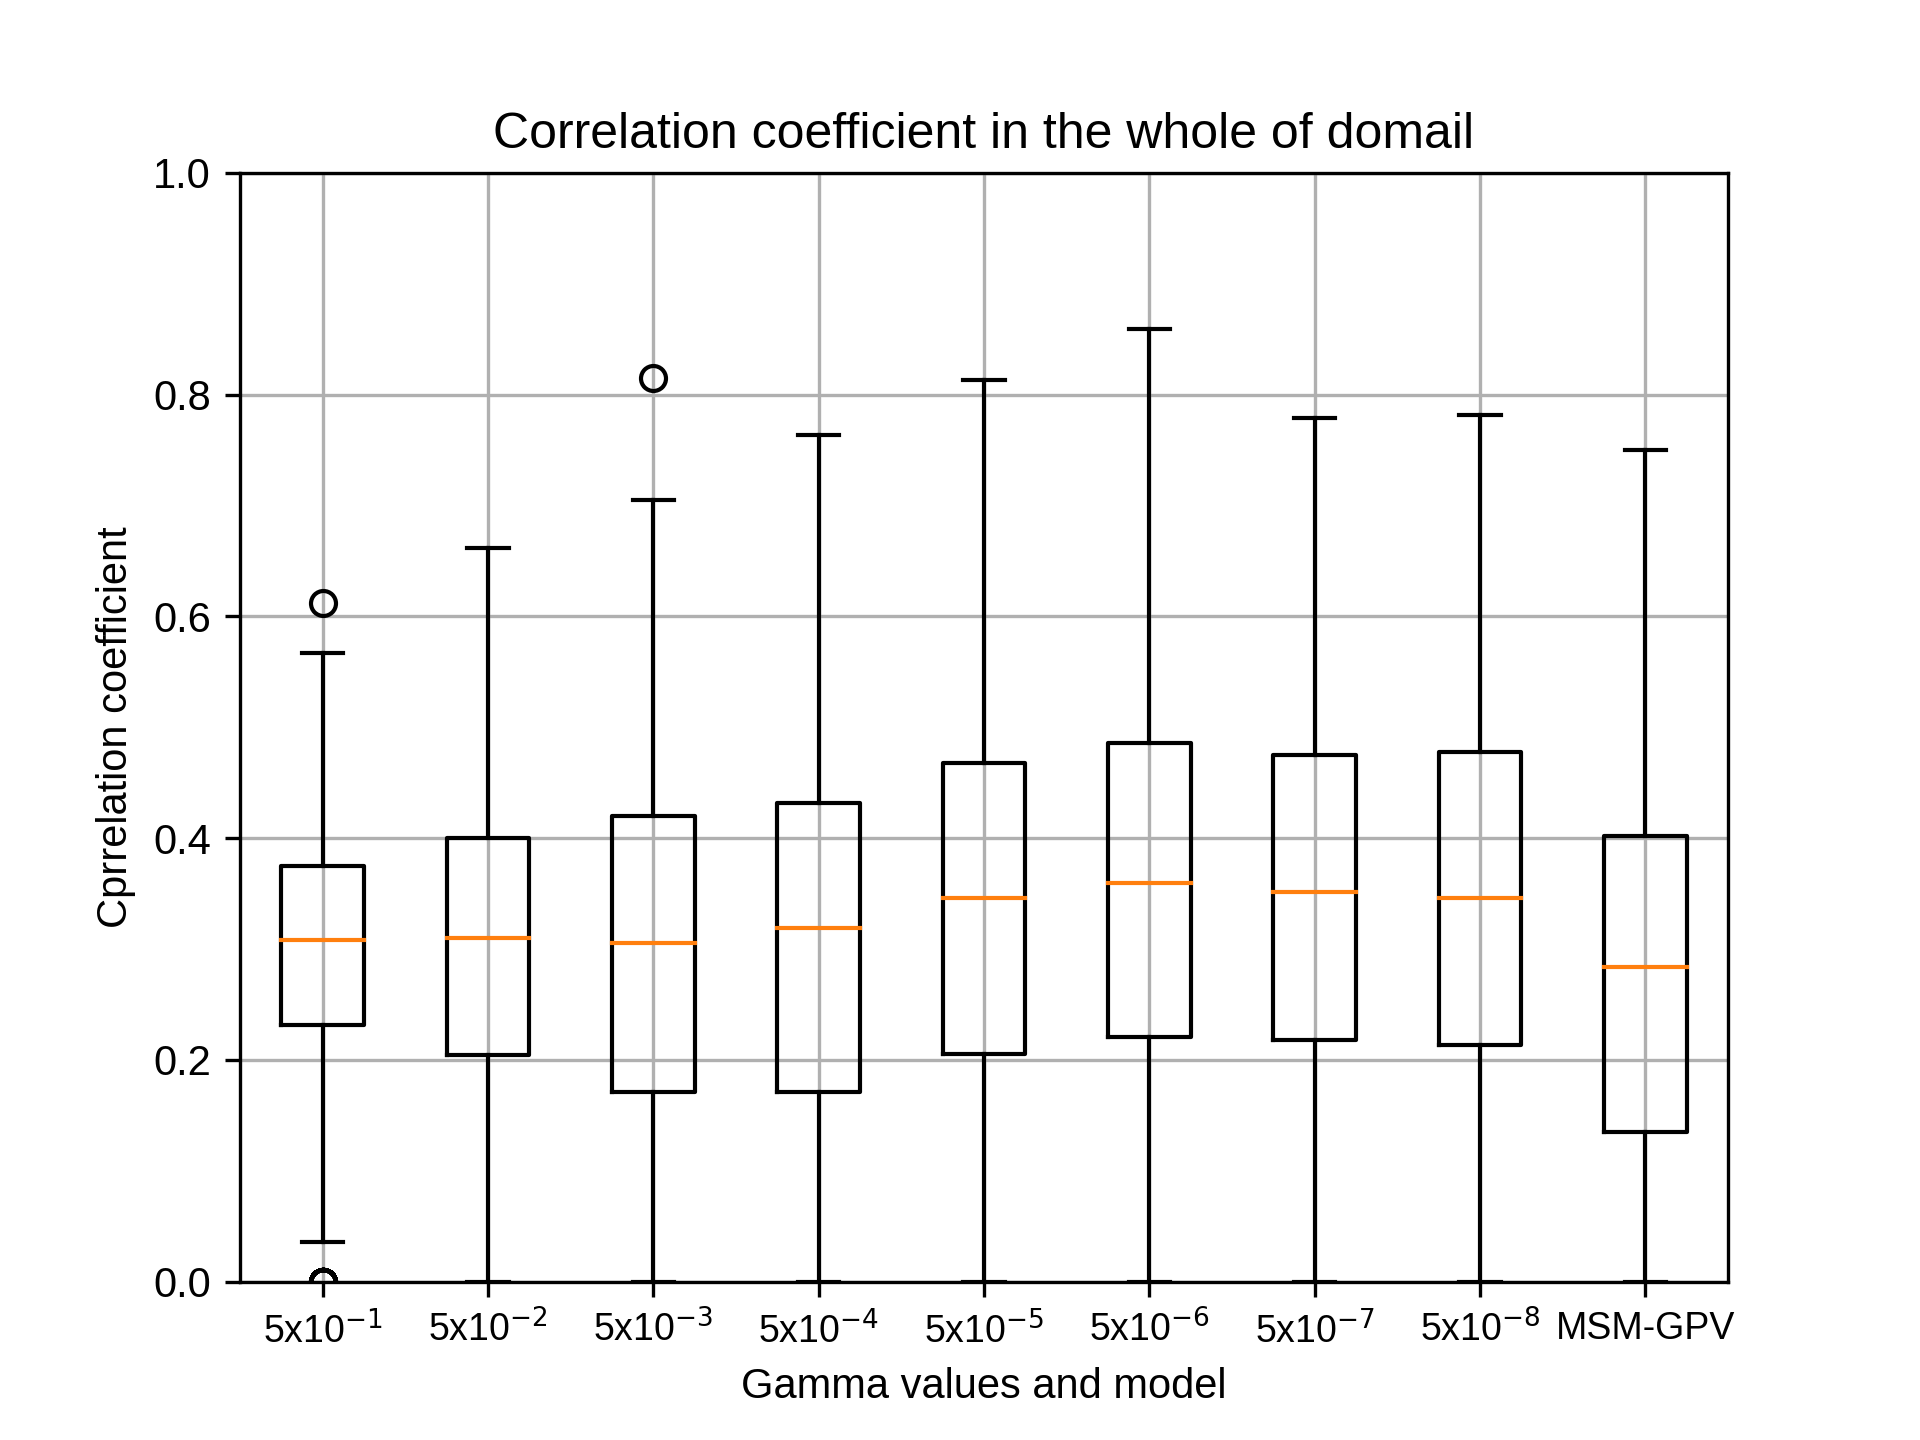
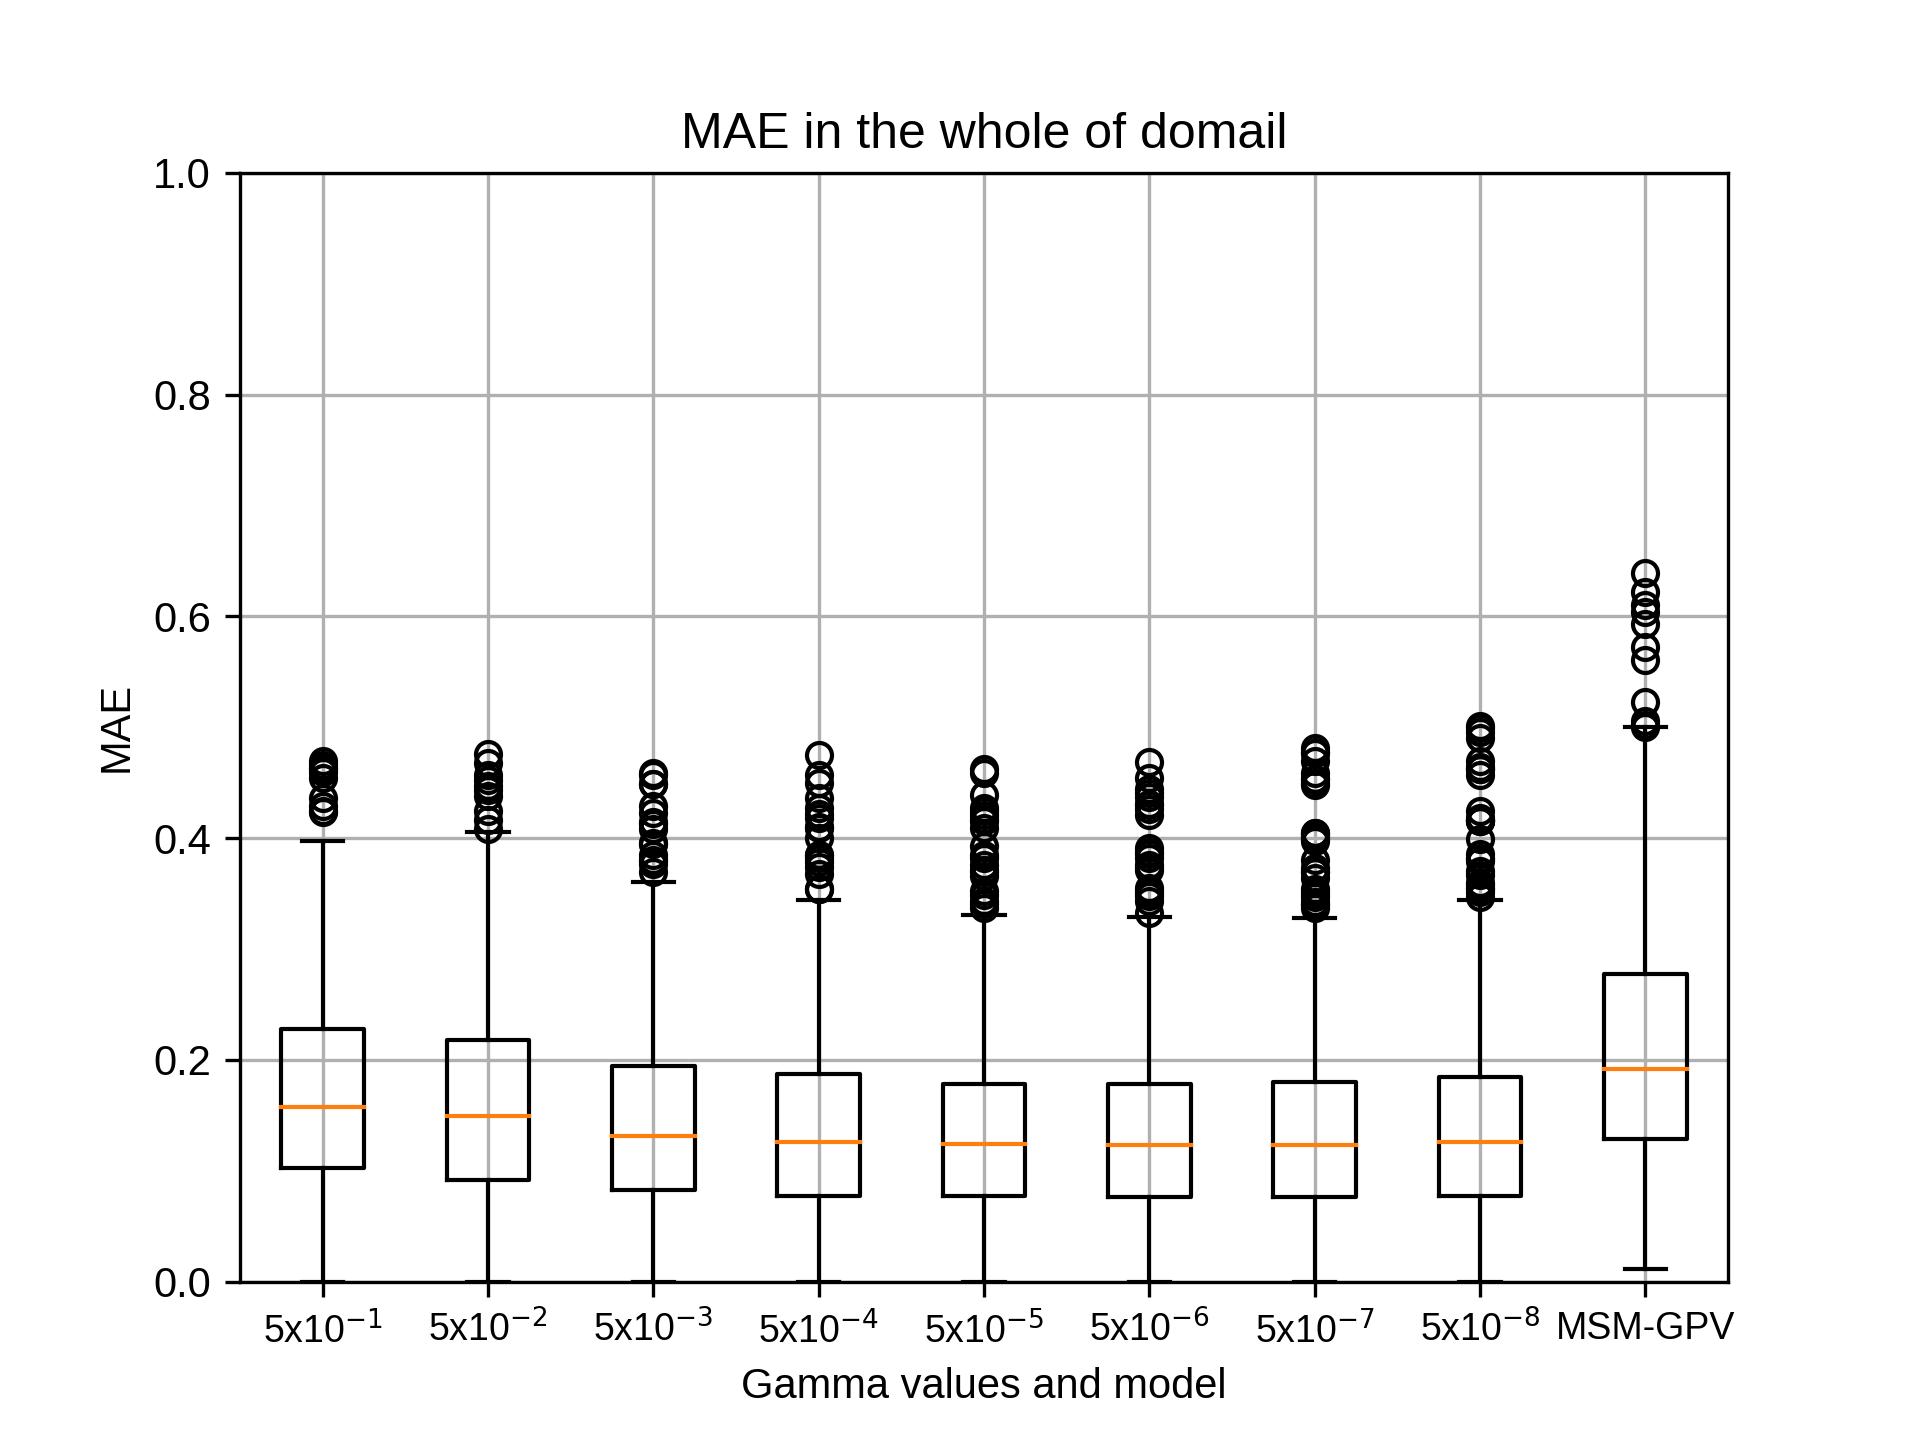
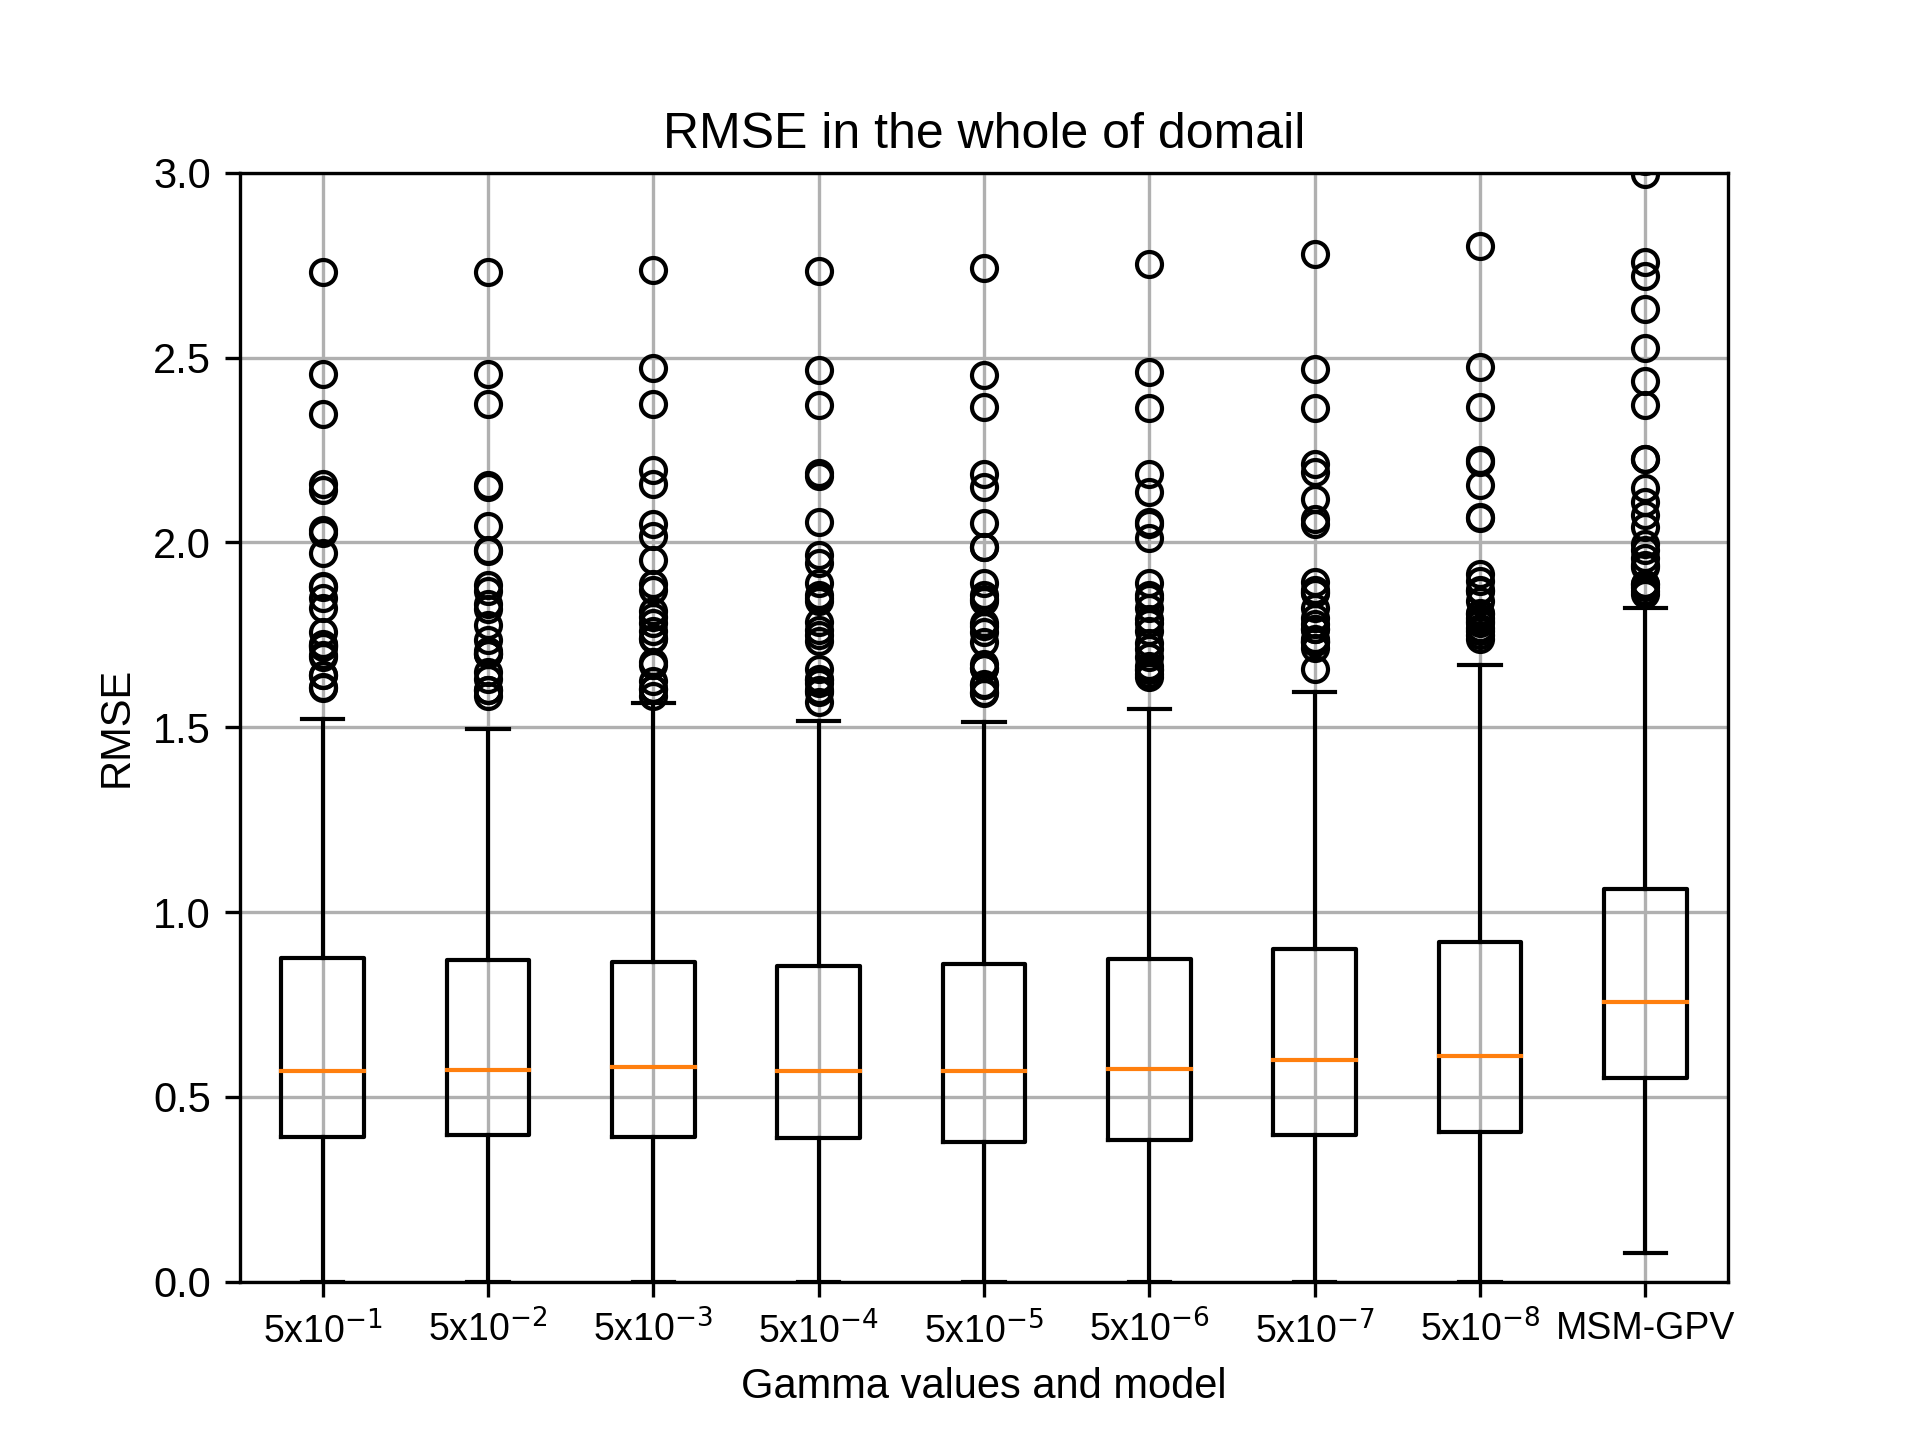
1月のsiteE,rg2=4の結果です。
kobayashi_yusukeThursday, October 22nd, 2020 at 4:18:52 PM GMT+09:00
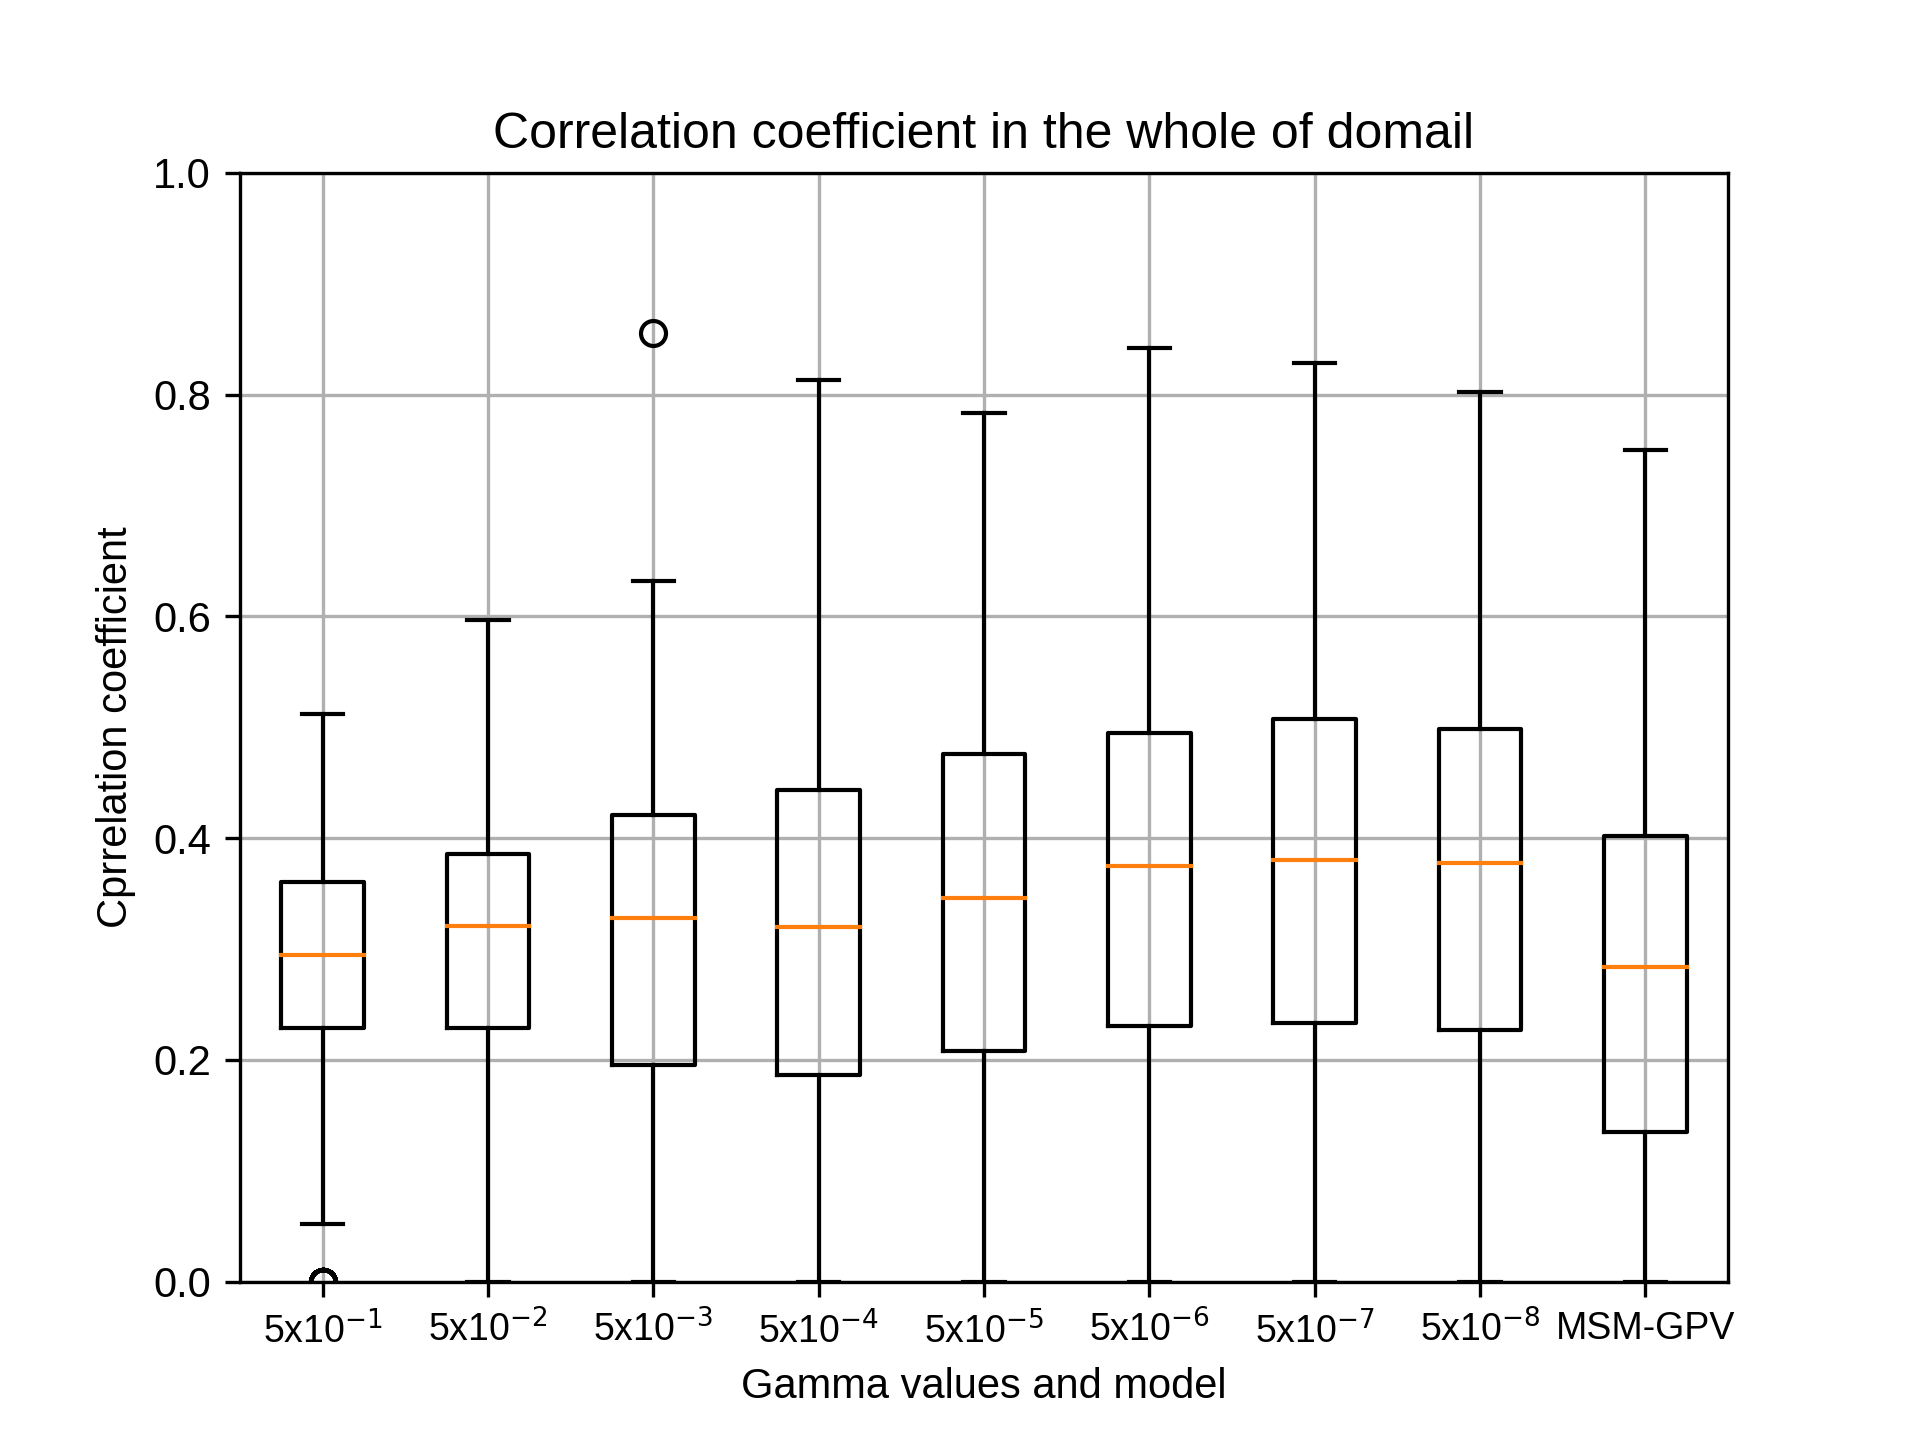
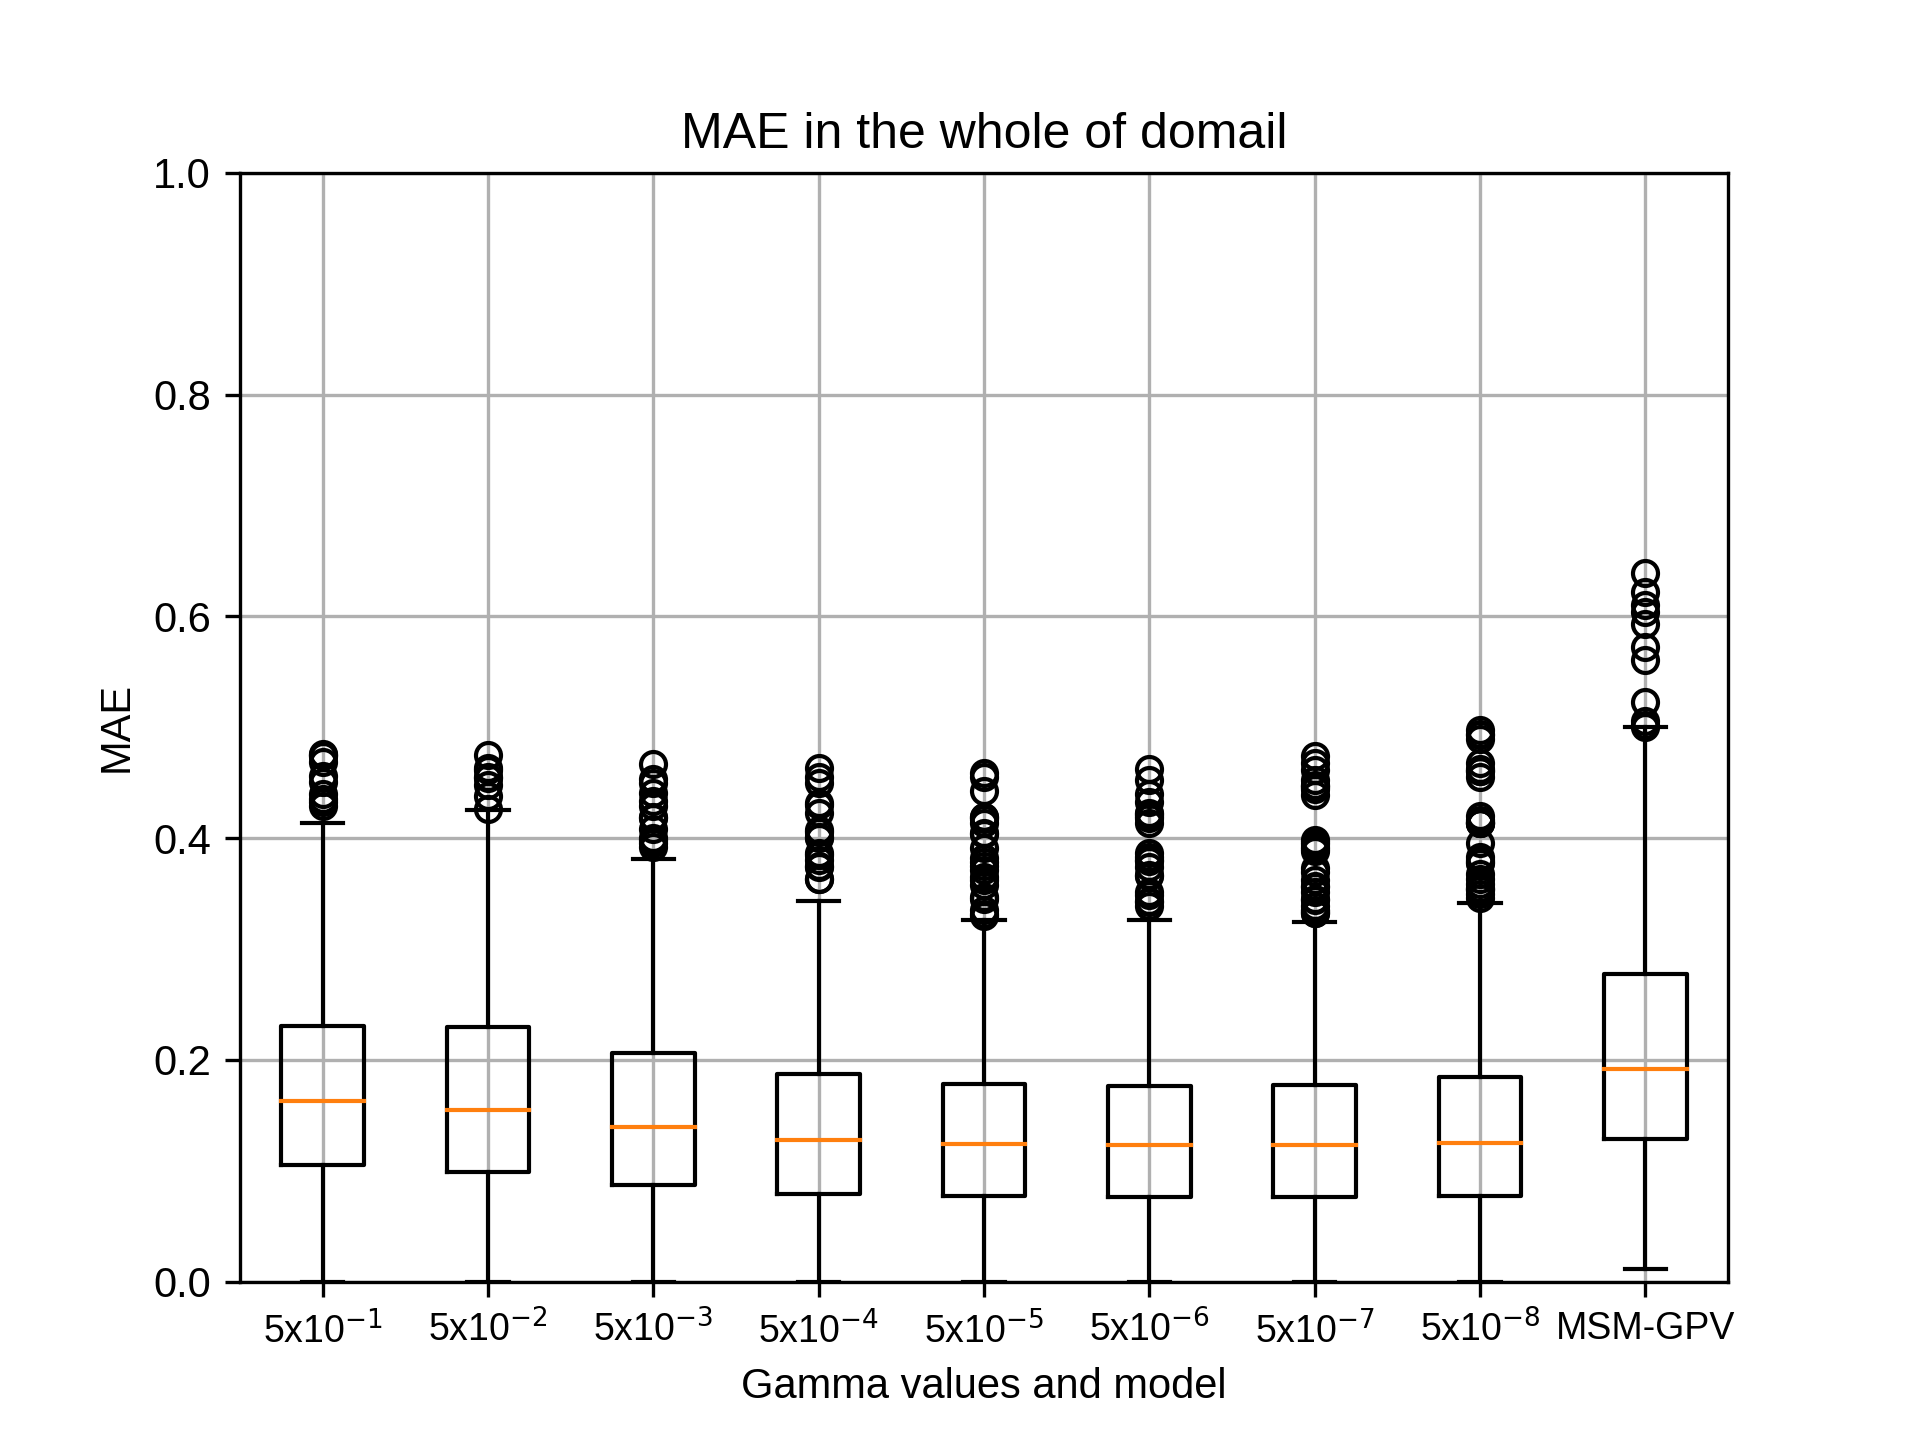
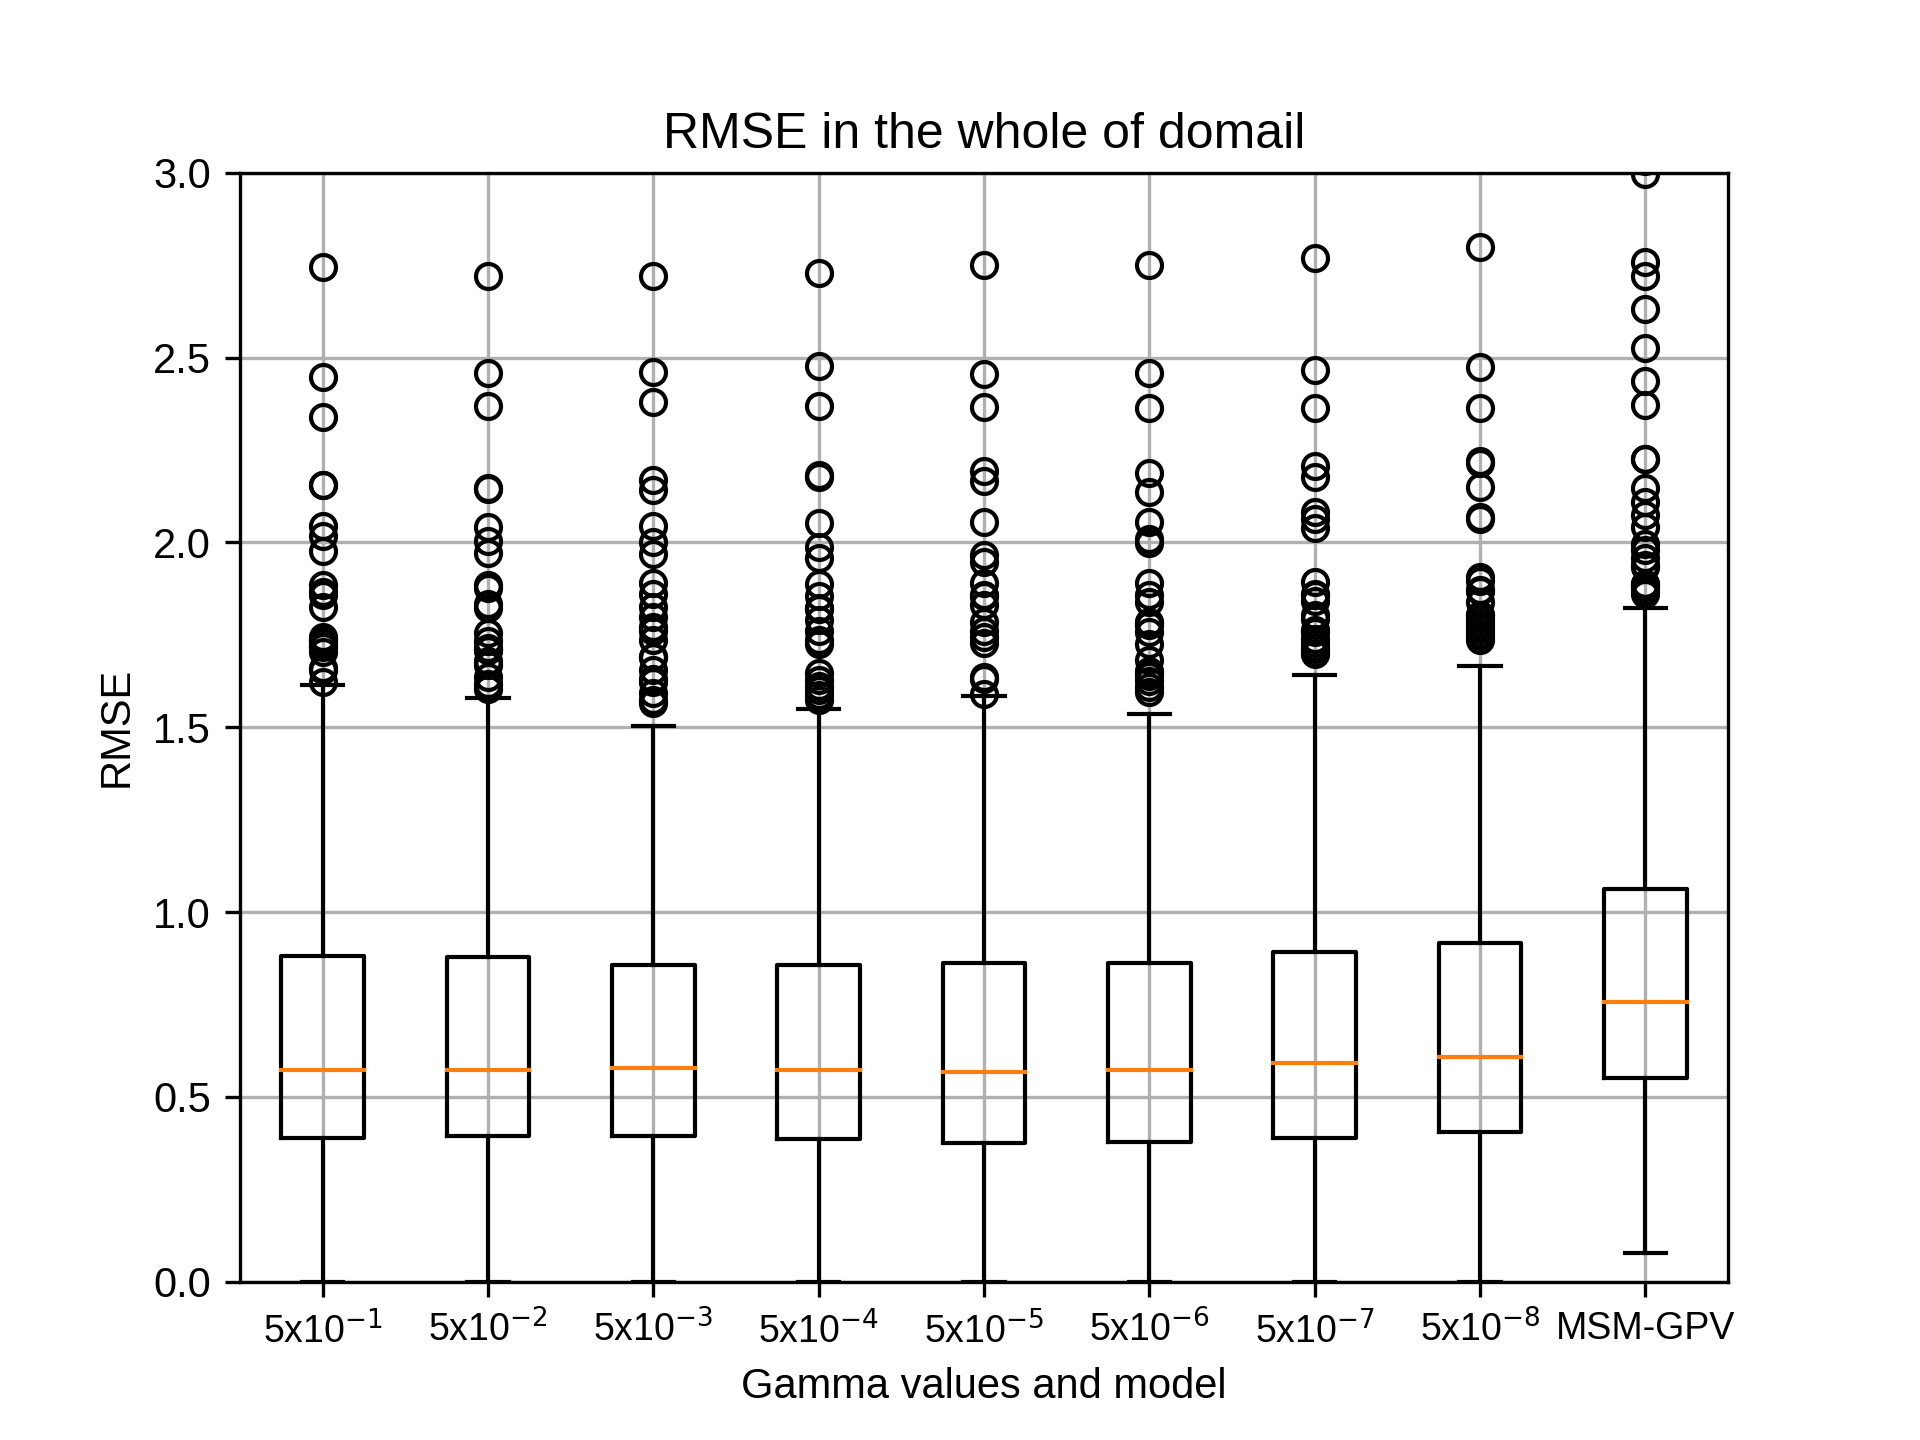
1月のsiteE,rg2=6の結果です。
kobayashi_yusukeThursday, October 22nd, 2020 at 4:19:14 PM GMT+09:00
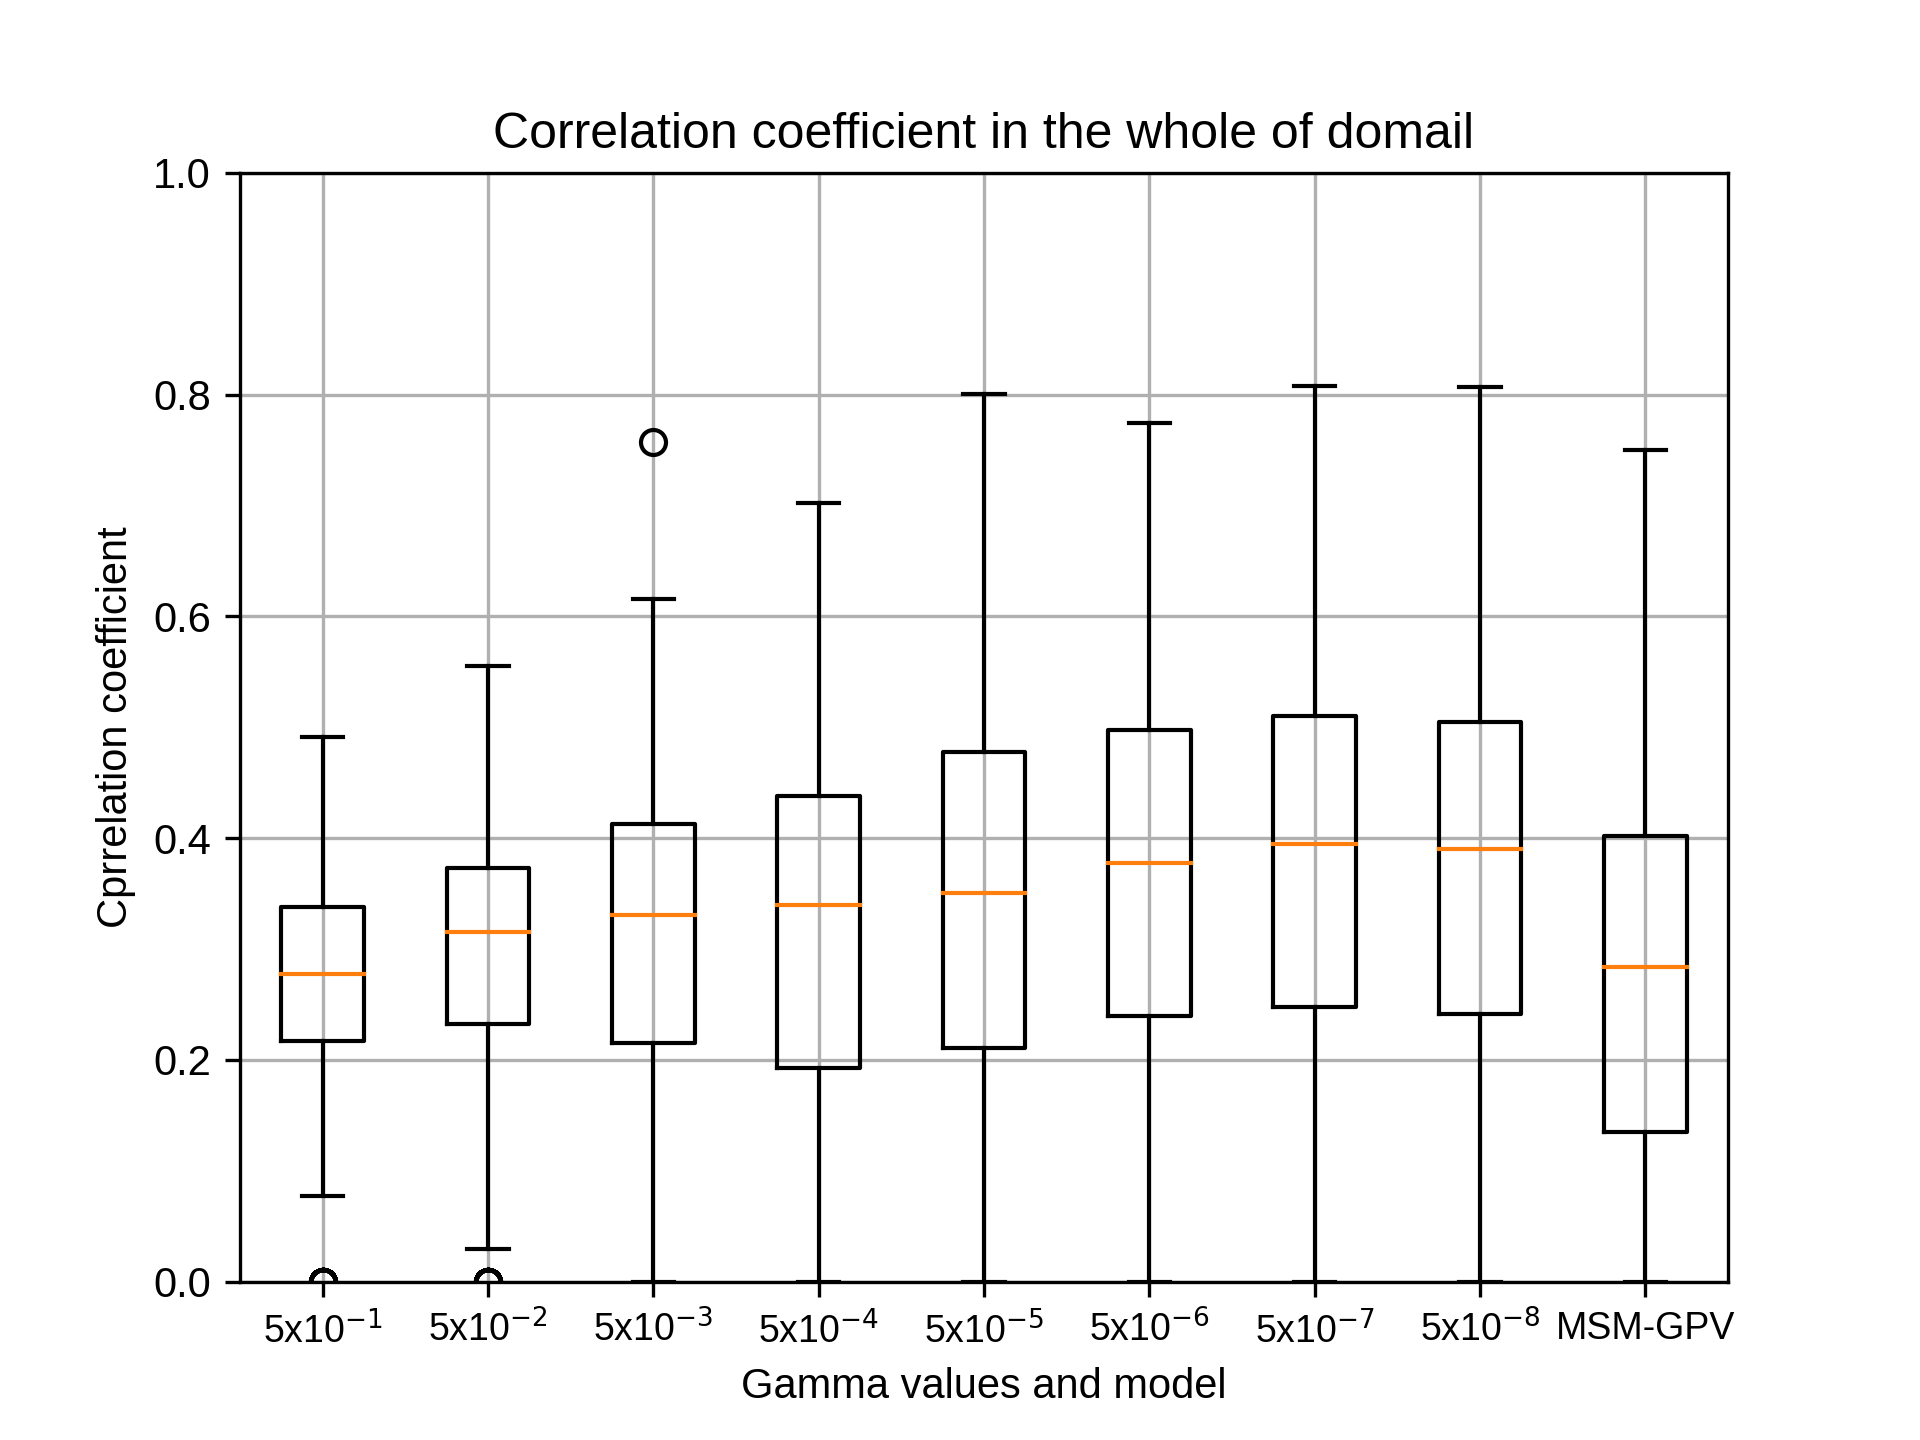
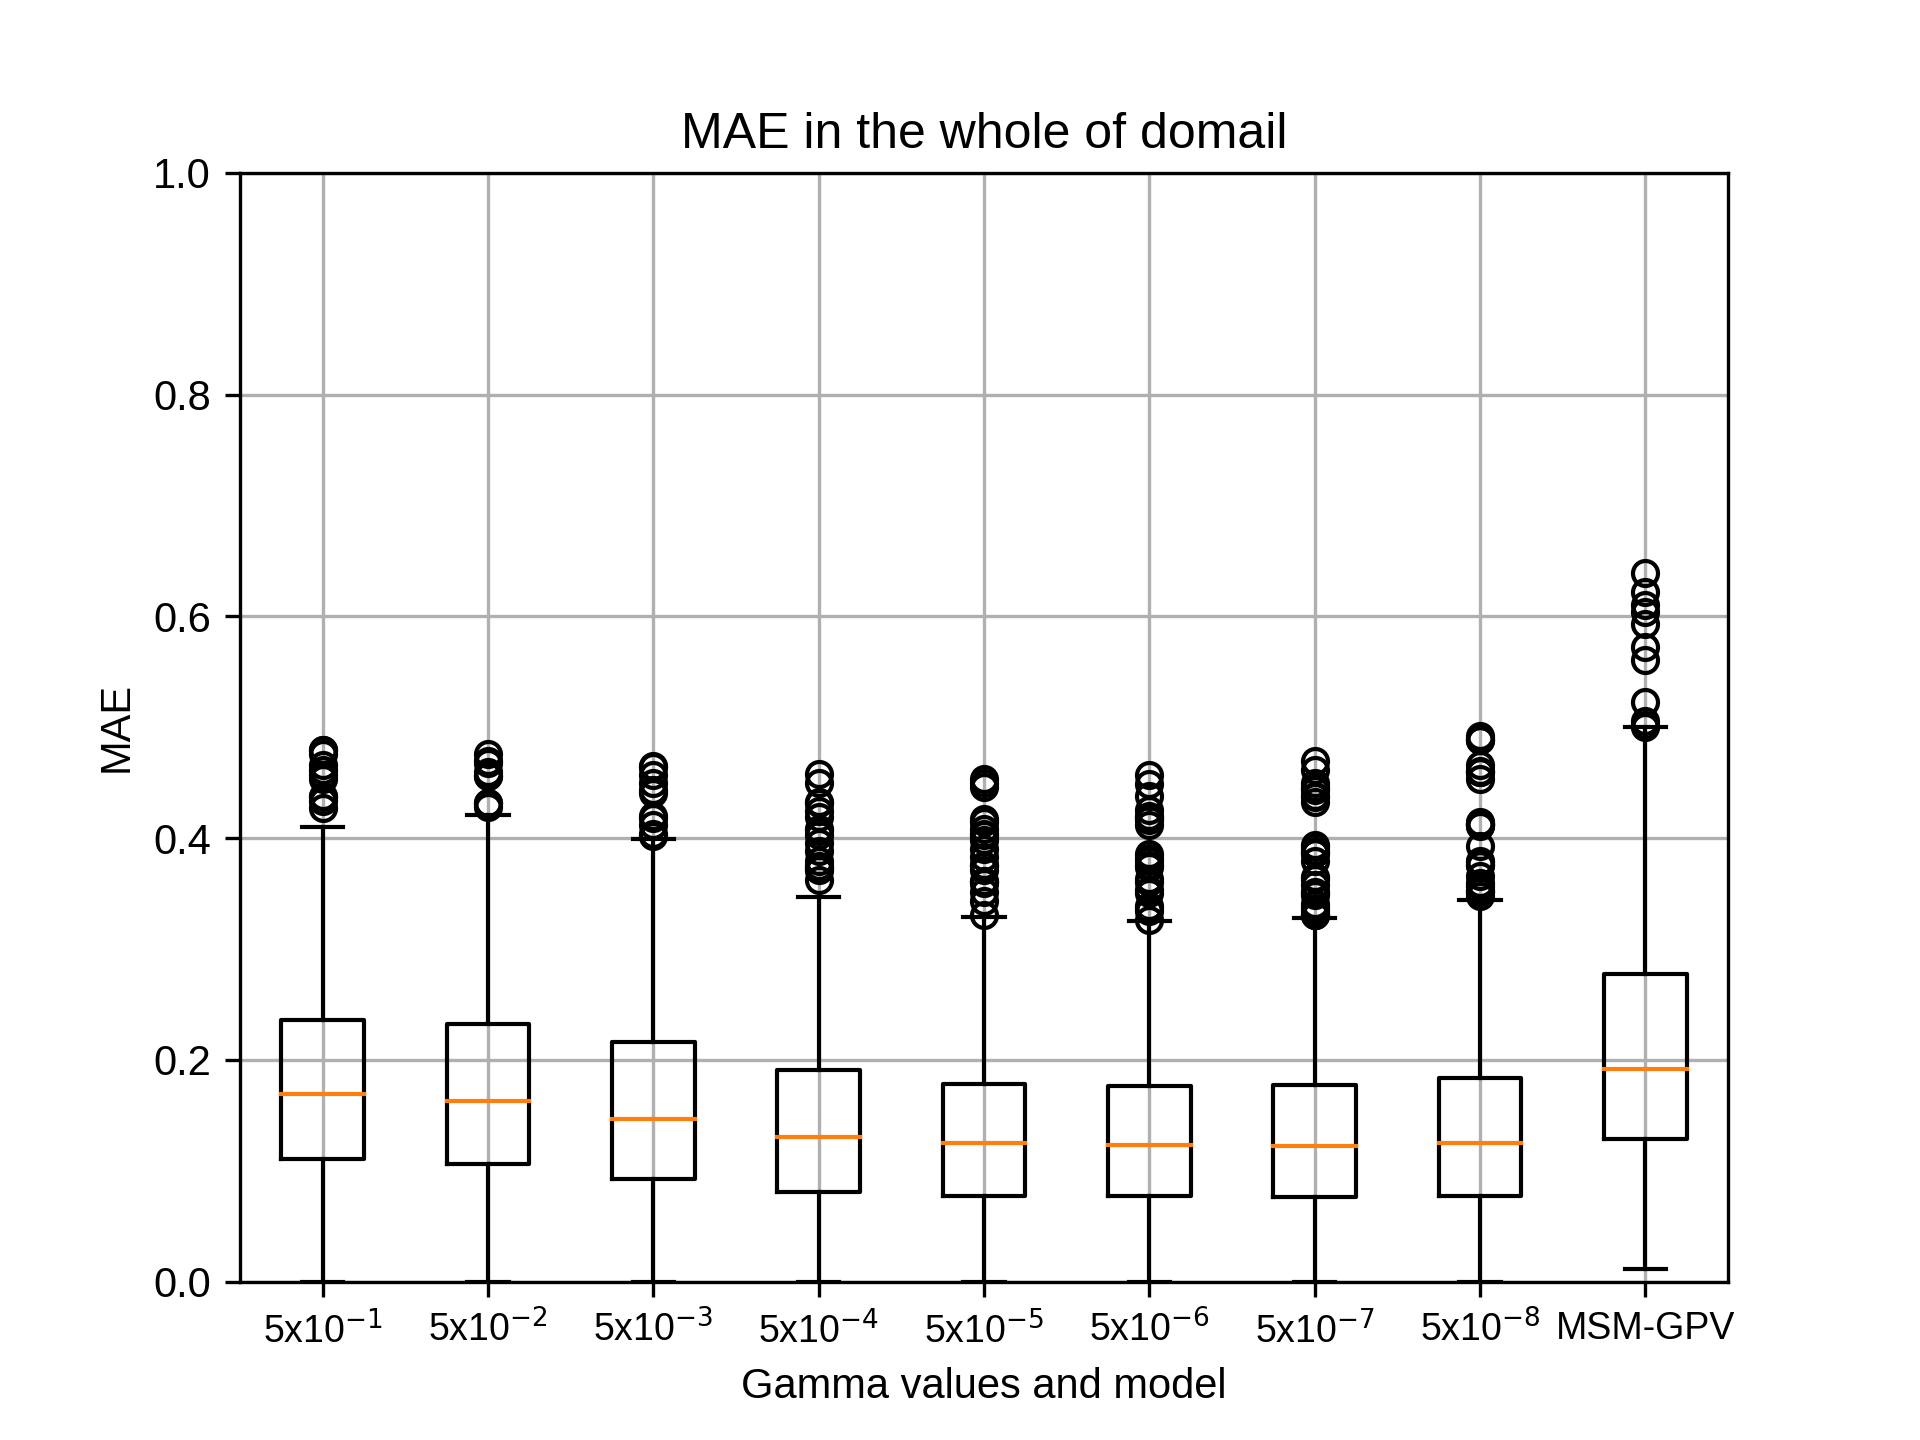
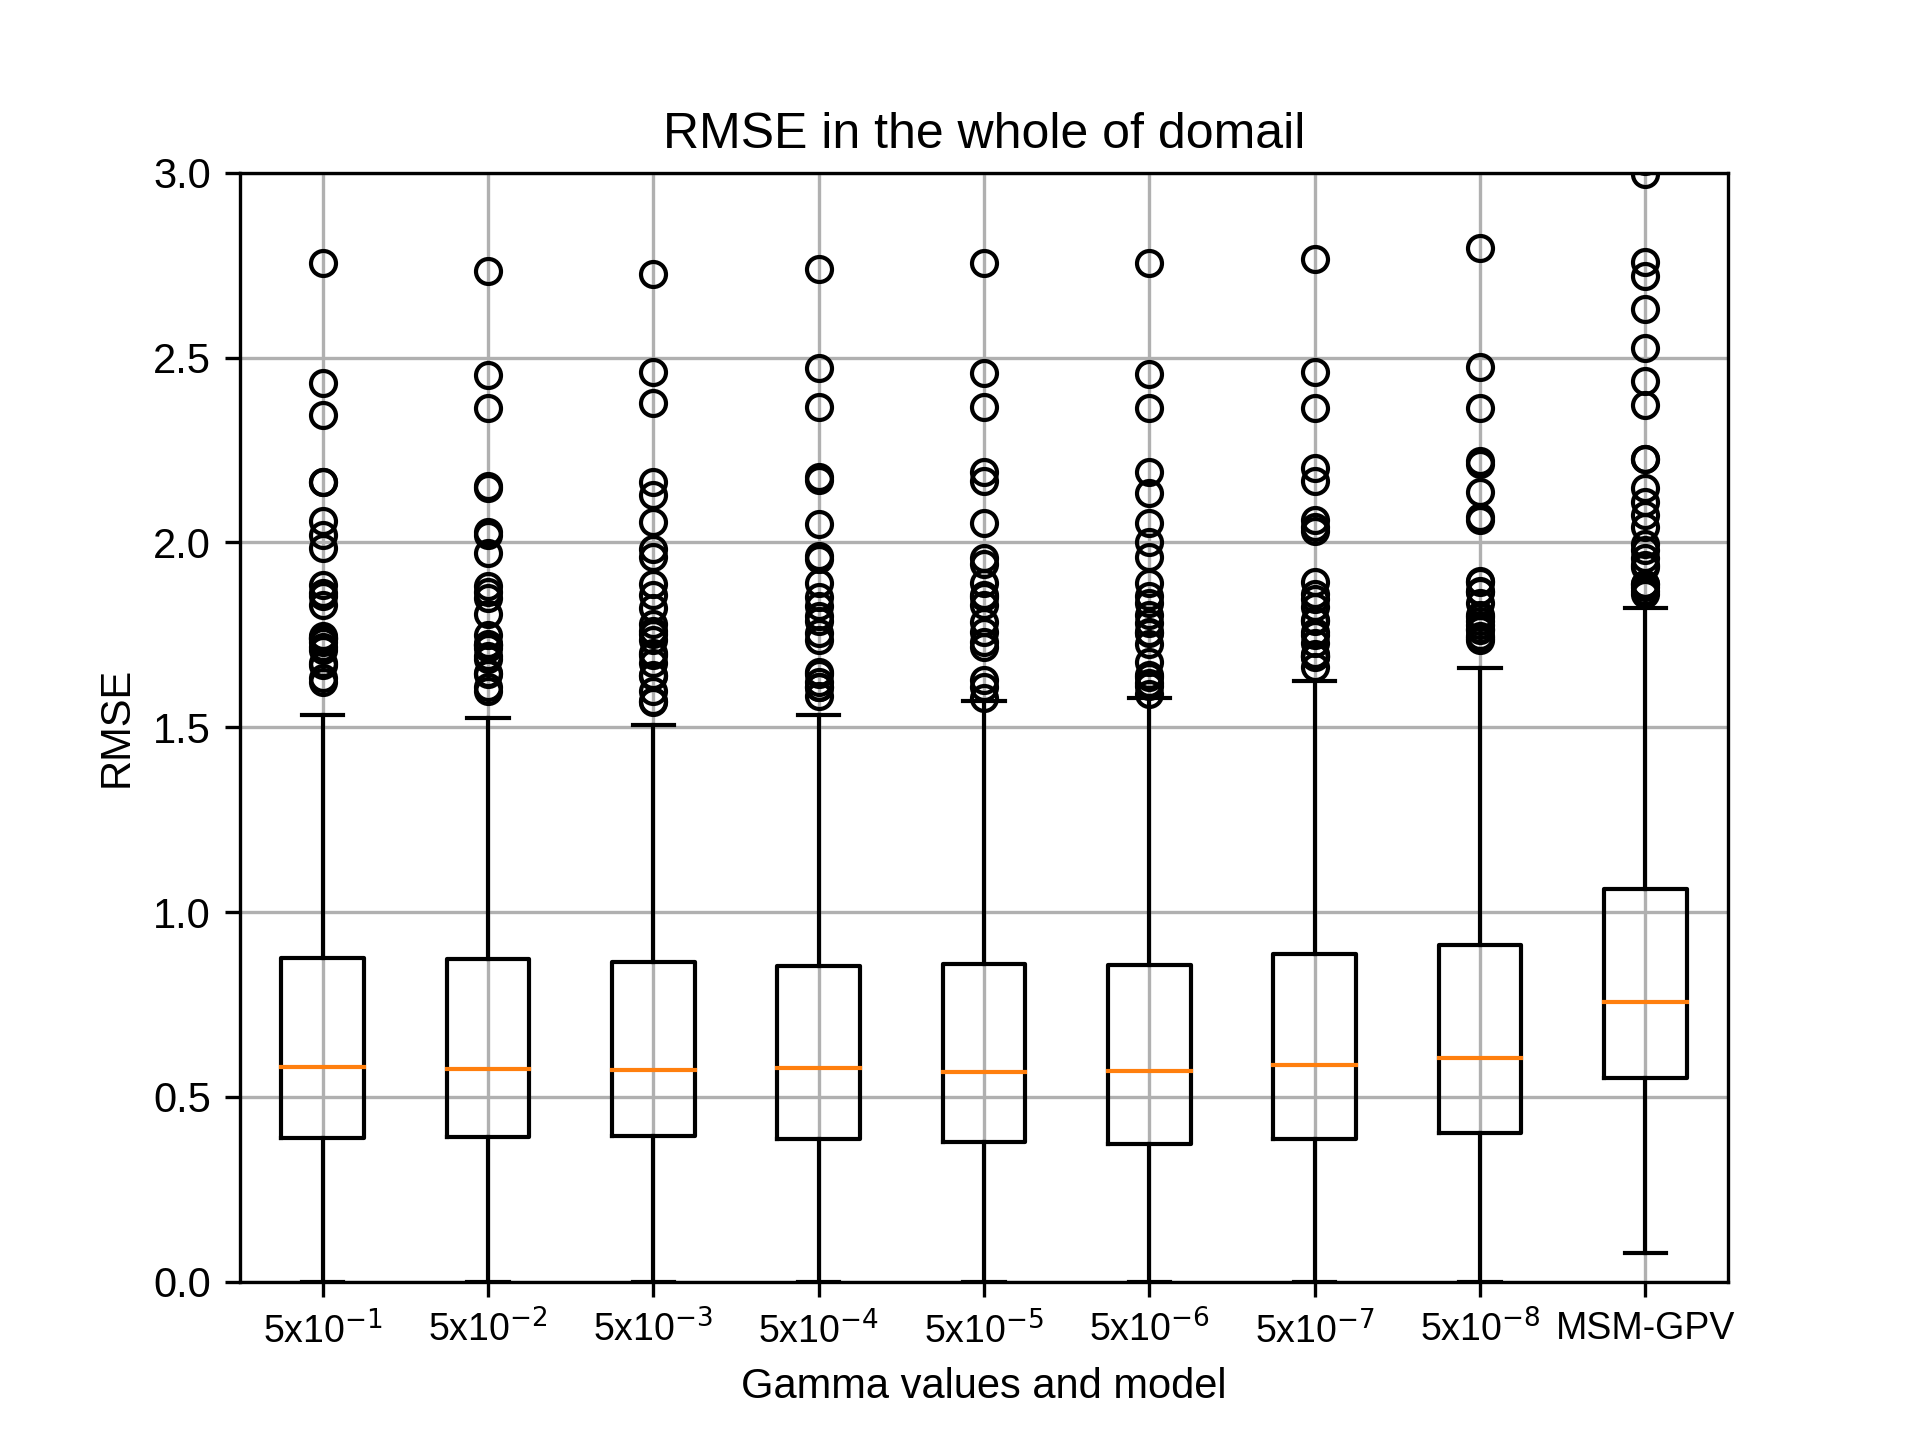
1月のsiteE,rg2=8の結果です。
kobayashi_yusukeThursday, October 22nd, 2020 at 4:19:35 PM GMT+09:00
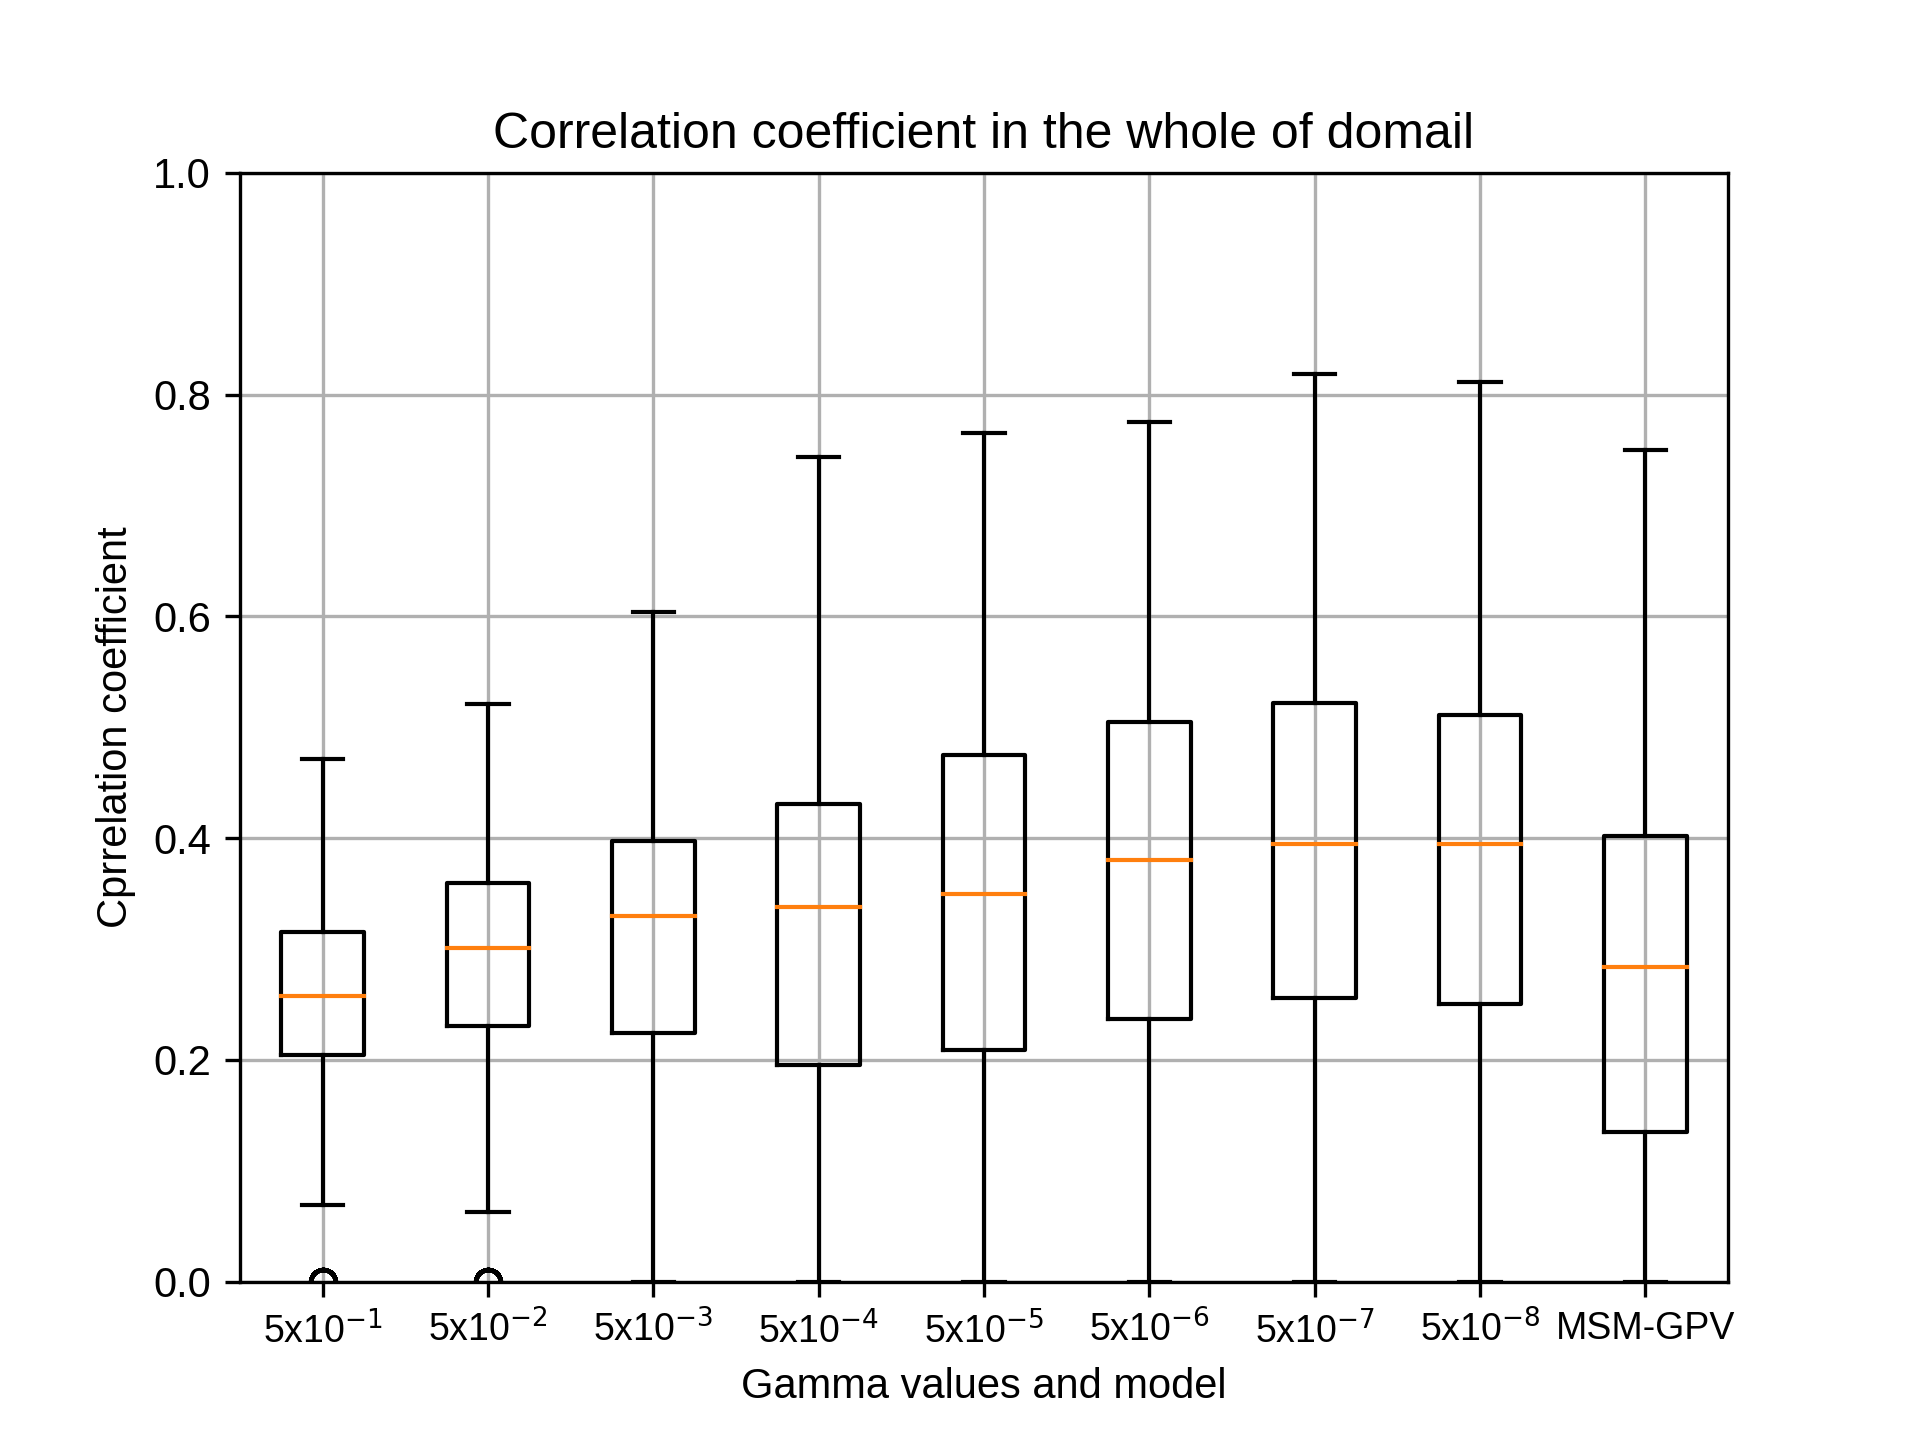


1月のsiteE,rg2=10の結果です。
kobayashi_yusukeThursday, October 22nd, 2020 at 4:19:54 PM GMT+09:00
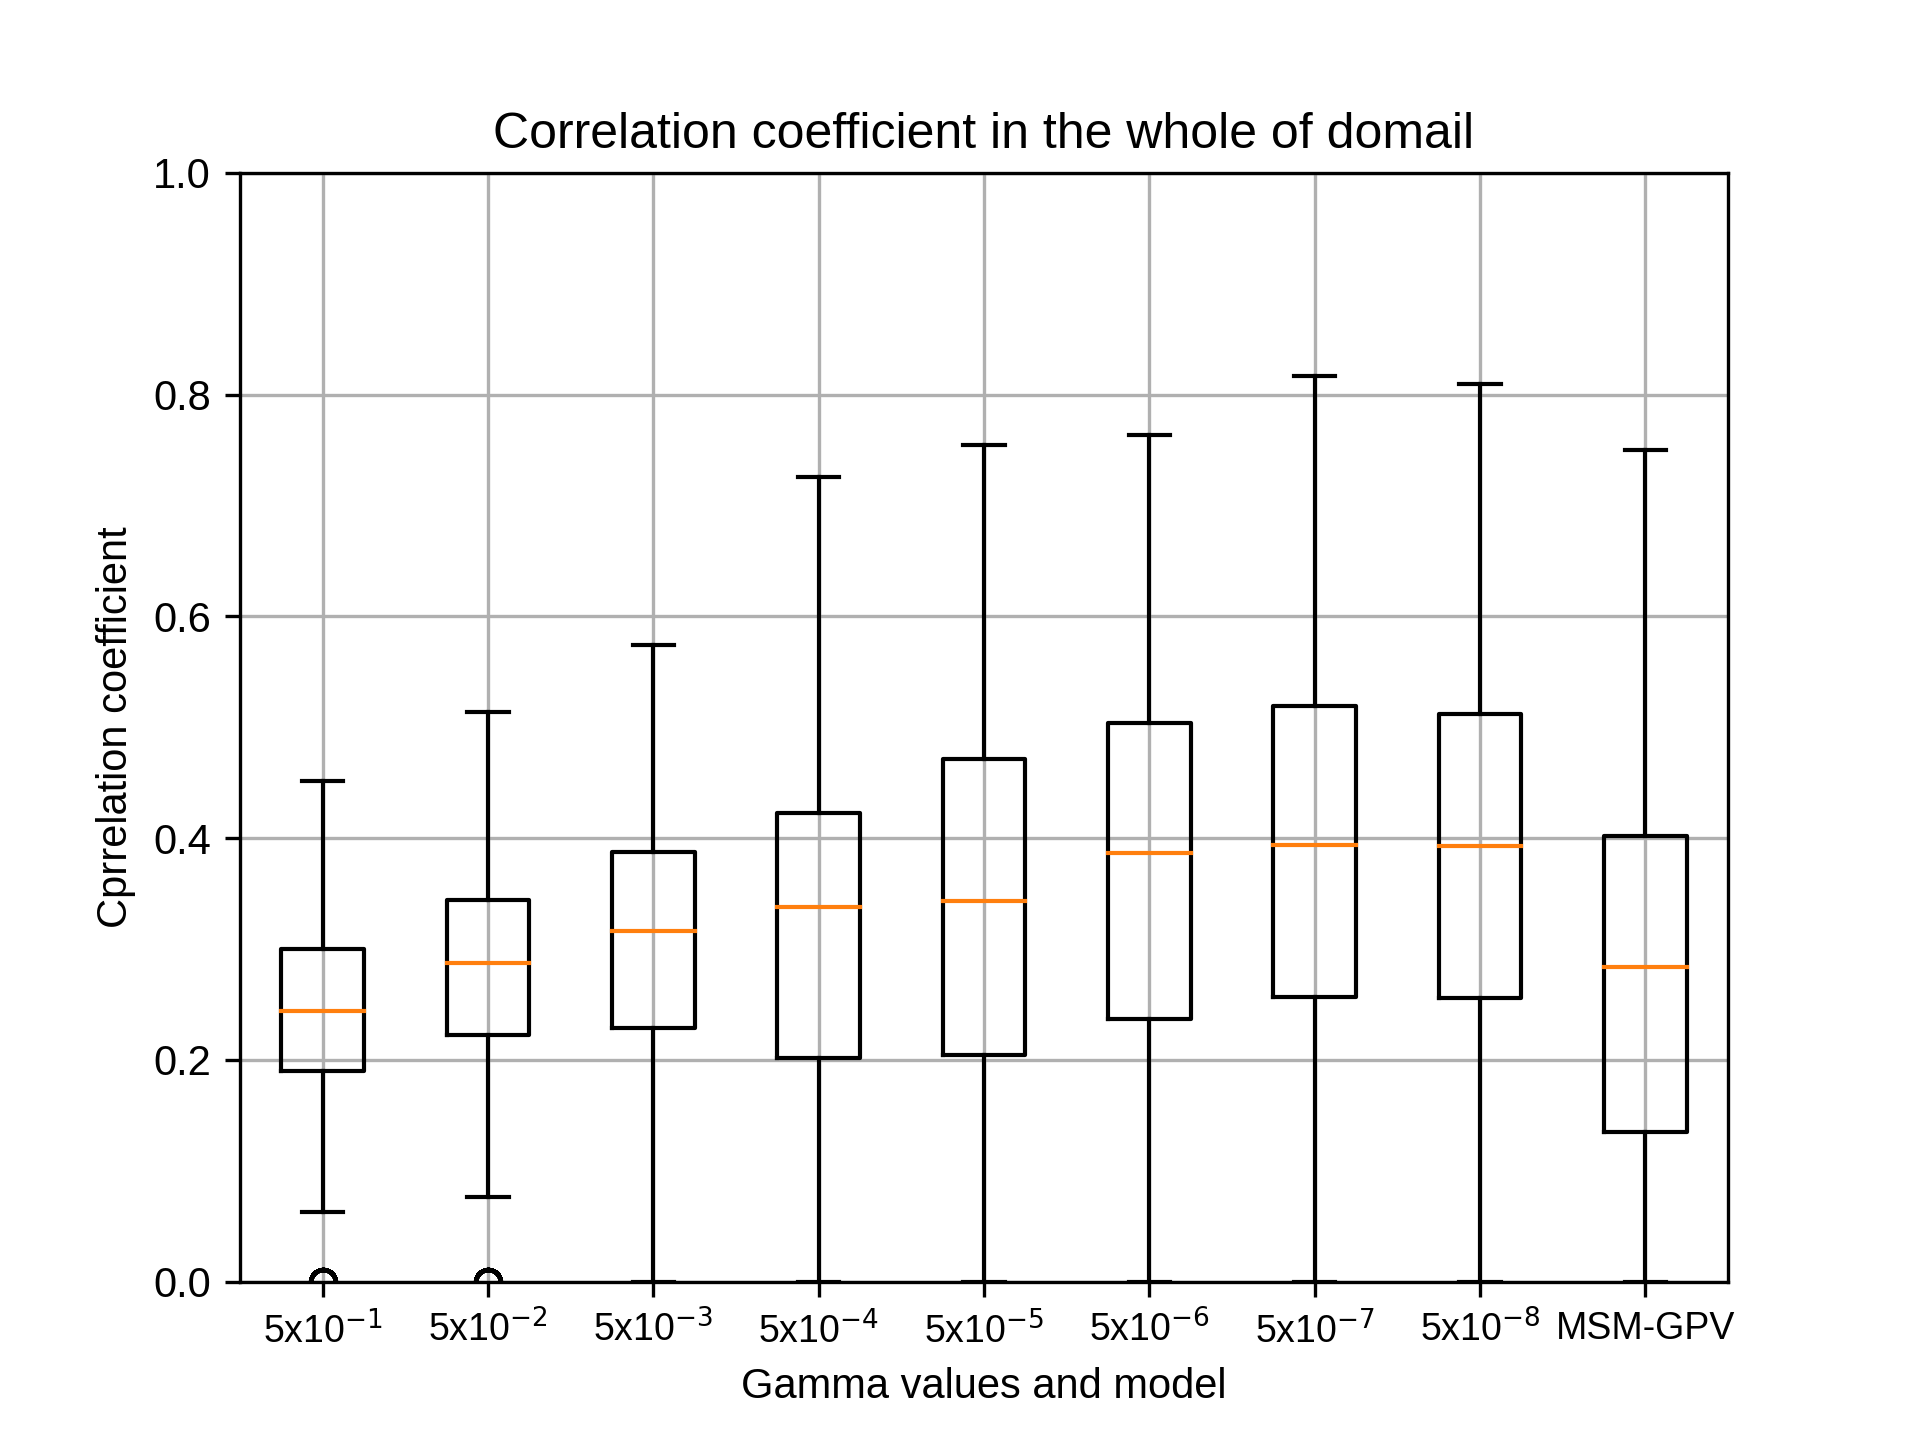
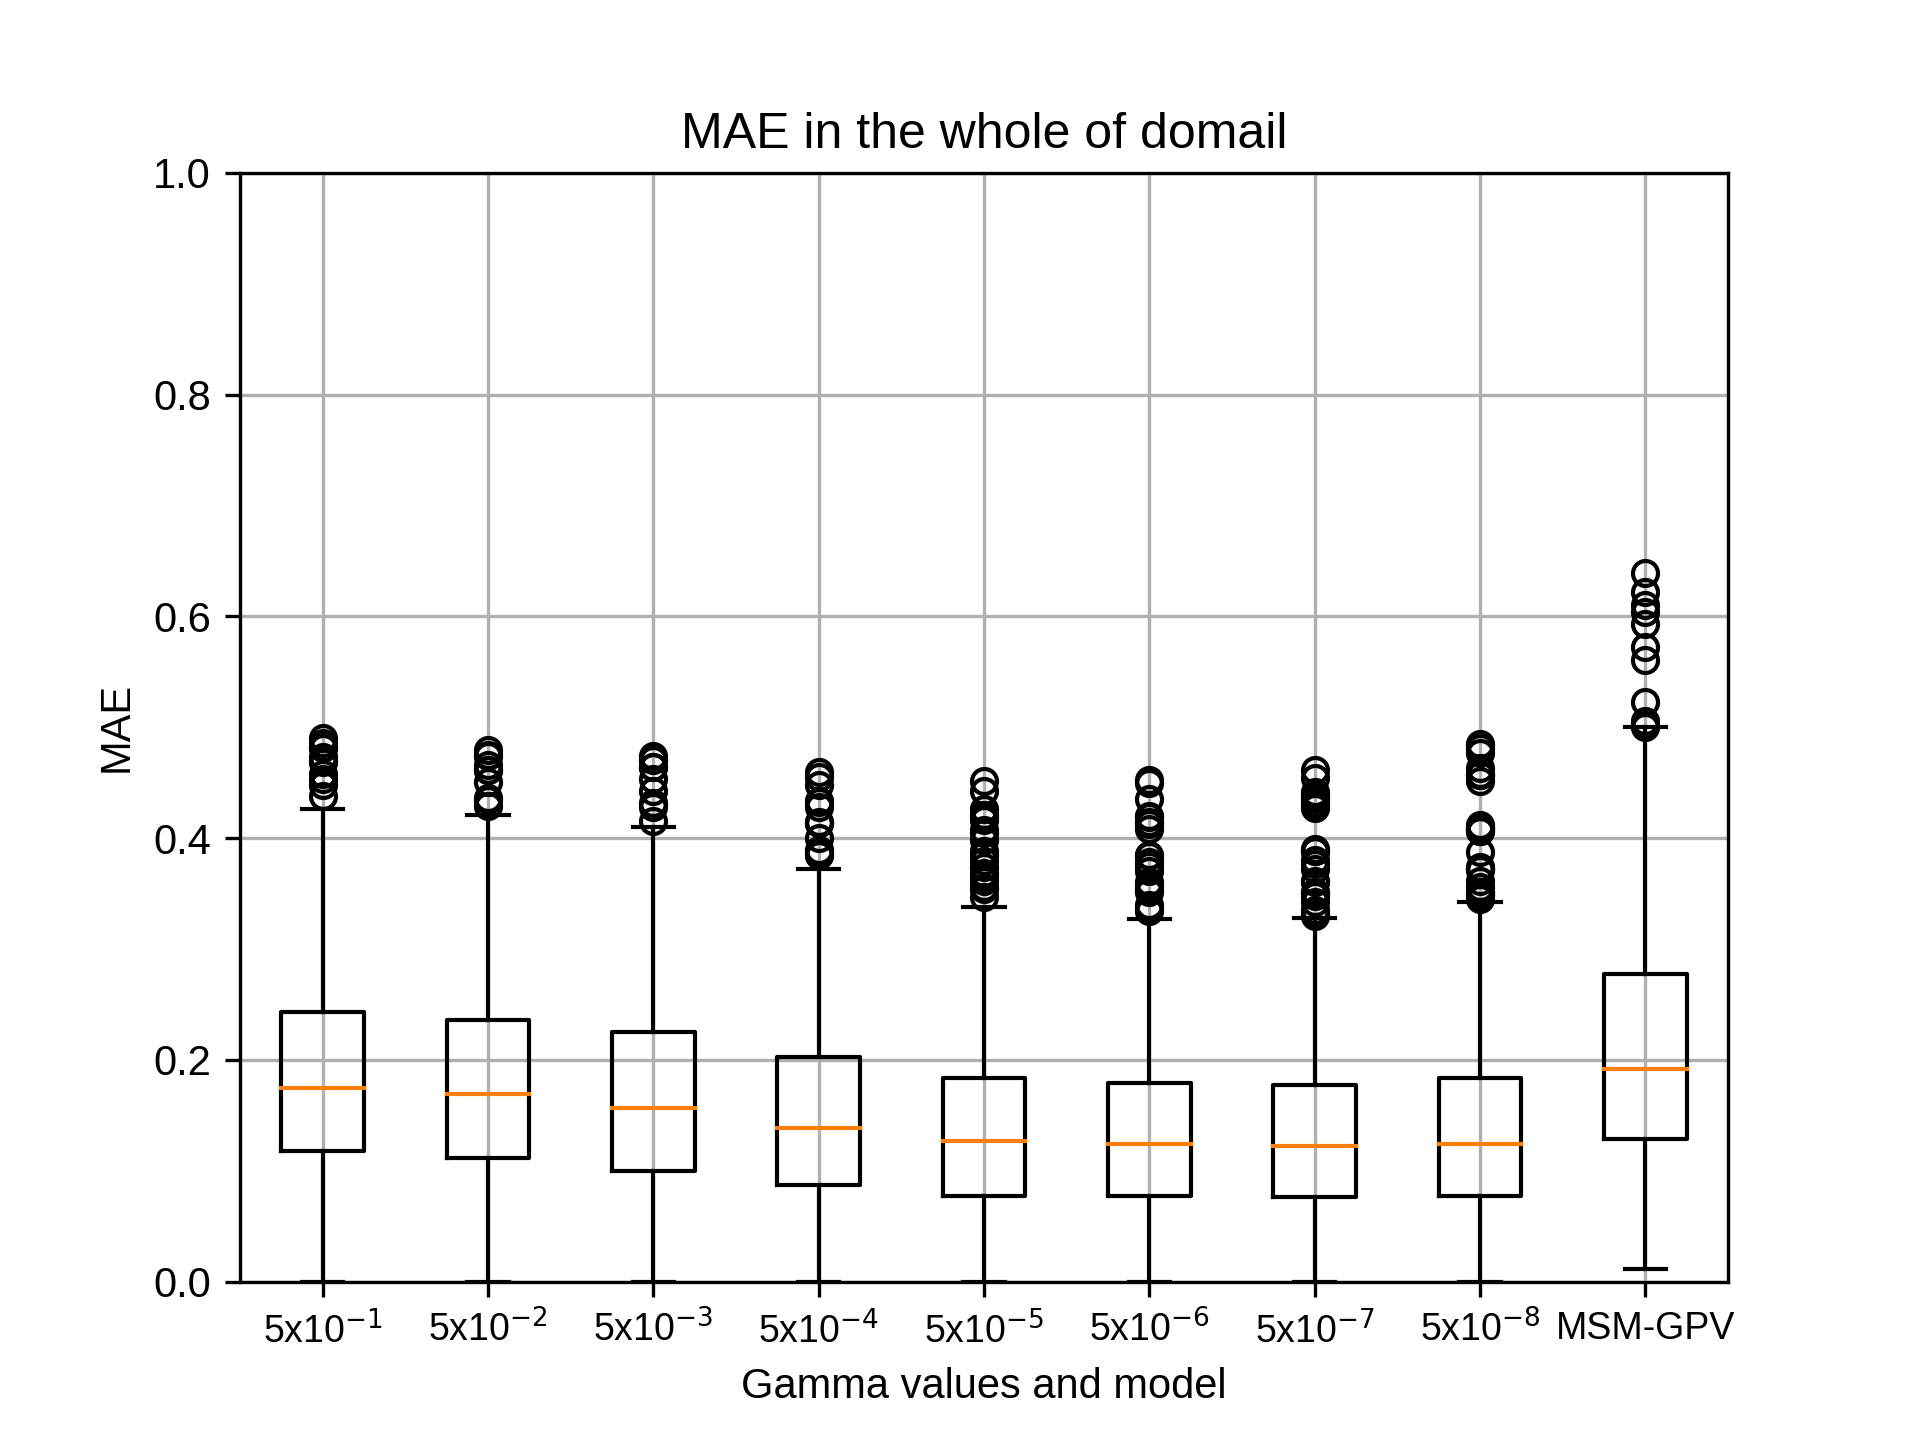
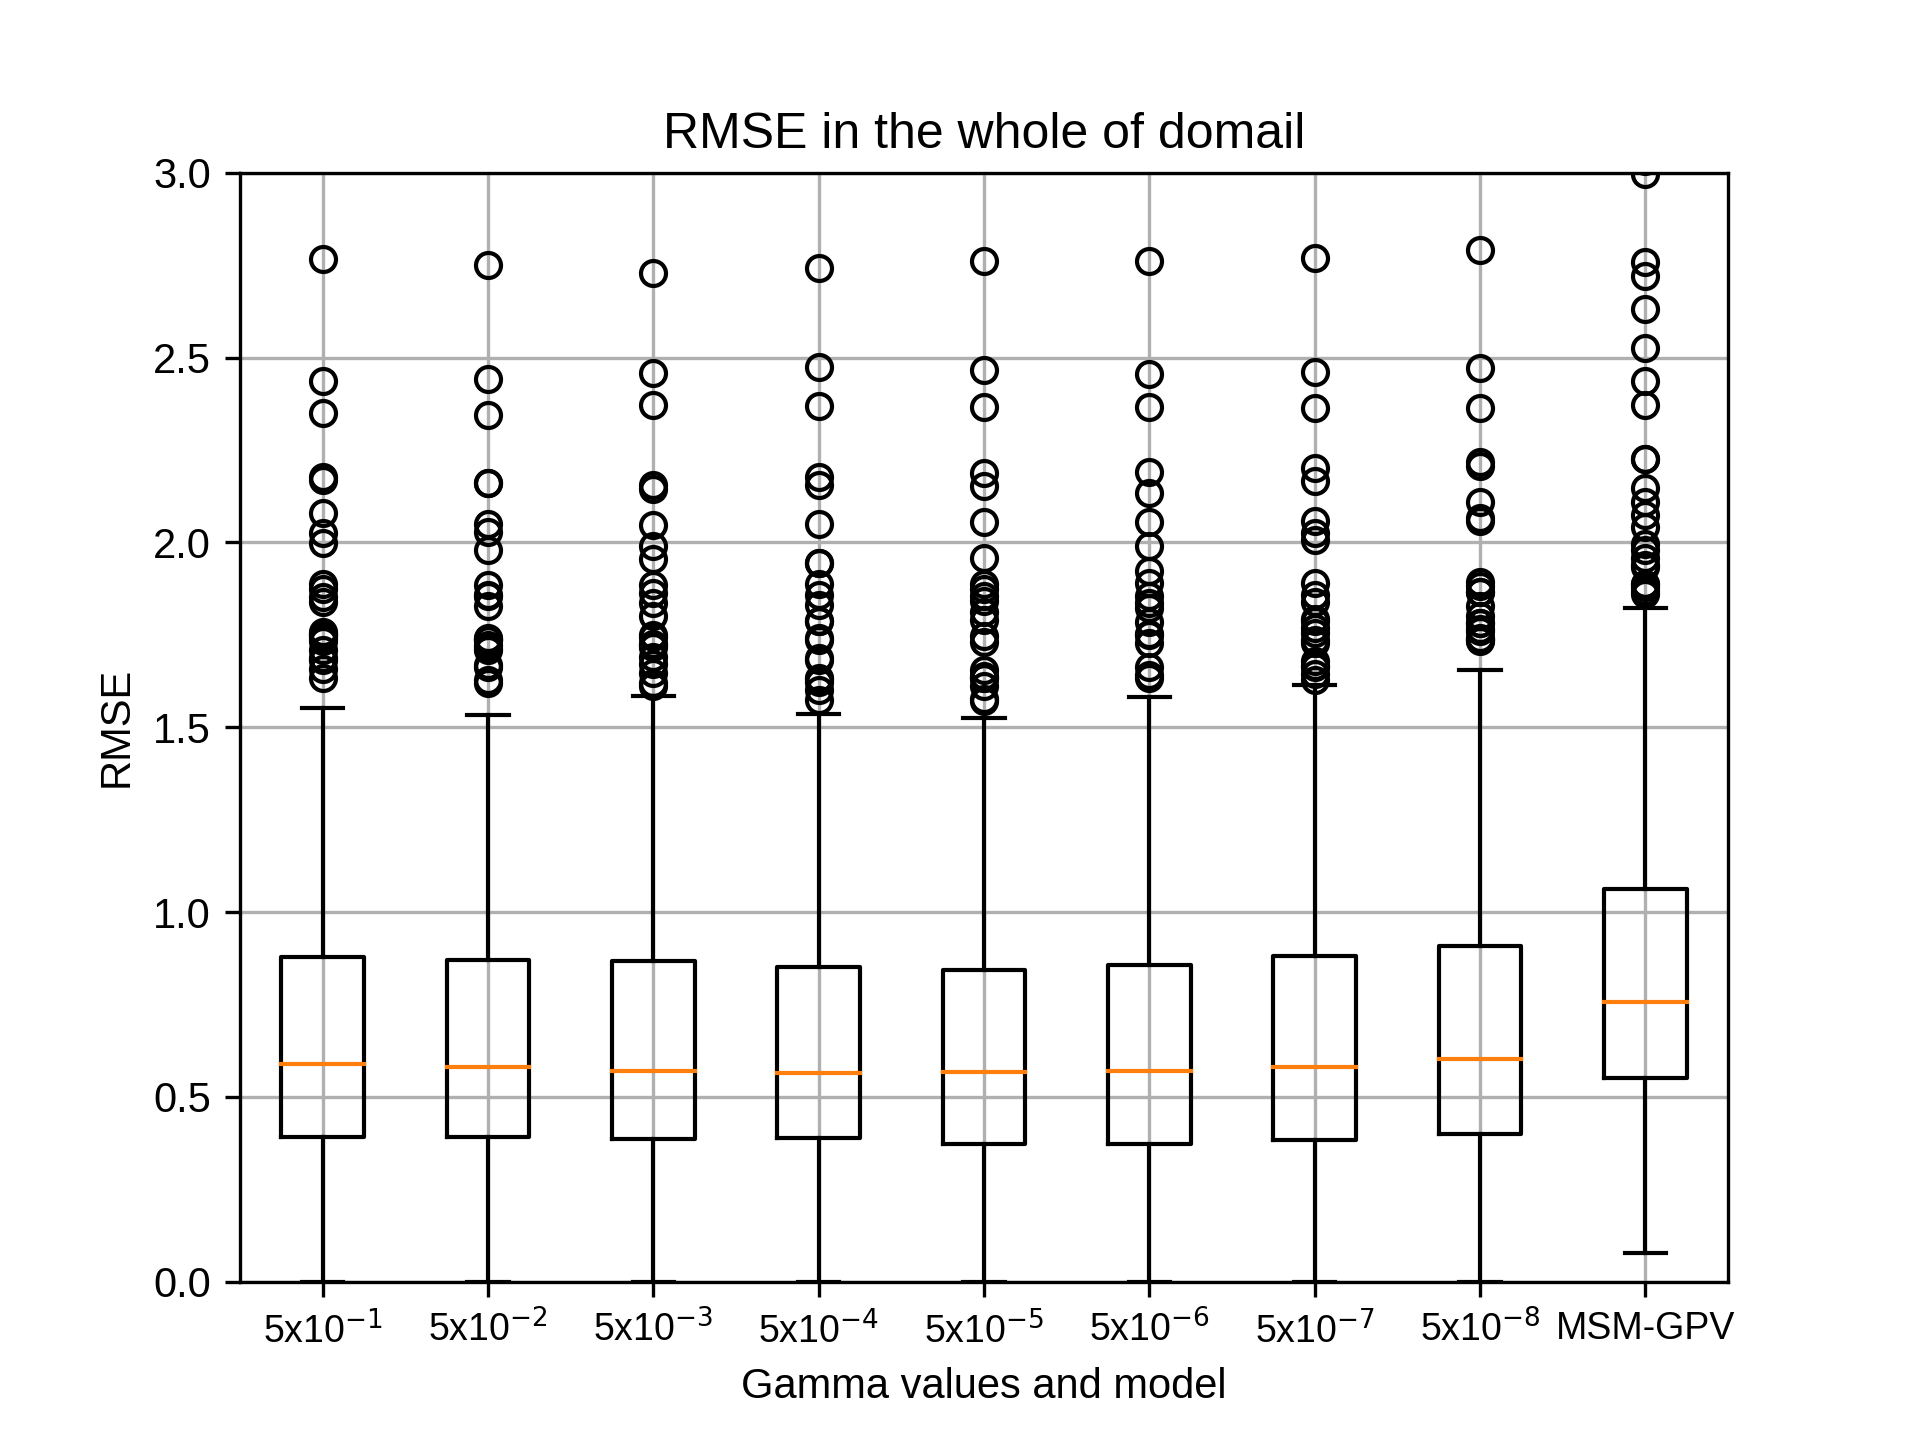
1月のsiteE,rg2=12の結果です。
1月のsiteEではrg2=10でgammaが5x10⁻⁷のとき、相関係数の中央値が最も高くなりました。
1月のsiteEではrg2=10でgammaが5x10⁻⁷のとき、相関係数の中央値が最も高くなりました。
kobayashi_yusukeThursday, October 22nd, 2020 at 4:20:23 PM GMT+09:00

続いて4月の結果は表の右2列となります。特徴量ベクトルは10もしくは12、gammaは当初の結果と同じになりました。ただ、特徴量ベクトルはrg2=8,10,12で大きな差はございませんでした。
cost,epsilonはそれぞれこれまでのハイパーパラメータ決定で相関係数の中央値が最大の者を採用しました。詳細は添付のエクセルをご参照ください。
cost,epsilonはそれぞれこれまでのハイパーパラメータ決定で相関係数の中央値が最大の者を採用しました。詳細は添付のエクセルをご参照ください。
kobayashi_yusukeThursday, October 22nd, 2020 at 4:20:54 PM GMT+09:00
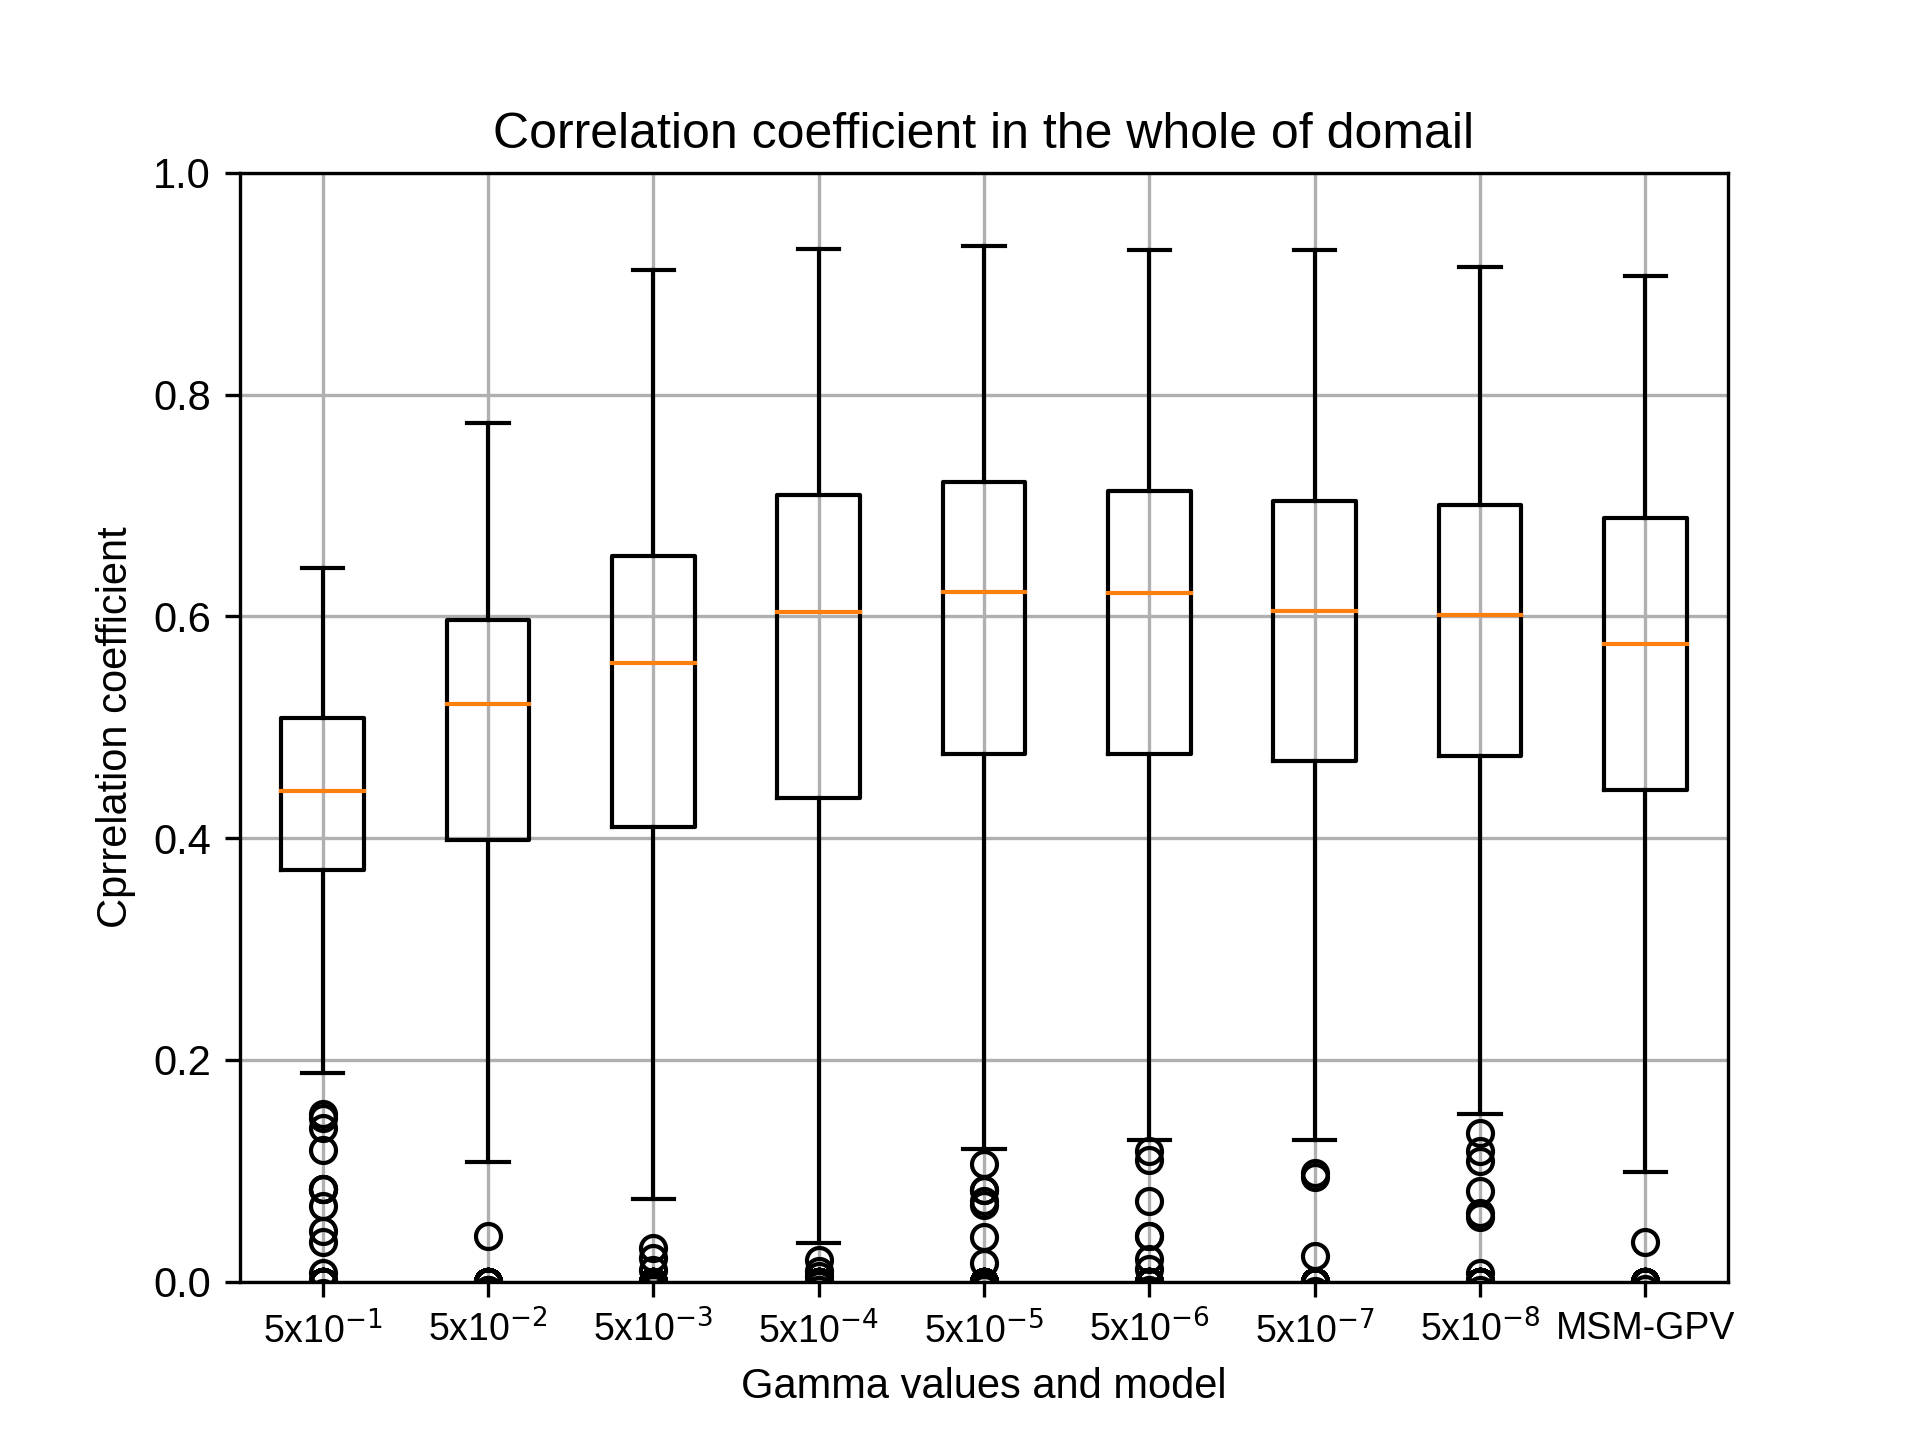
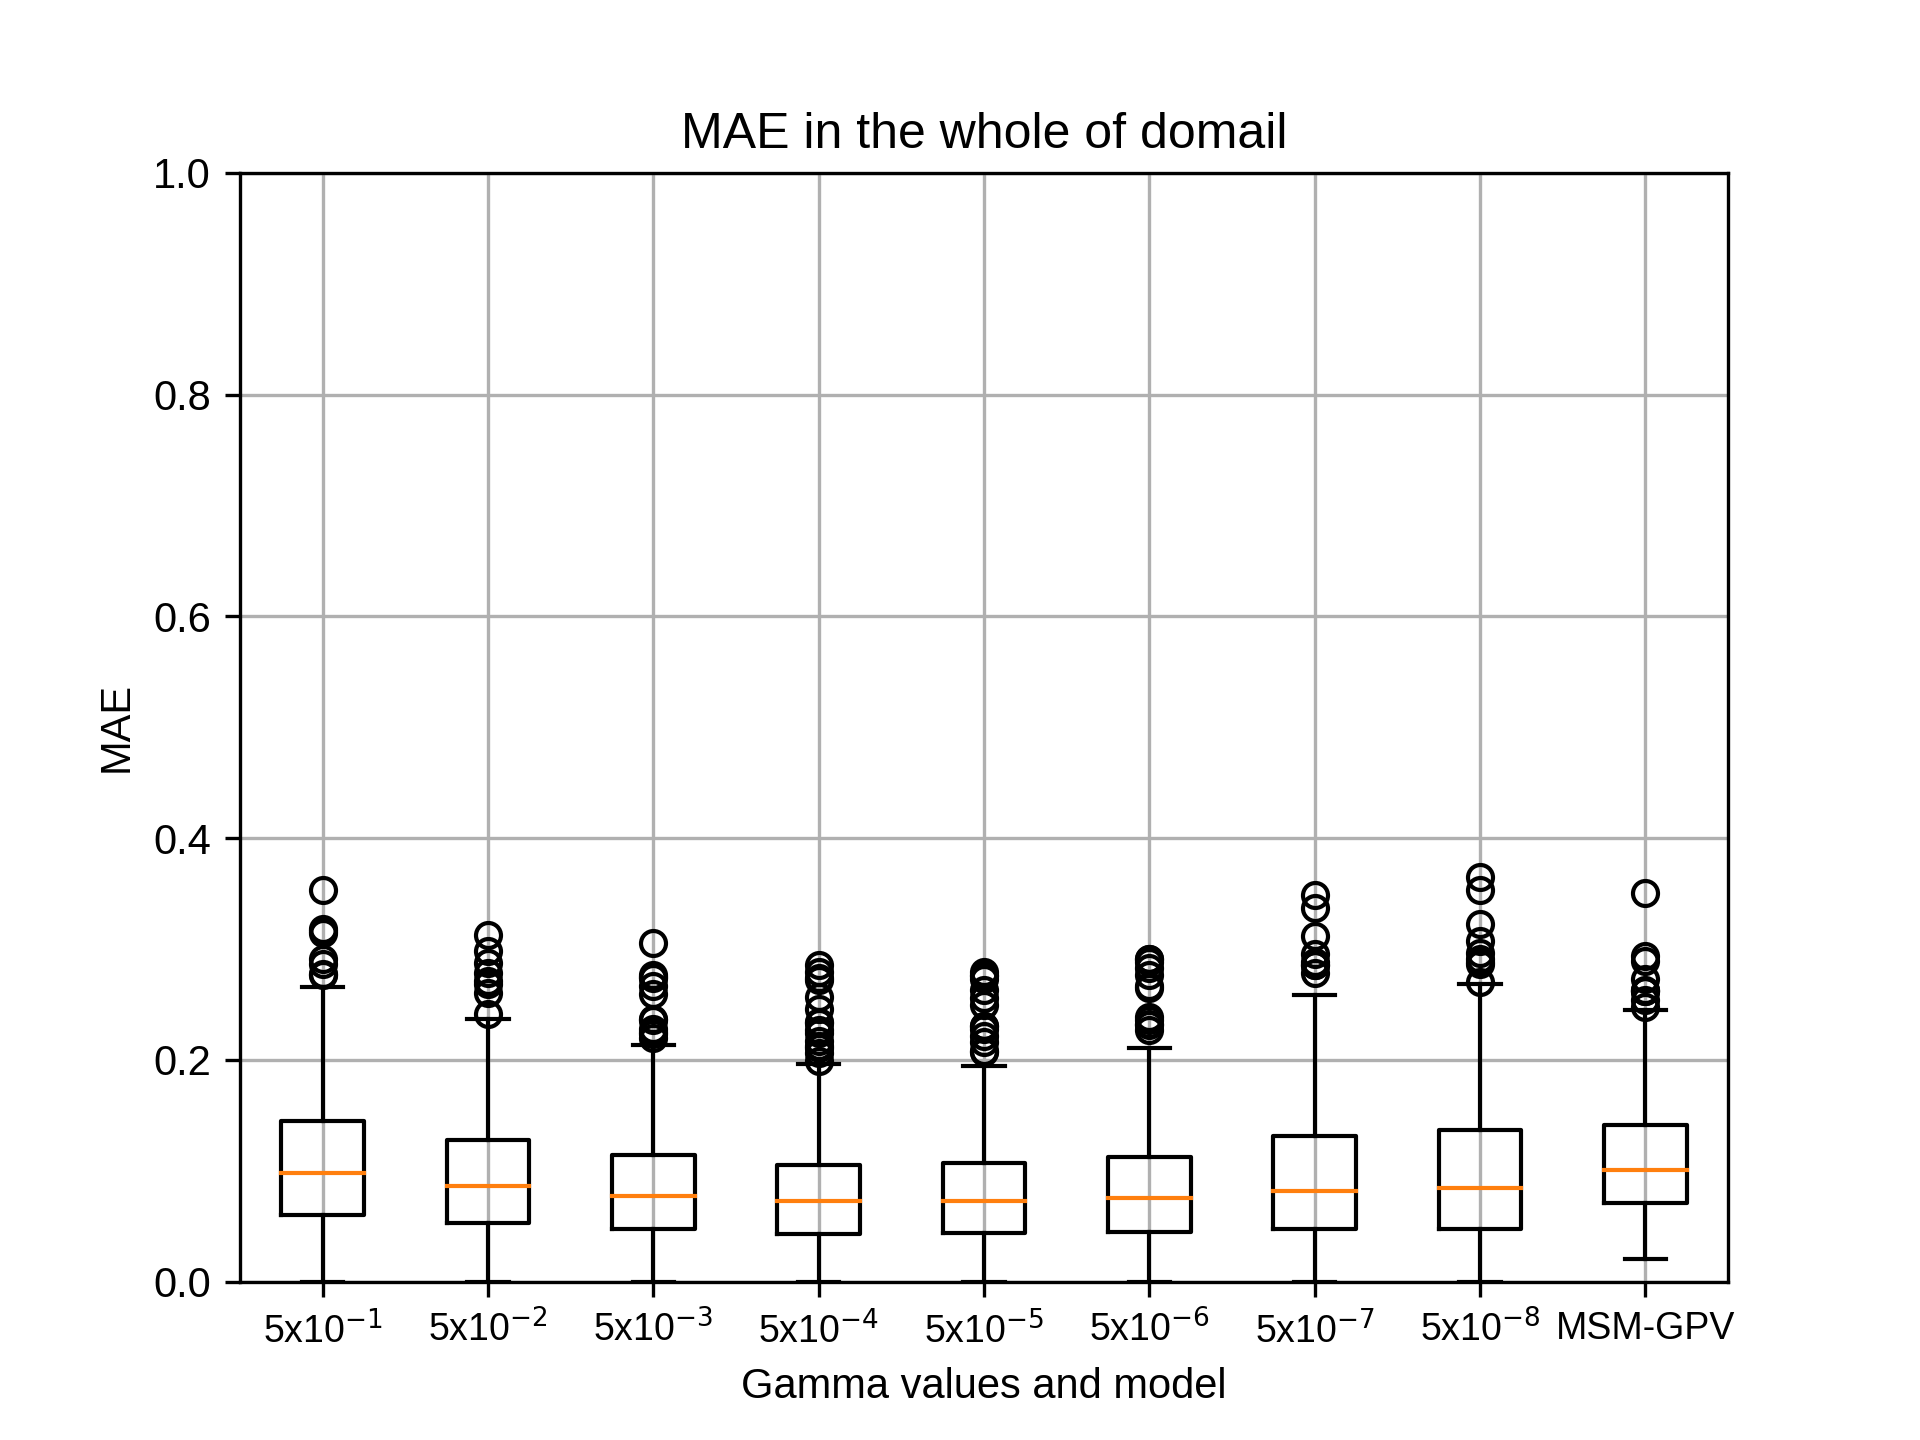

まずは4月のsiteA,rg2=4の結果です。
kobayashi_yusukeThursday, October 22nd, 2020 at 4:21:08 PM GMT+09:00
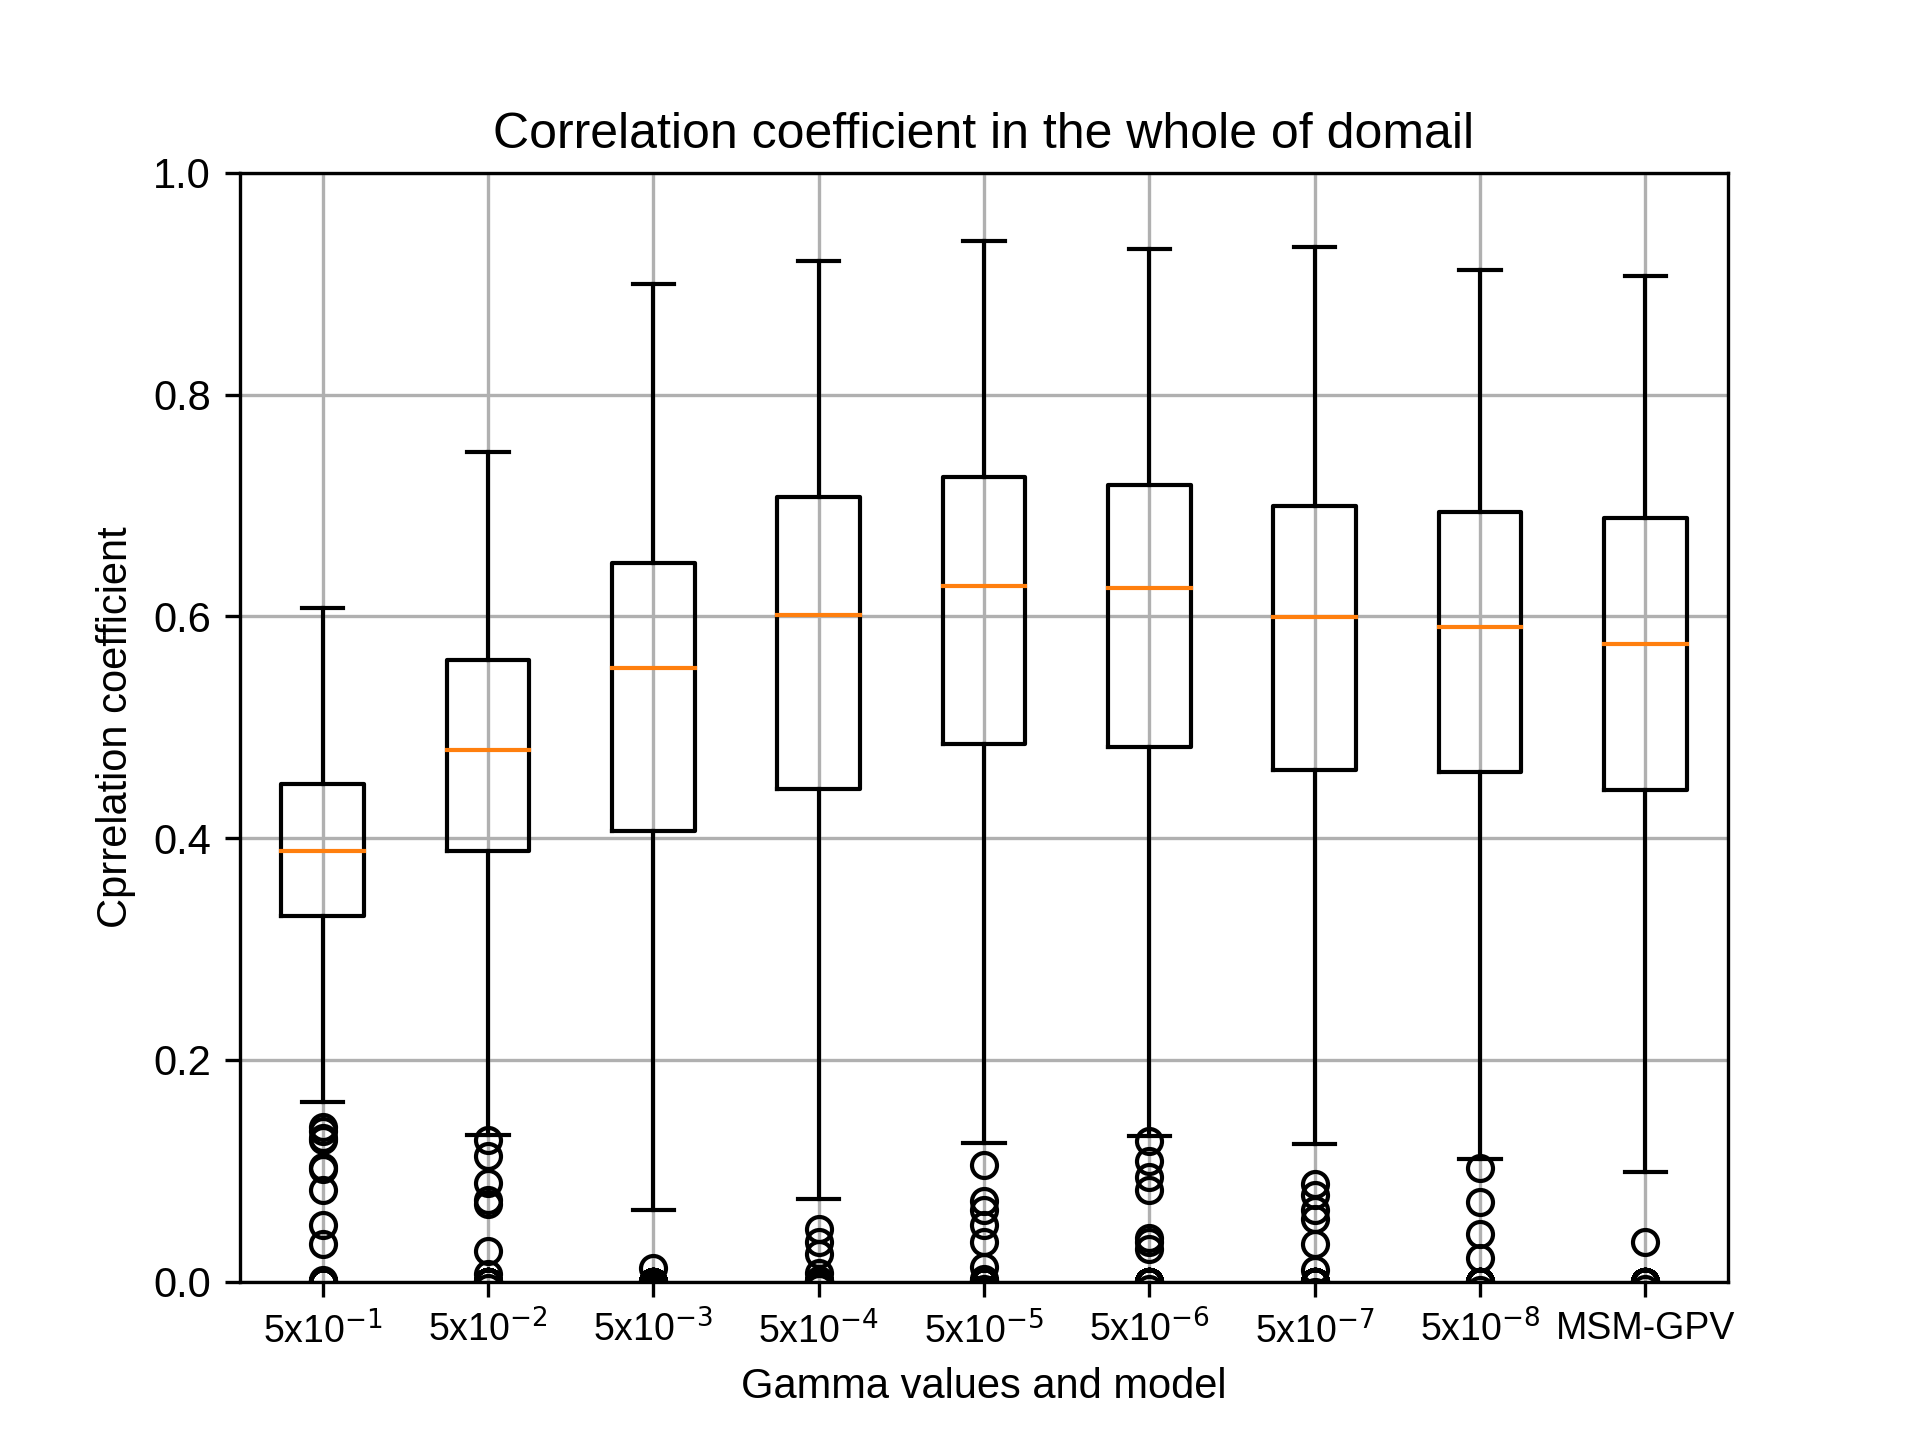
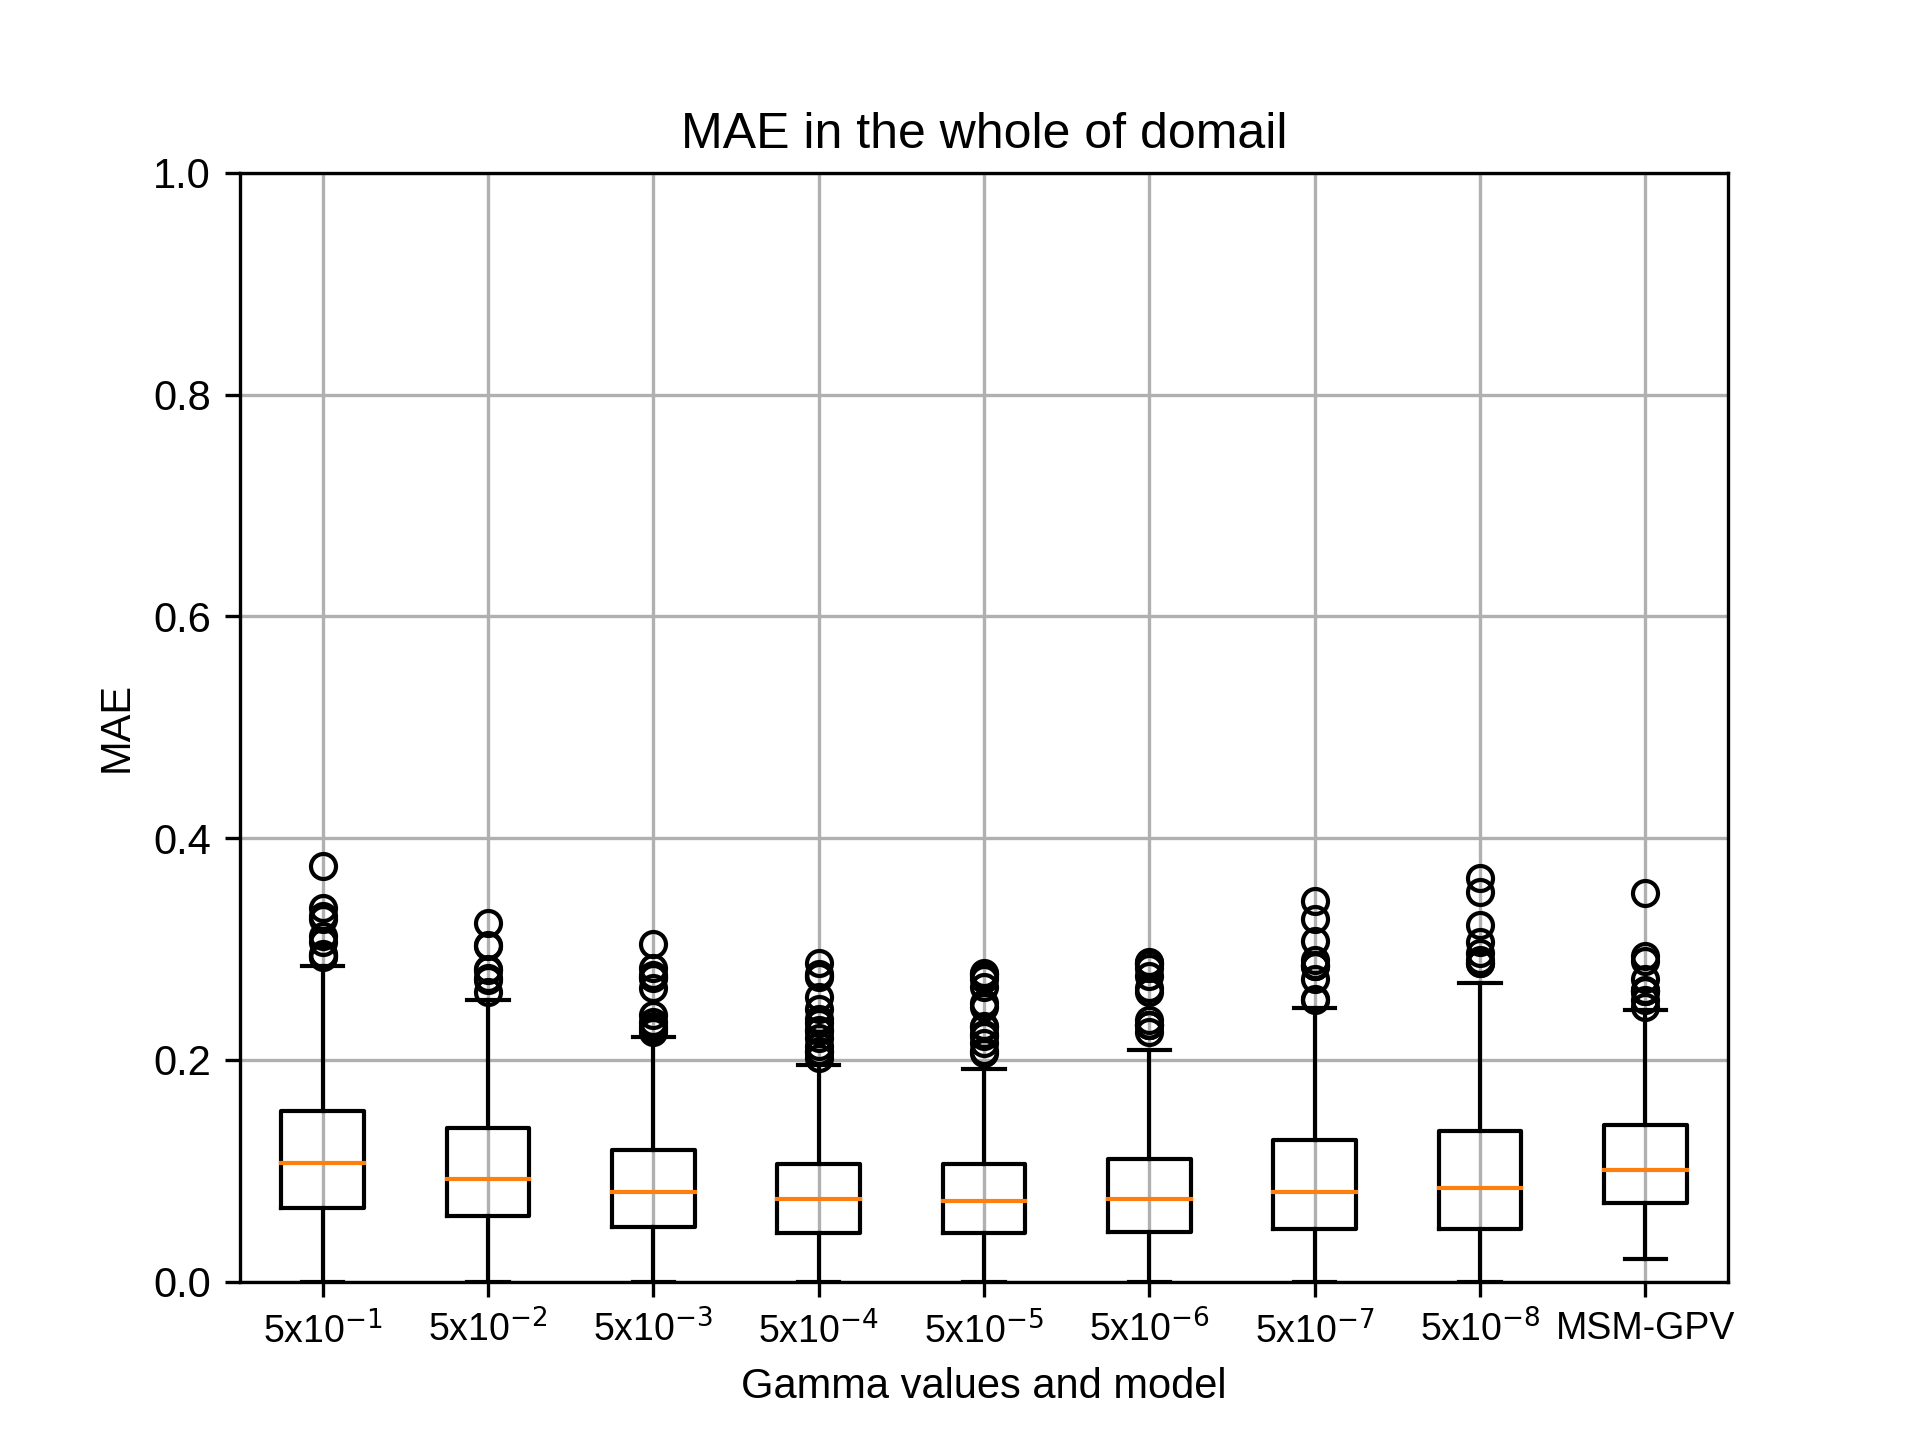
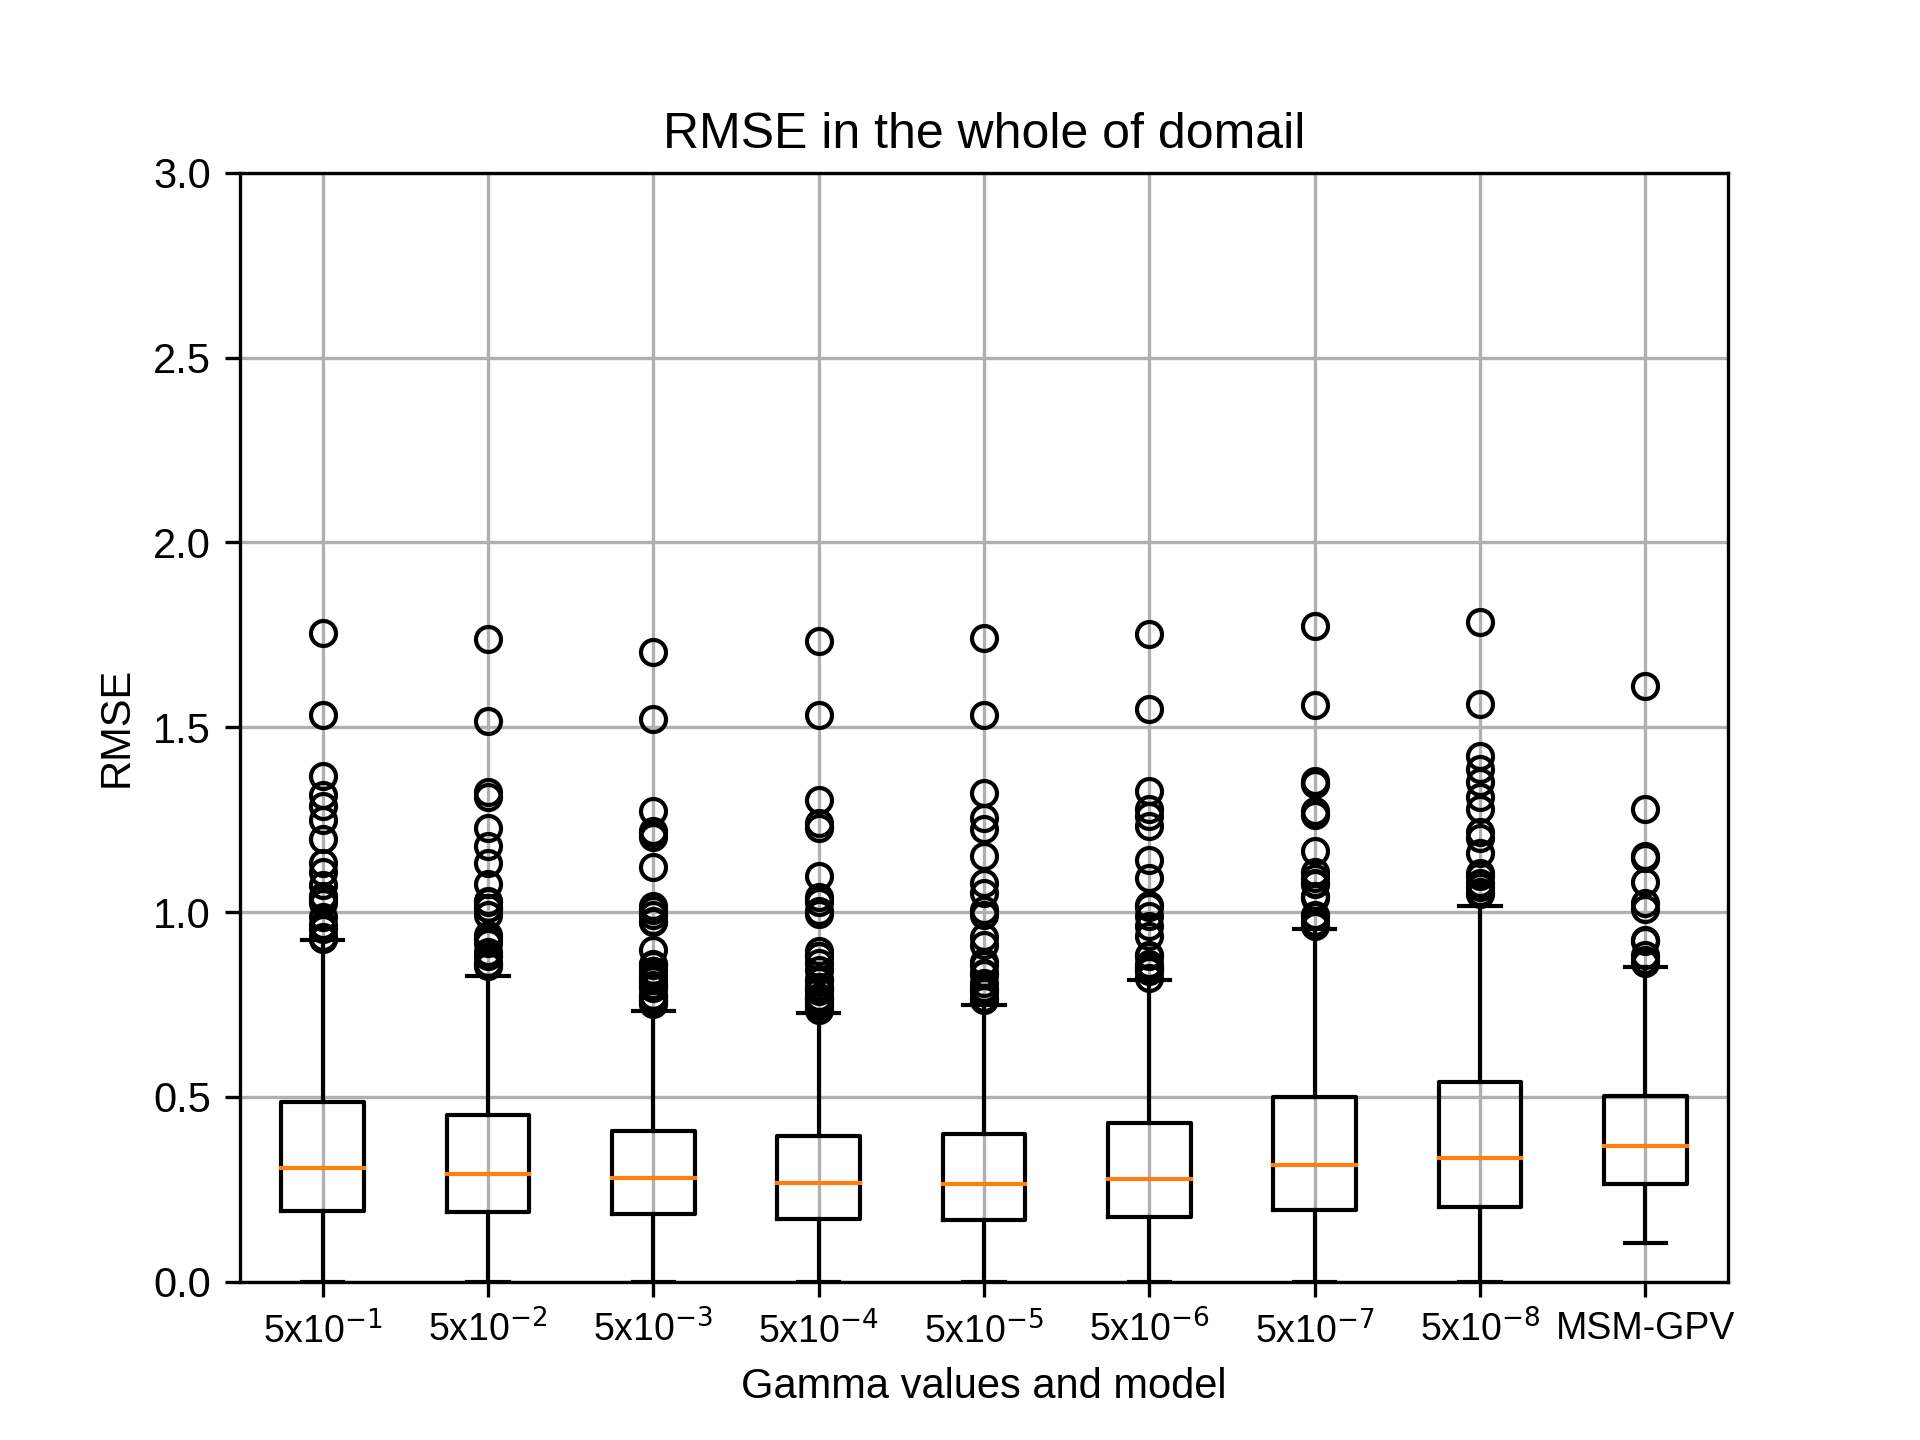
4月のsiteA,rg2=6の結果です。
kobayashi_yusukeThursday, October 22nd, 2020 at 4:21:30 PM GMT+09:00

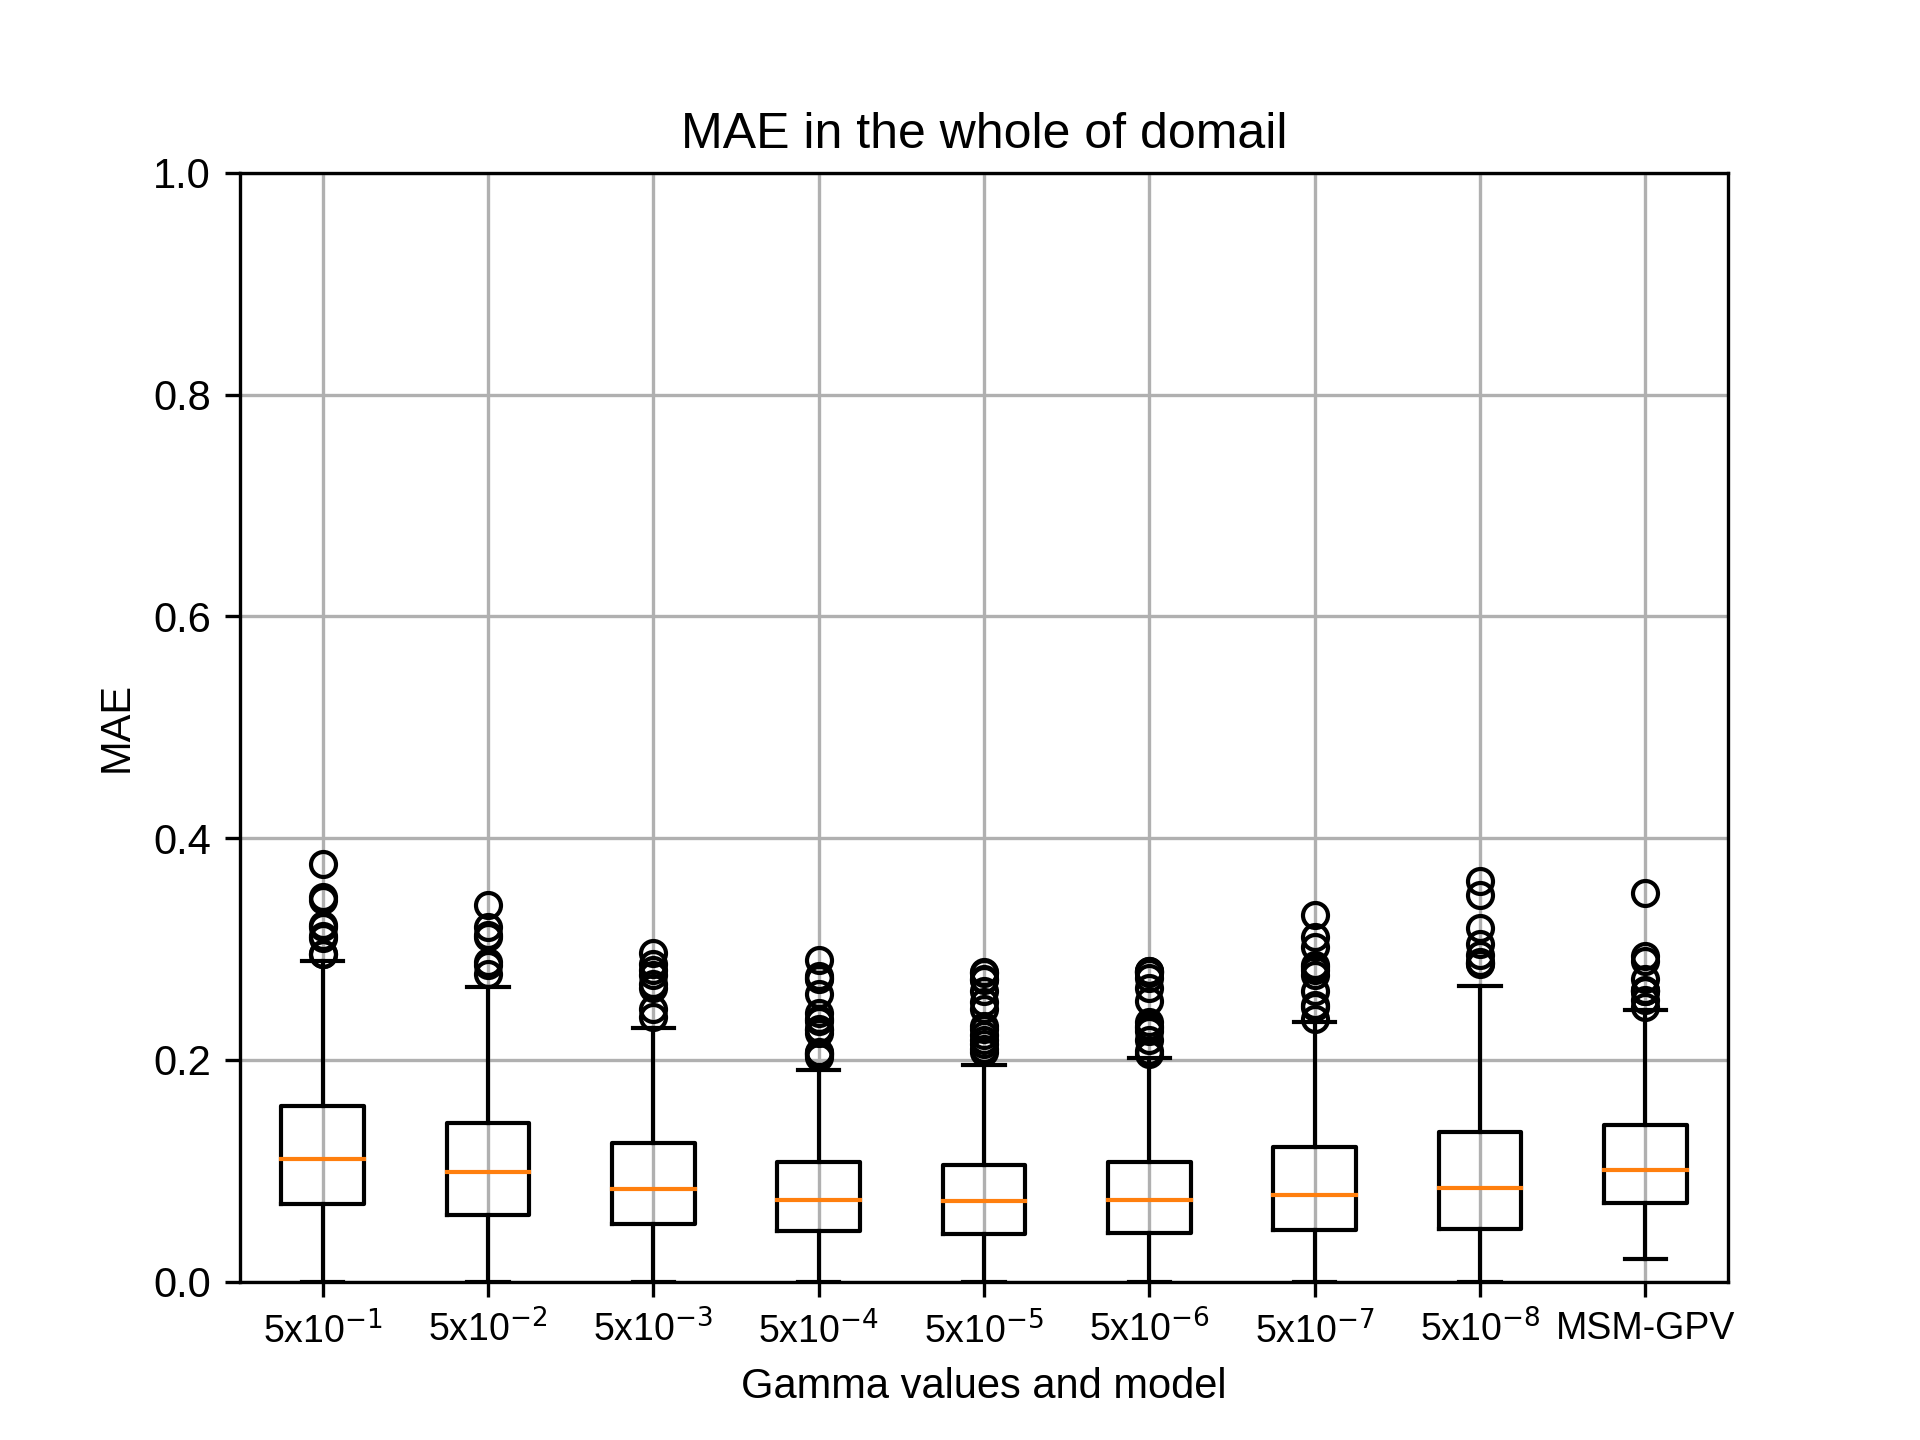
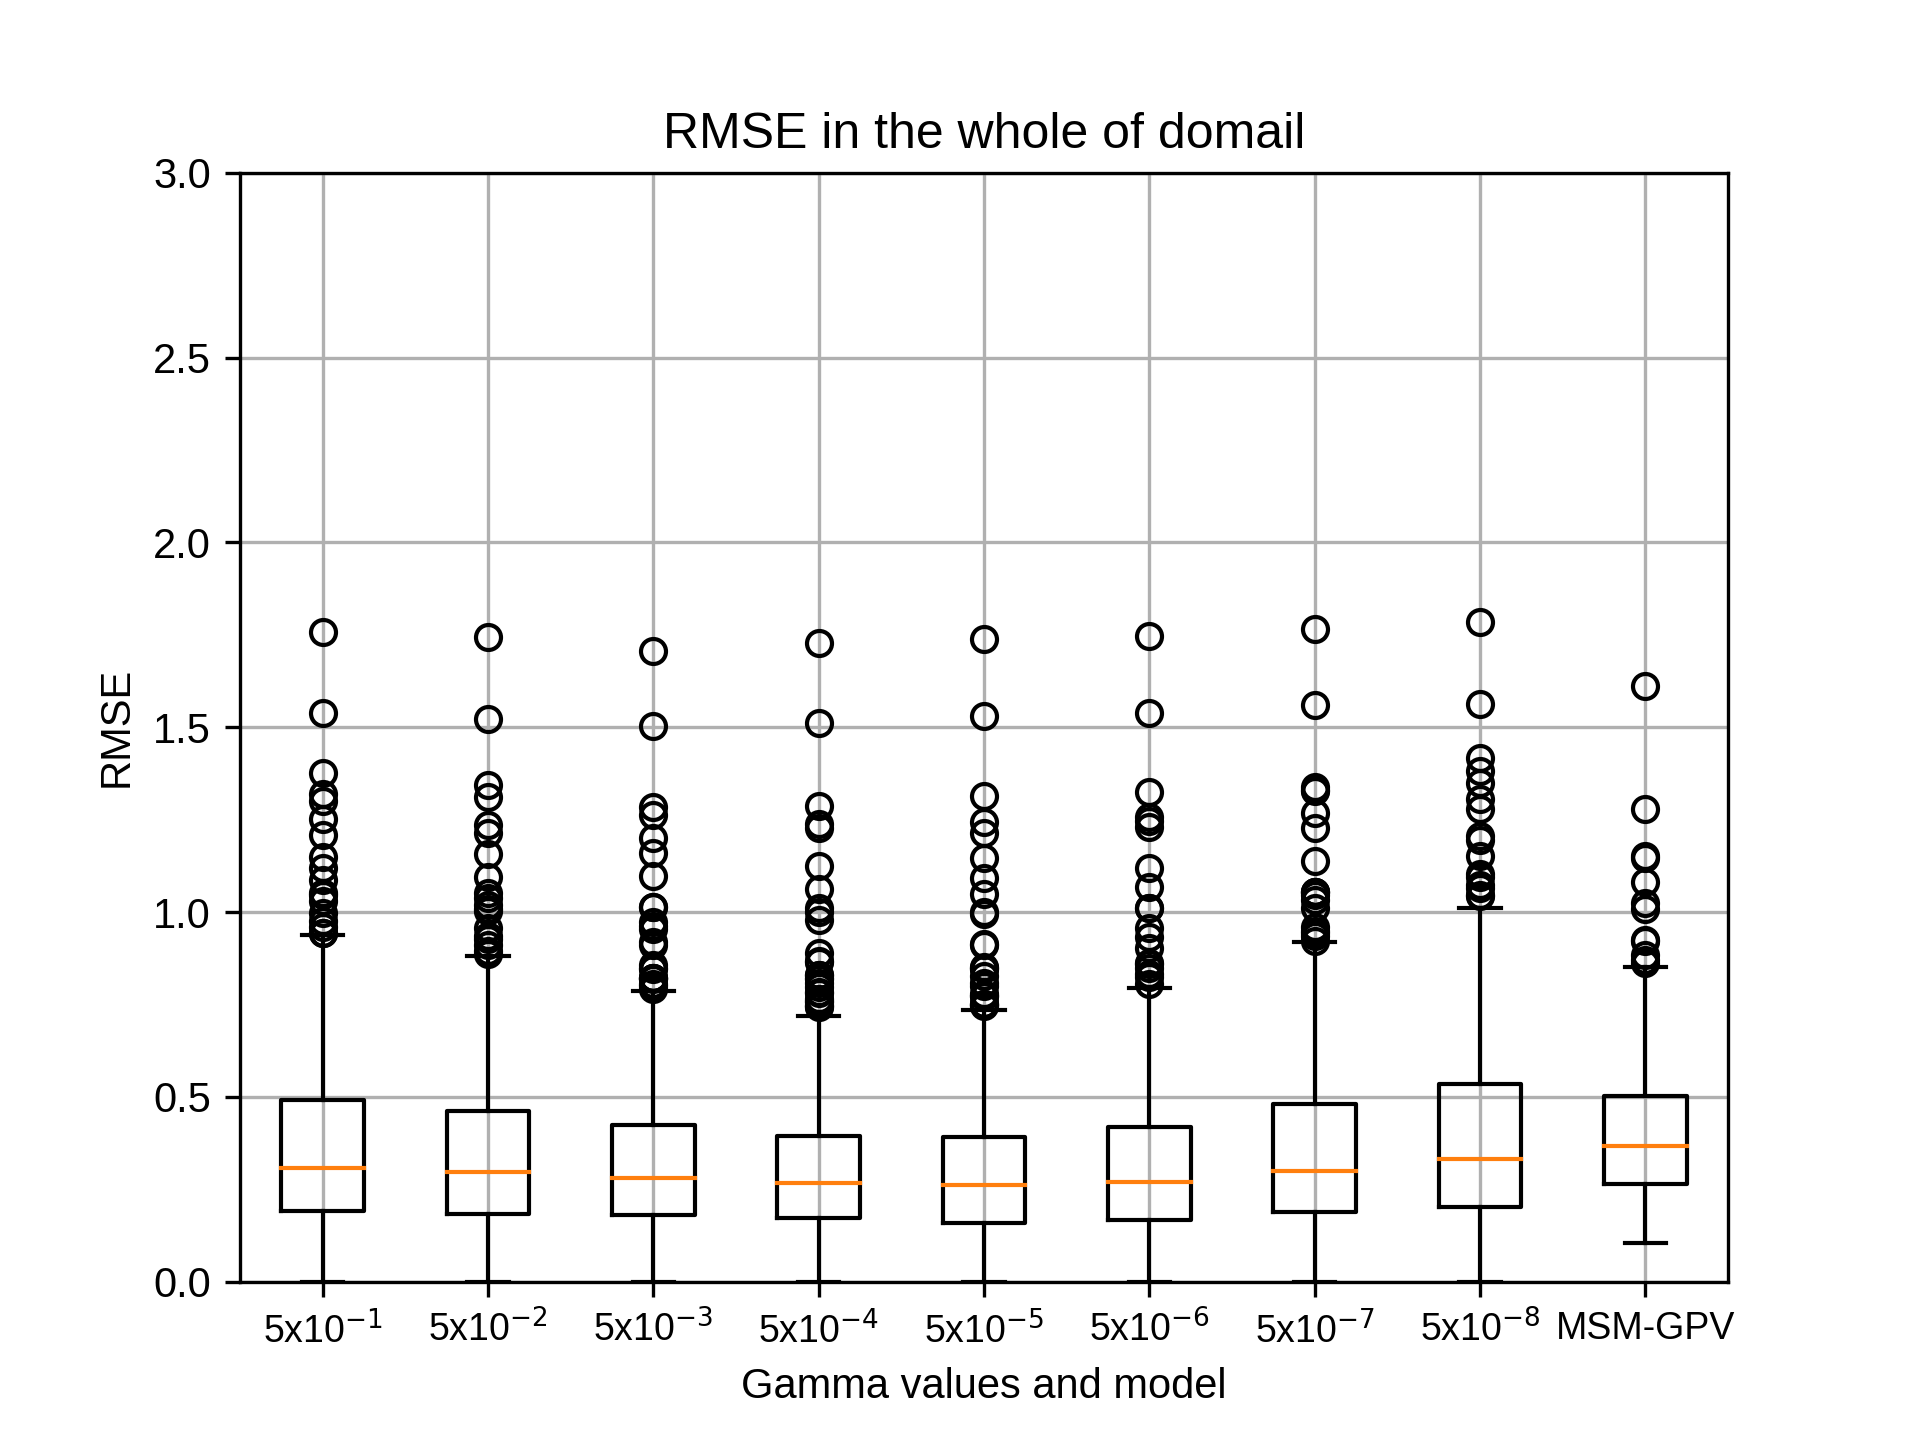
4月のsiteA,rg2=8の結果です。
kobayashi_yusukeThursday, October 22nd, 2020 at 4:21:50 PM GMT+09:00

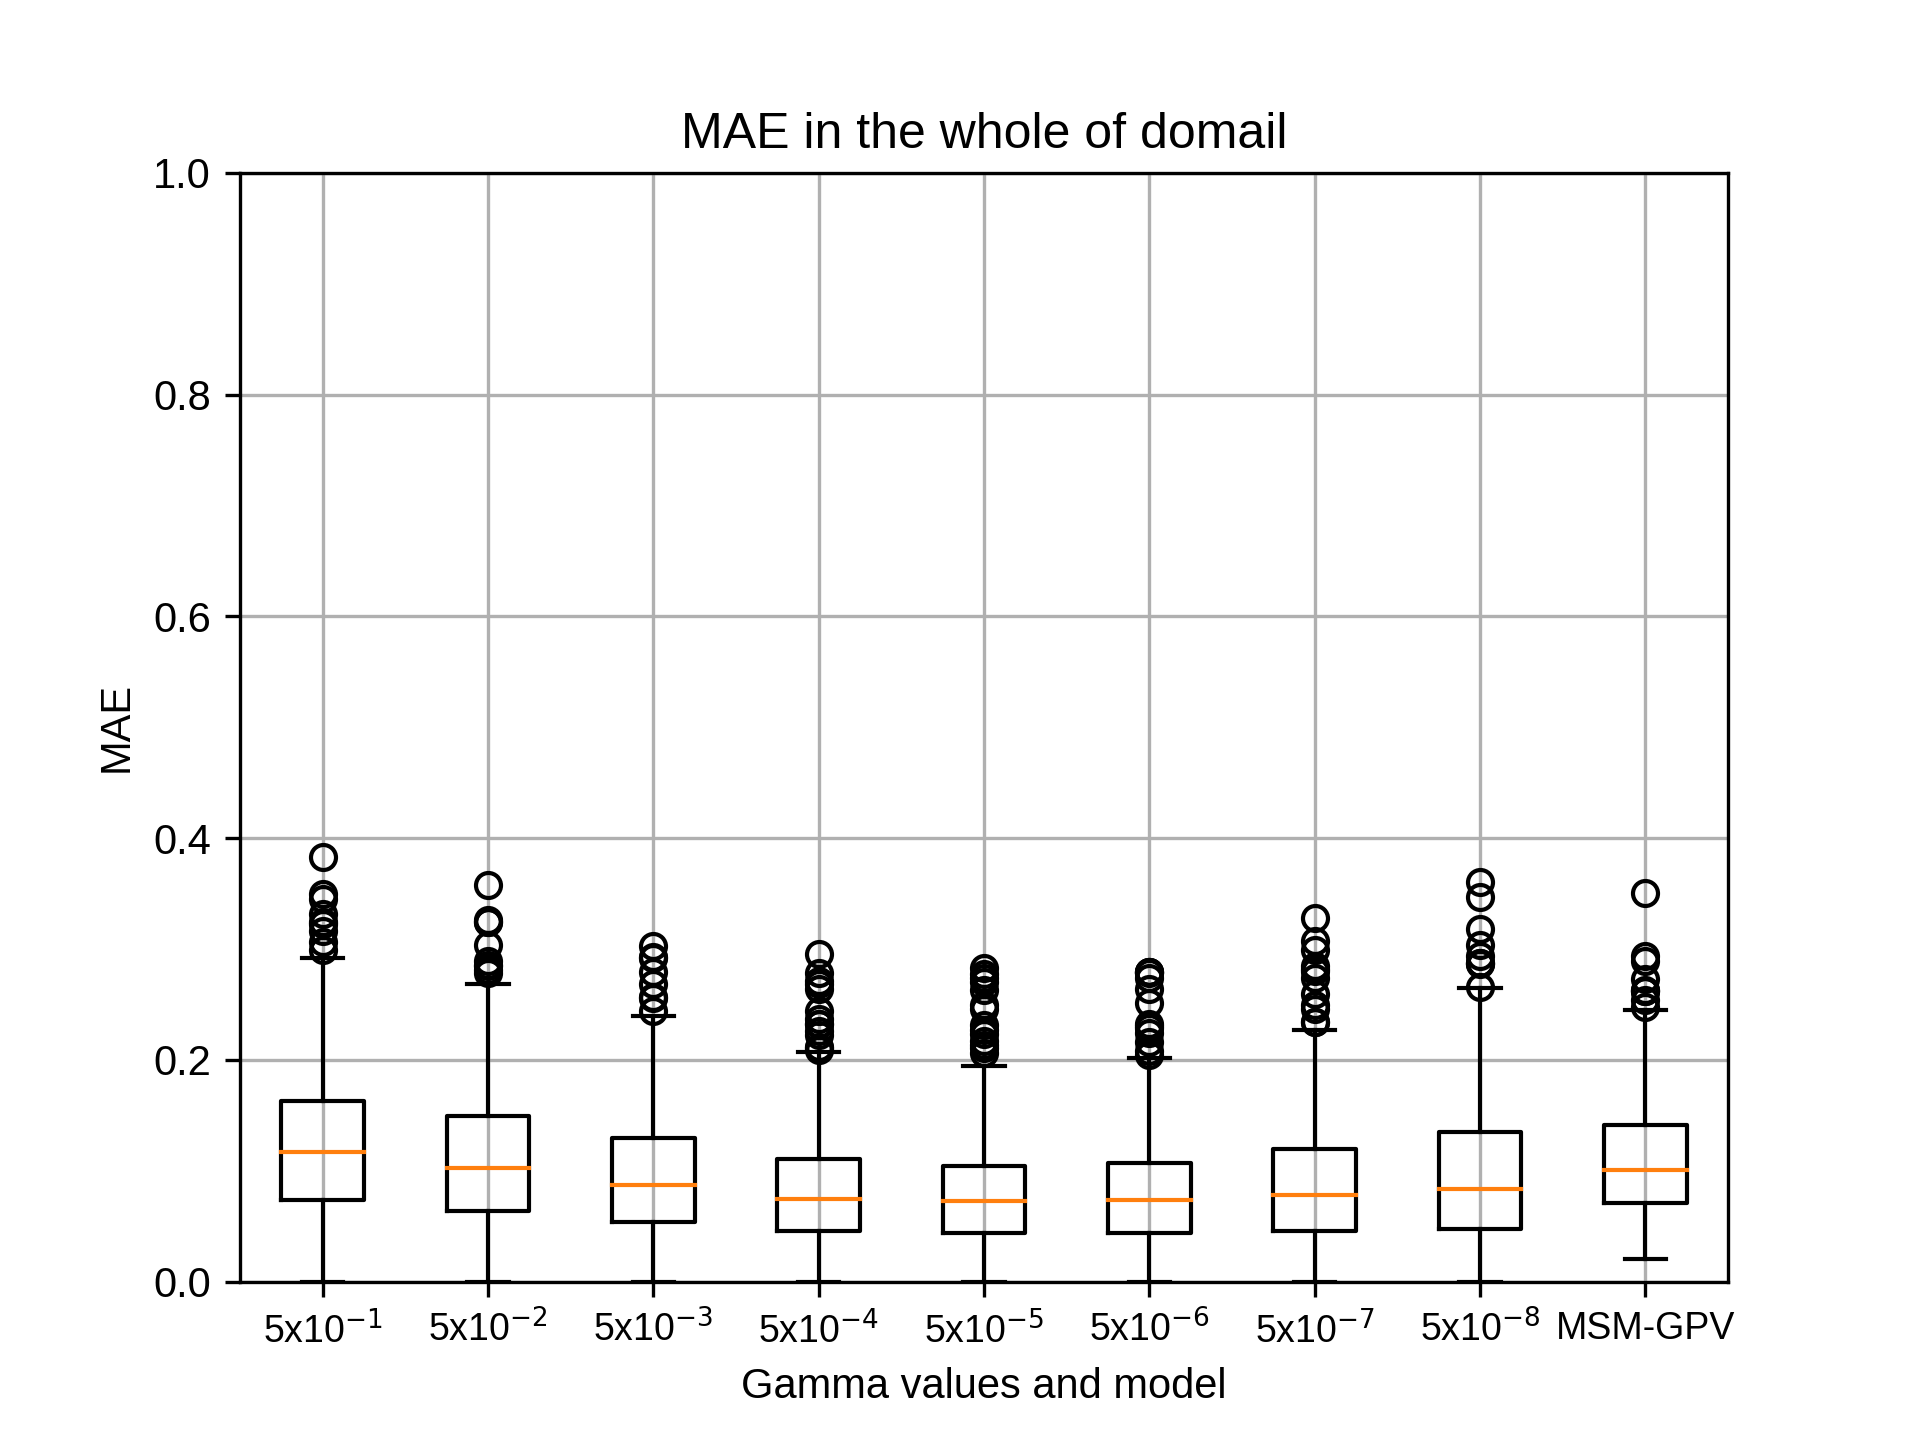
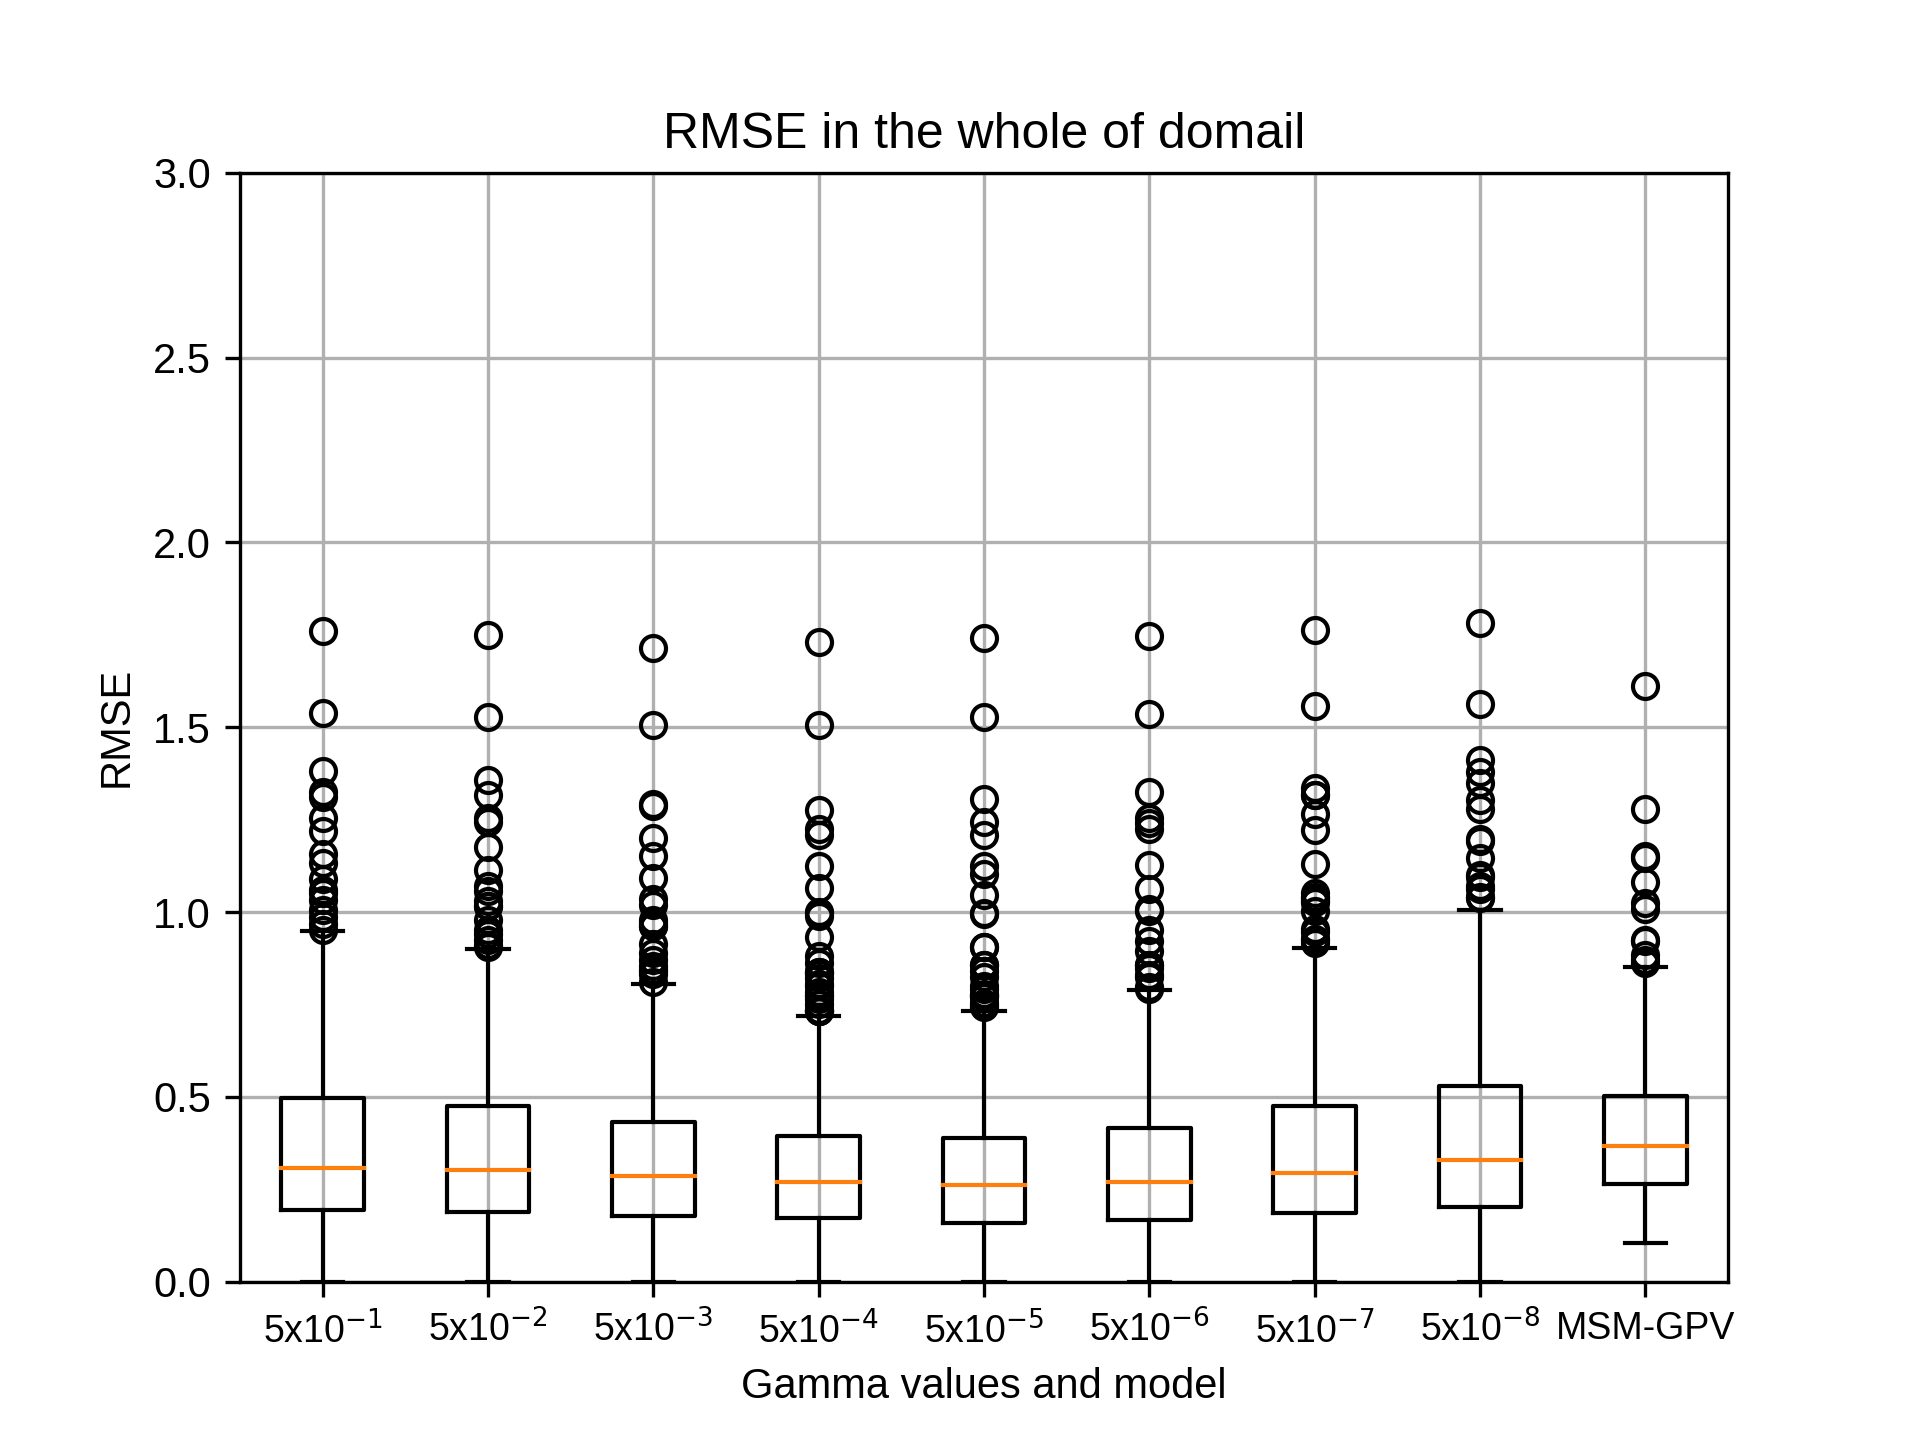
4月のsiteA,rg2=10の結果です。
kobayashi_yusukeThursday, October 22nd, 2020 at 4:22:06 PM GMT+09:00
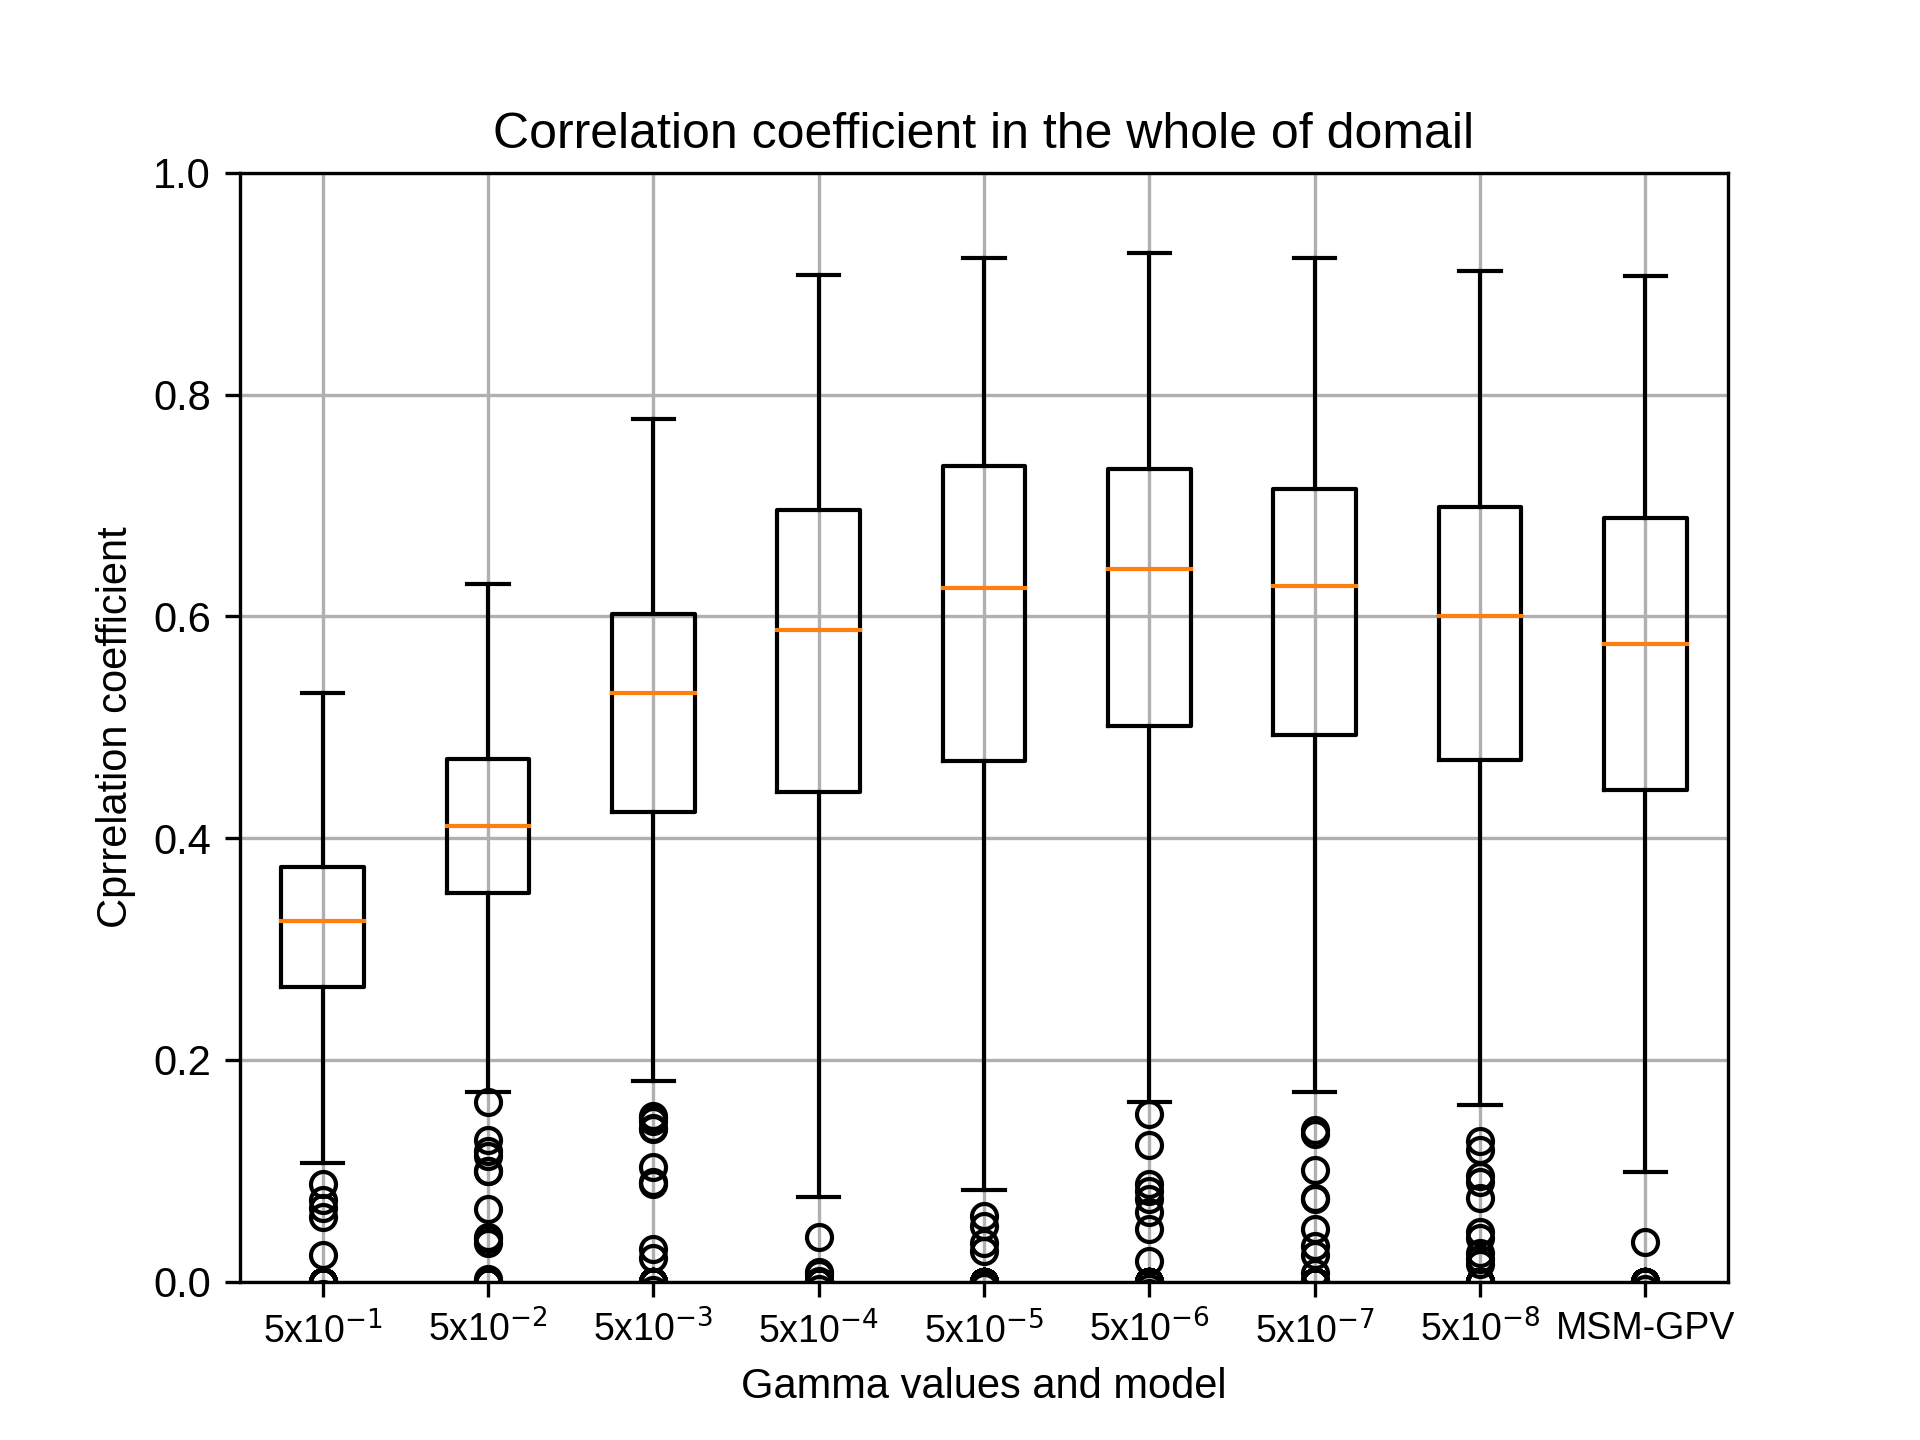
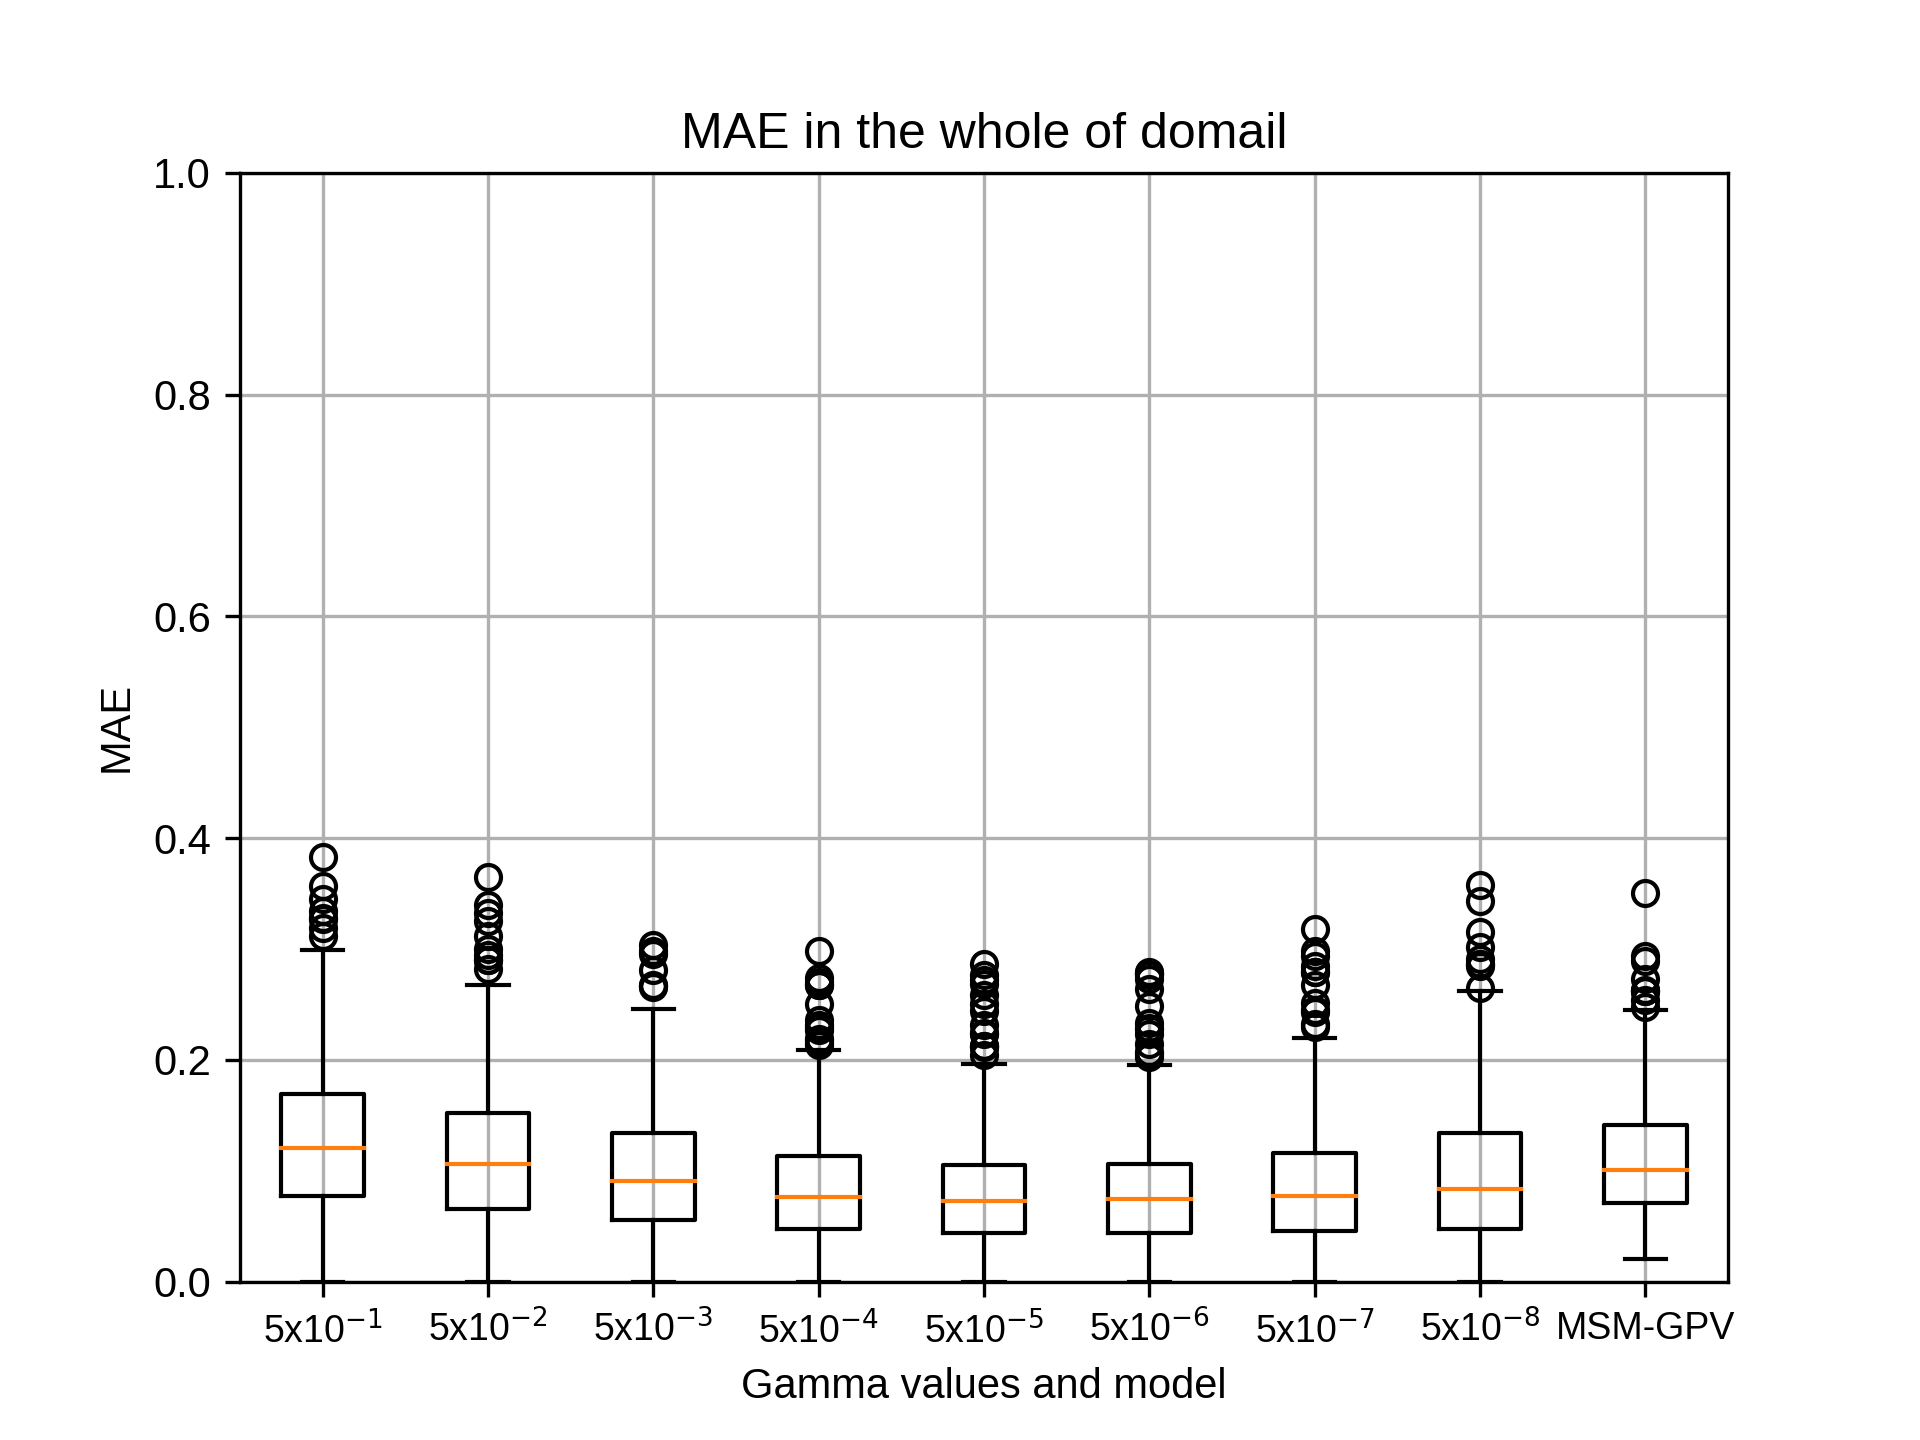
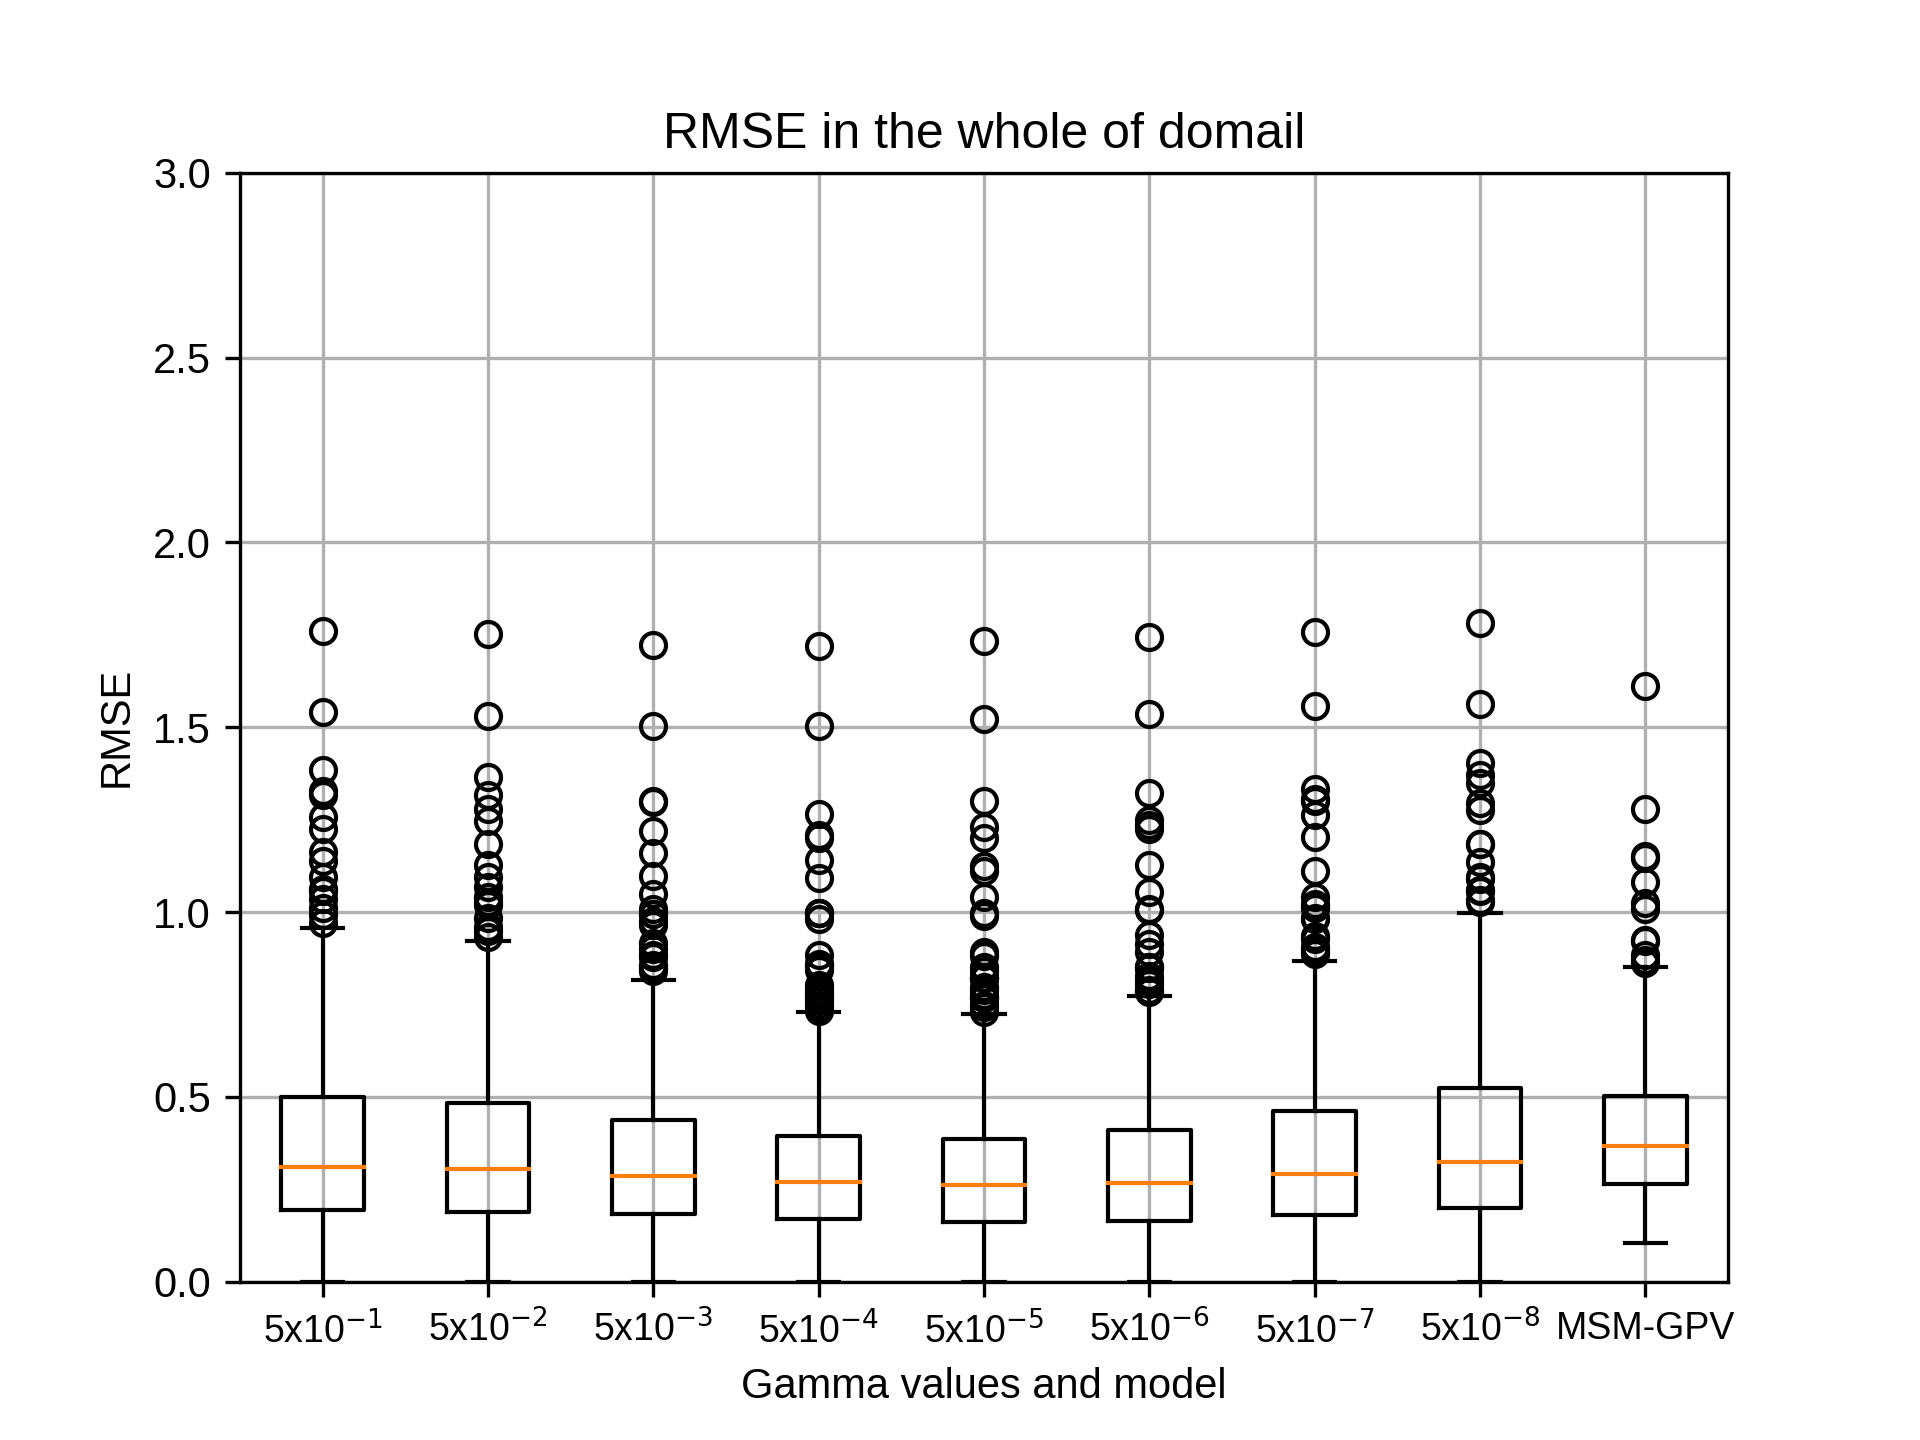
4月のsiteA,rg2=12の結果です。
4月のsiteAではrg2=12でgammaが5x10⁻⁶のとき、相関係数の中央値が最も高くなりました。
4月のsiteAではrg2=12でgammaが5x10⁻⁶のとき、相関係数の中央値が最も高くなりました。
kobayashi_yusukeThursday, October 22nd, 2020 at 4:22:24 PM GMT+09:00
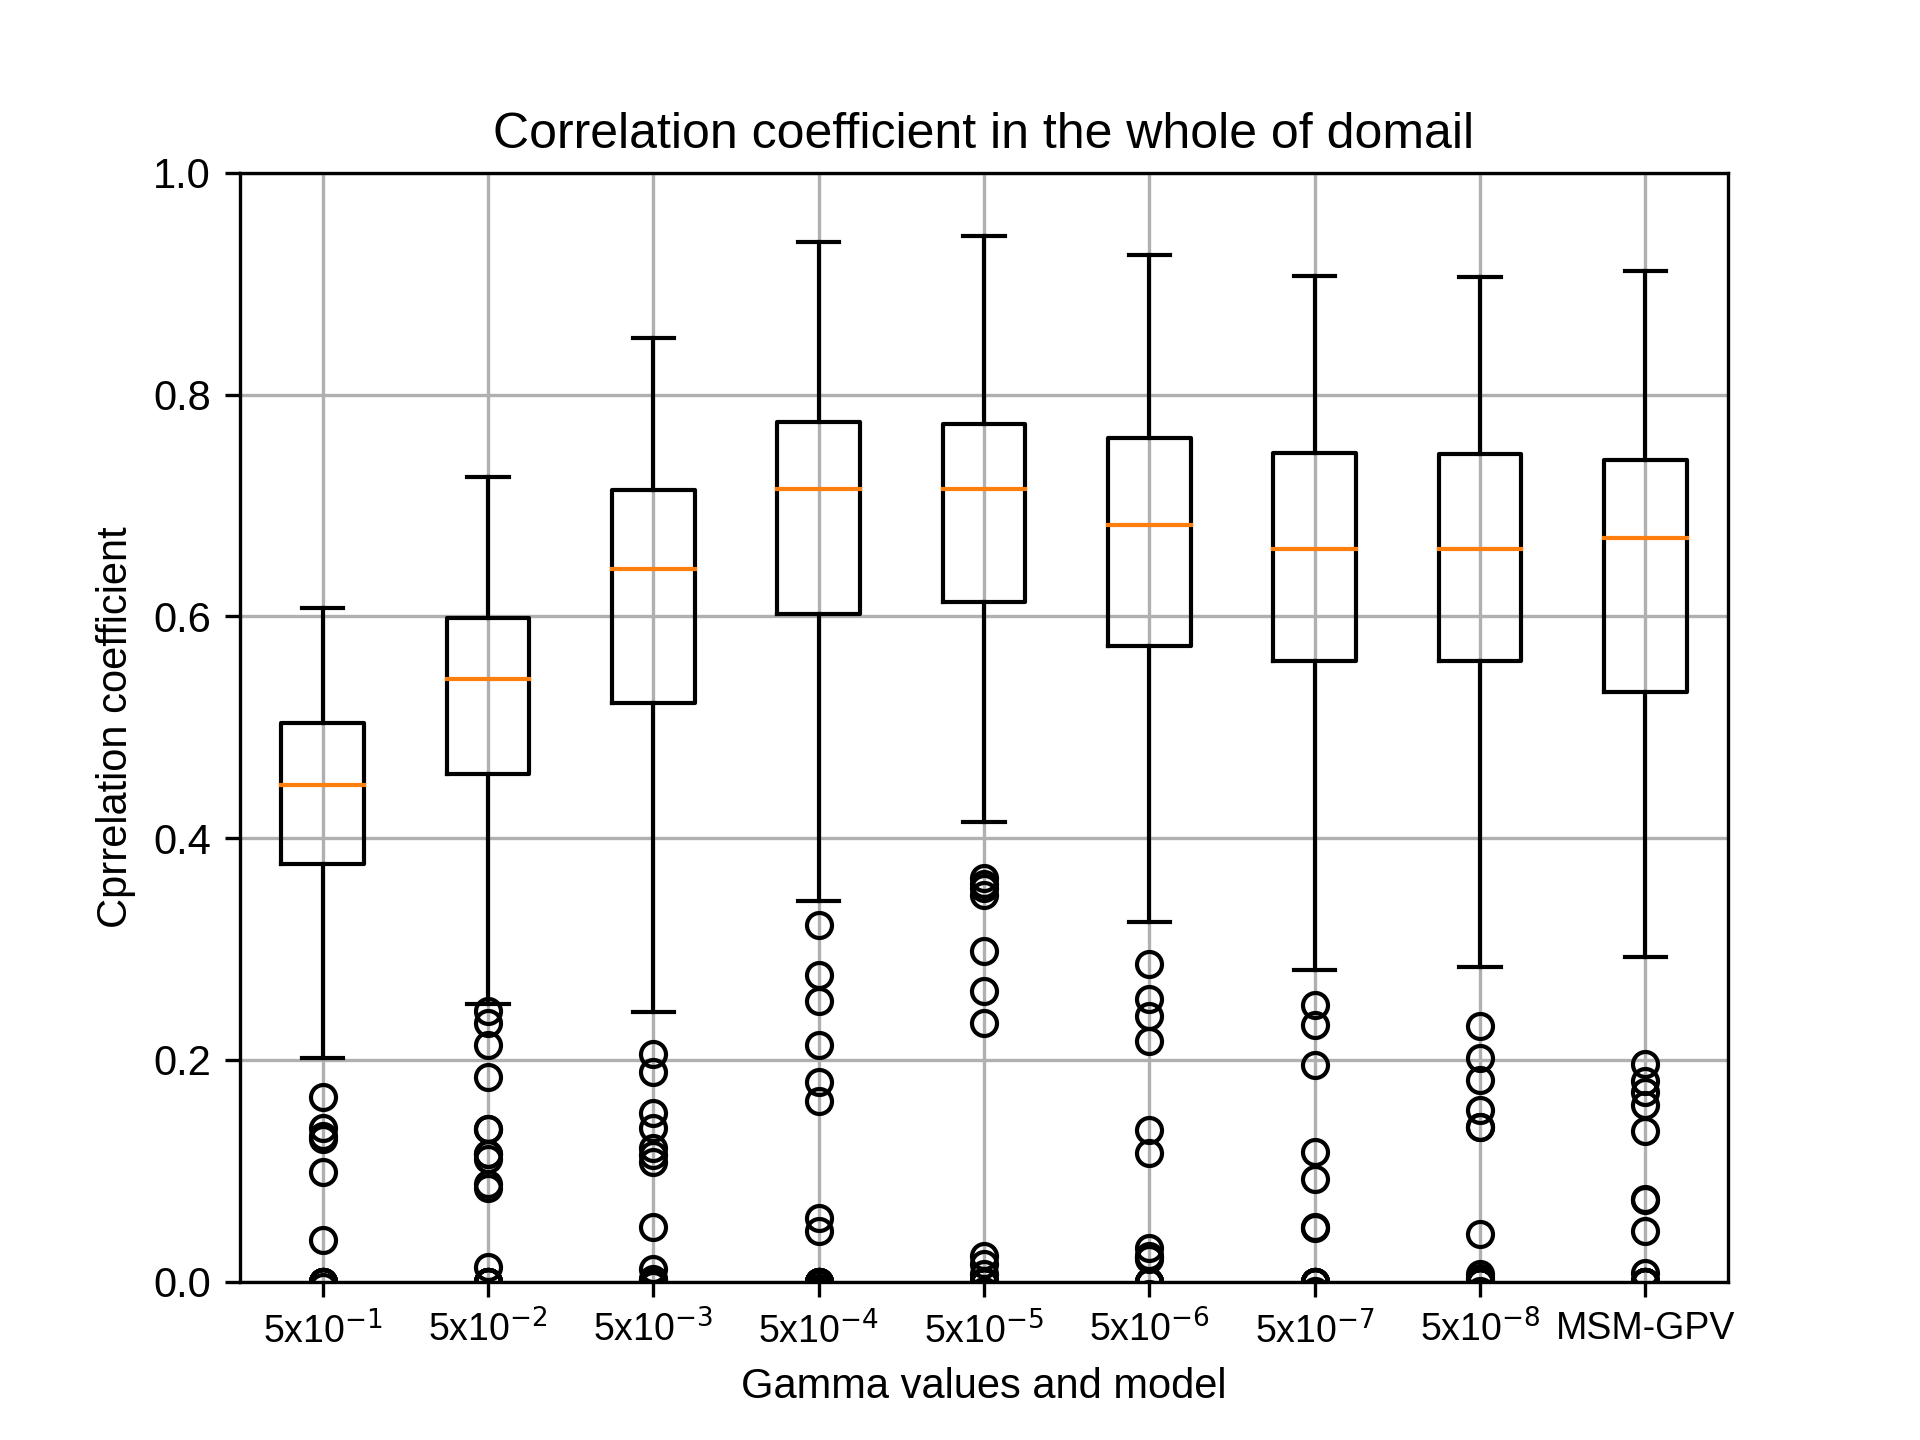
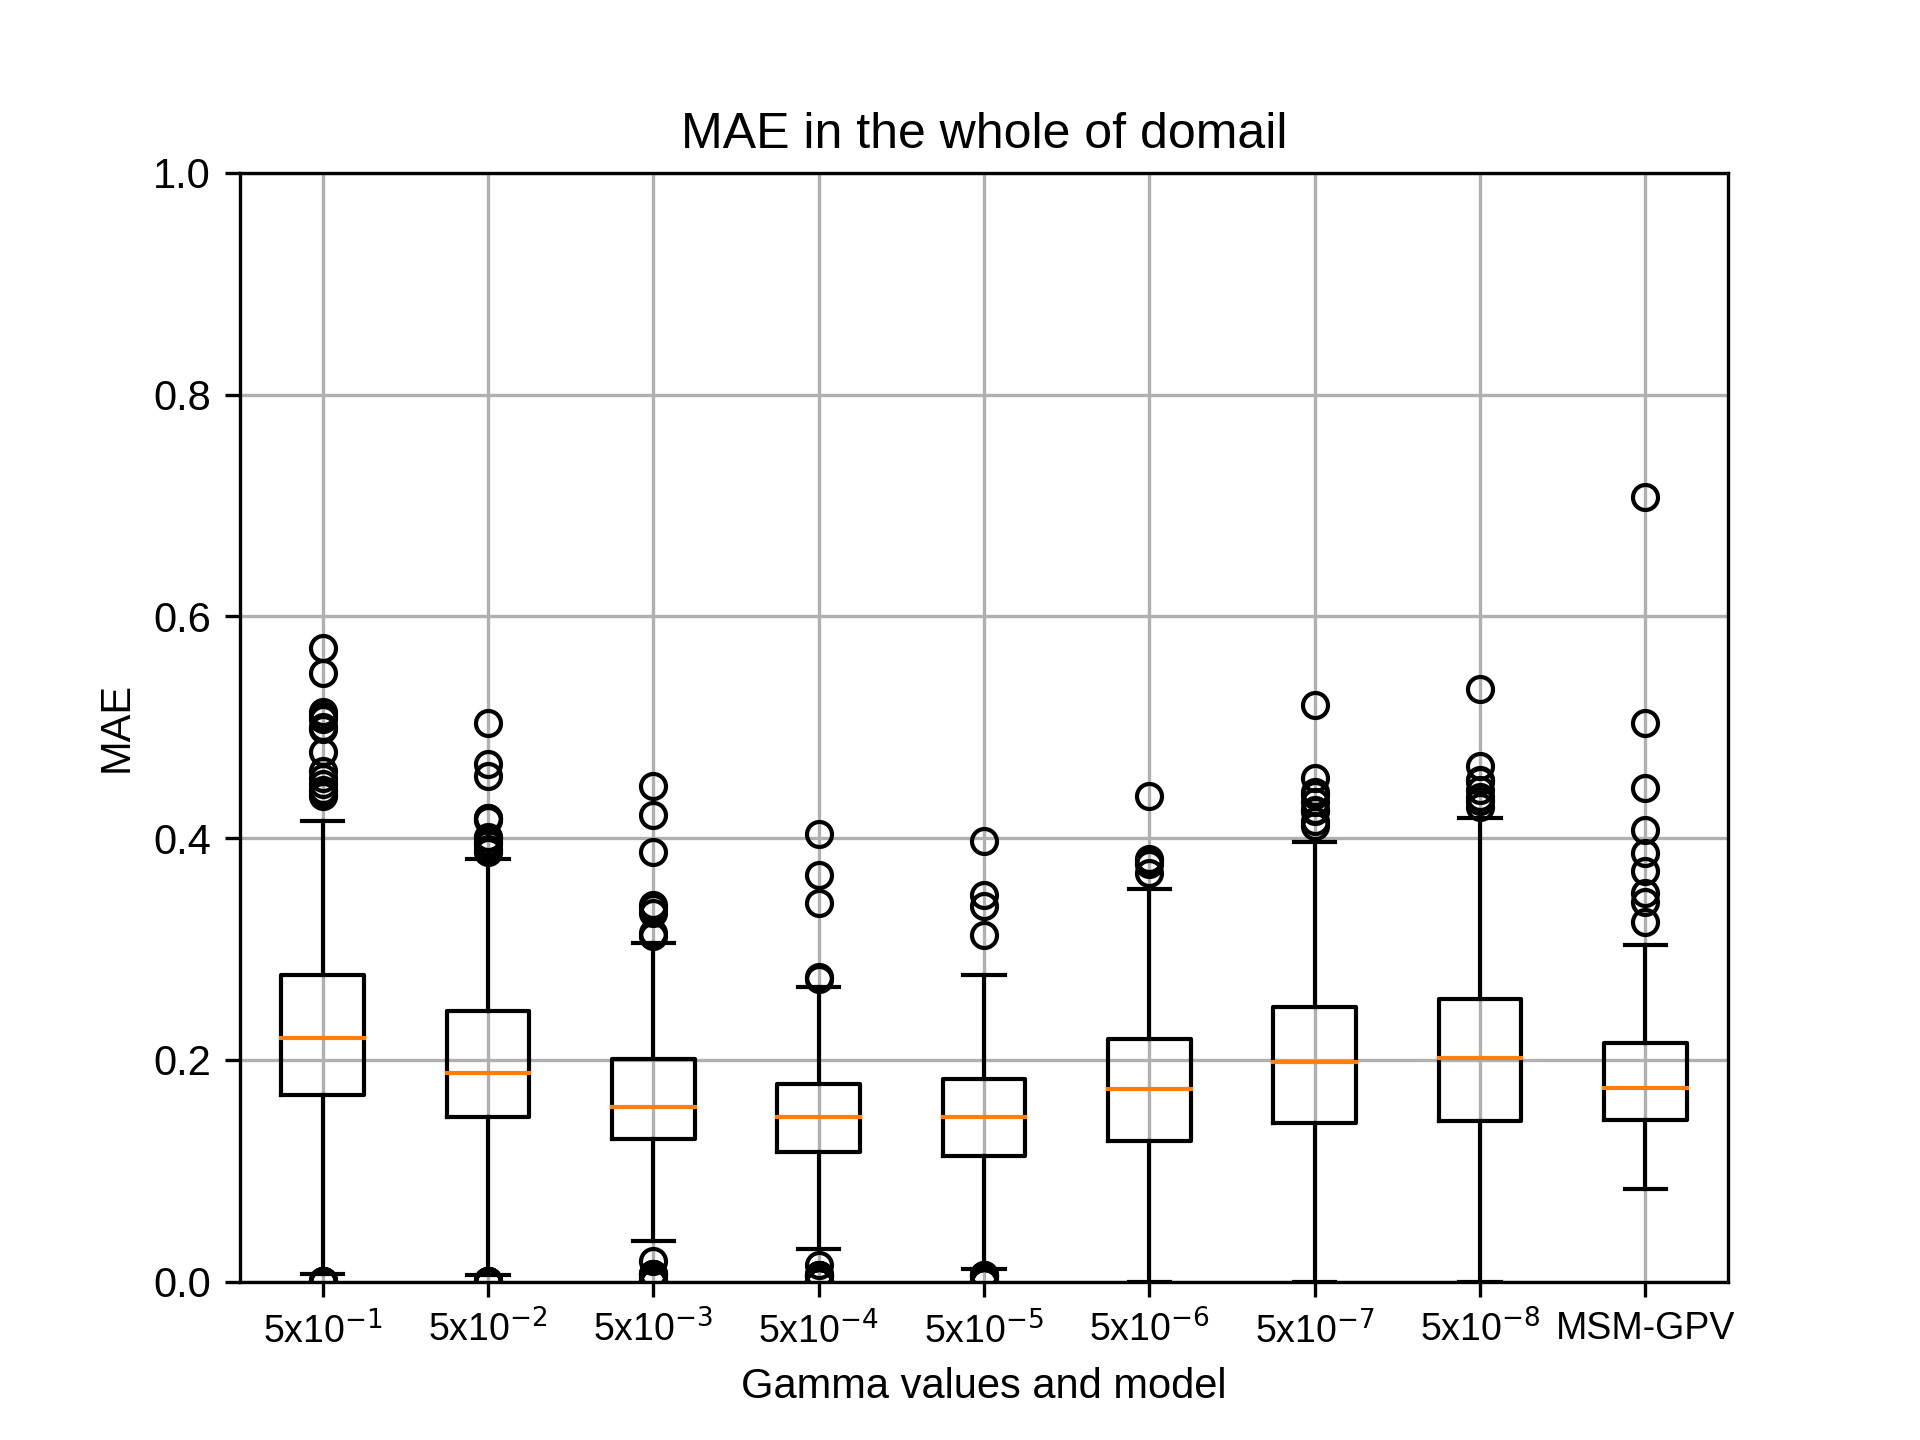
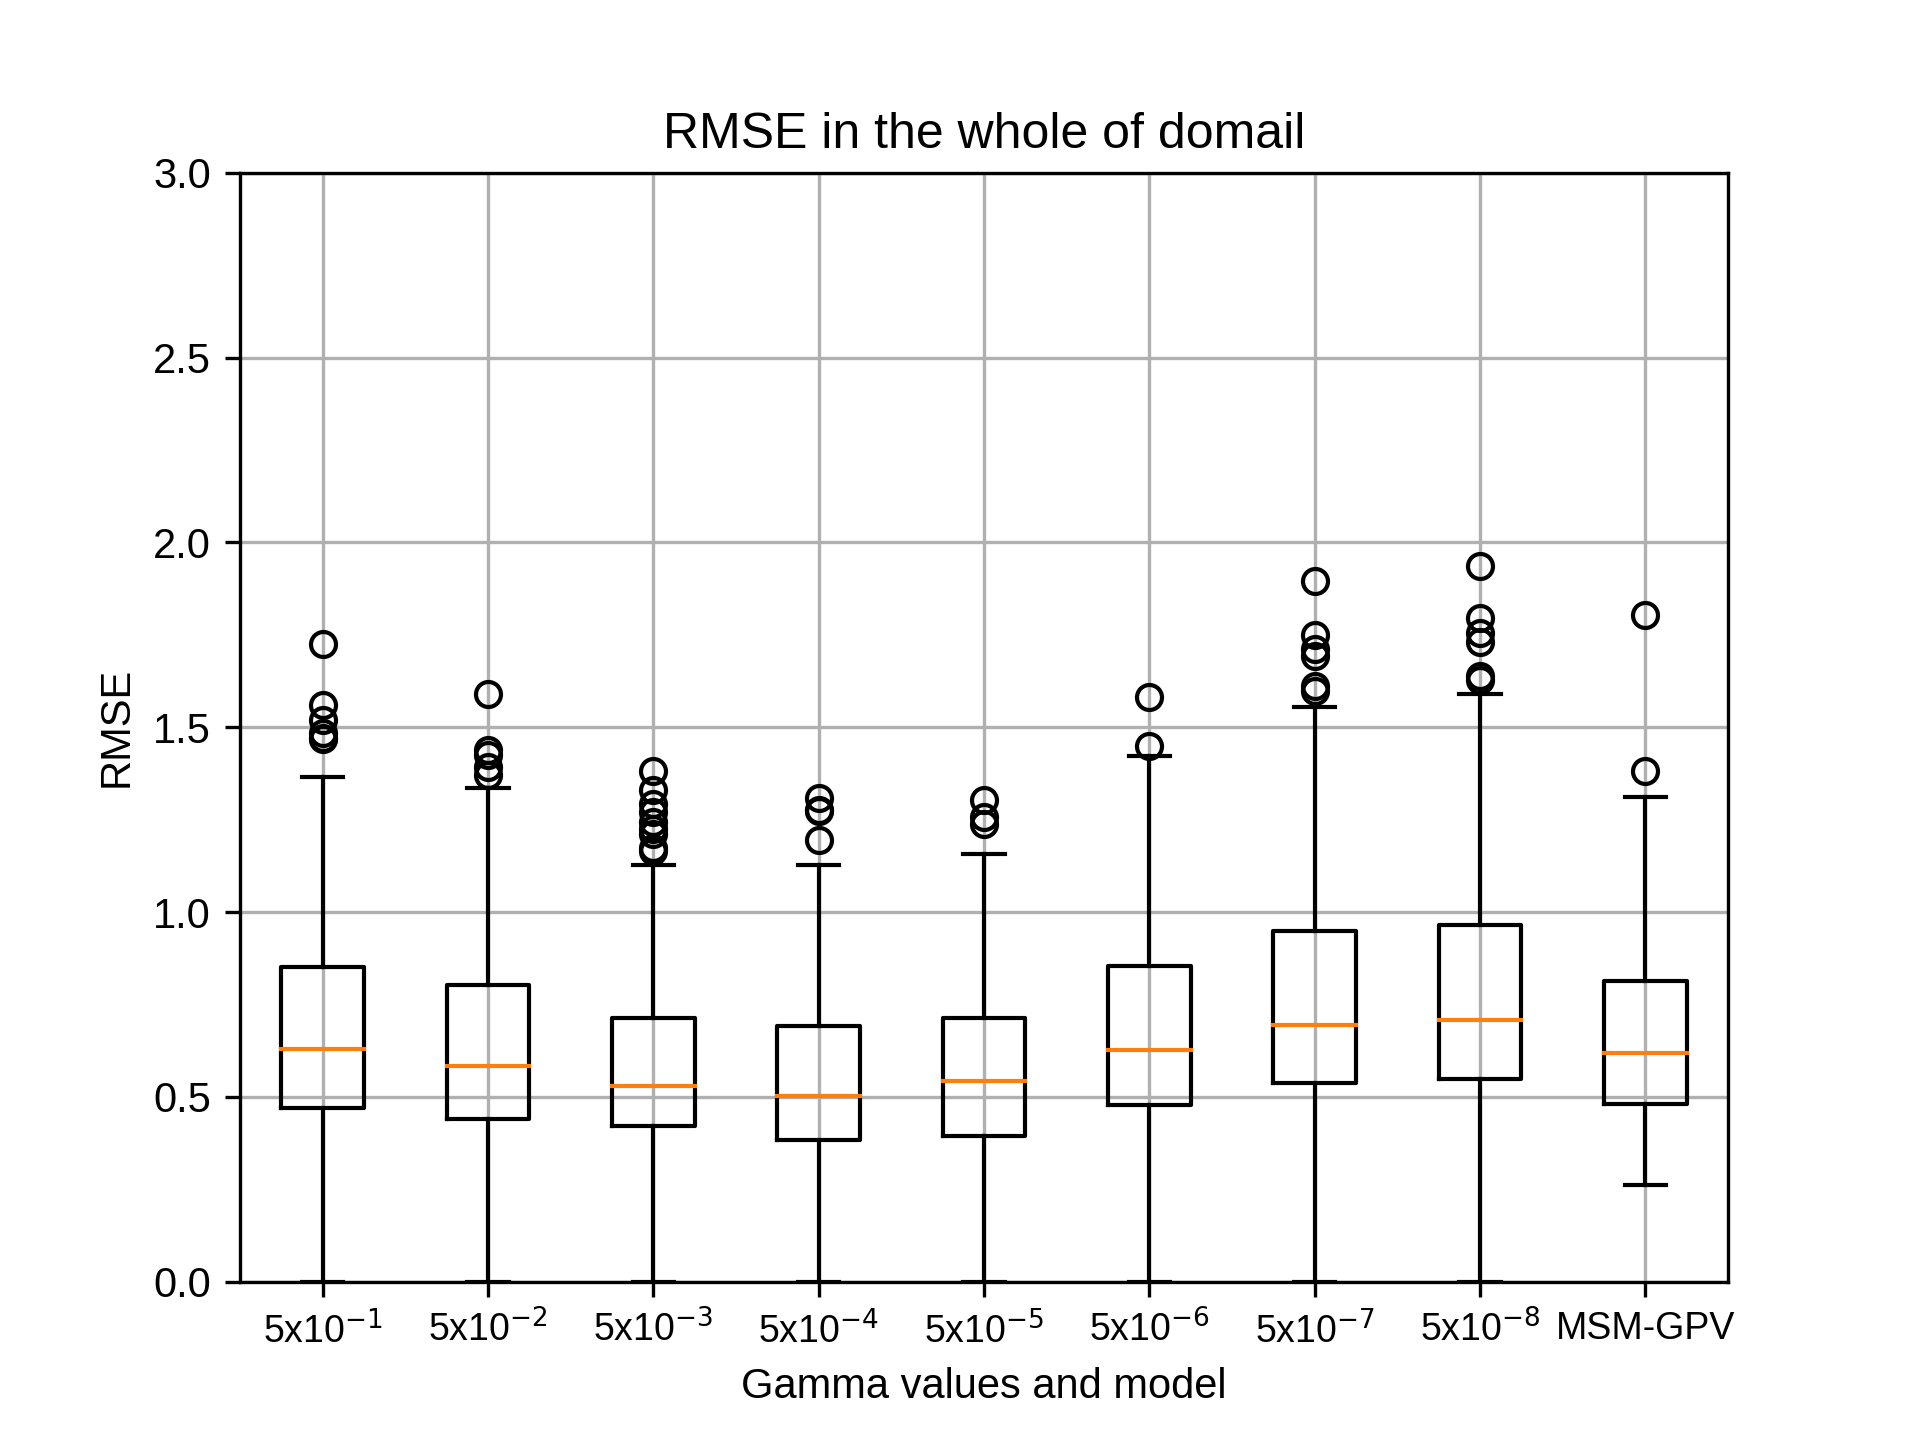
4月のsiteB,rg2=4の結果です。
kobayashi_yusukeThursday, October 22nd, 2020 at 4:22:35 PM GMT+09:00
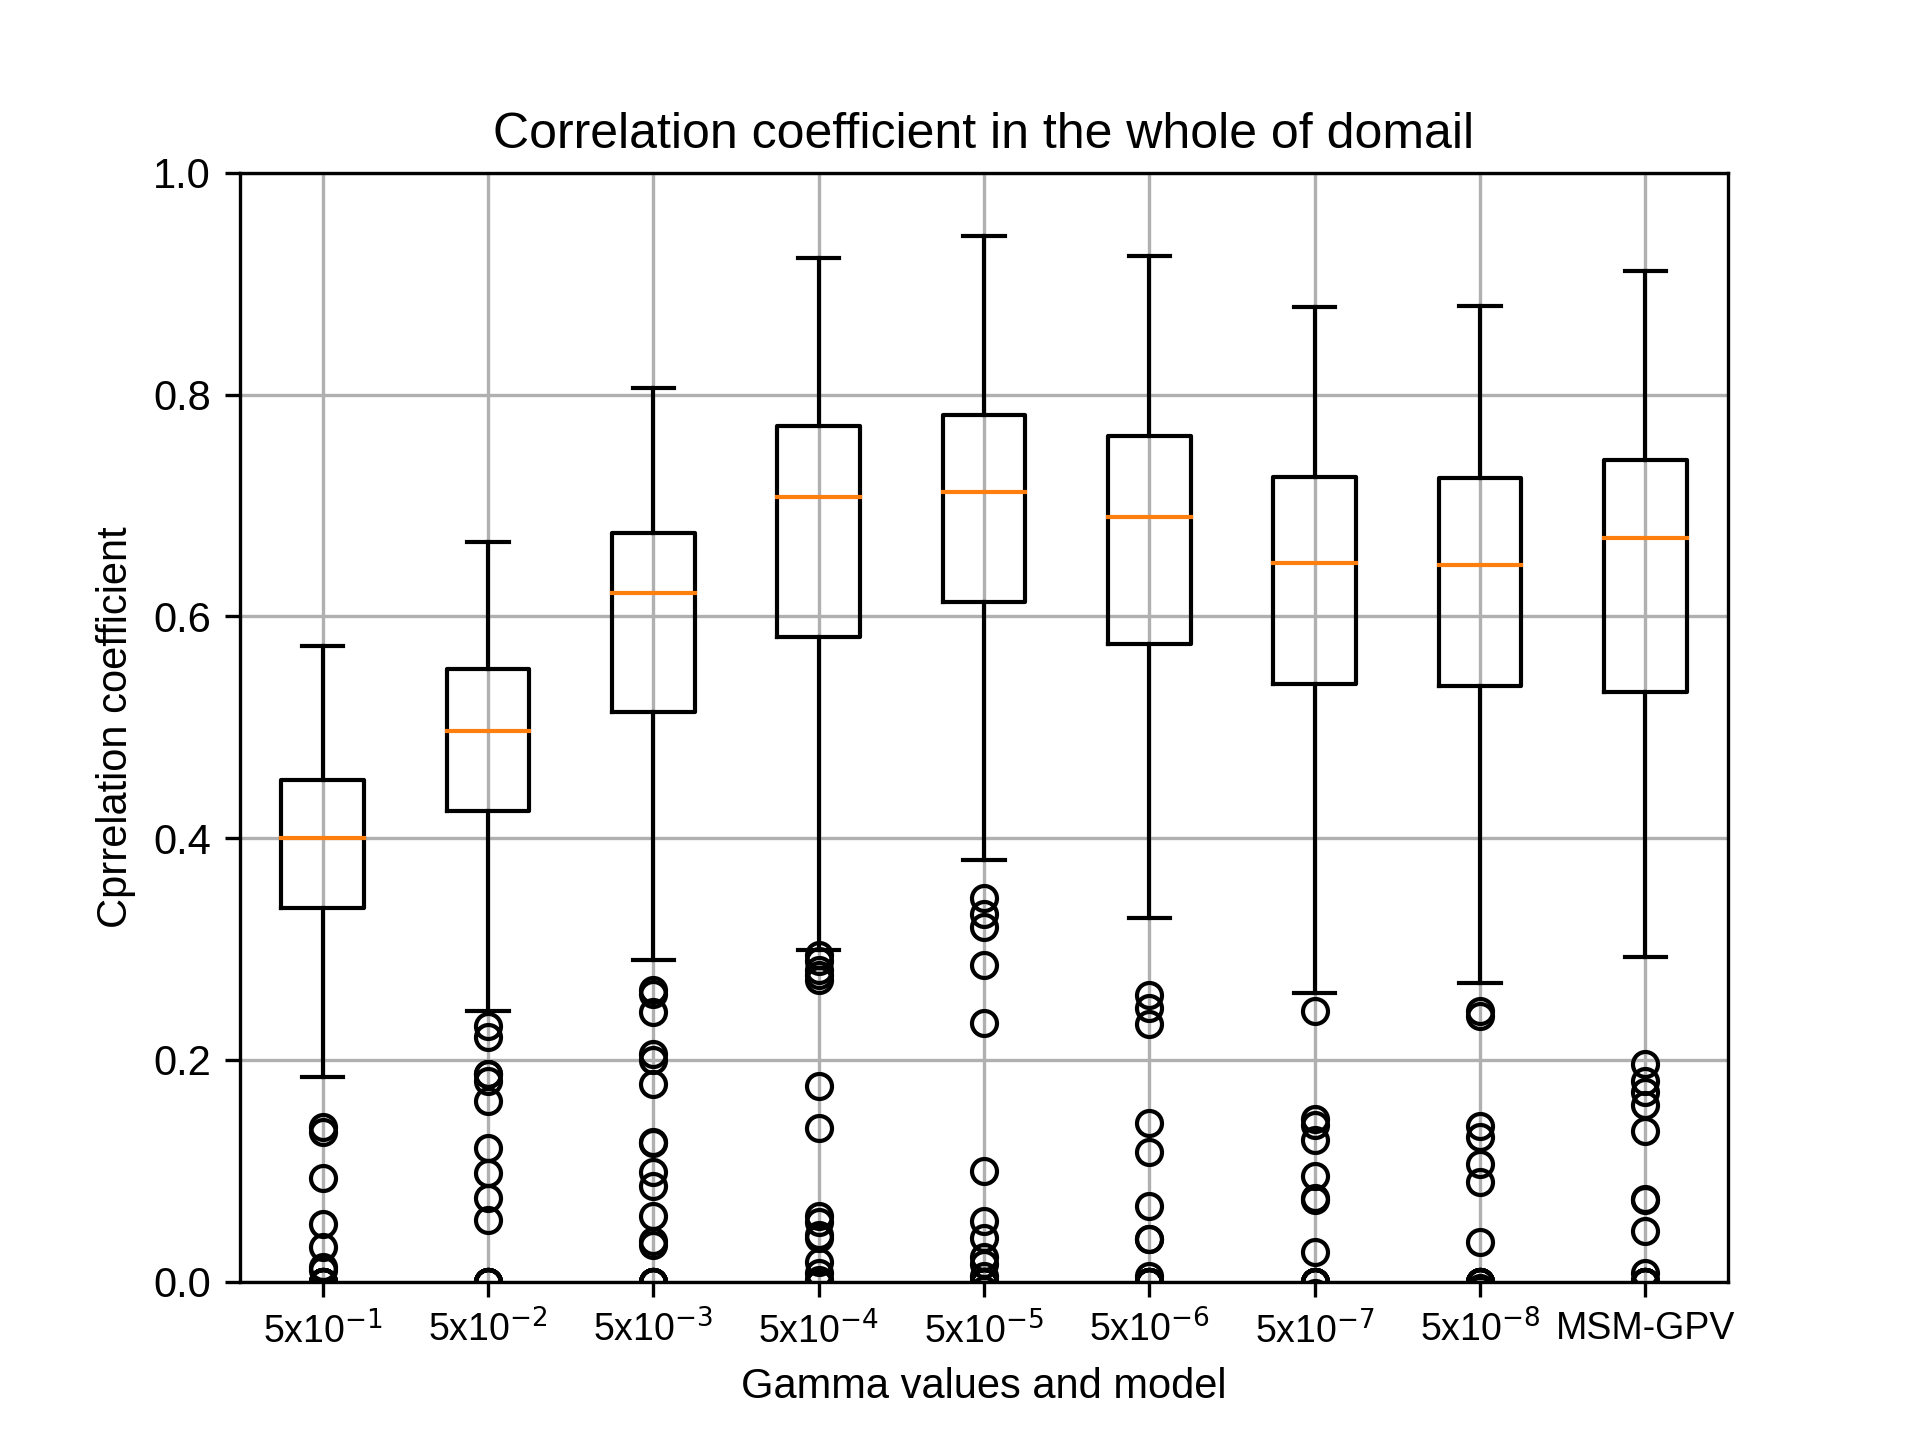
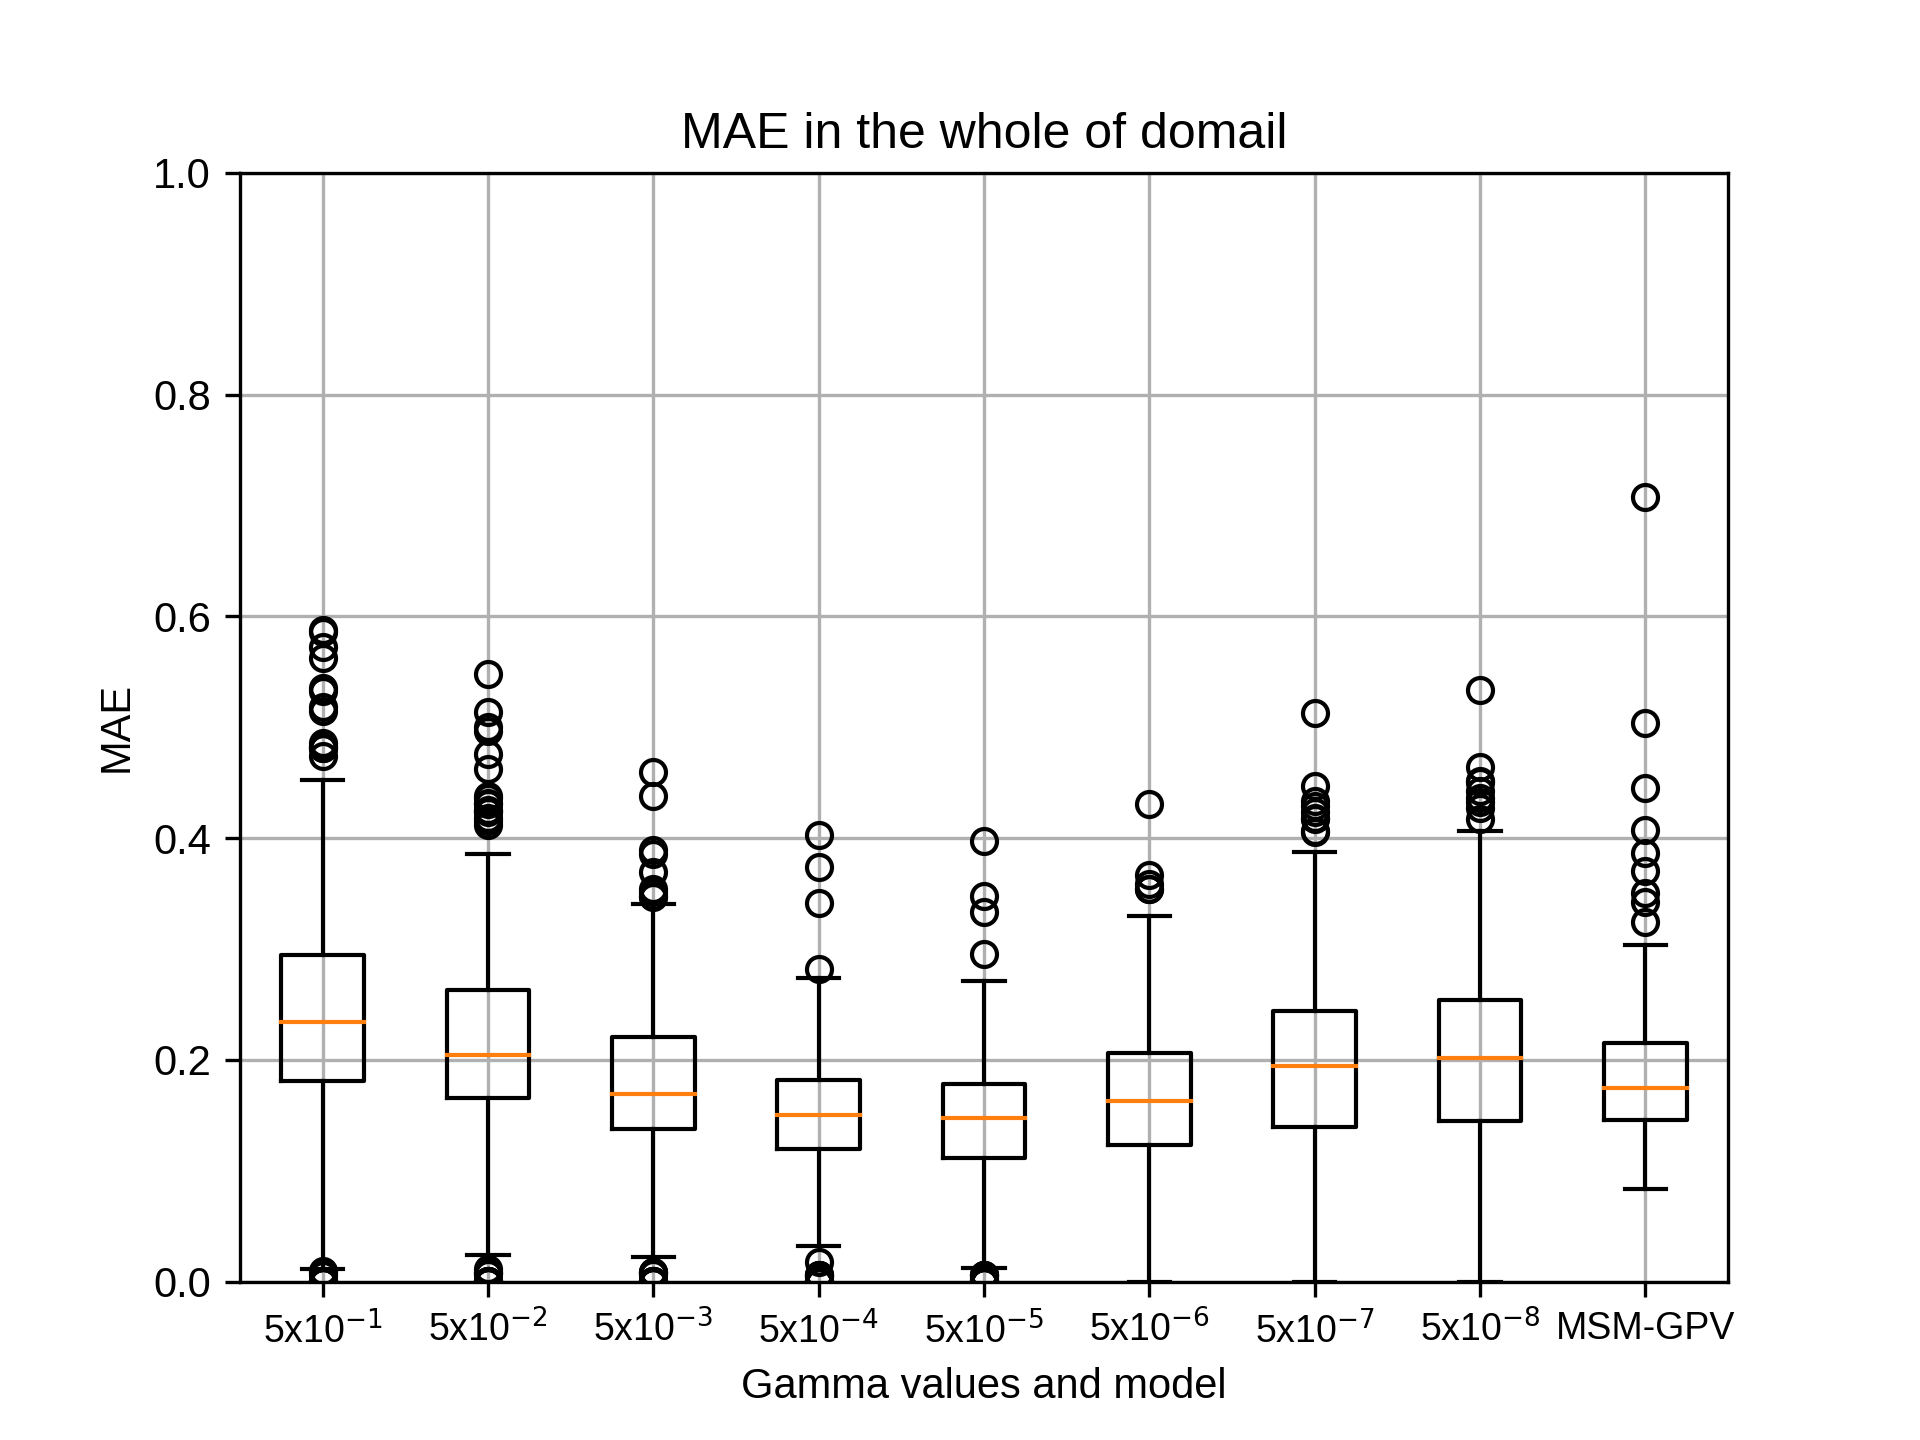
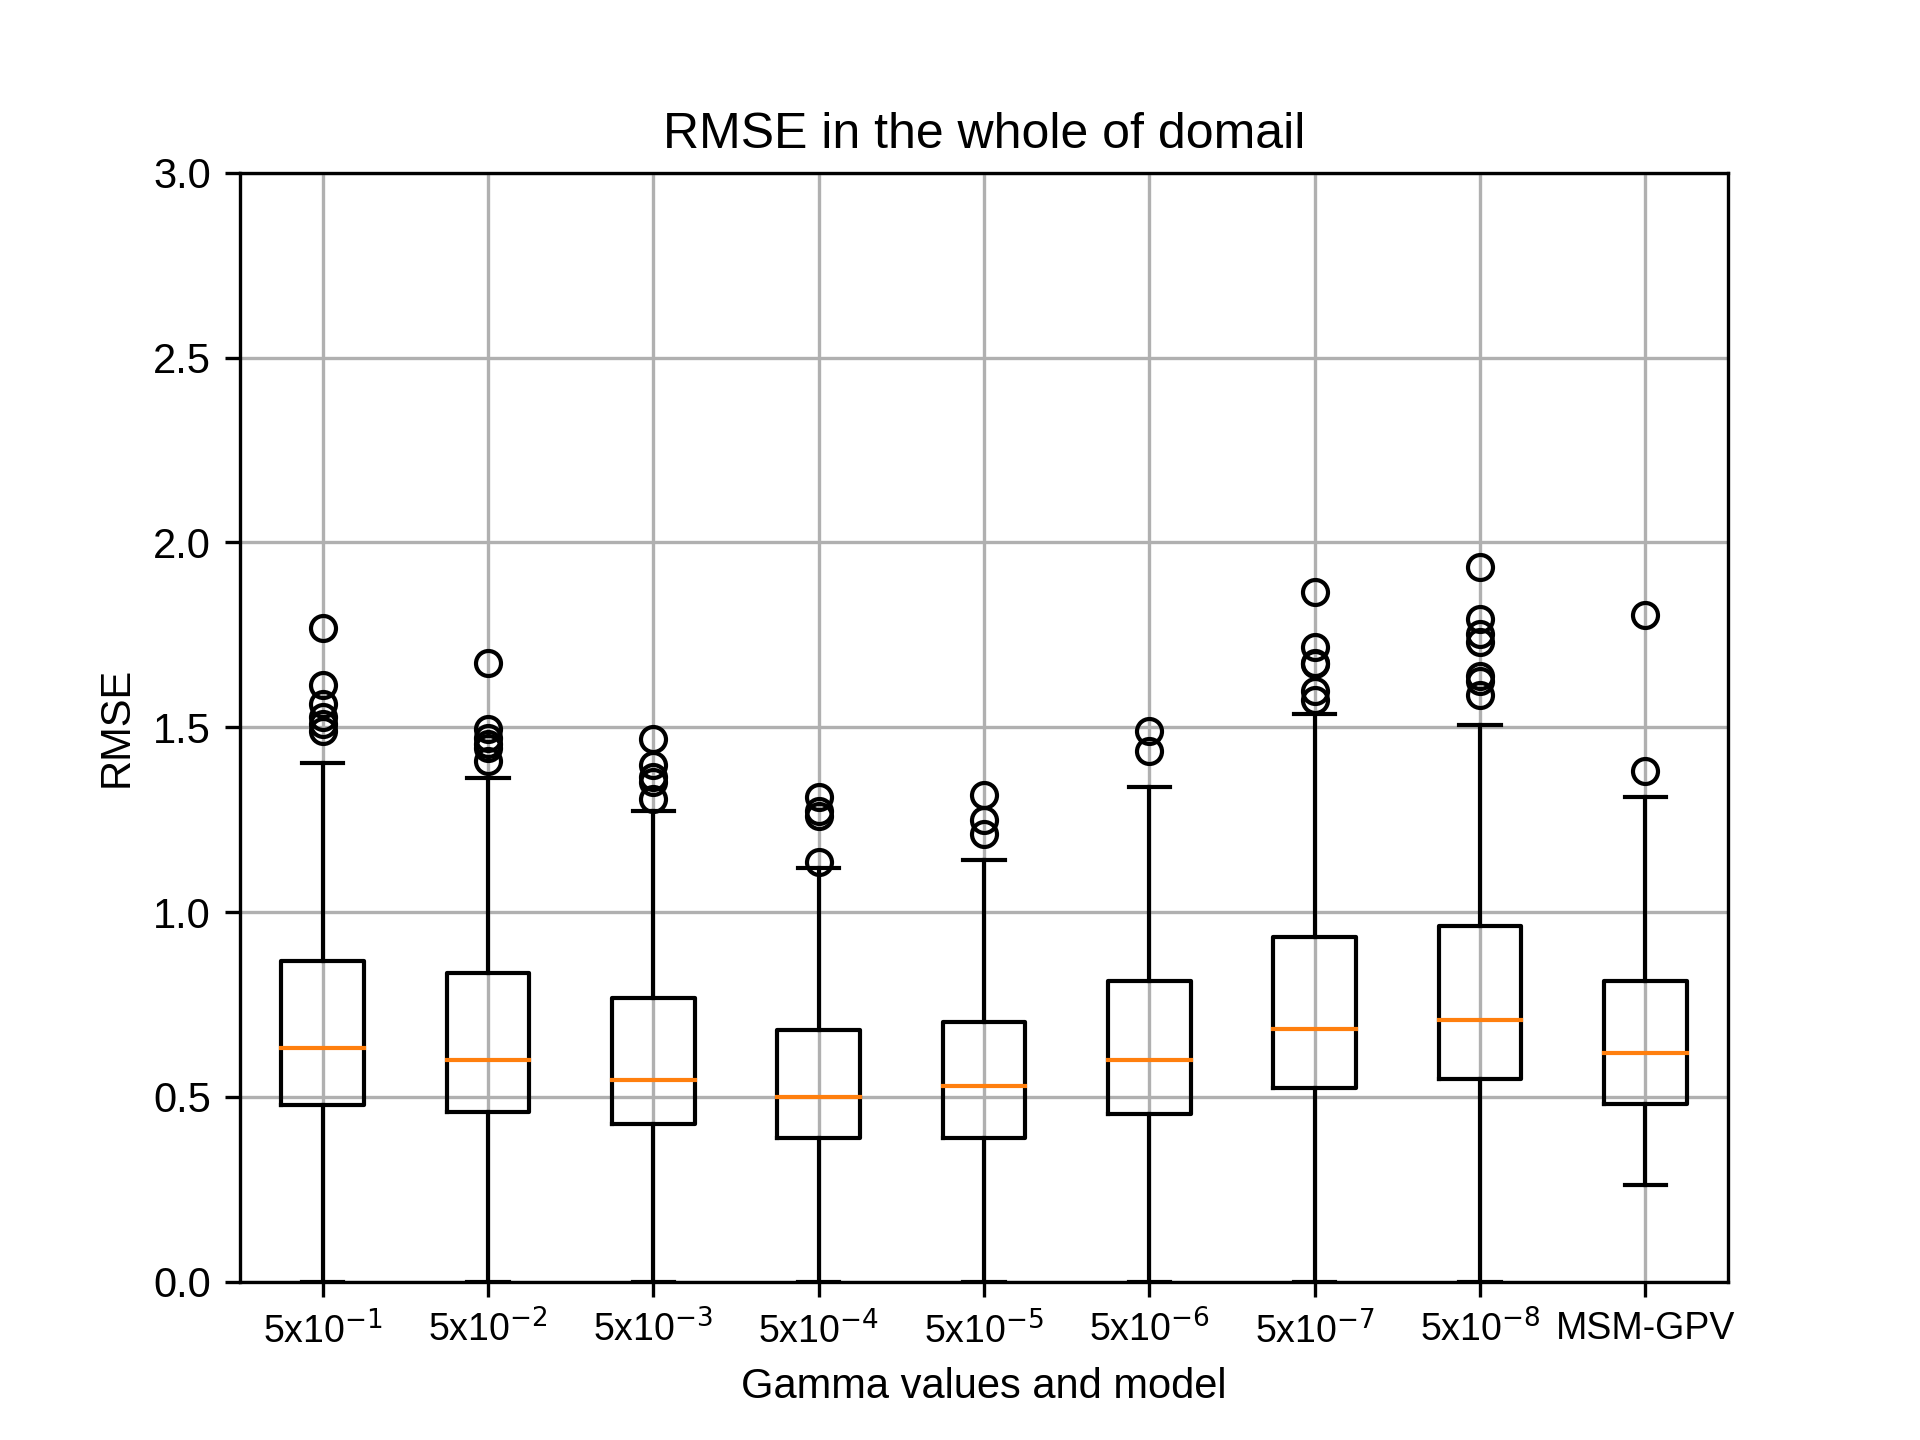
4月のsiteB,rg2=6の結果です。
kobayashi_yusukeThursday, October 22nd, 2020 at 4:22:49 PM GMT+09:00
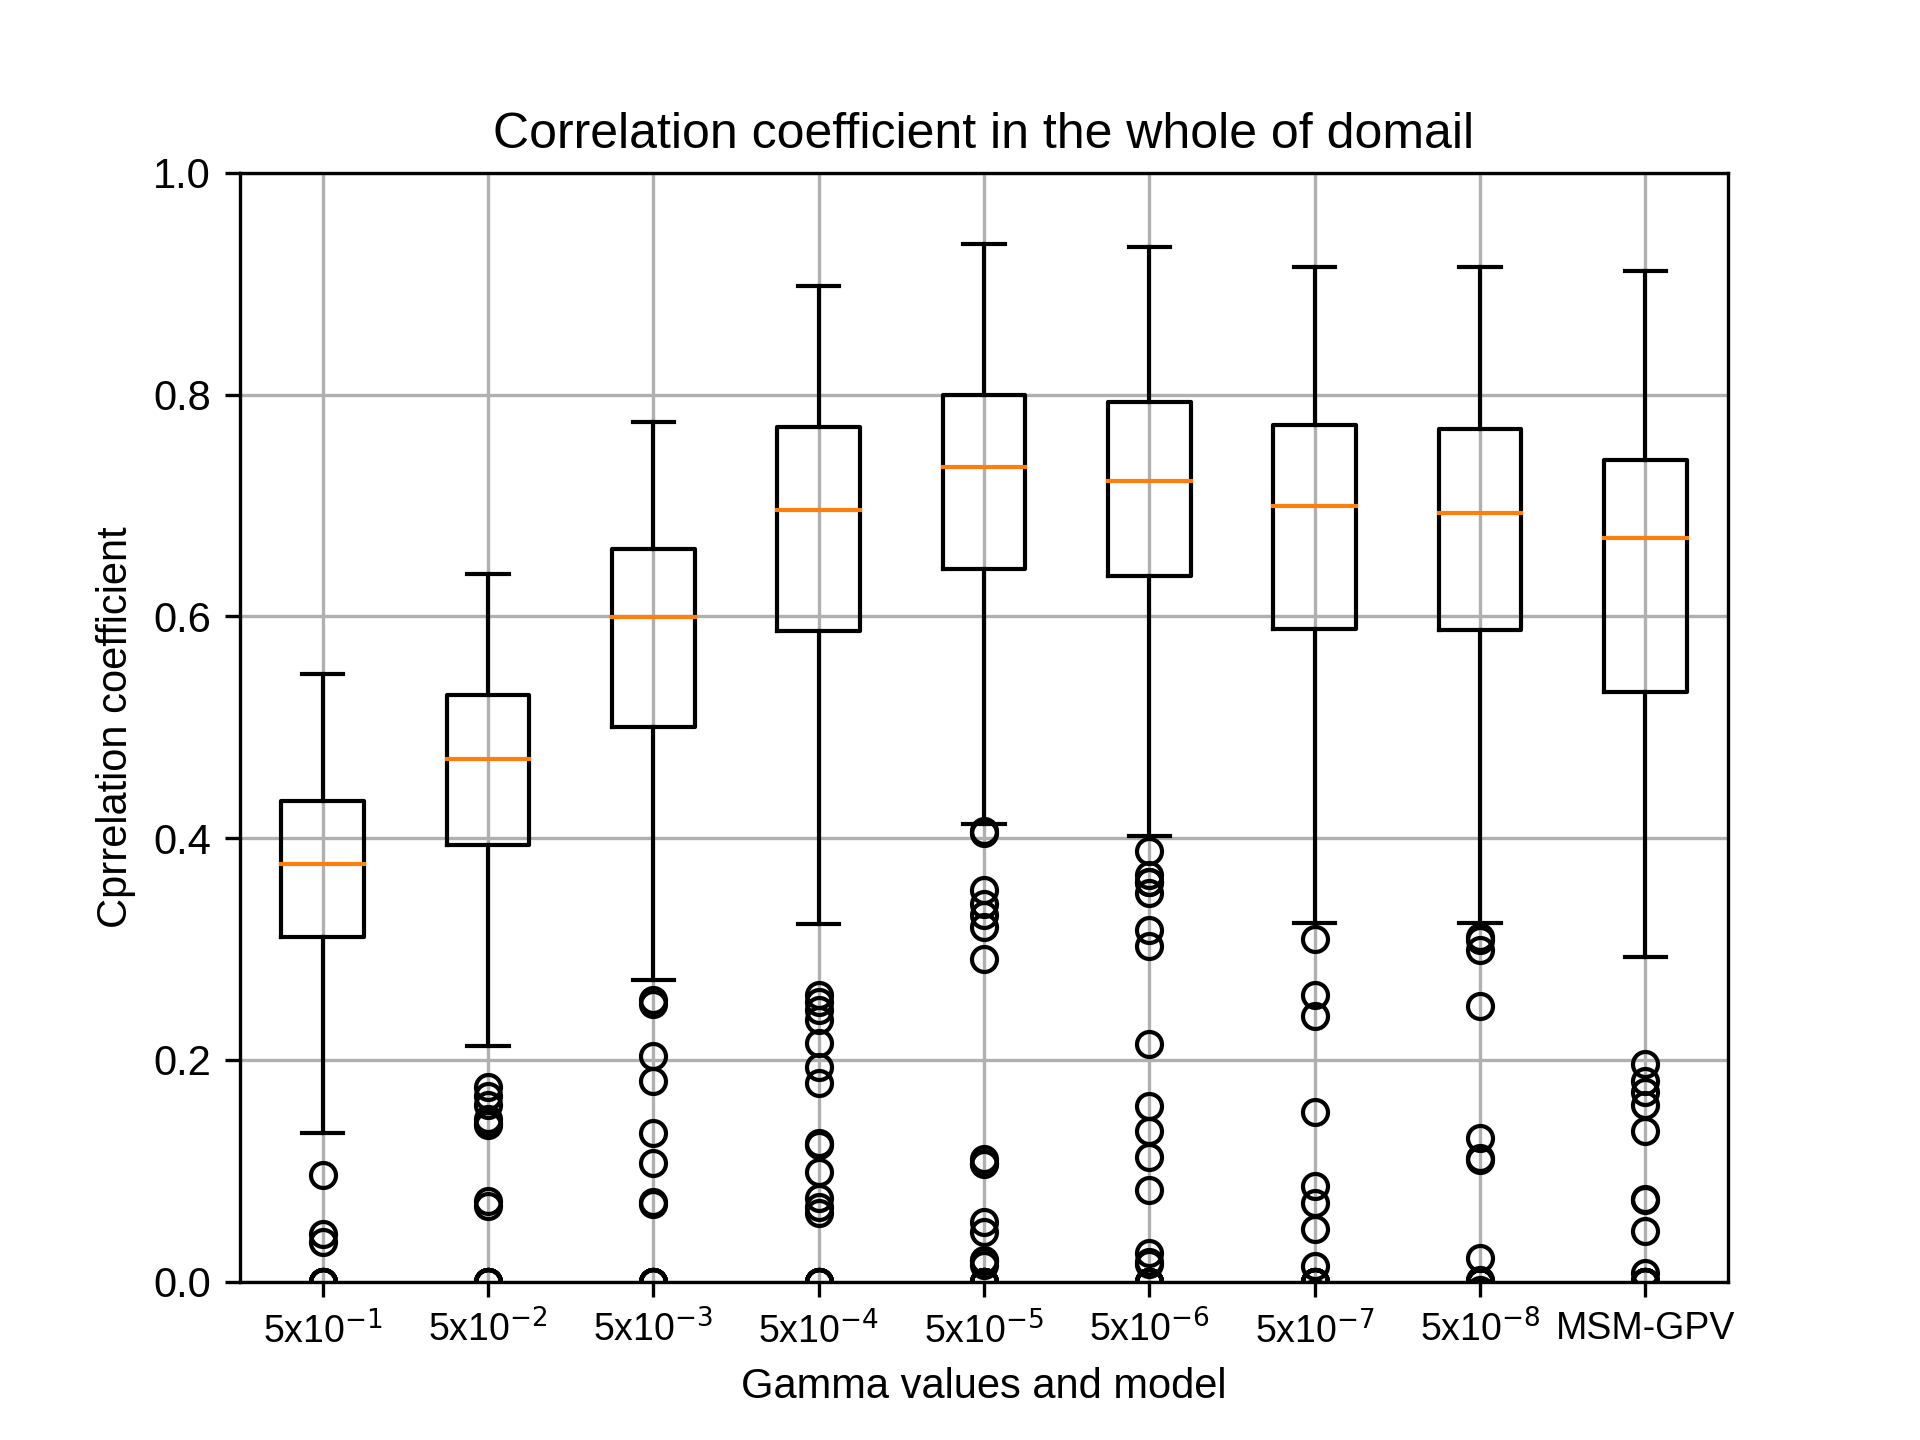
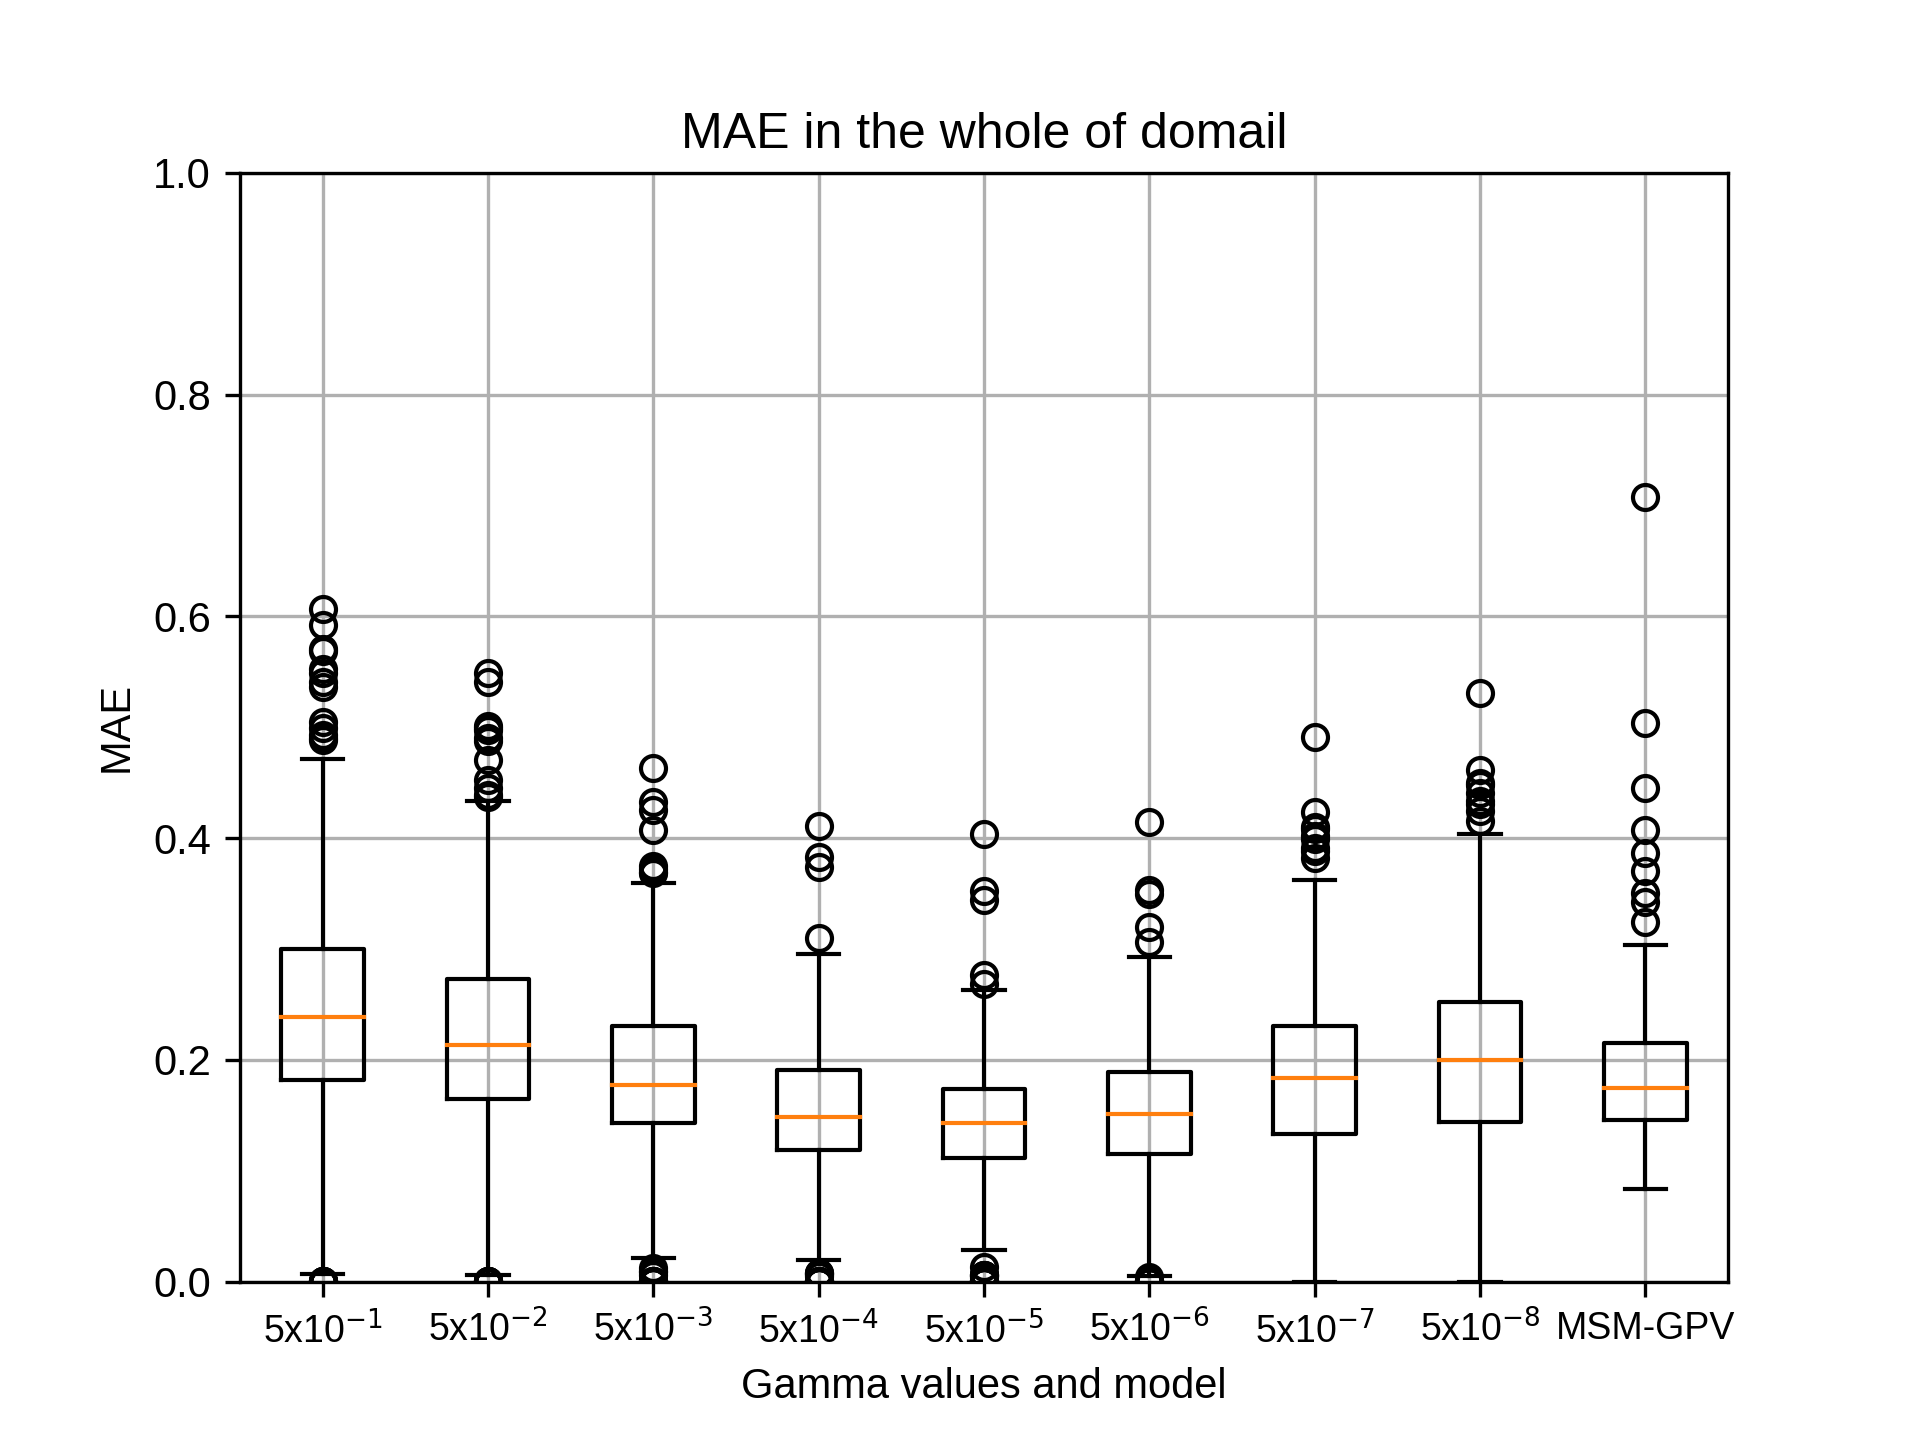
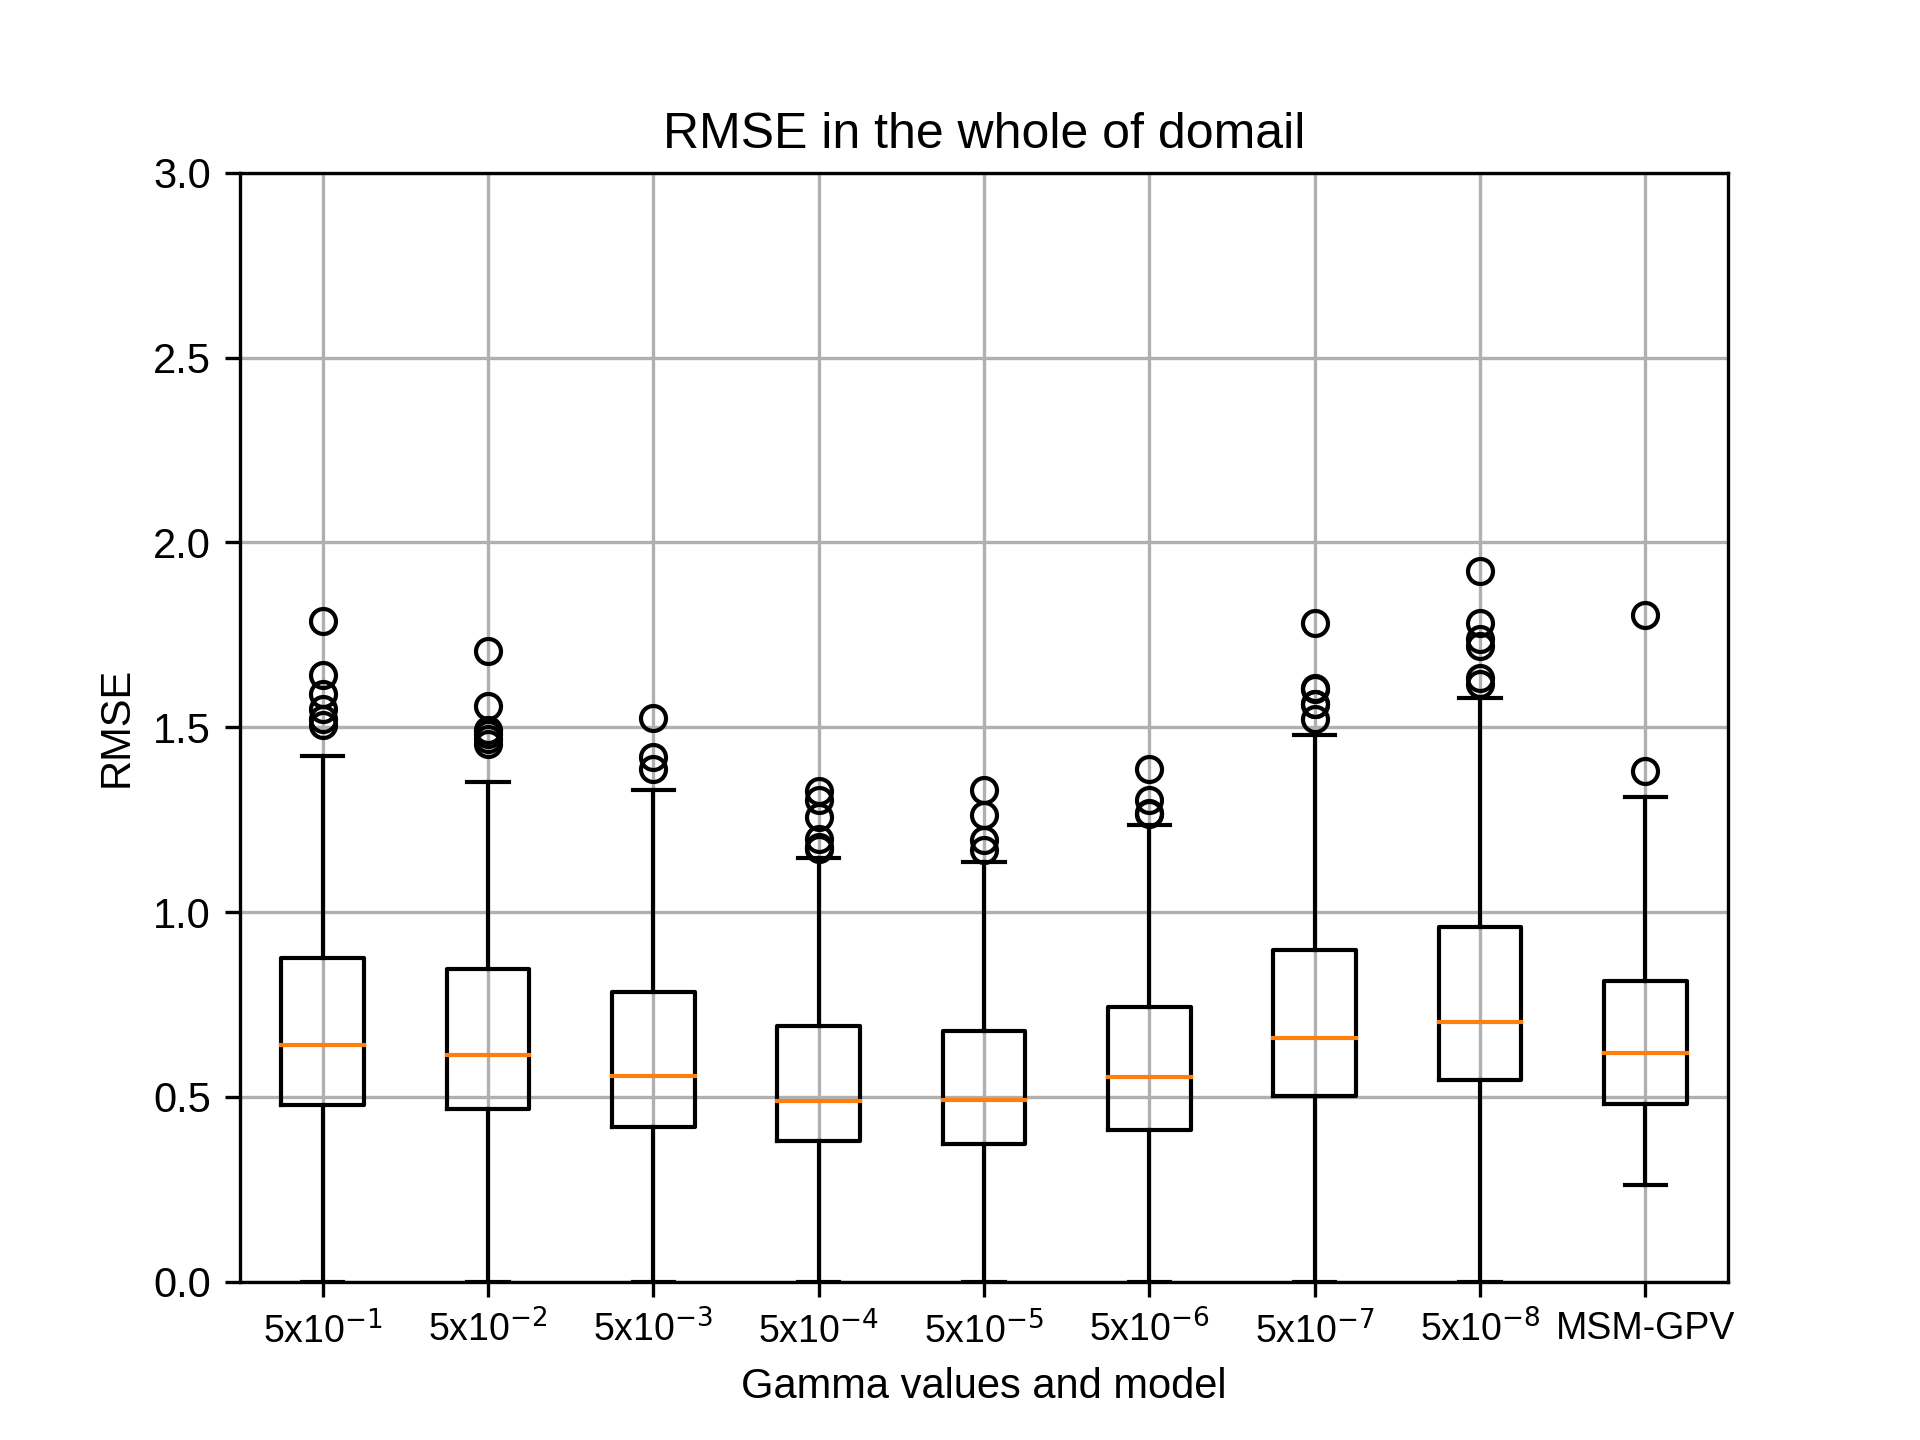
4月のsiteB,rg2=8の結果です。
kobayashi_yusukeThursday, October 22nd, 2020 at 4:23:21 PM GMT+09:00


4月のsiteB,rg2=10の結果です。
kobayashi_yusukeThursday, October 22nd, 2020 at 4:23:42 PM GMT+09:00
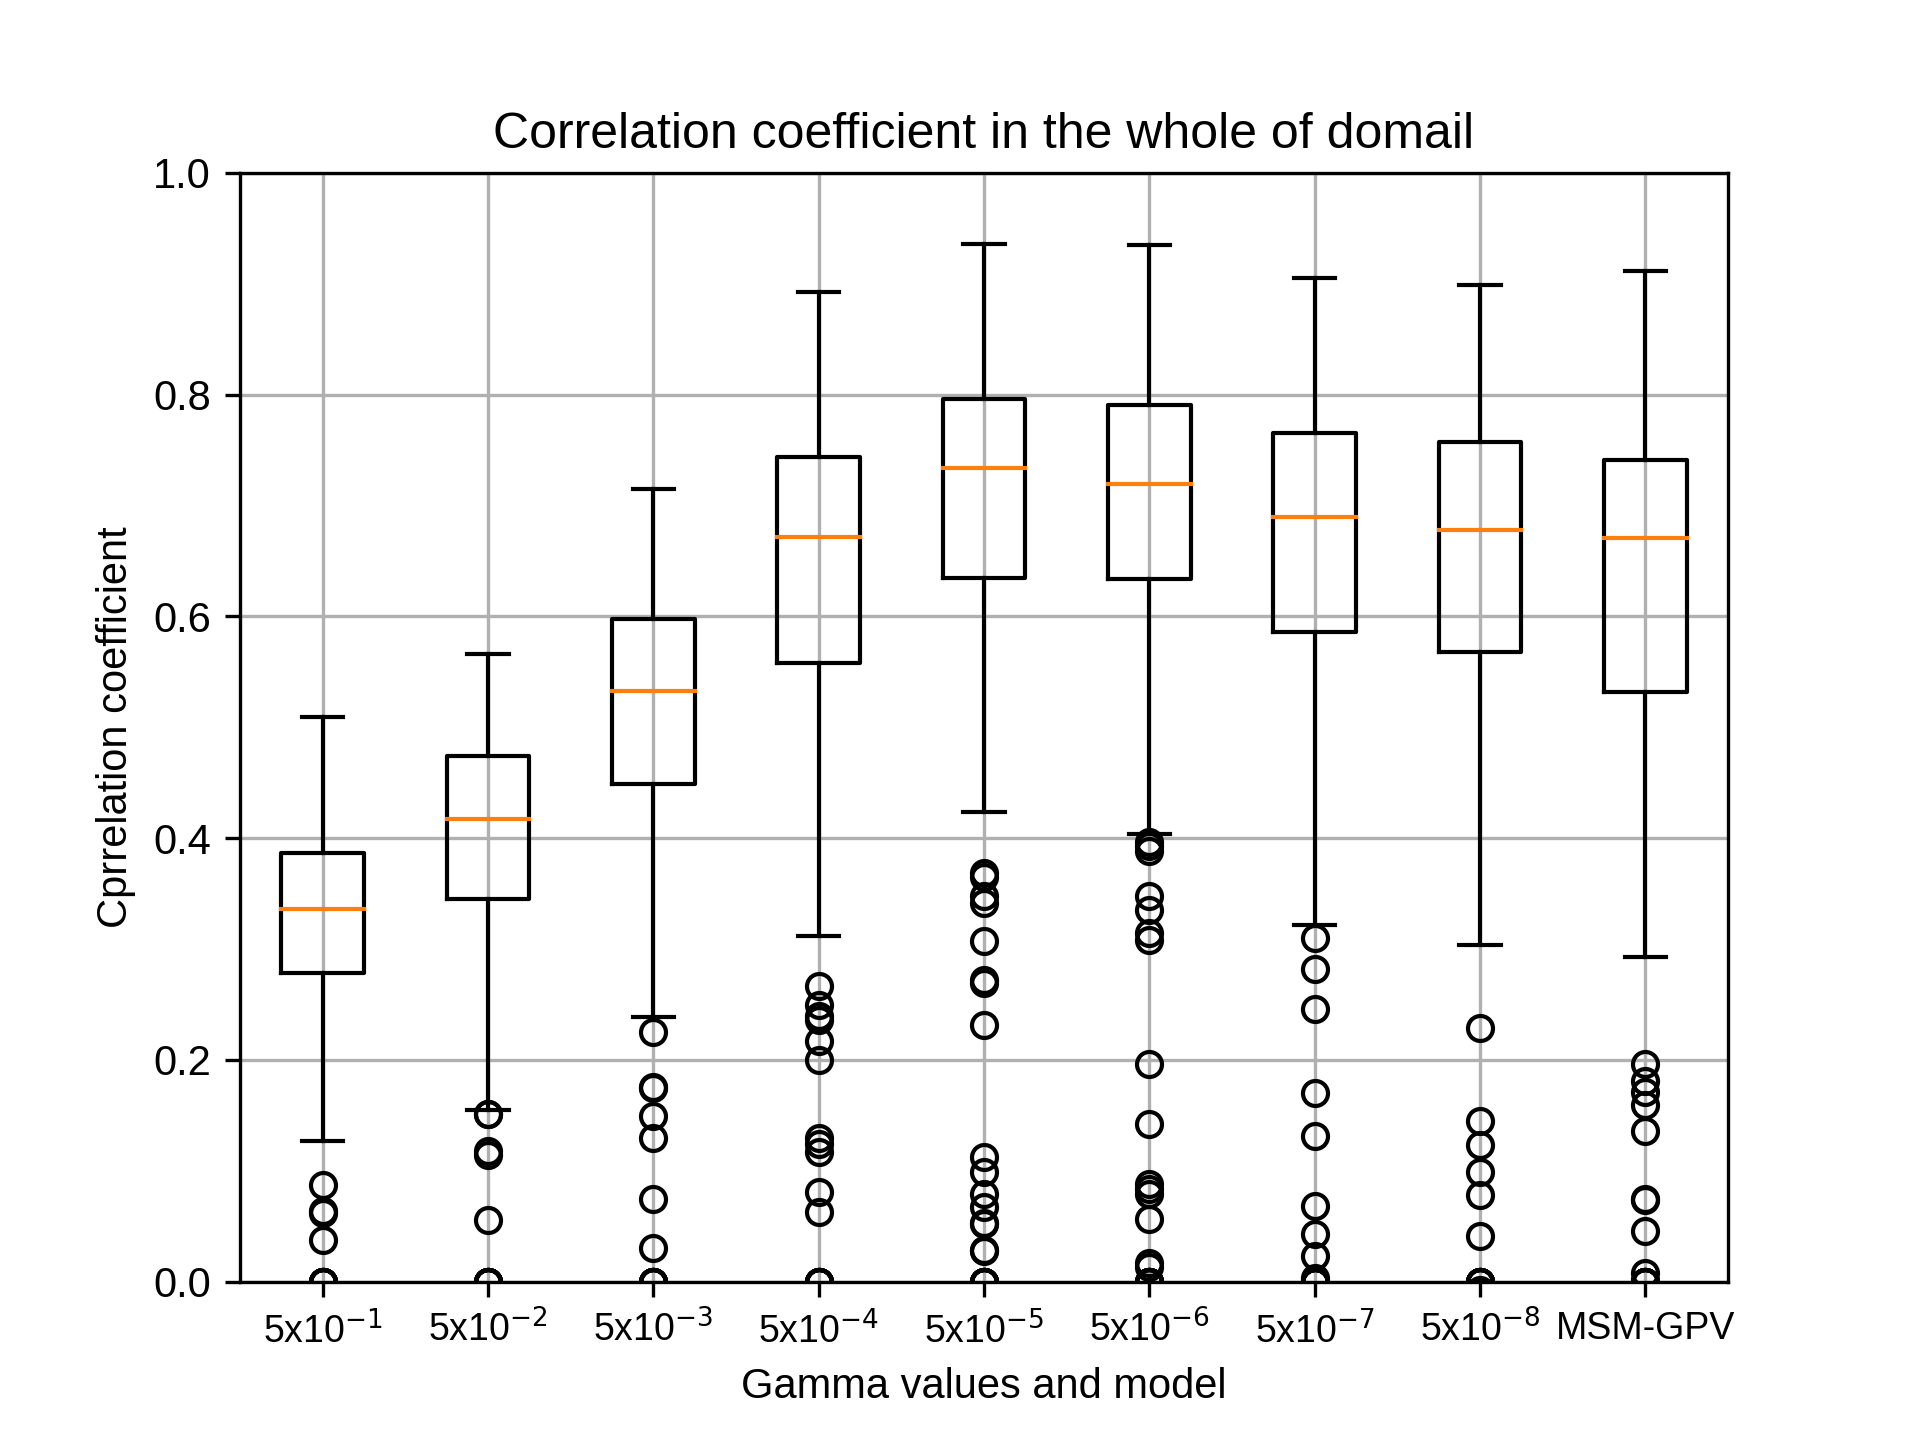
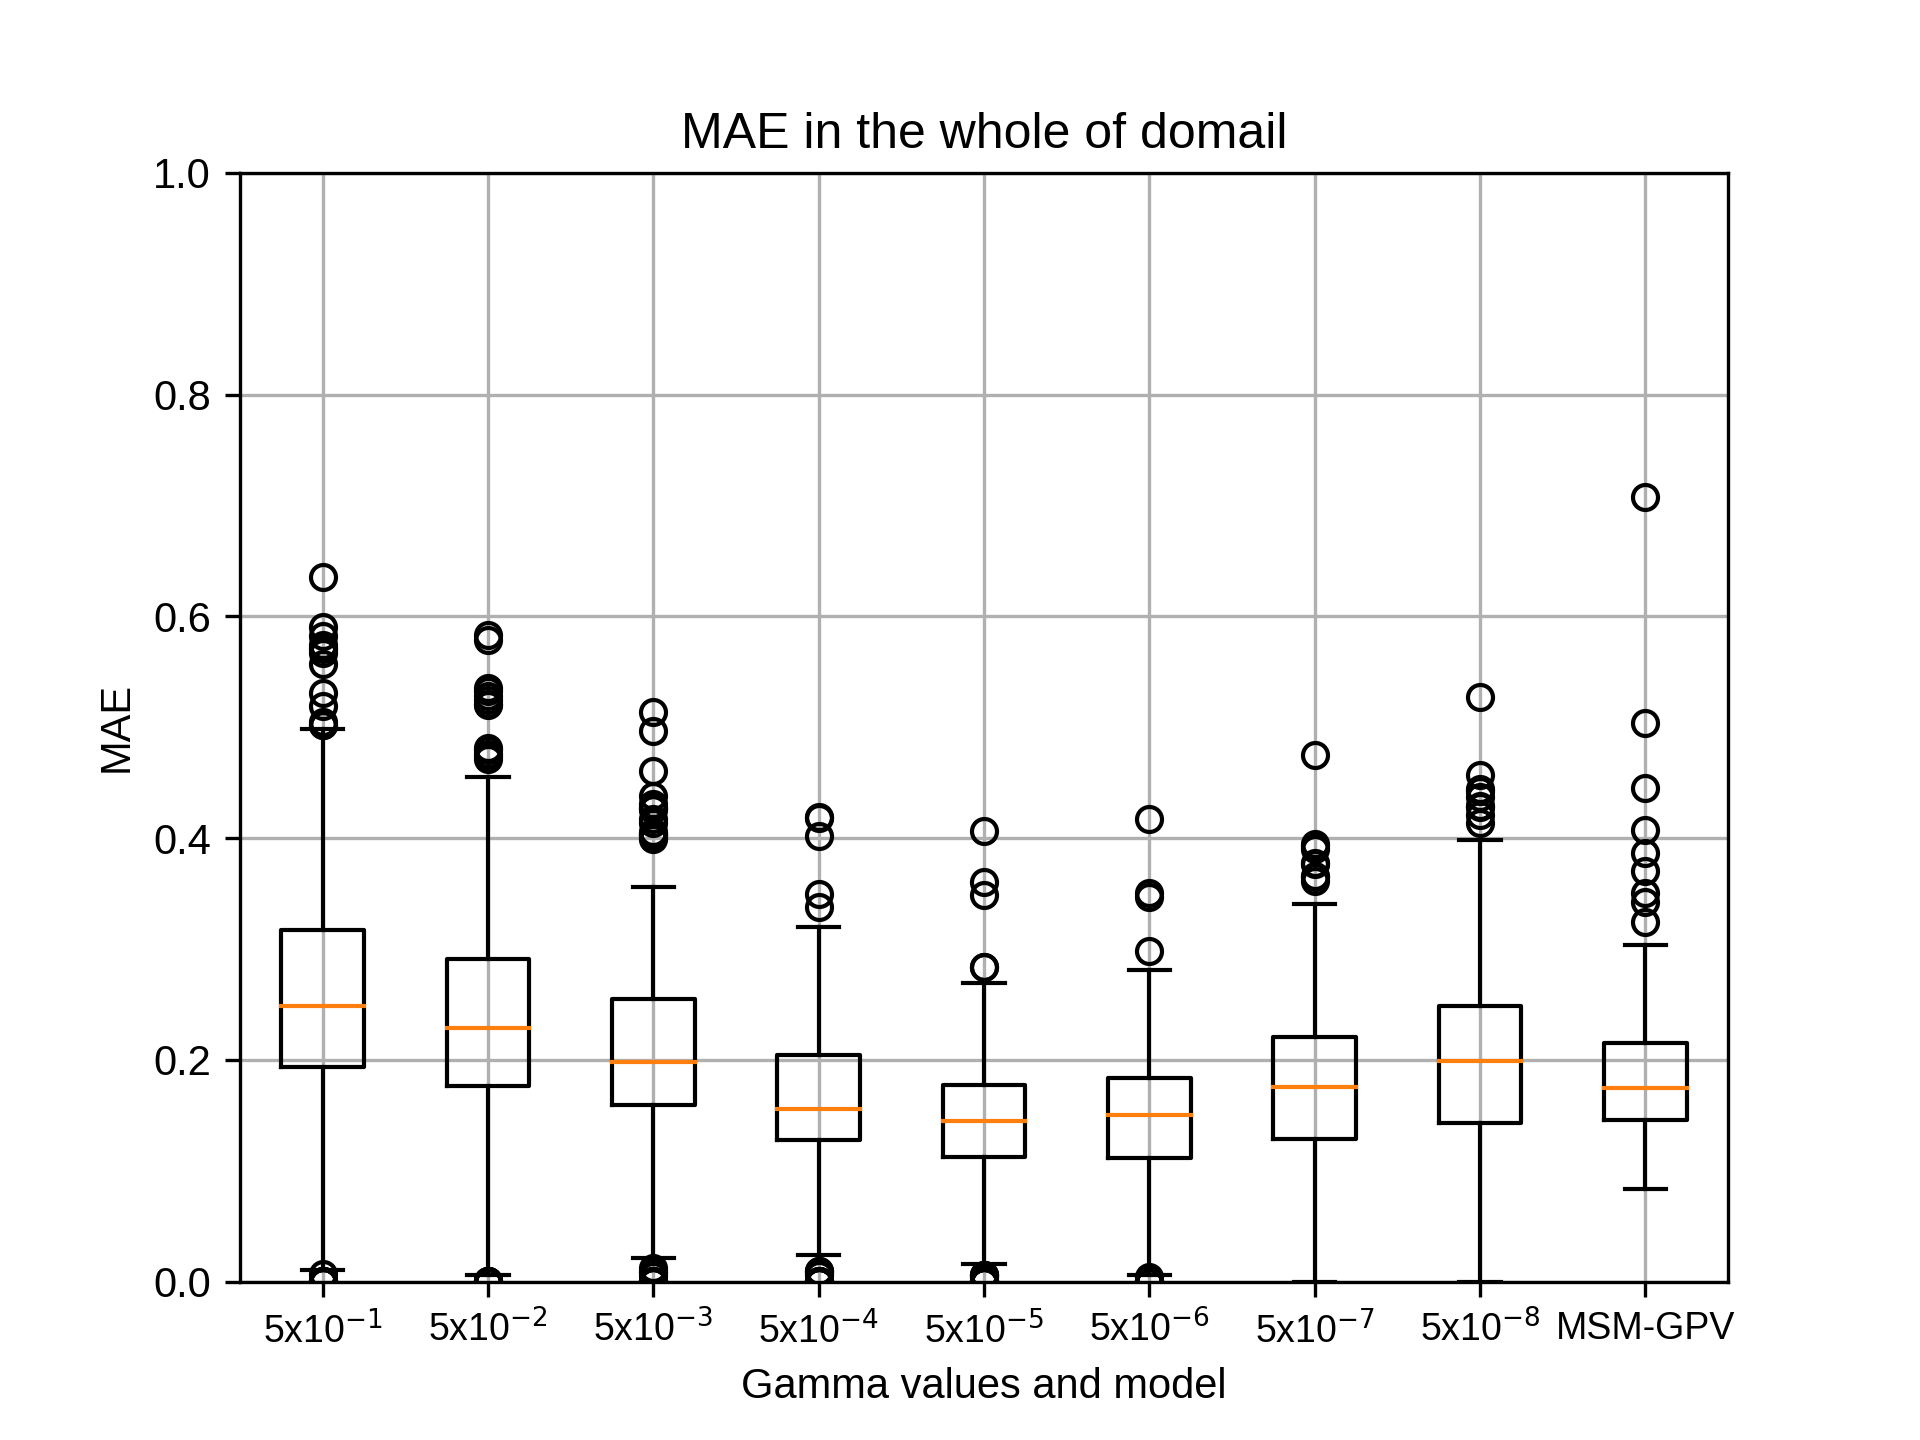
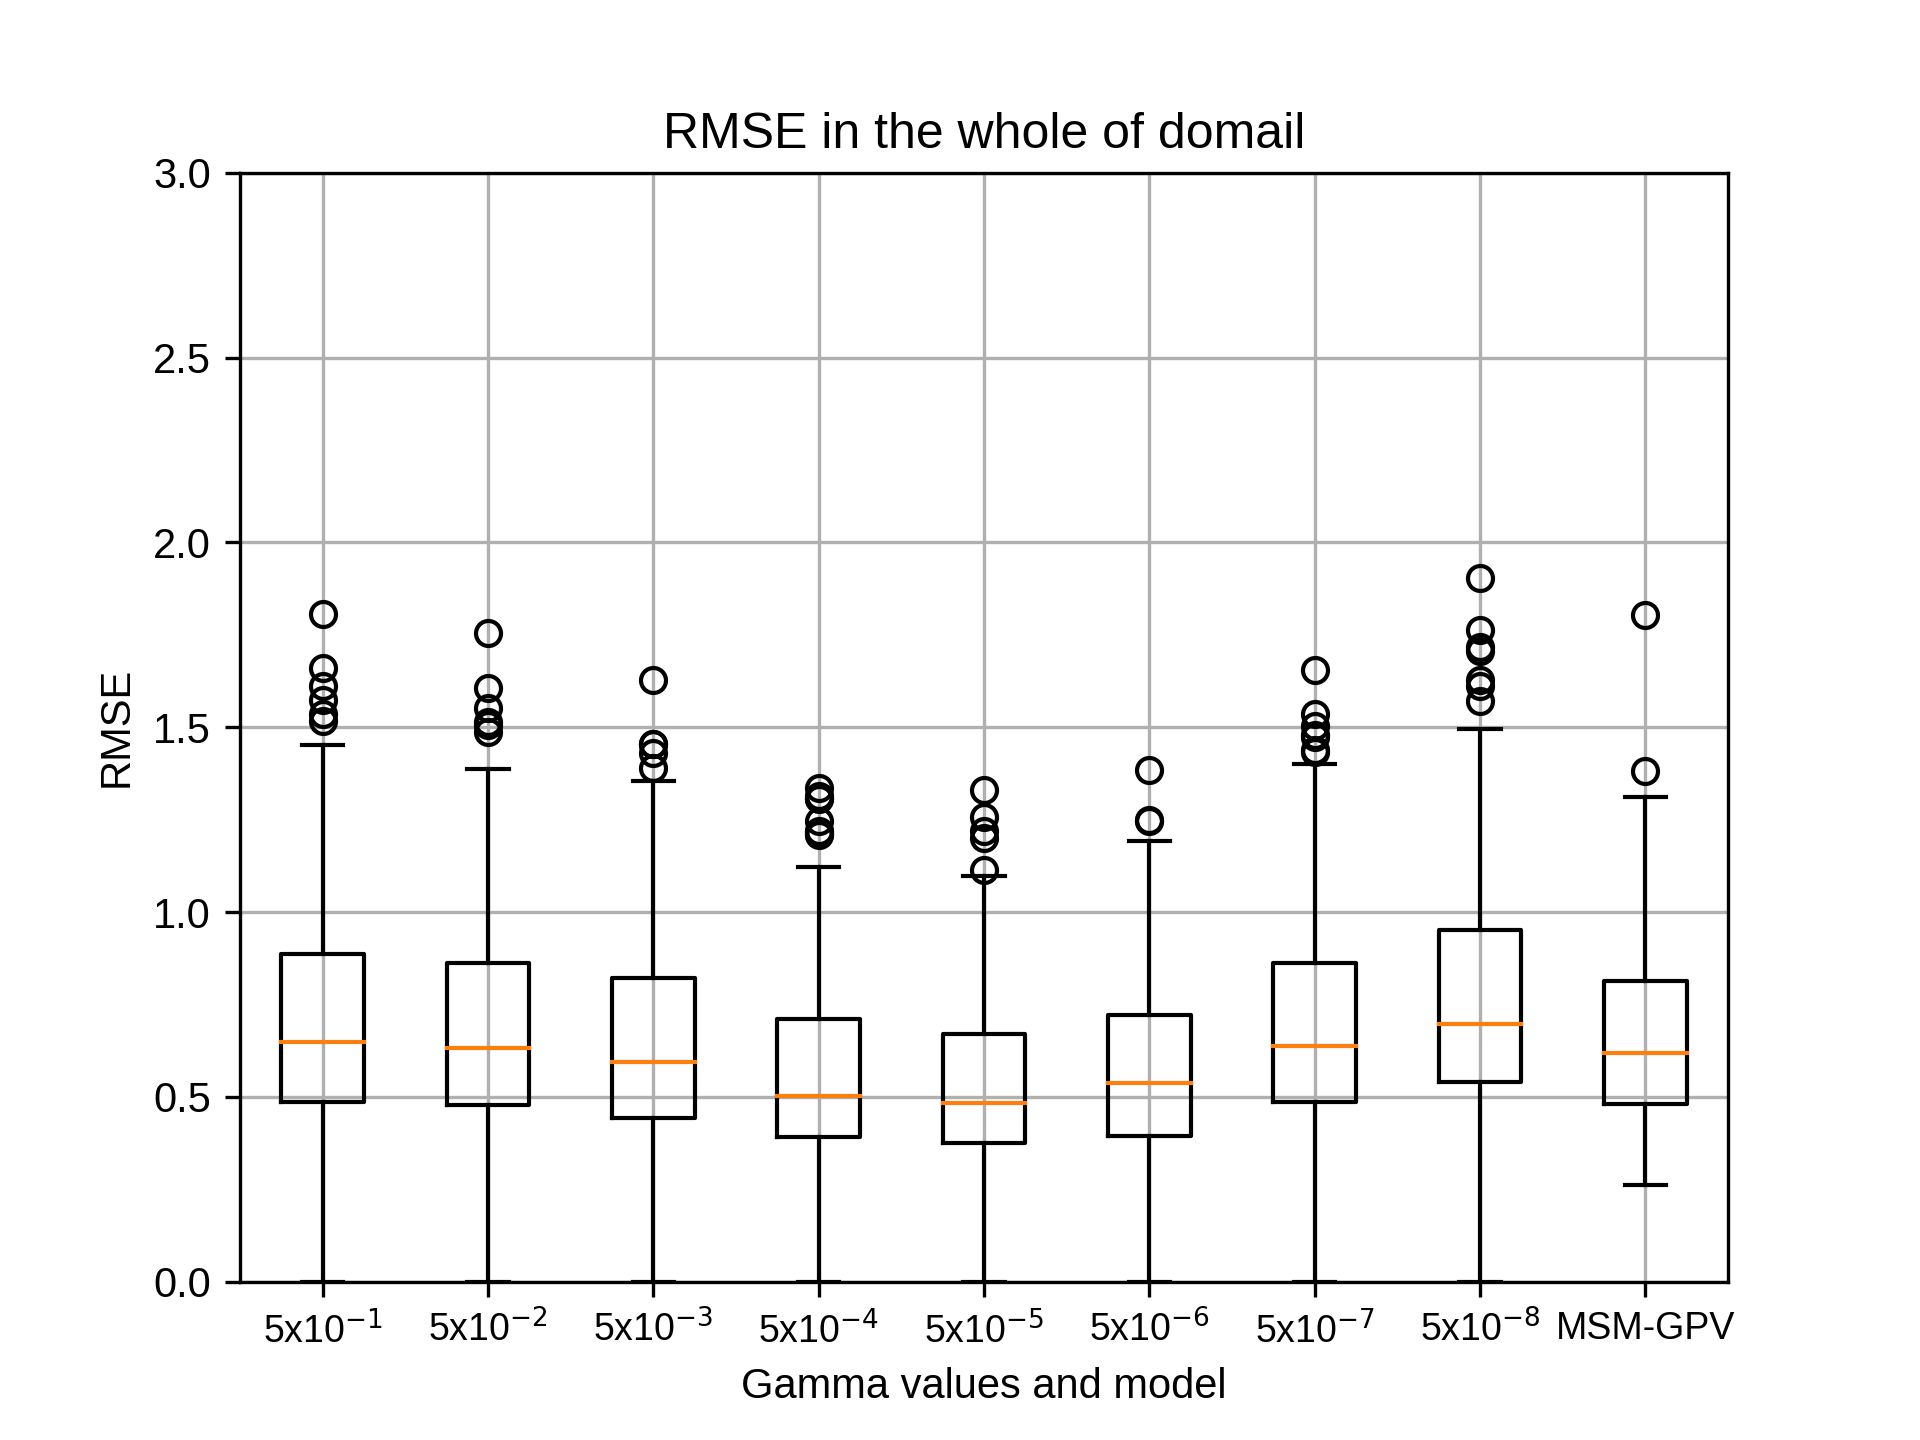
4月のsiteB,rg2=12の結果です。
4月のsiteBではrg2=10でgammaが5x10⁻⁵のとき、相関係数の中央値が最も高くなりました。
4月のsiteBではrg2=10でgammaが5x10⁻⁵のとき、相関係数の中央値が最も高くなりました。
kobayashi_yusukeThursday, October 22nd, 2020 at 4:23:59 PM GMT+09:00
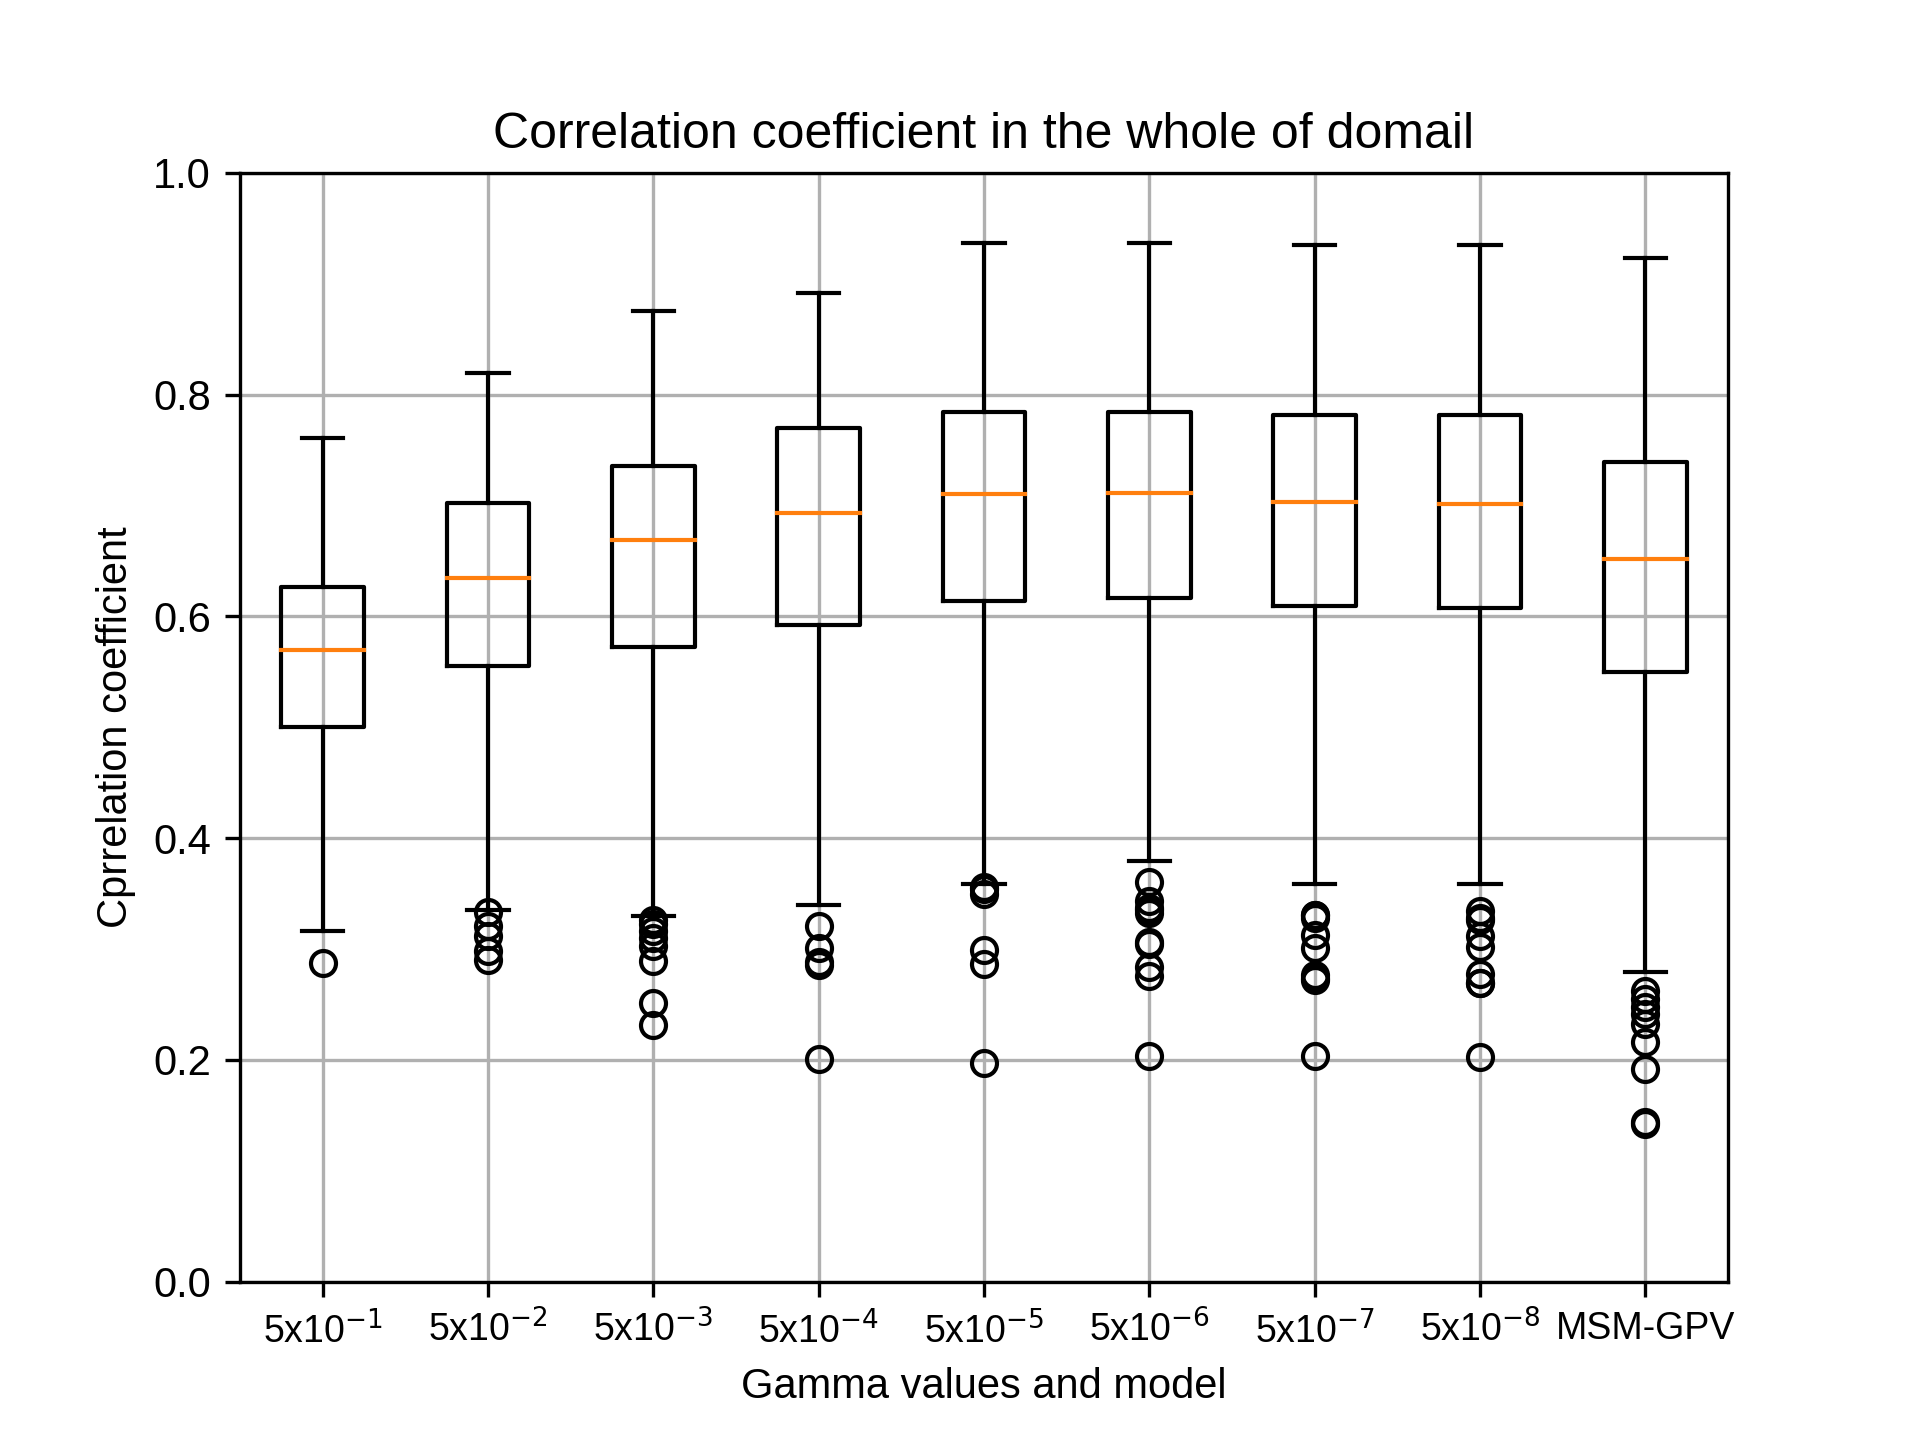
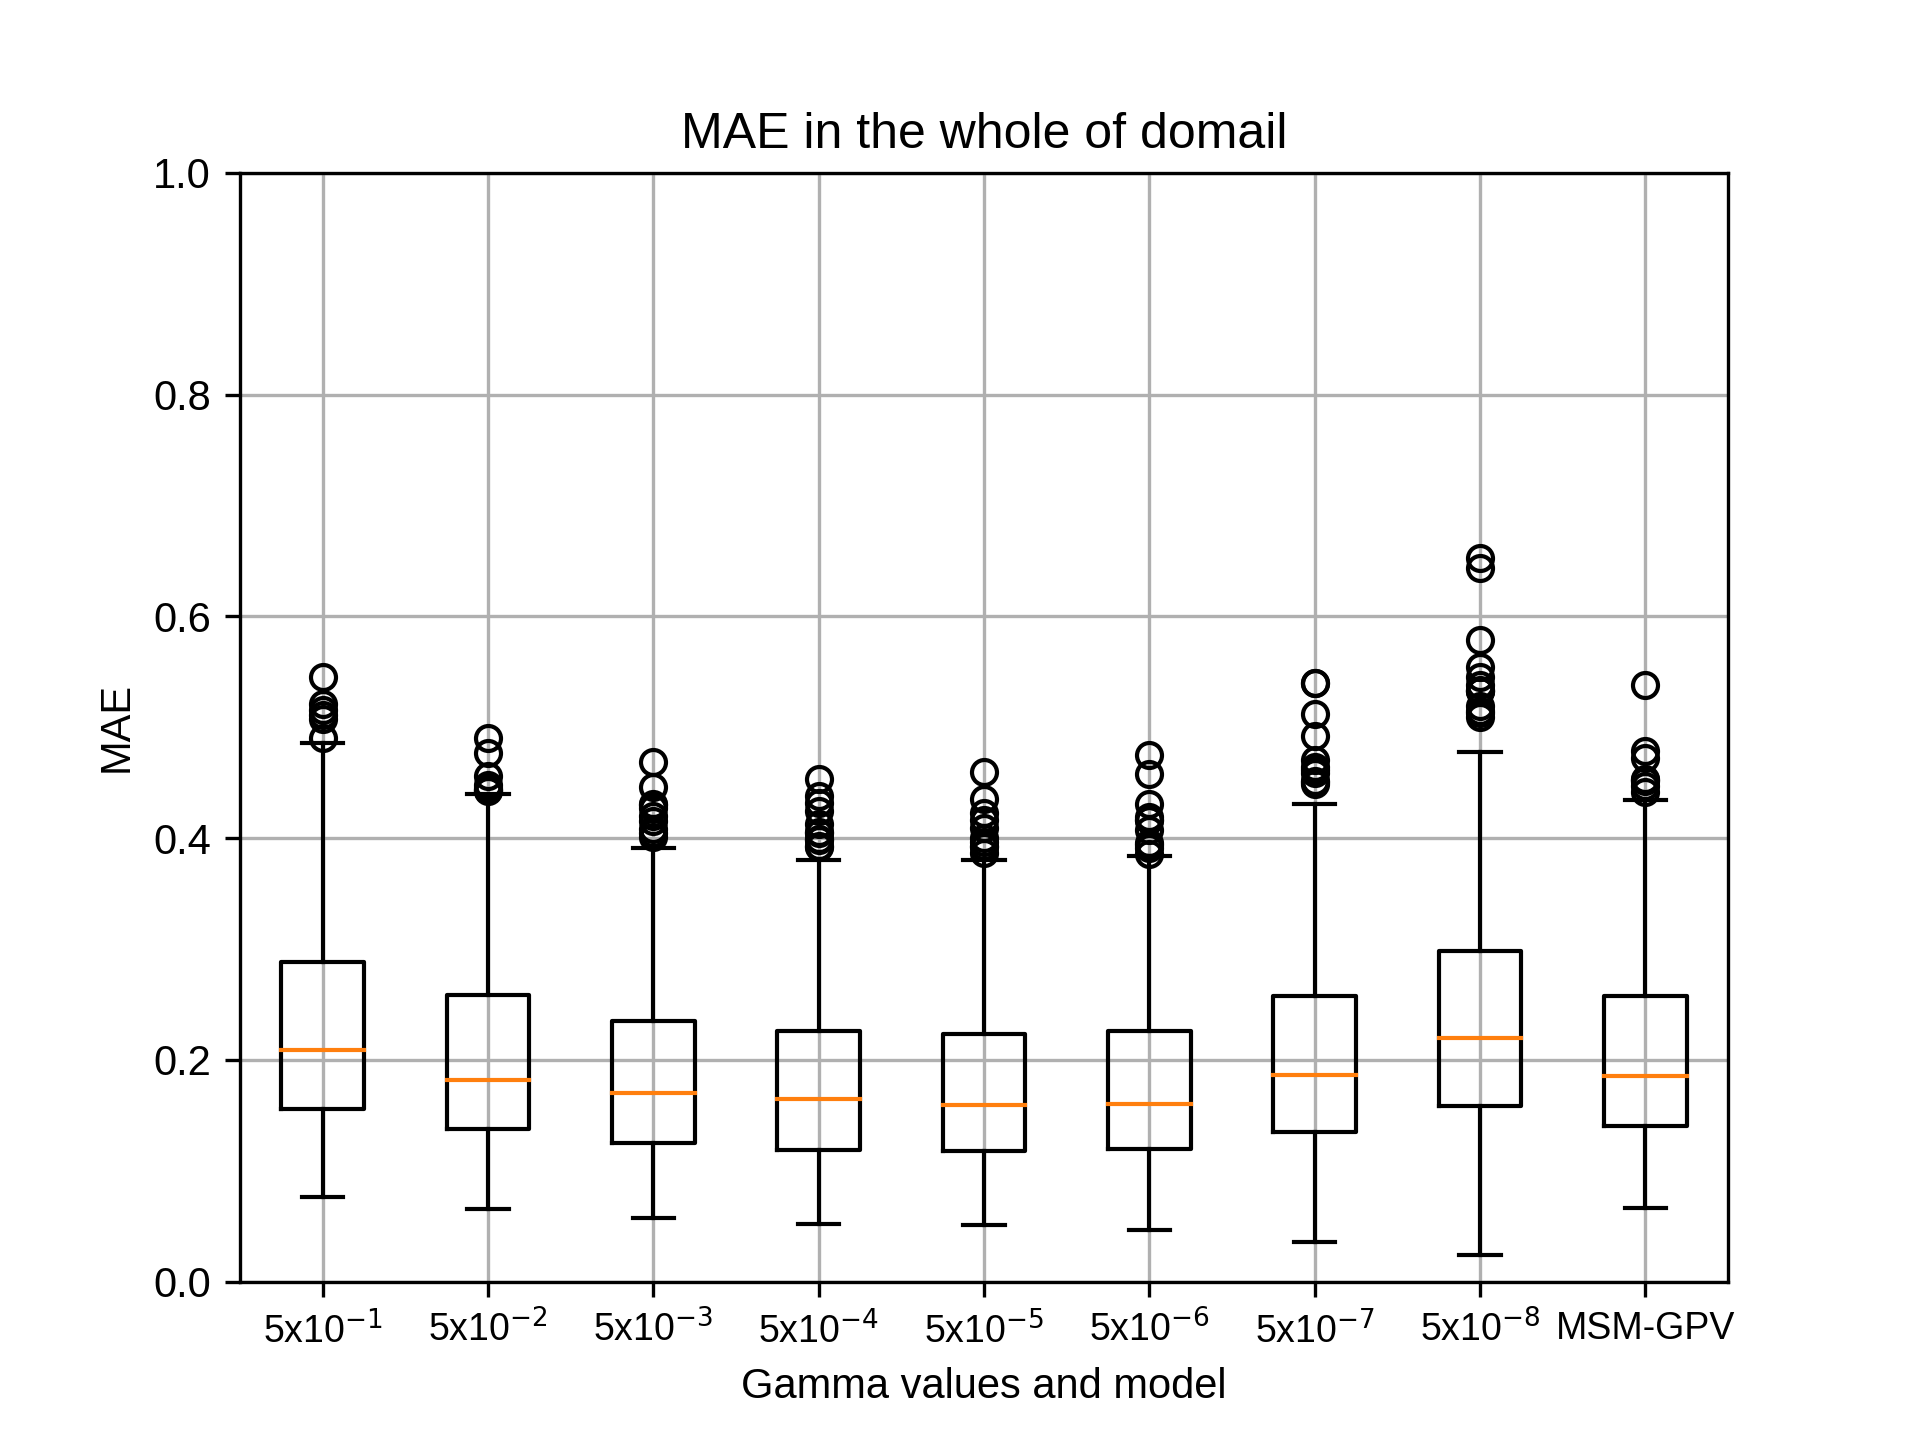
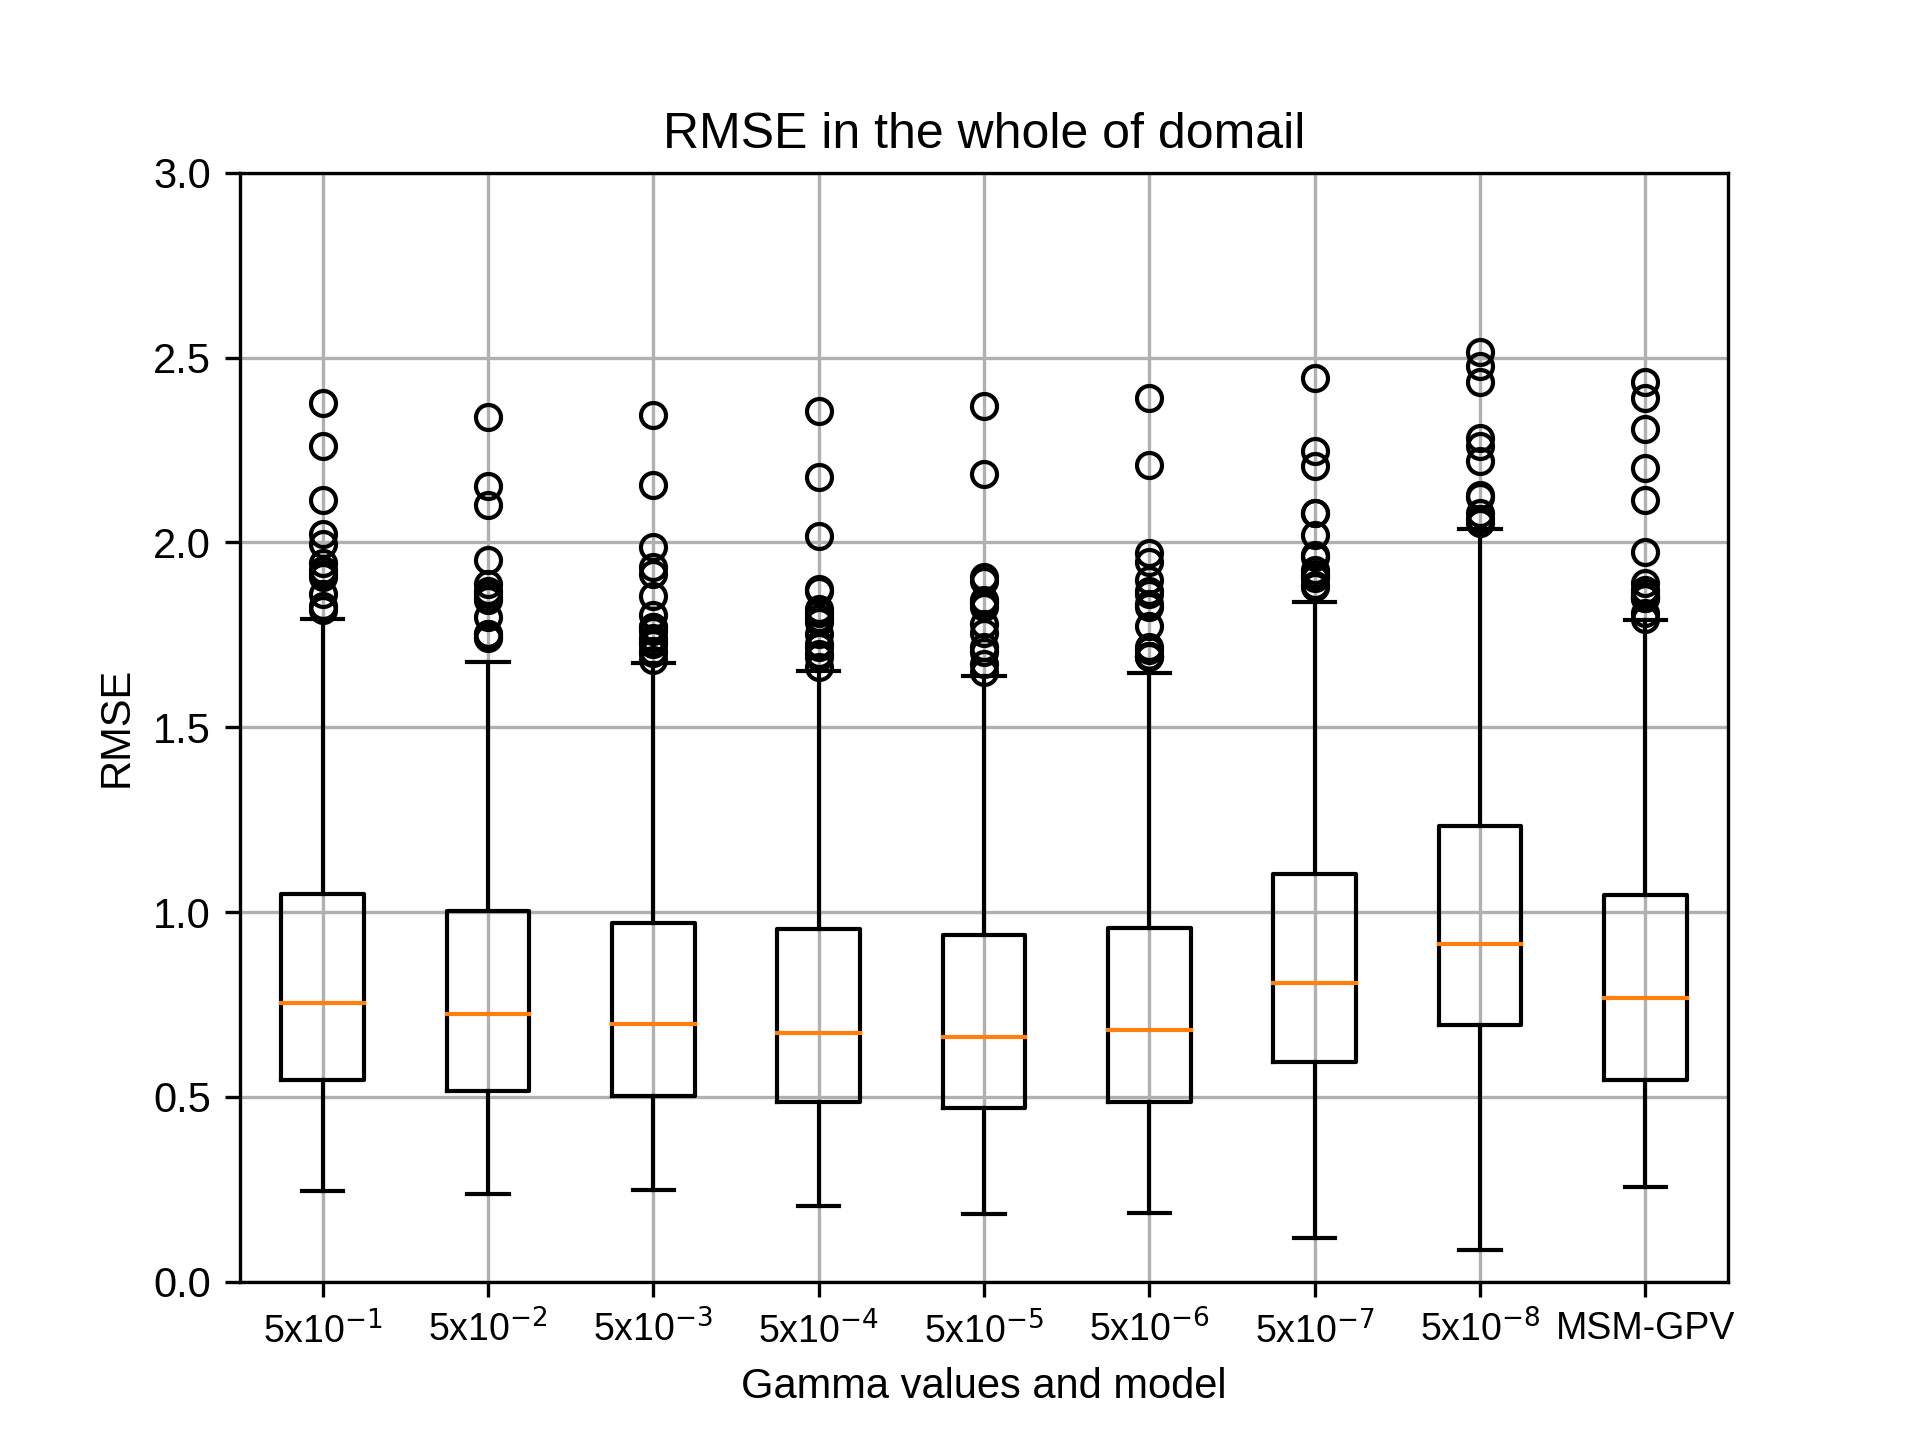
4月のsiteC,rg2=4の結果です。
kobayashi_yusukeThursday, October 22nd, 2020 at 4:24:13 PM GMT+09:00
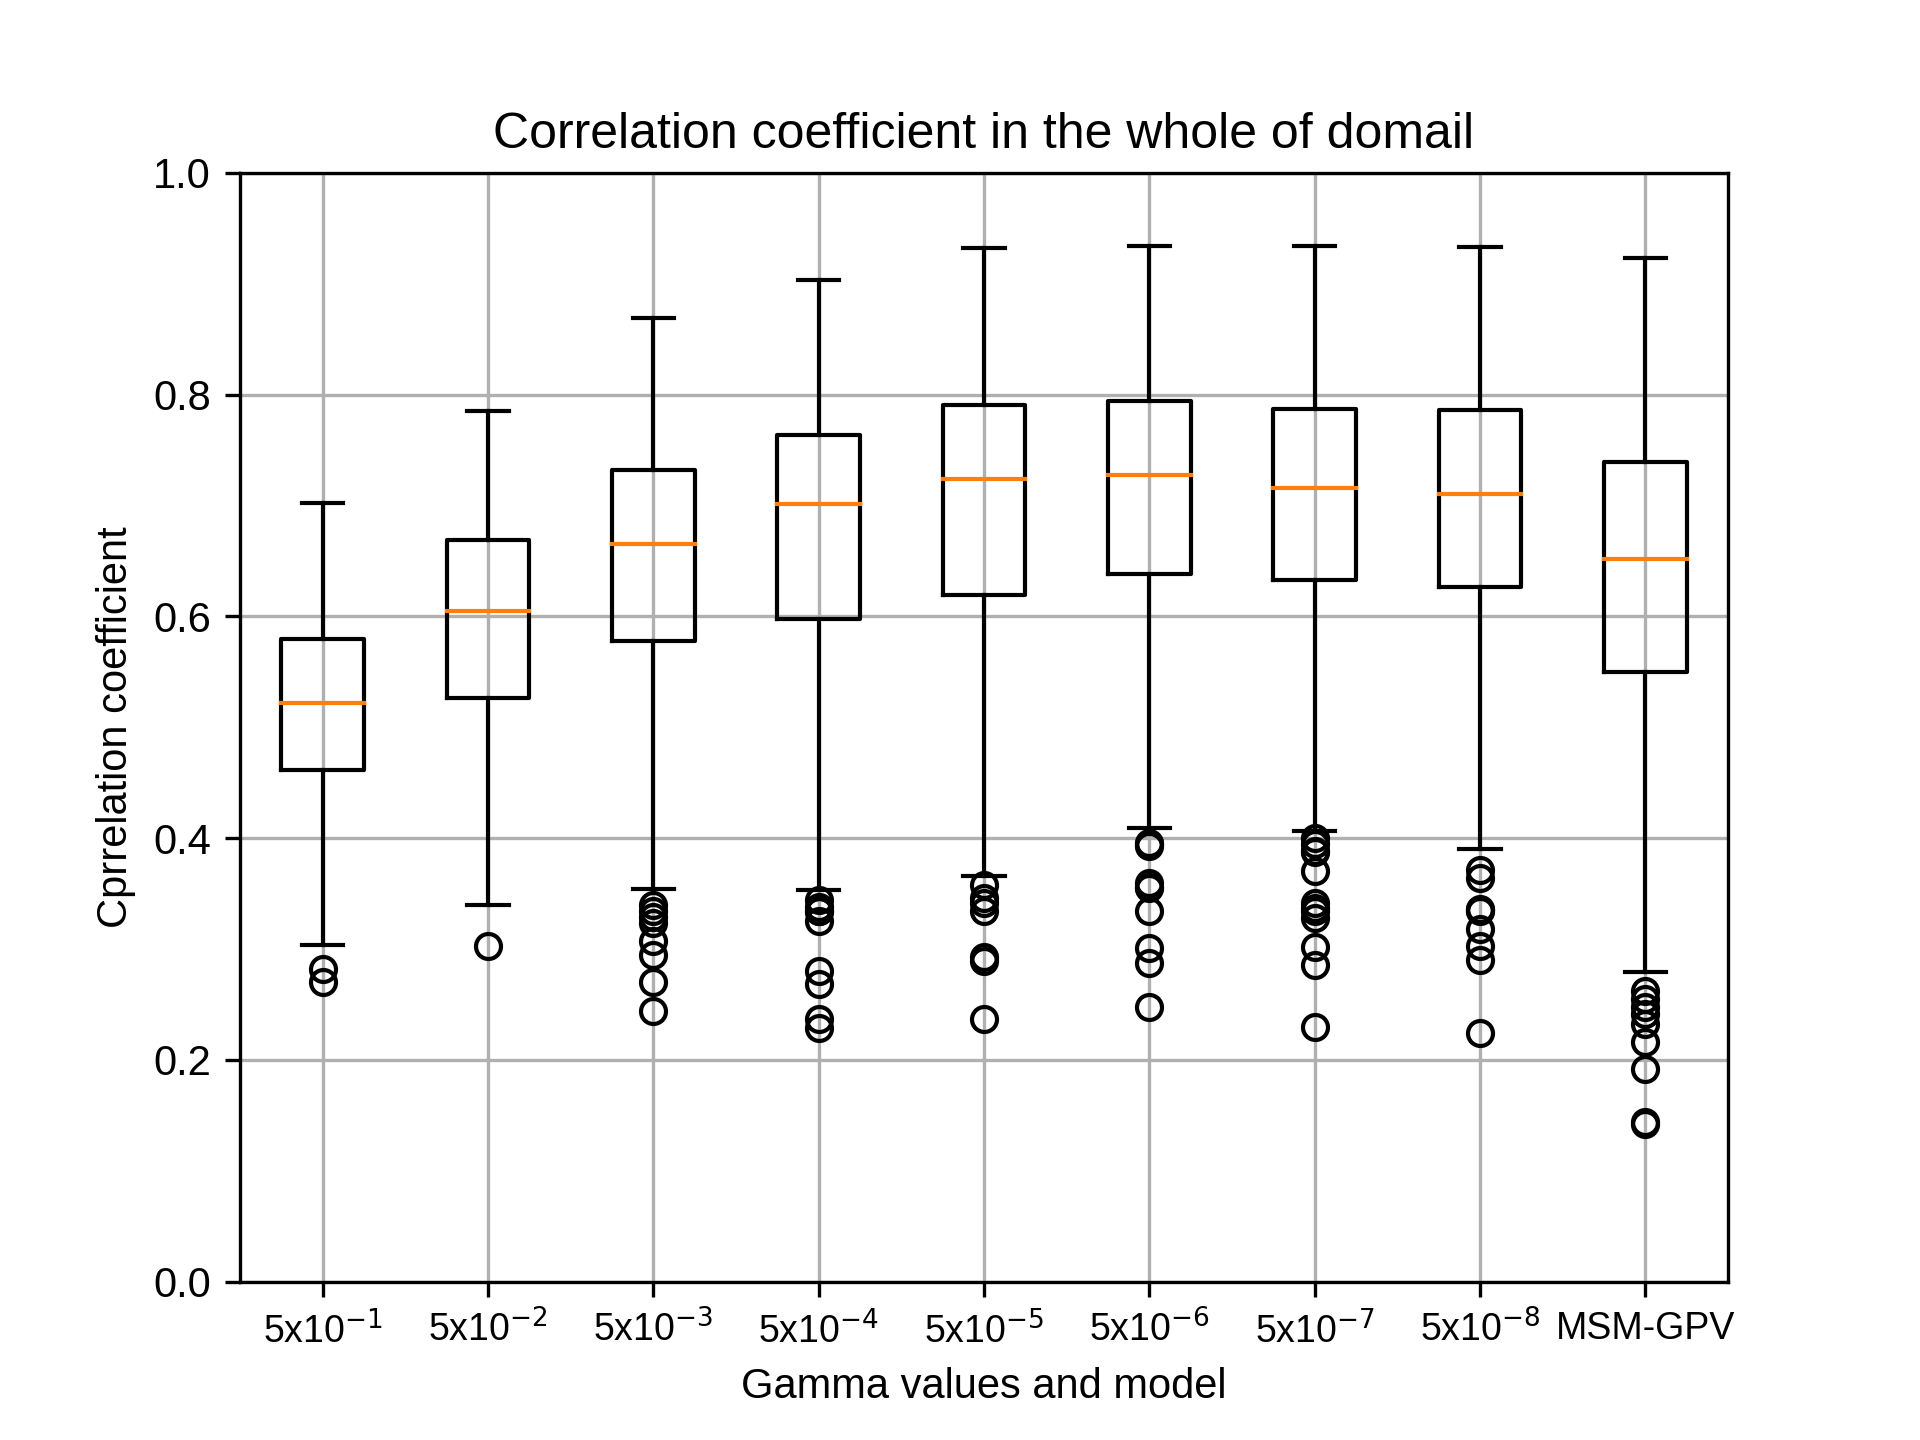
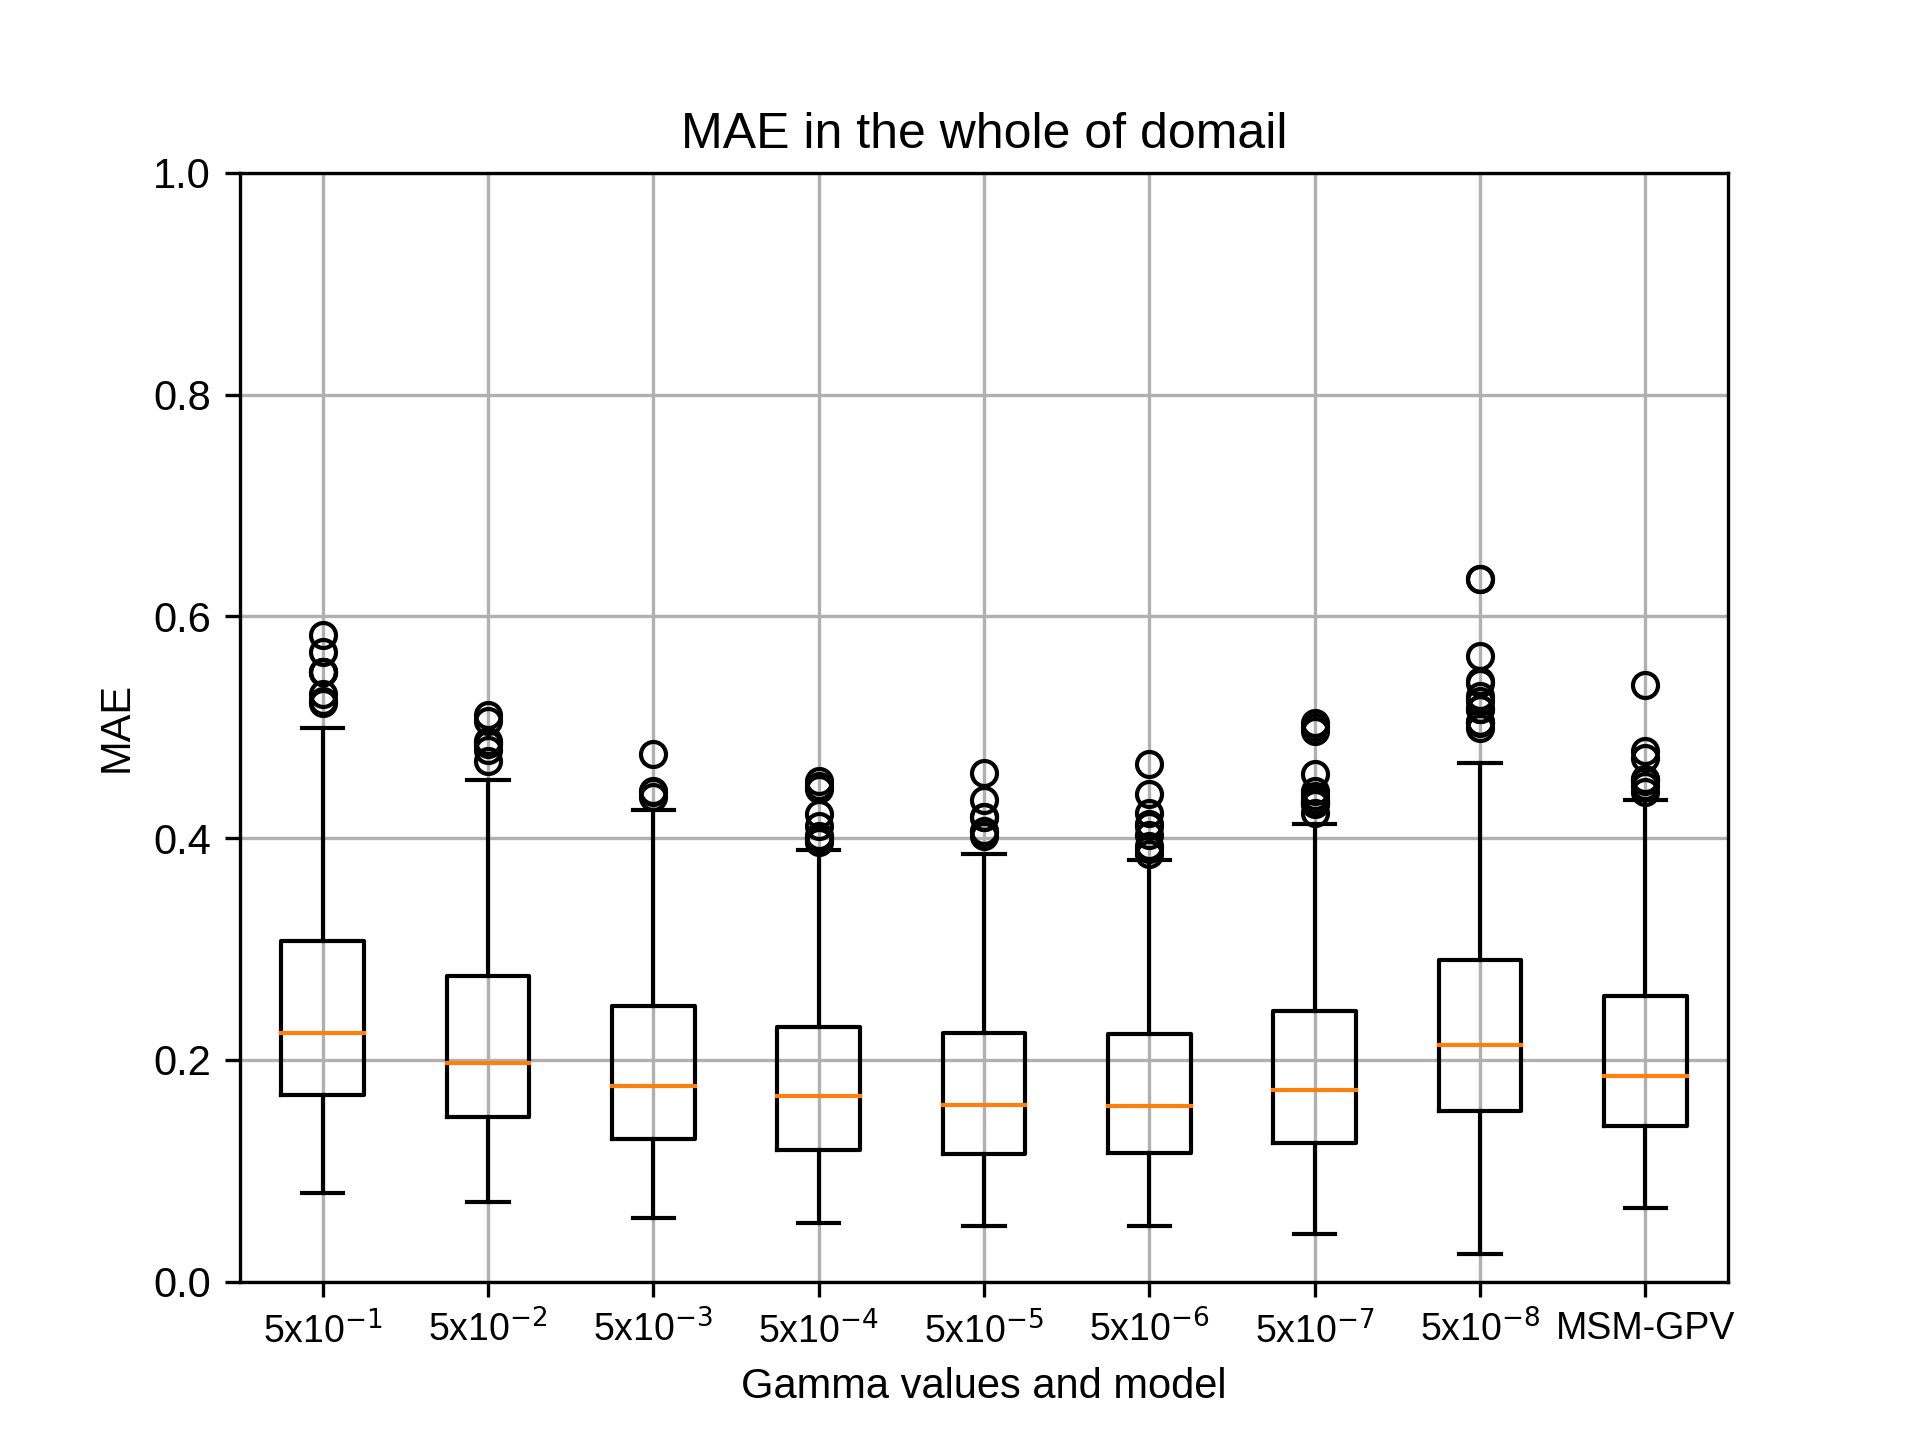
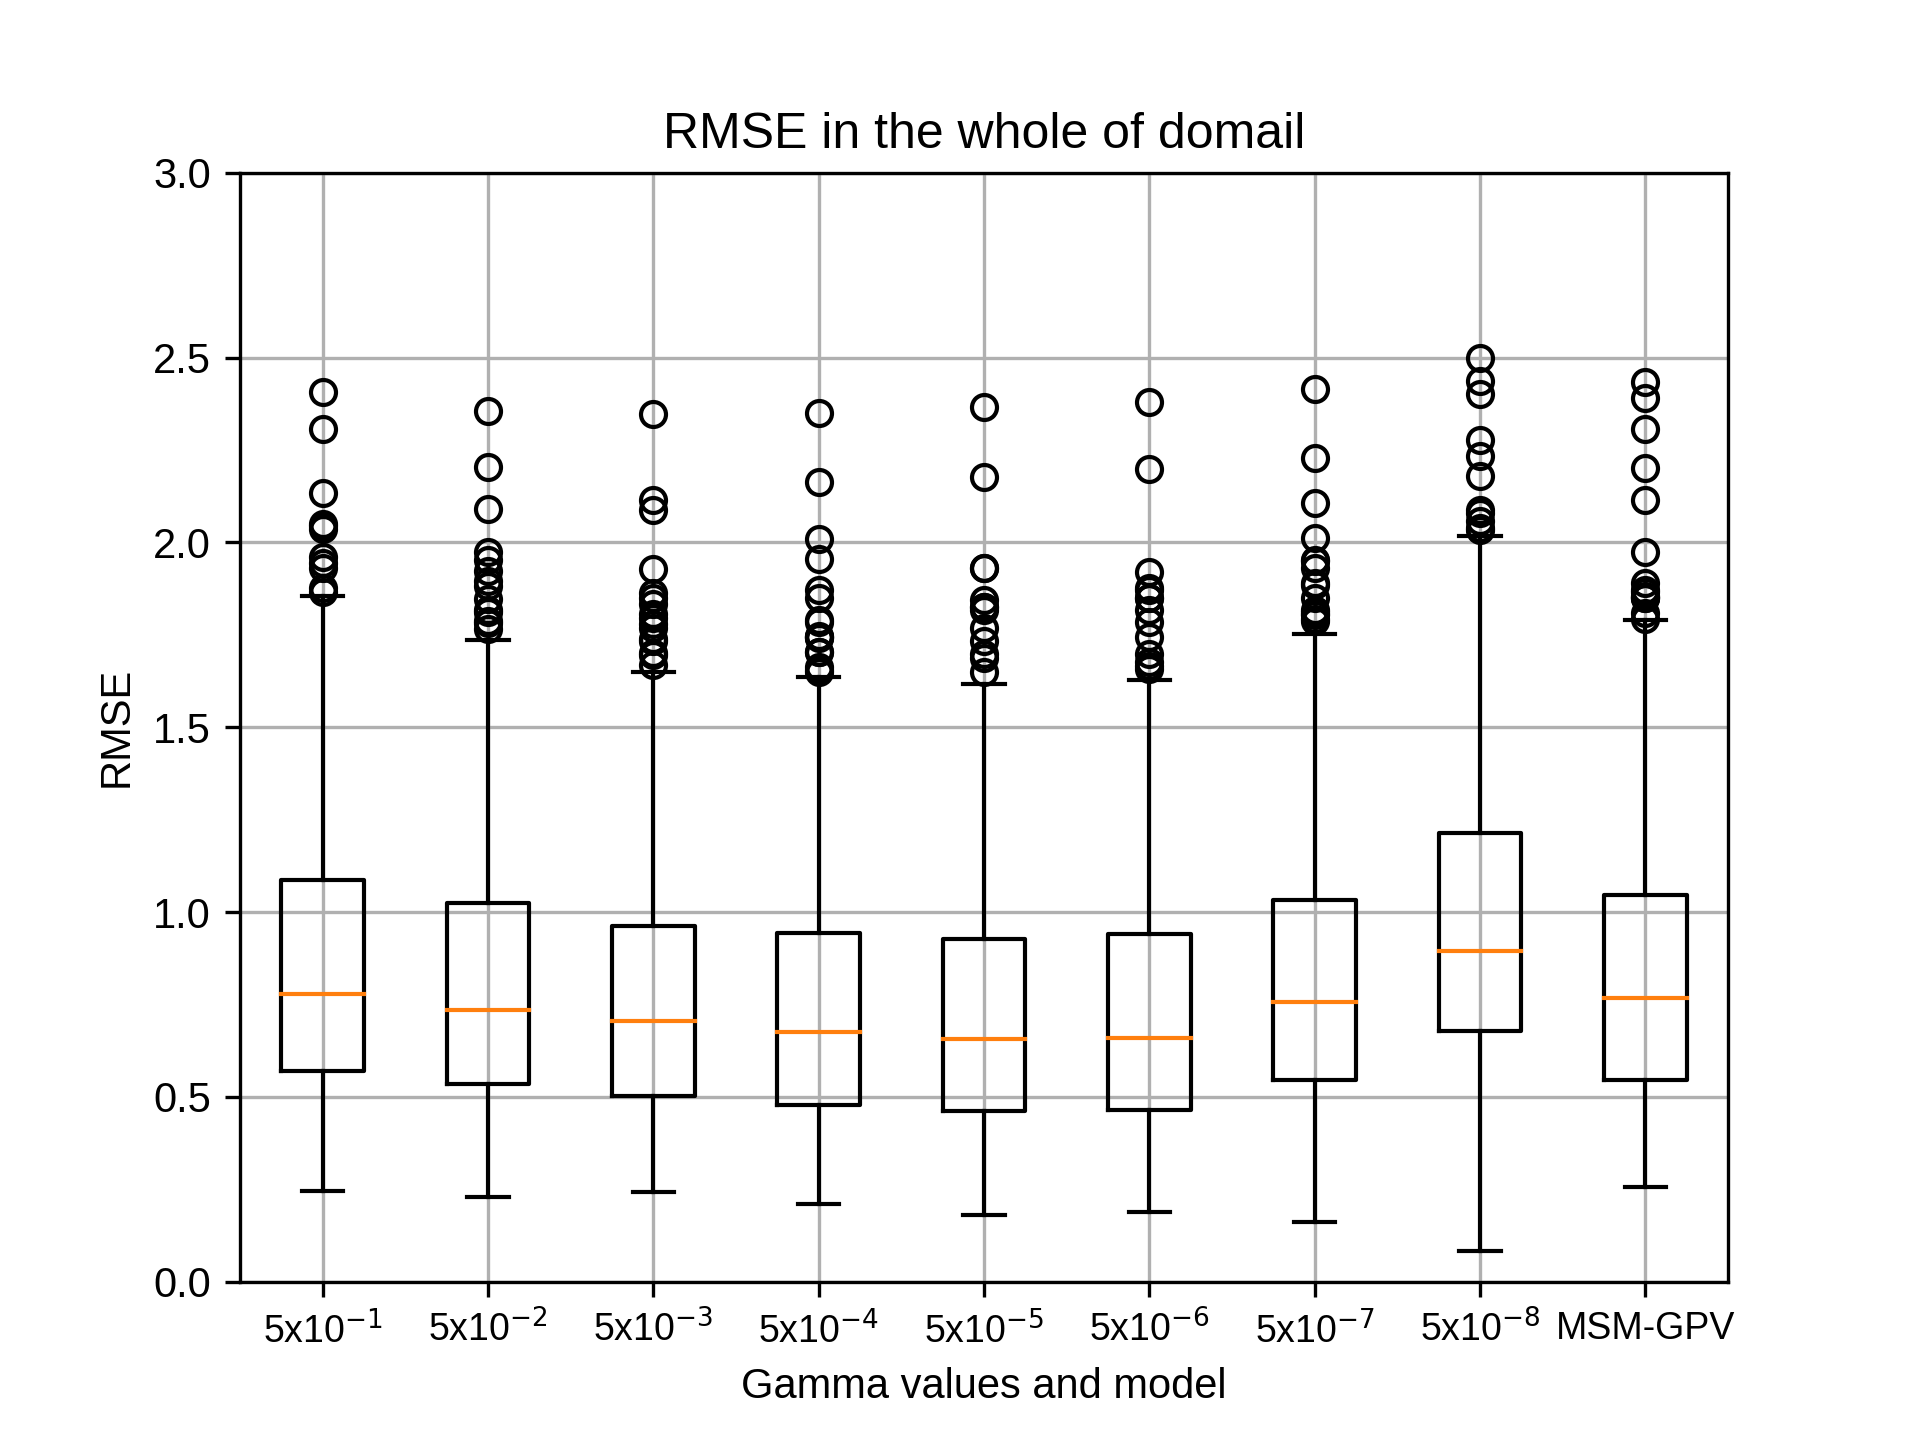
4月のsiteC,rg2=6の結果です。
kobayashi_yusukeThursday, October 22nd, 2020 at 4:24:28 PM GMT+09:00
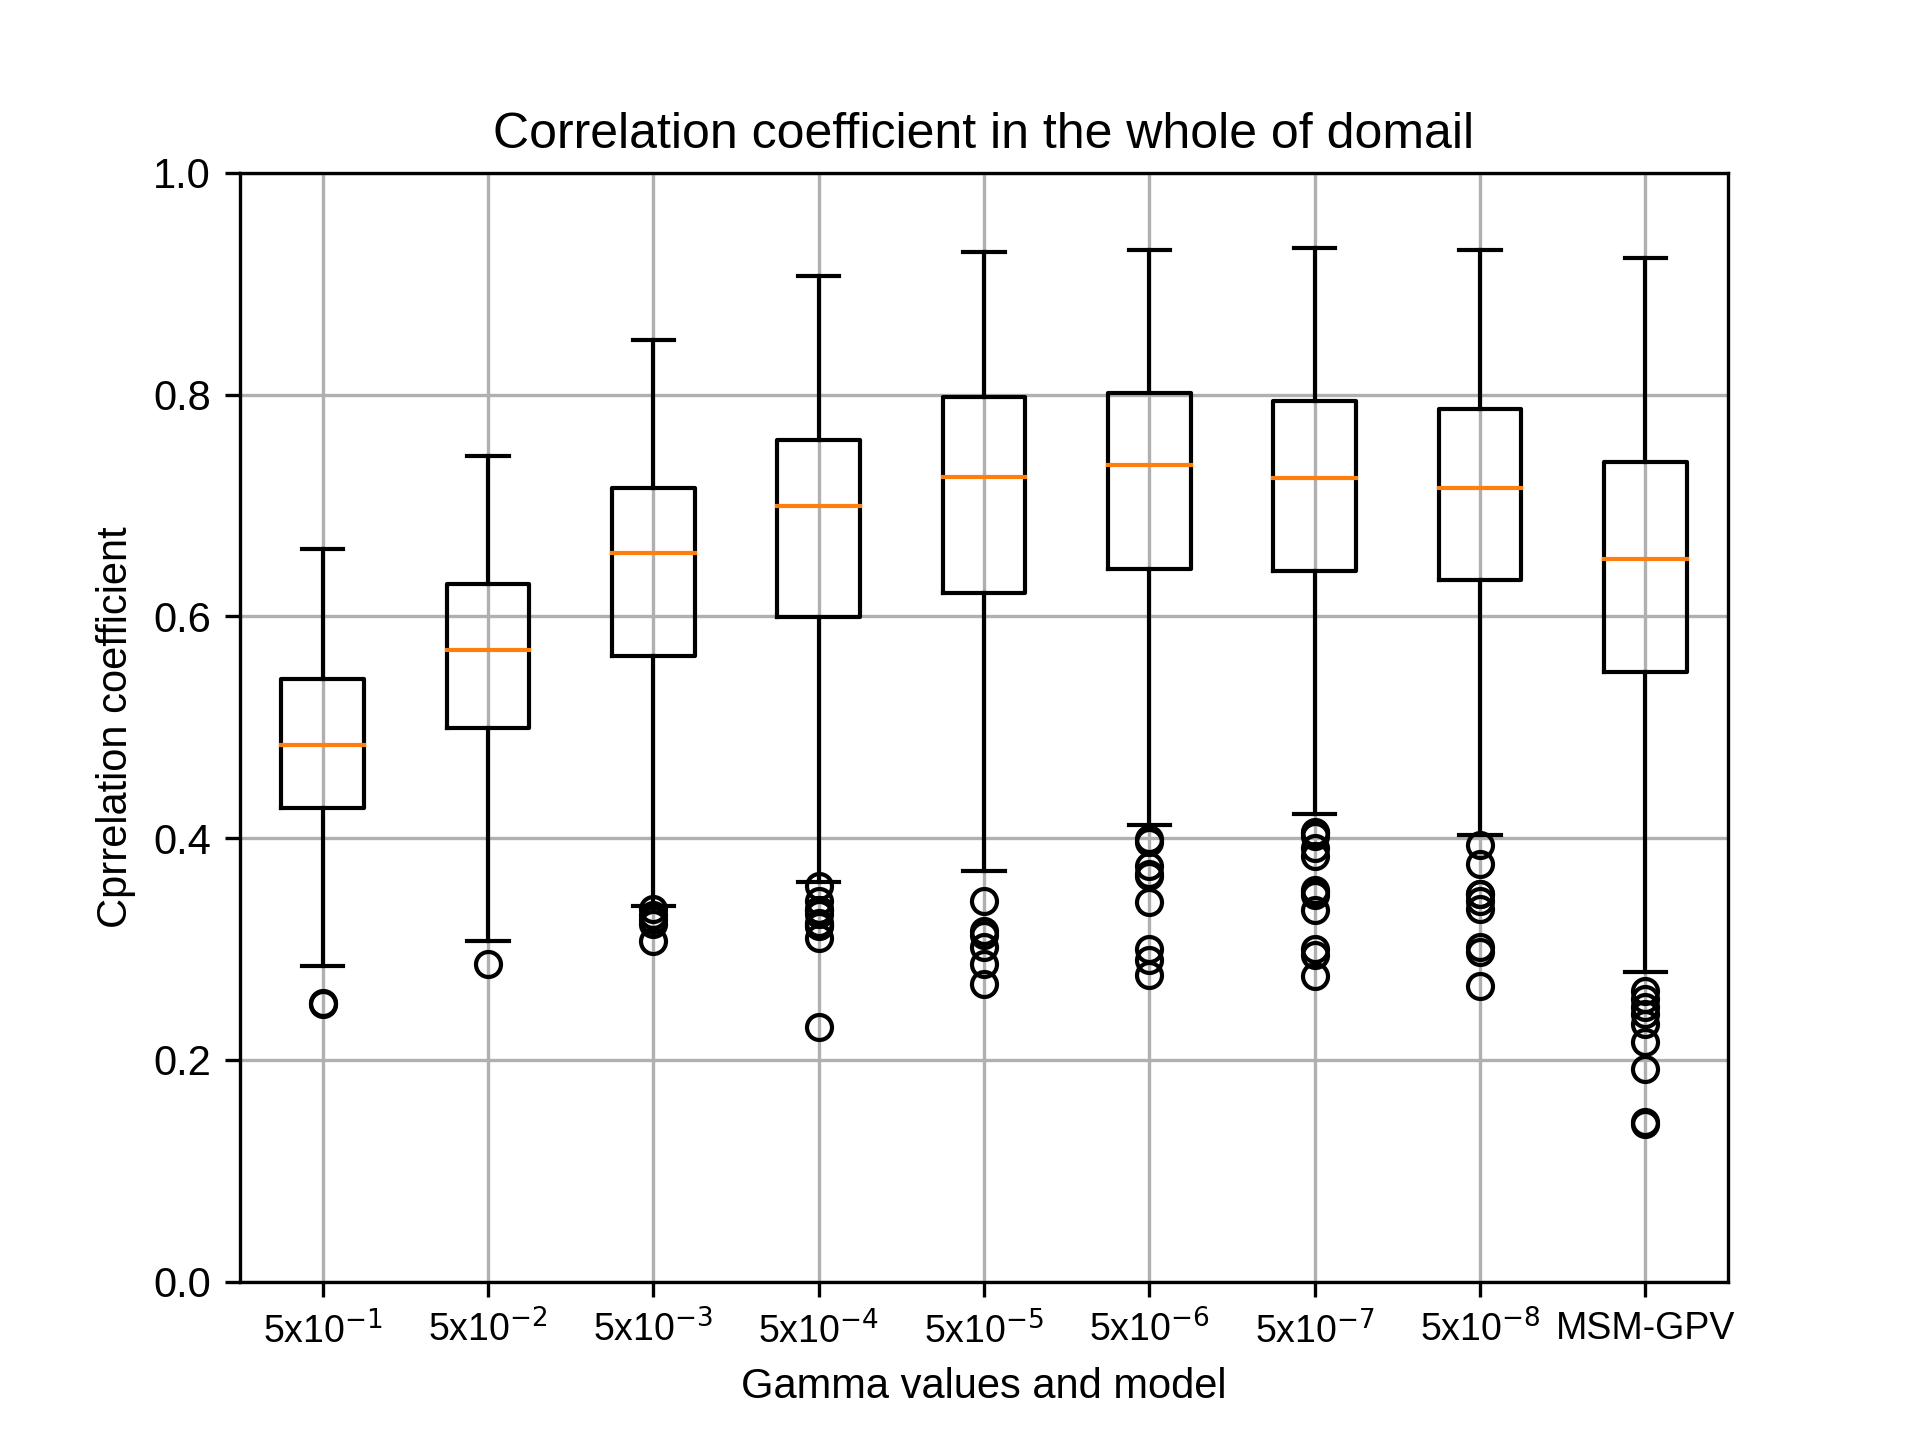
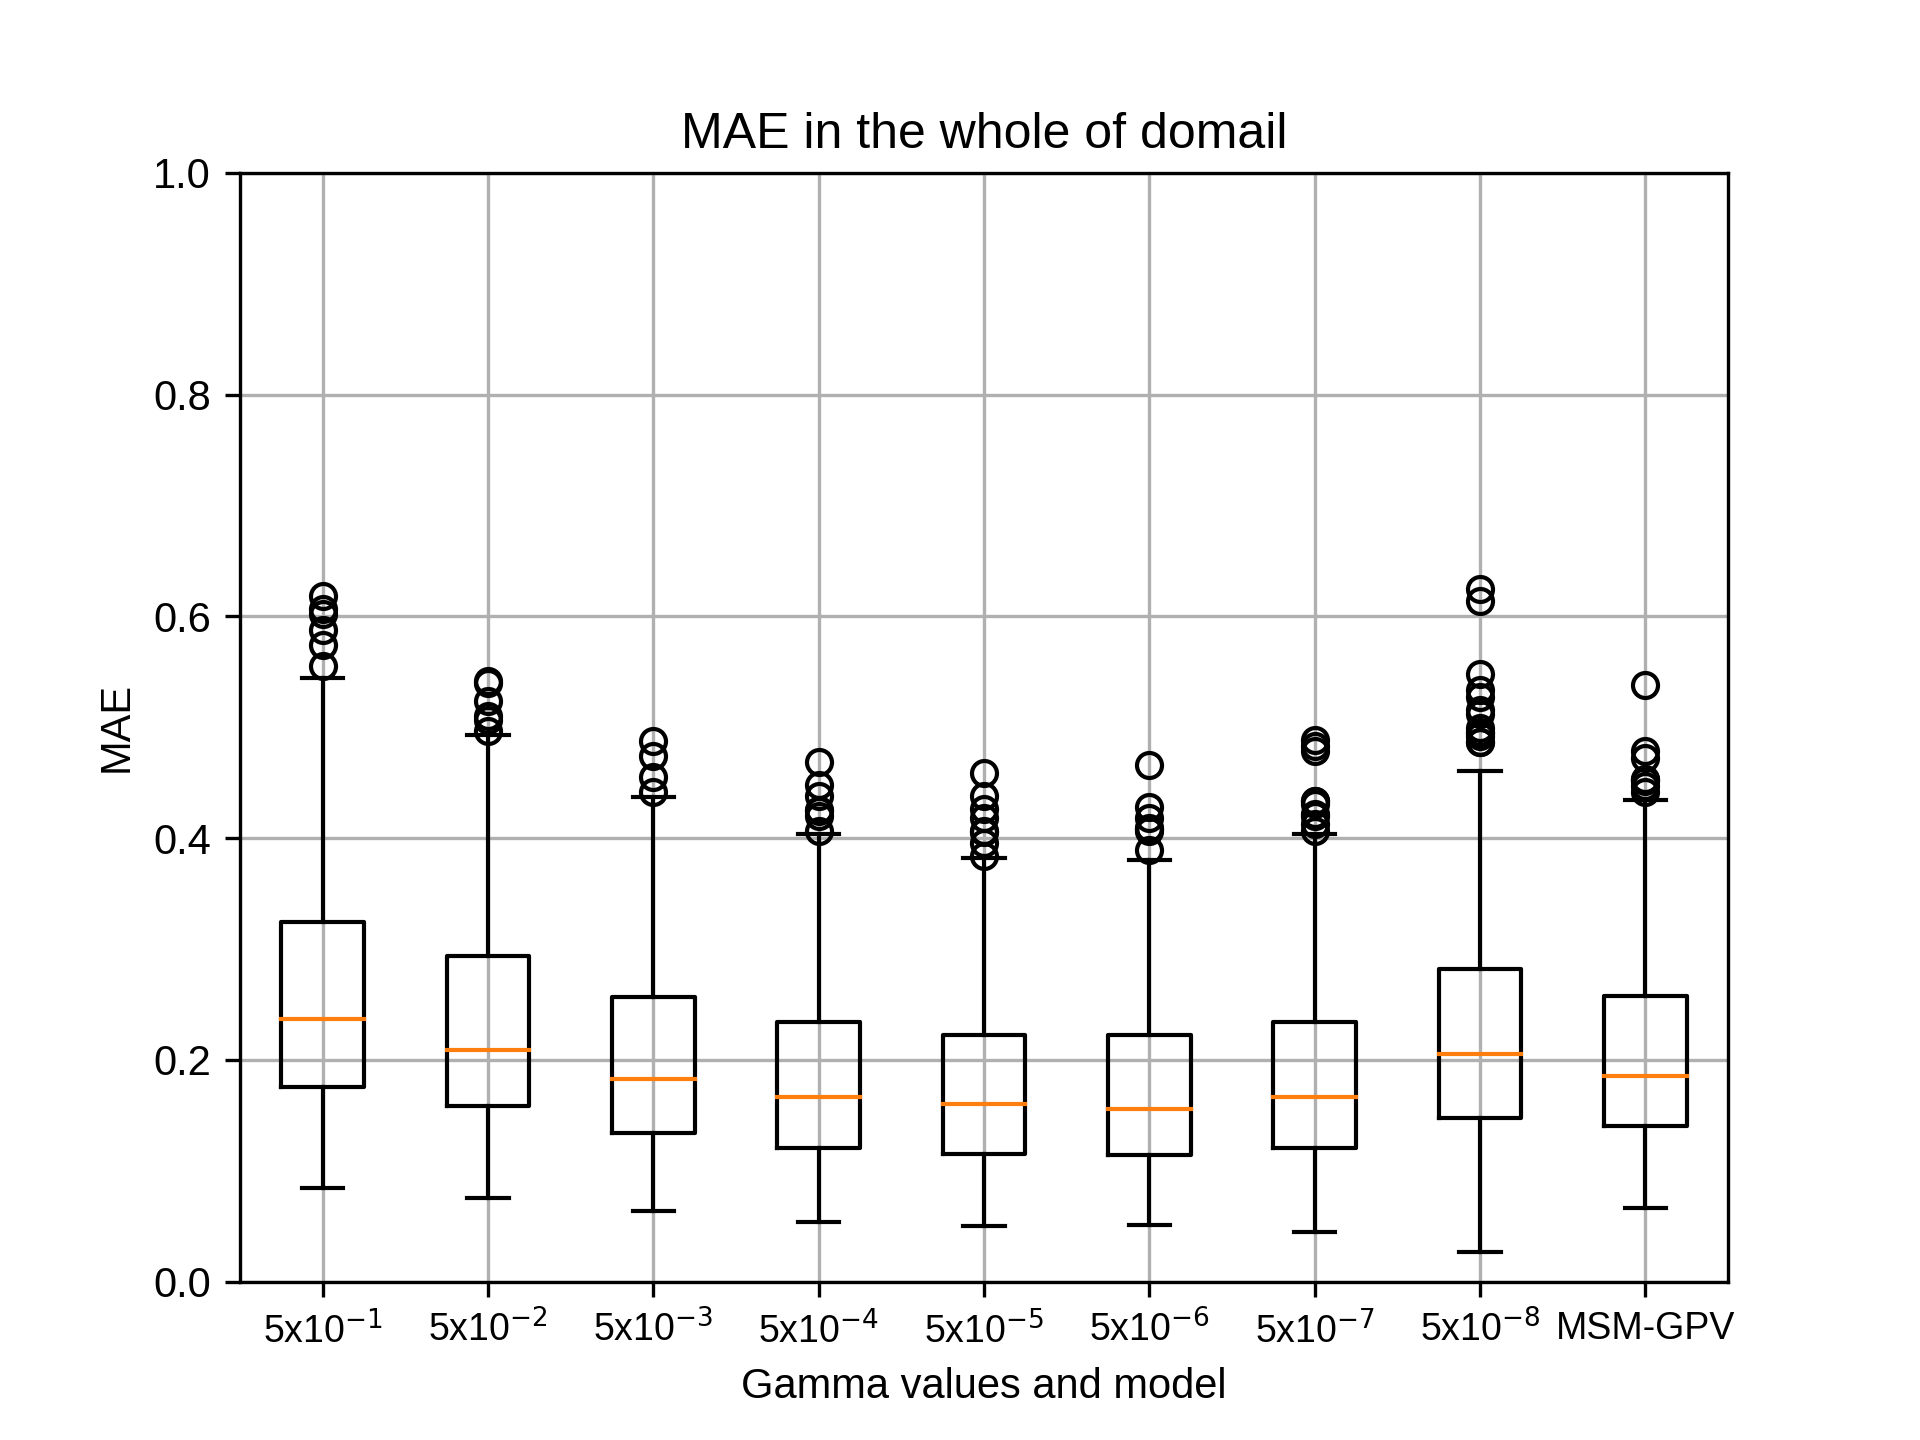
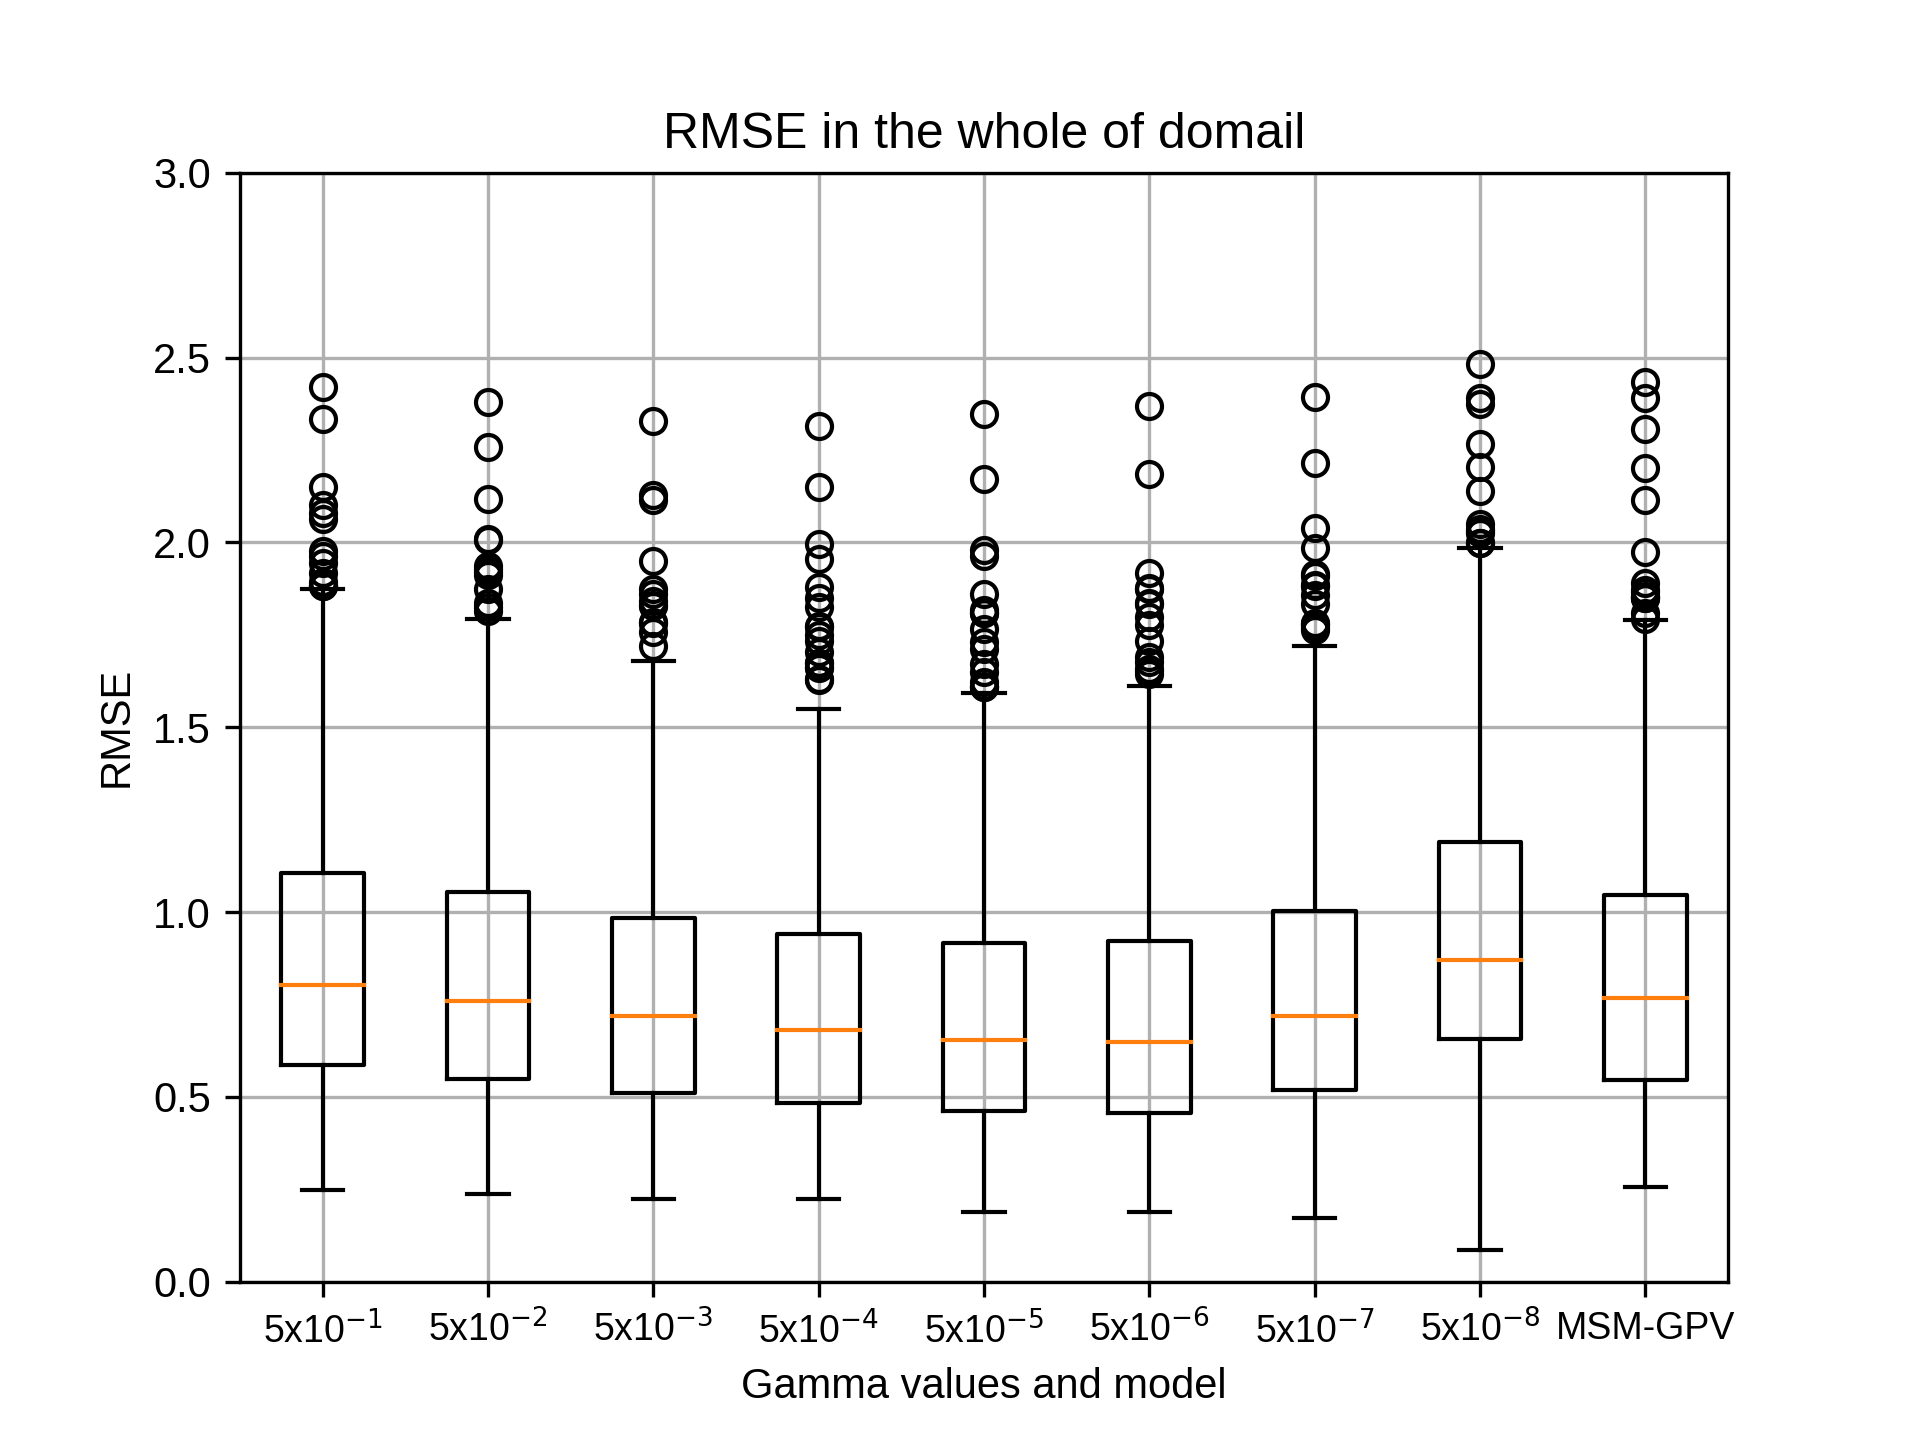
4月のsiteC,rg2=8の結果です。
kobayashi_yusukeThursday, October 22nd, 2020 at 4:24:47 PM GMT+09:00


4月のsiteC,rg2=10の結果です。
kobayashi_yusukeThursday, October 22nd, 2020 at 4:25:05 PM GMT+09:00
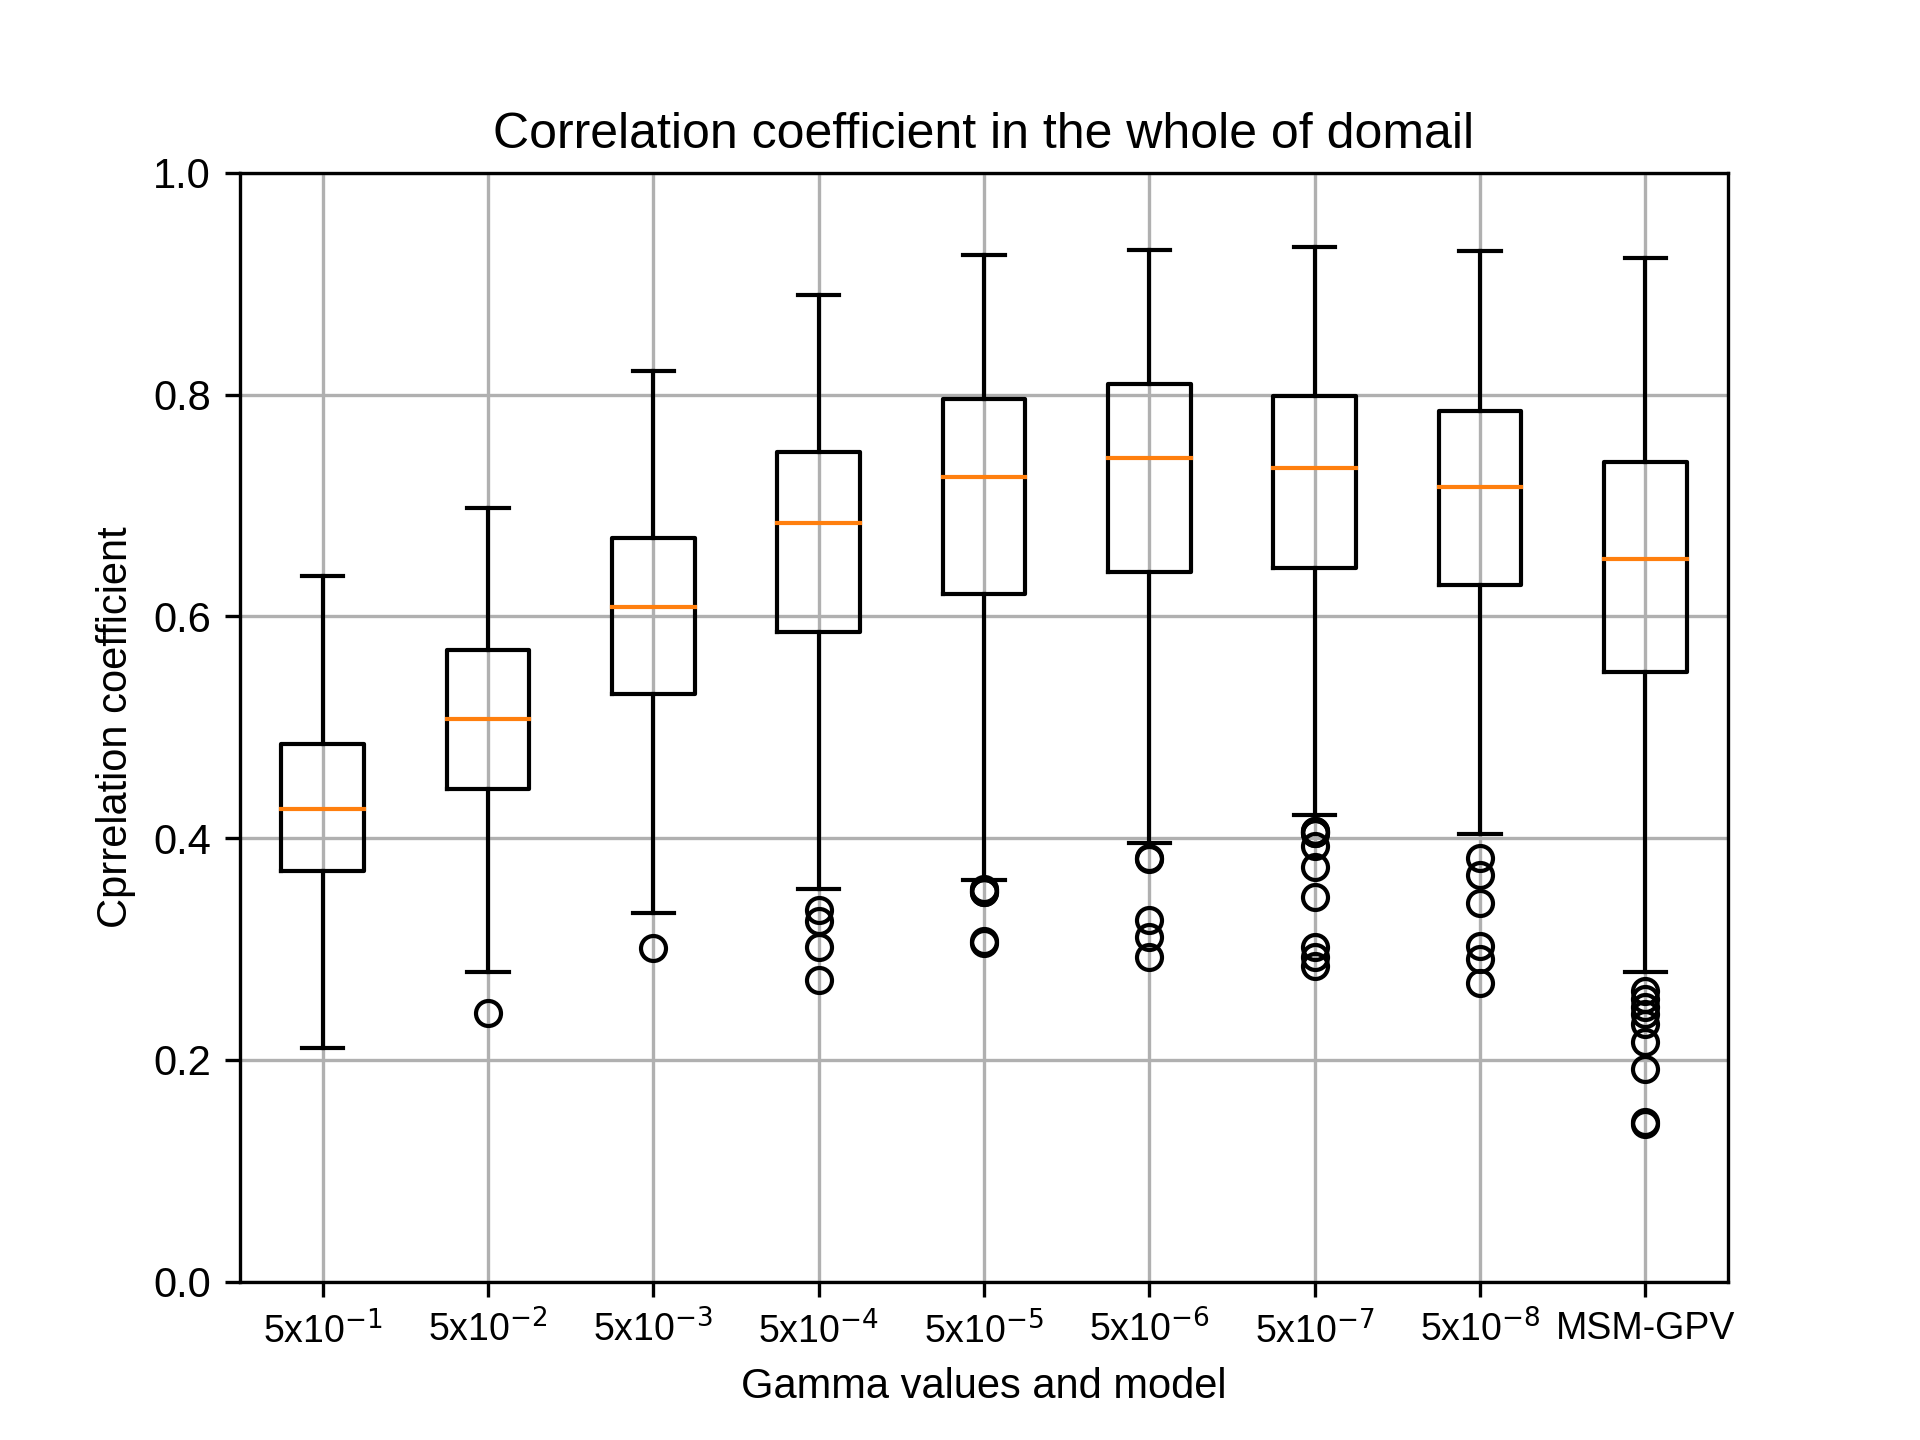
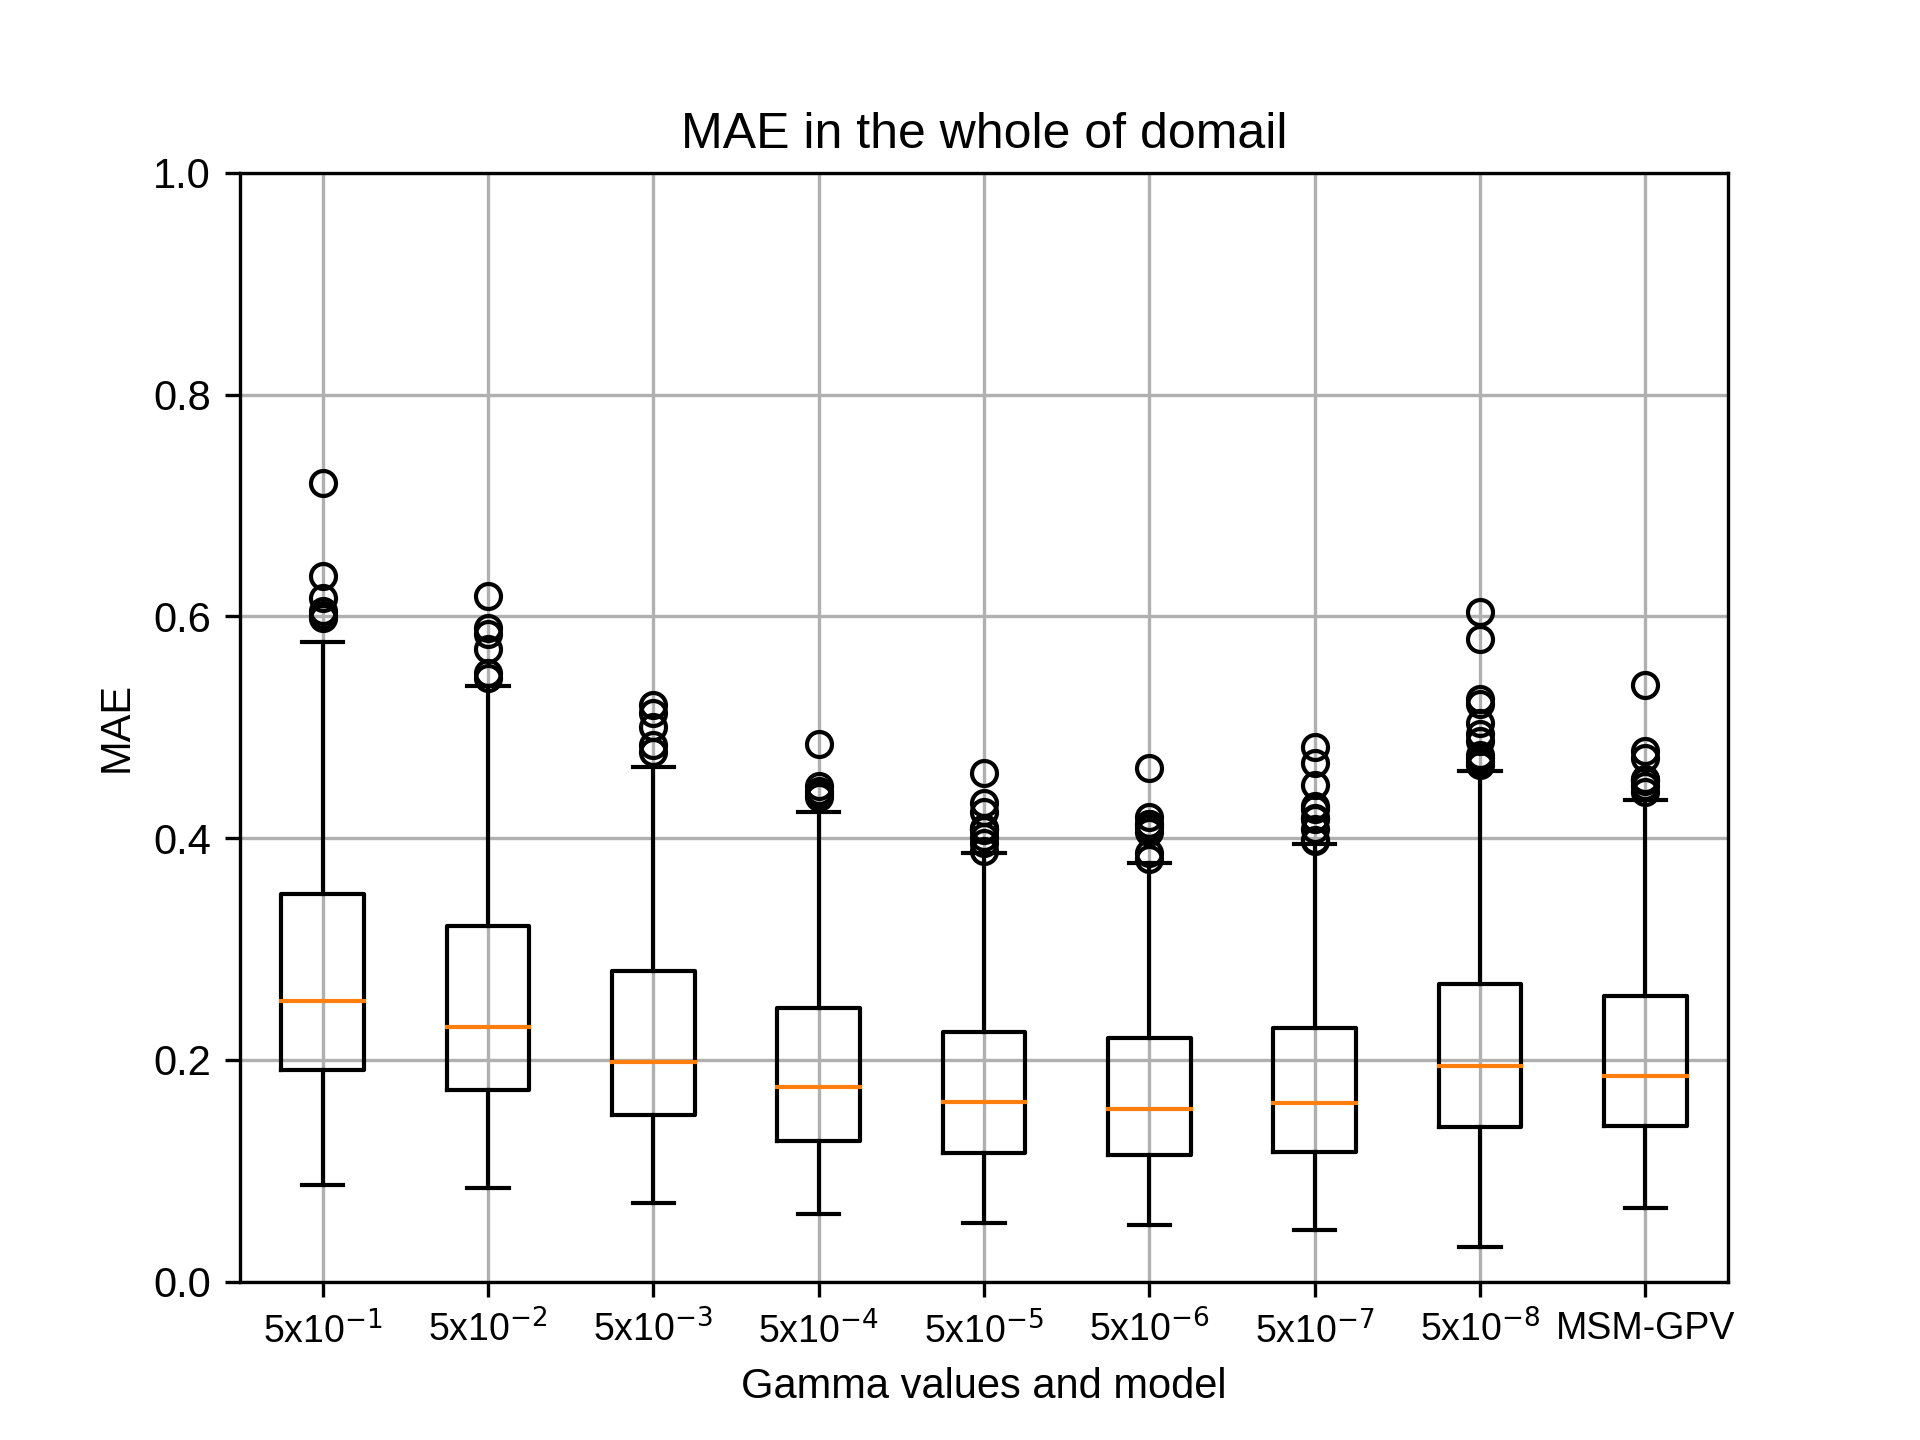
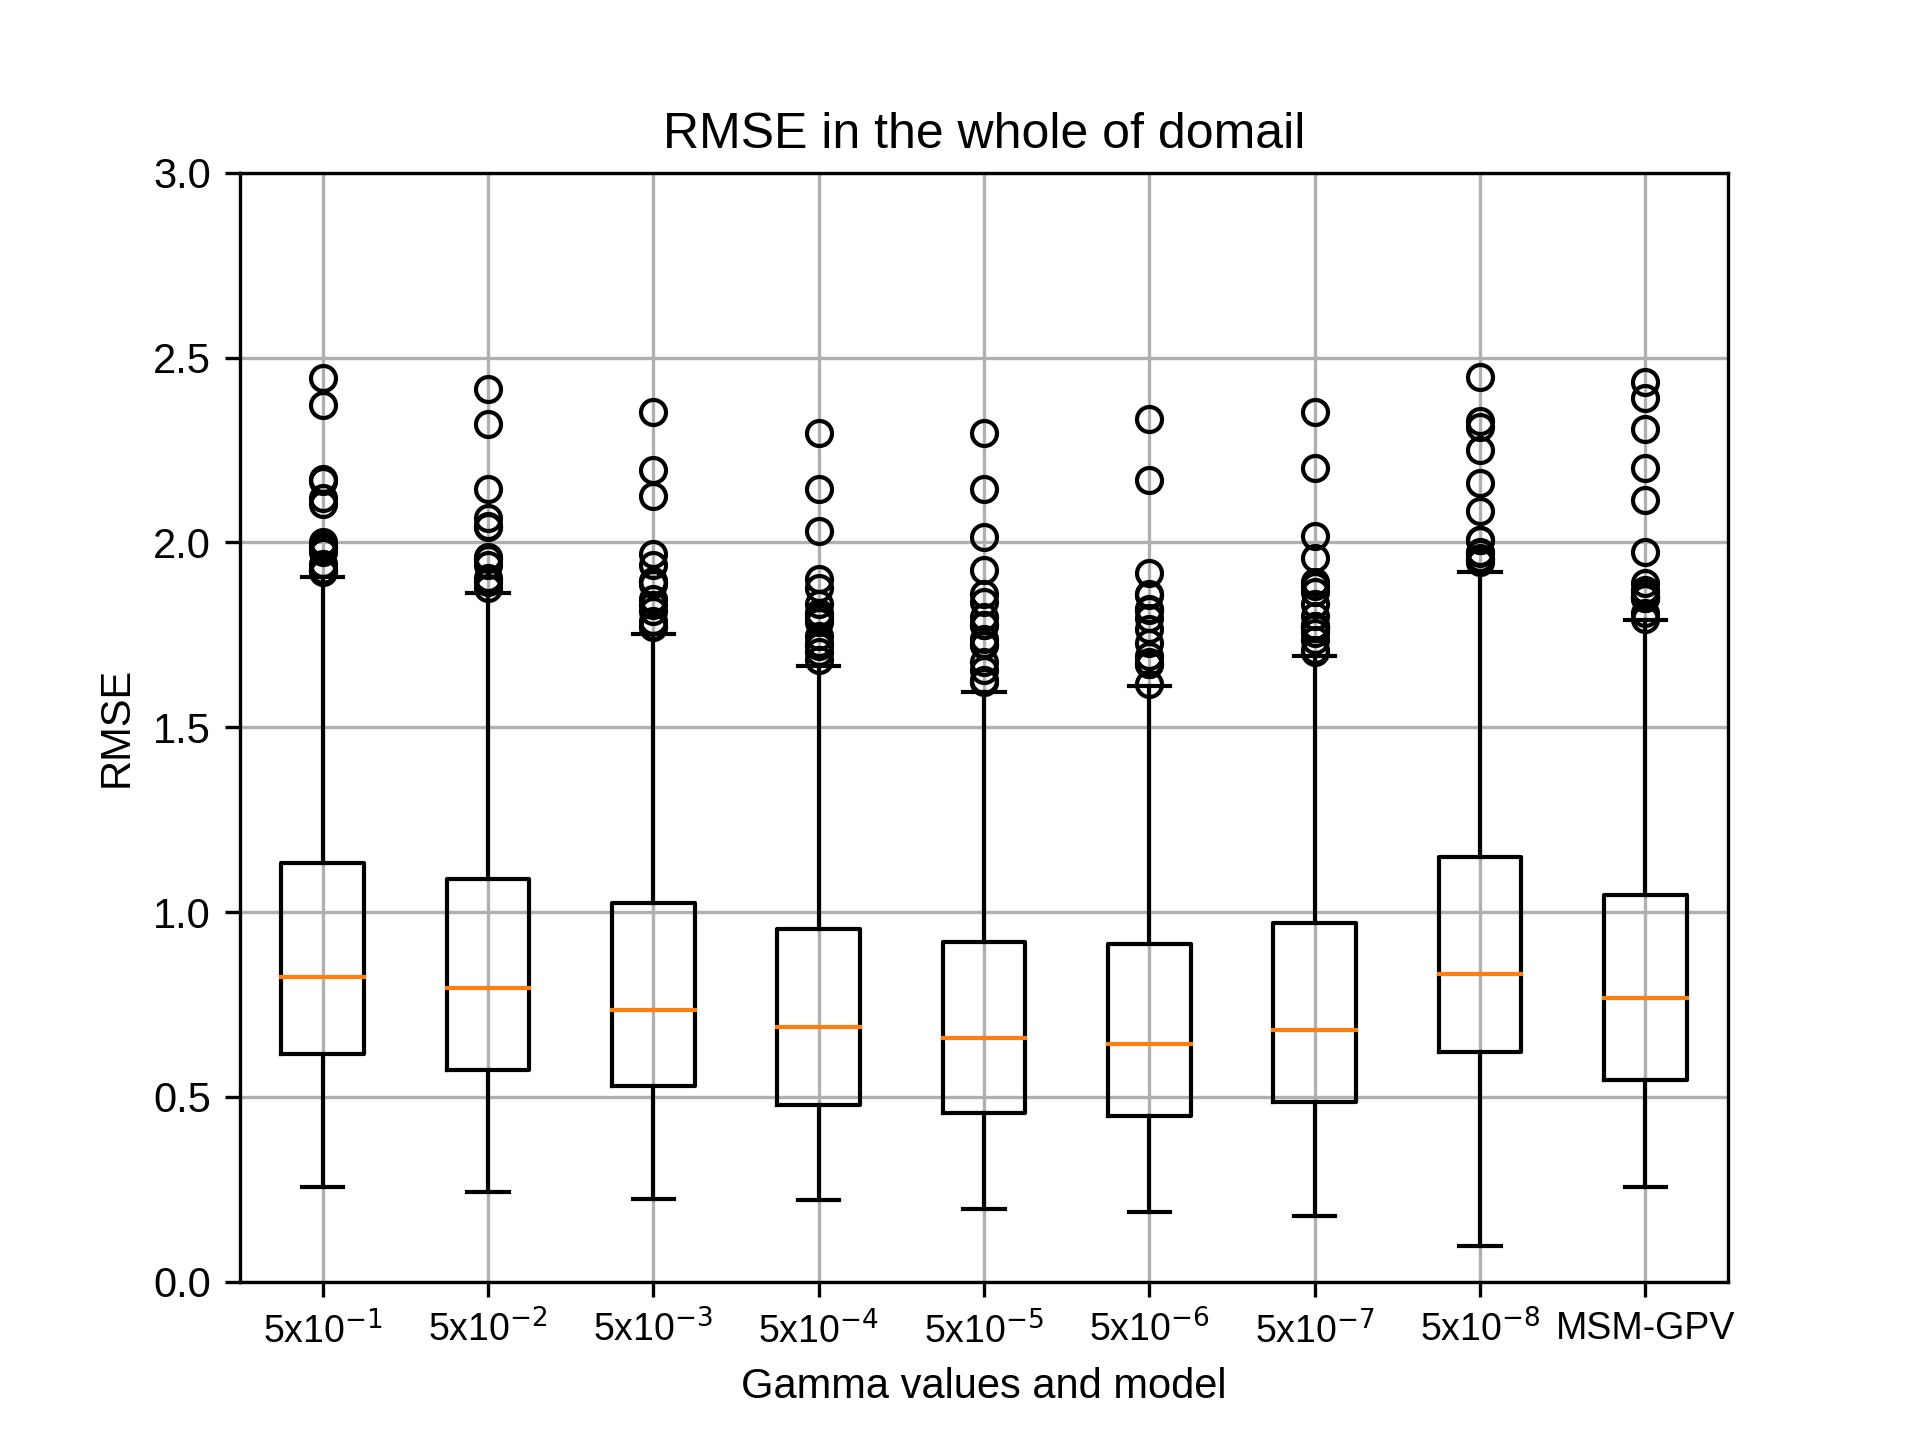
4月のsiteC,rg2=12の結果です。
4月のsiteCではrg2=12でgammaが5x10⁻⁶のとき、相関係数の中央値が最も高くなりました。
4月のsiteCではrg2=12でgammaが5x10⁻⁶のとき、相関係数の中央値が最も高くなりました。
kobayashi_yusukeThursday, October 22nd, 2020 at 4:25:26 PM GMT+09:00
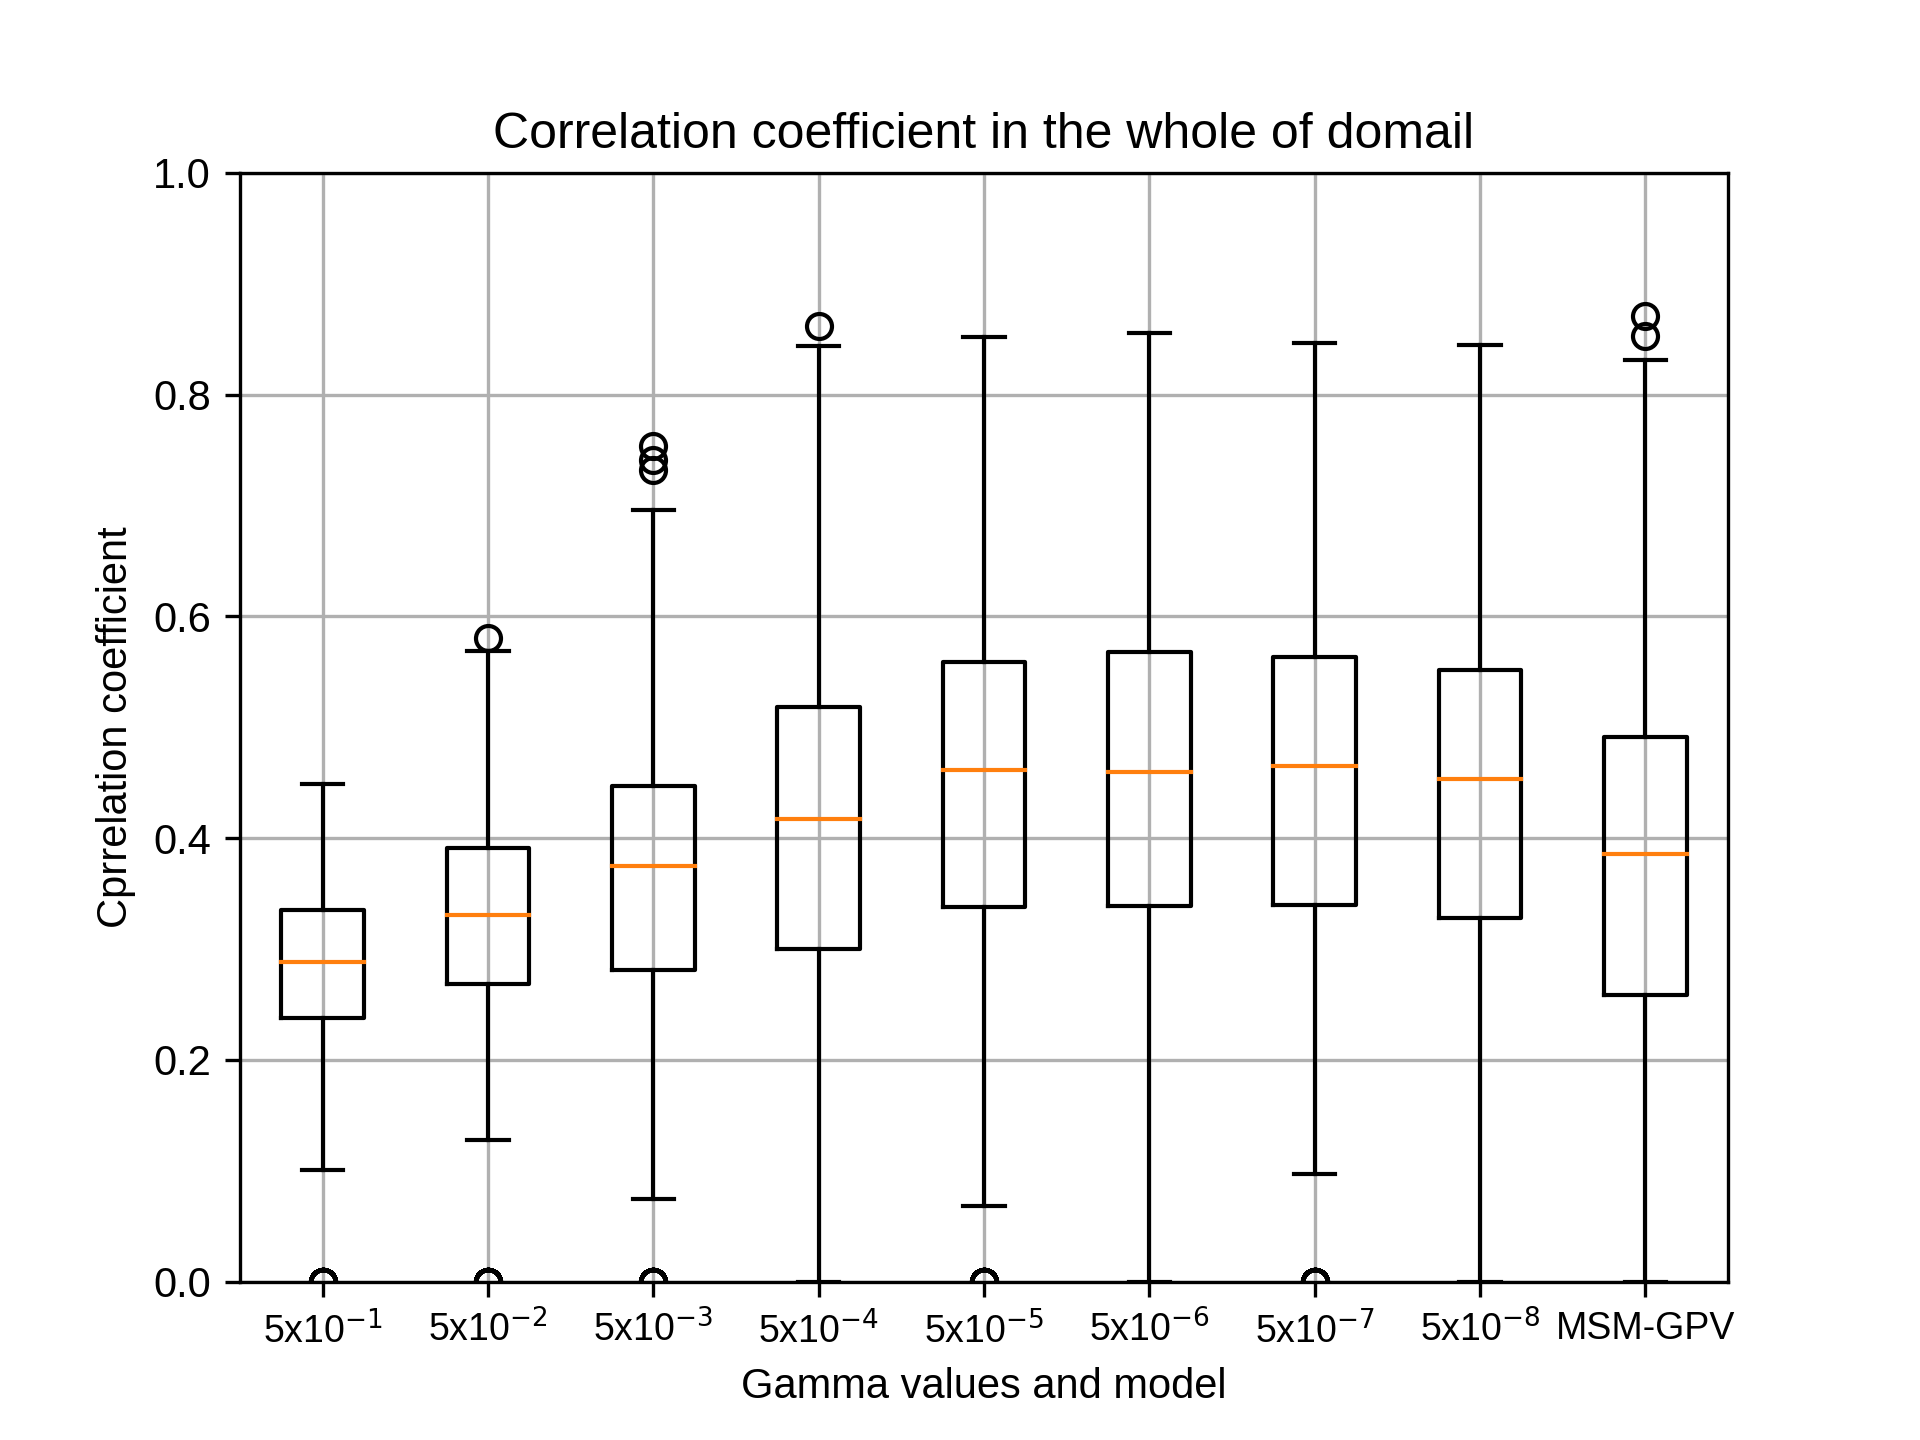
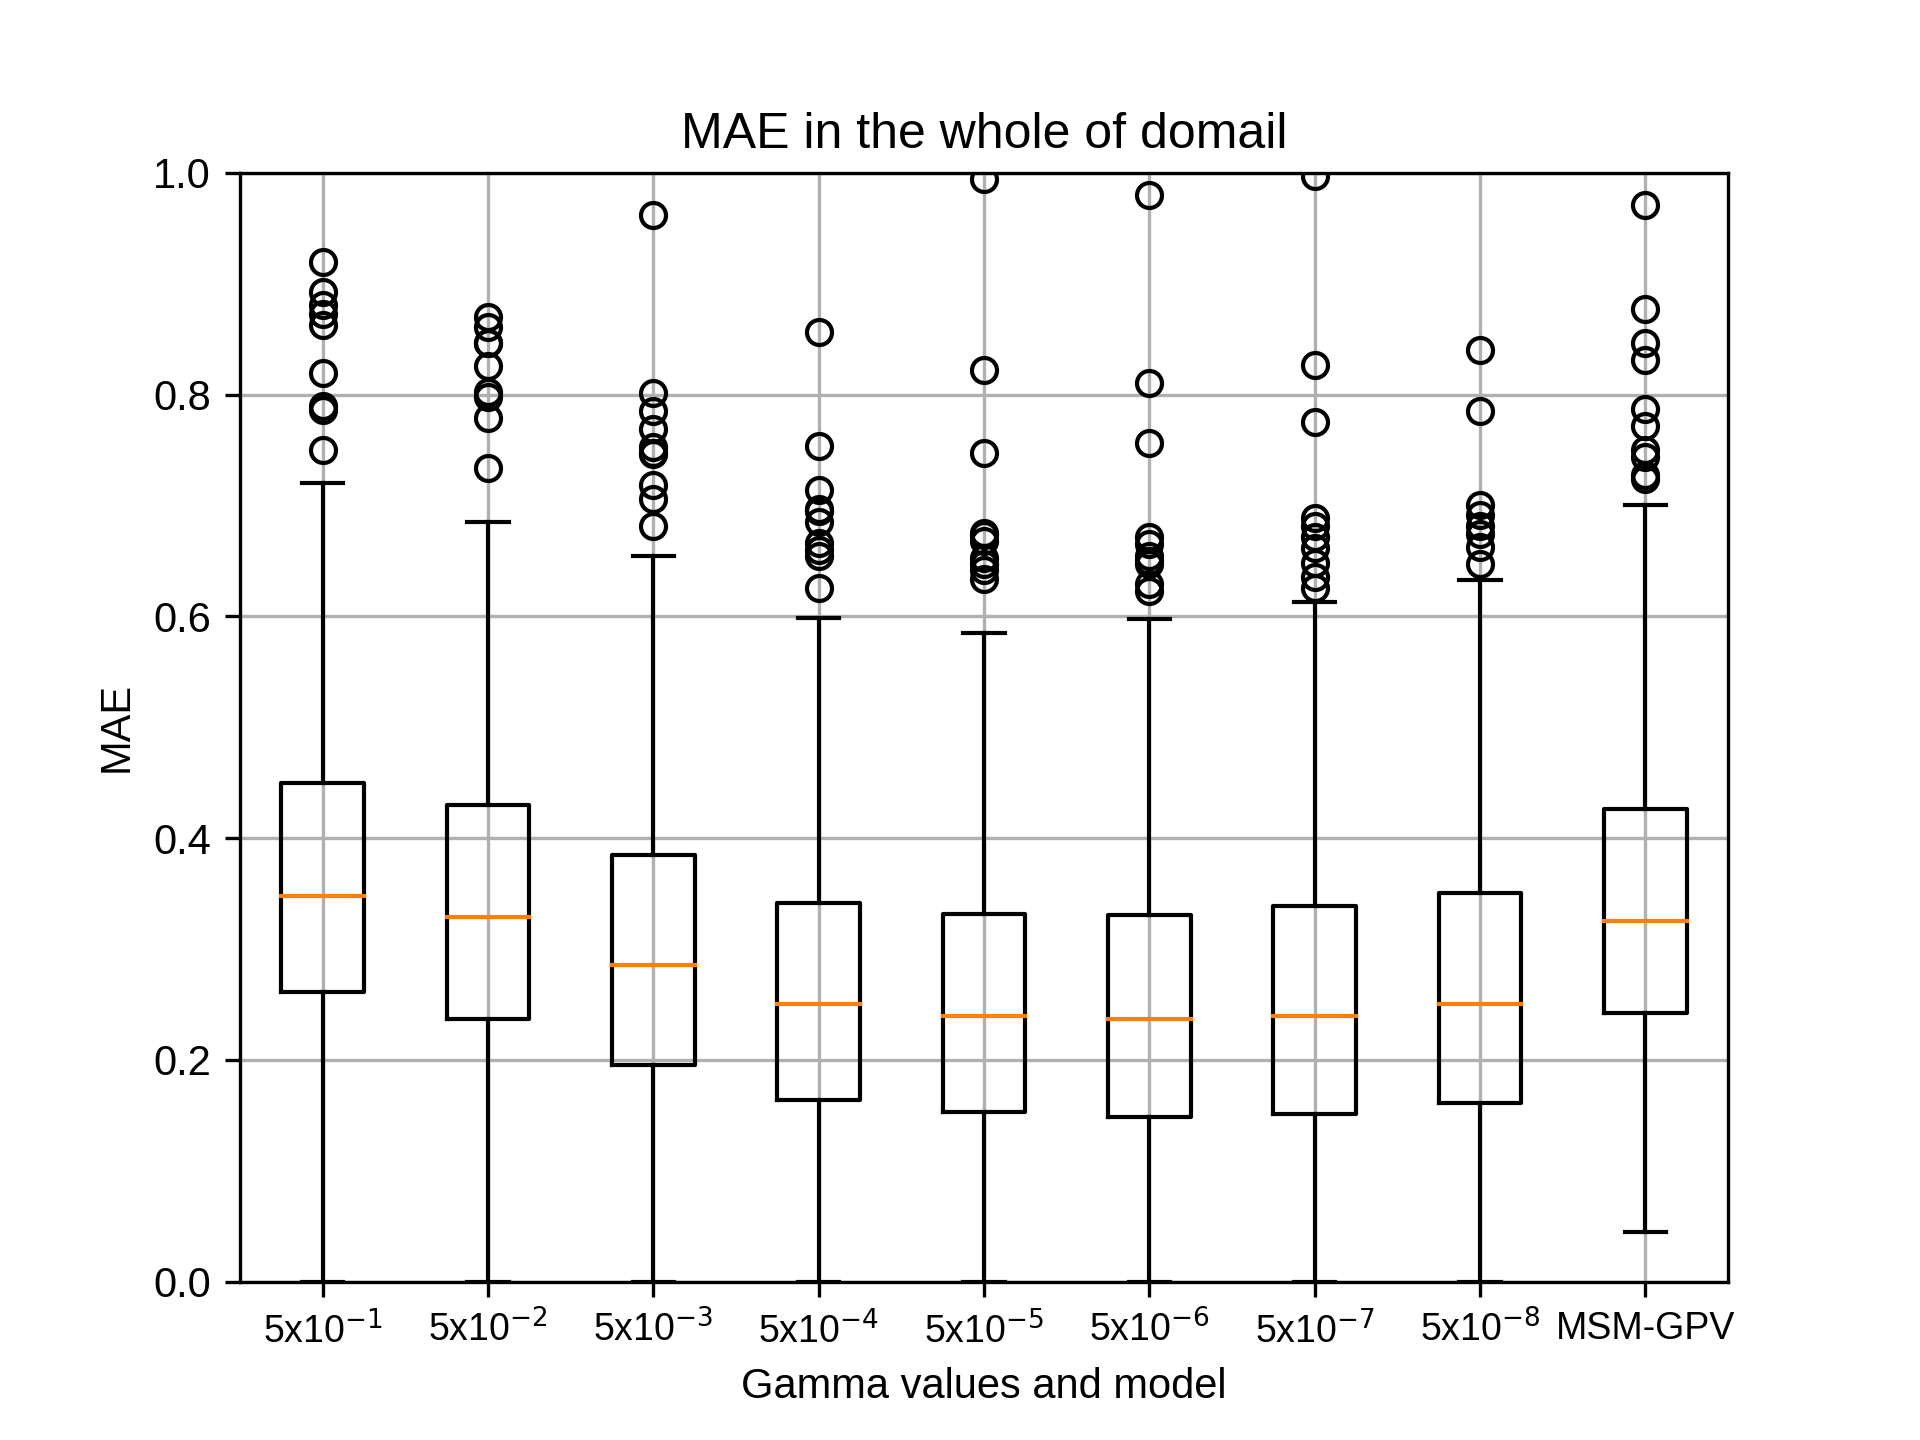
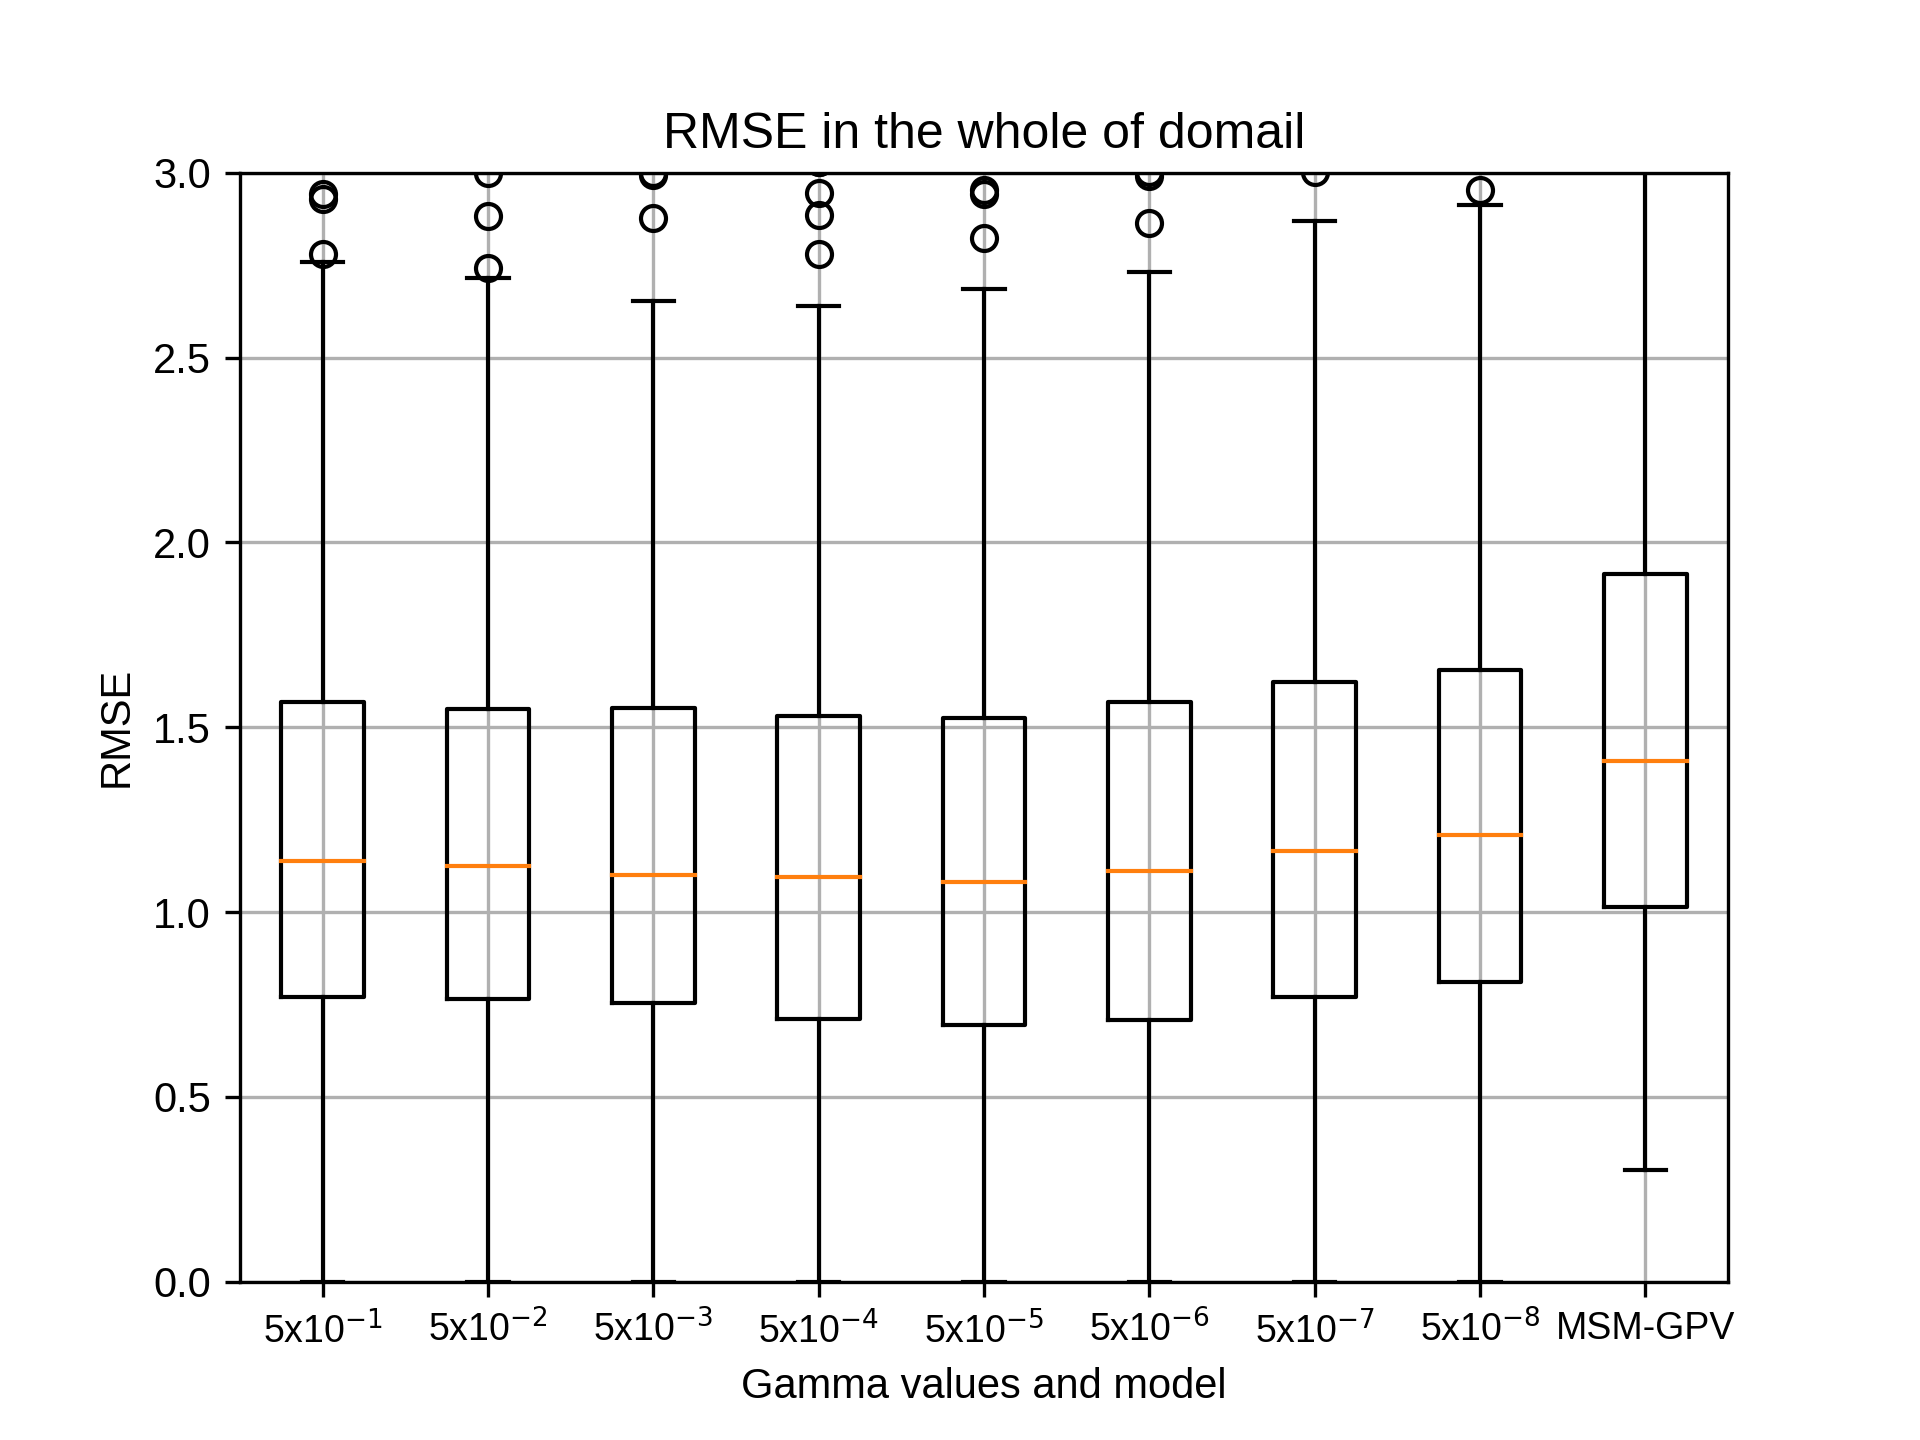
4月のsiteD,rg2=4の結果です。
kobayashi_yusukeThursday, October 22nd, 2020 at 4:25:41 PM GMT+09:00
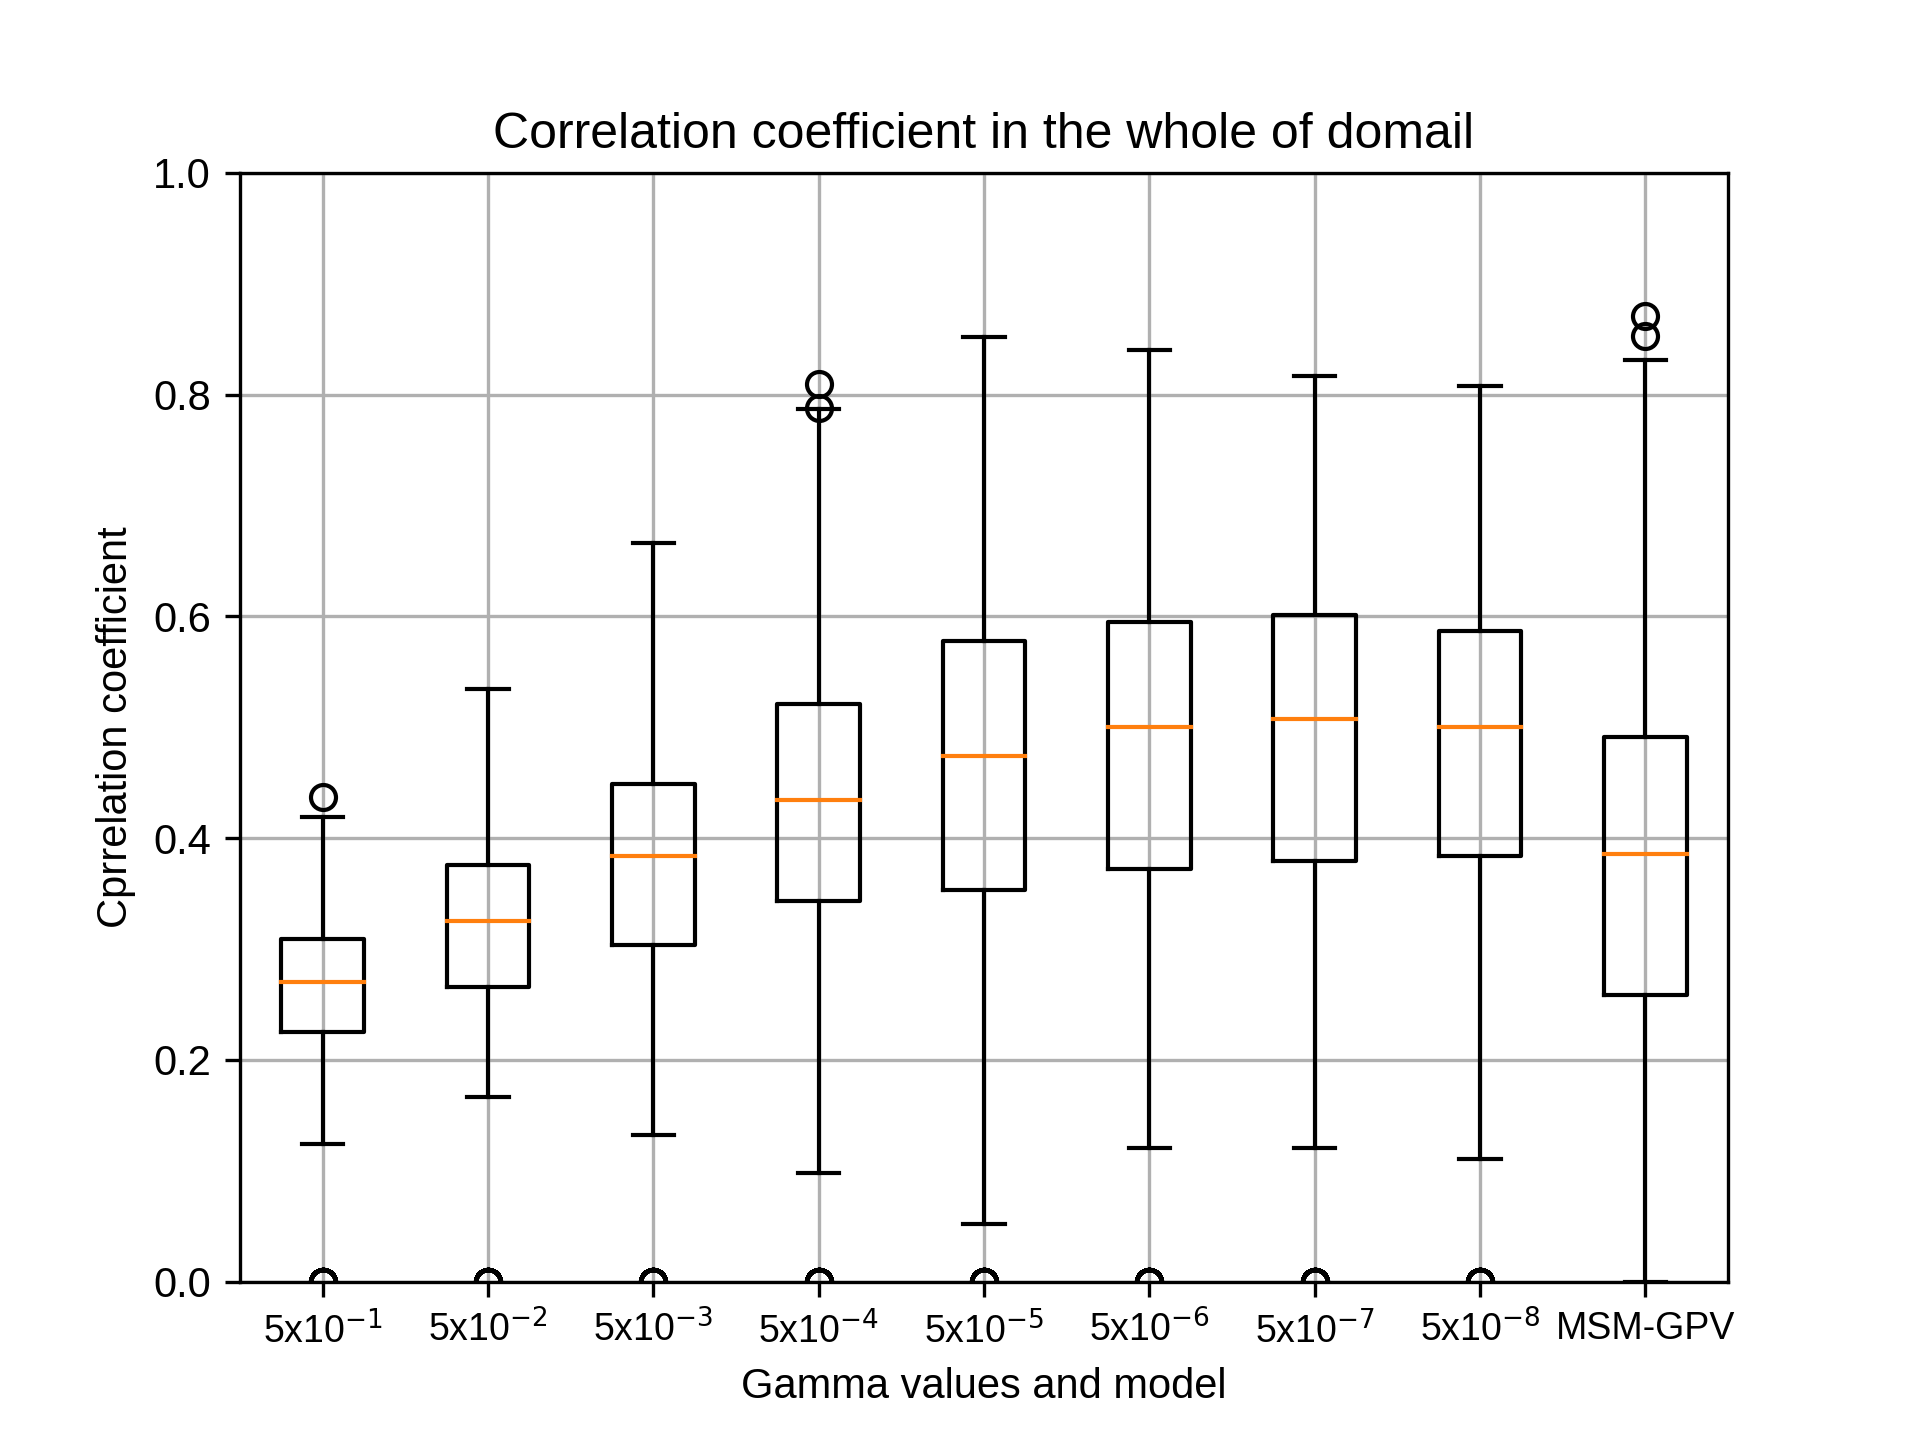
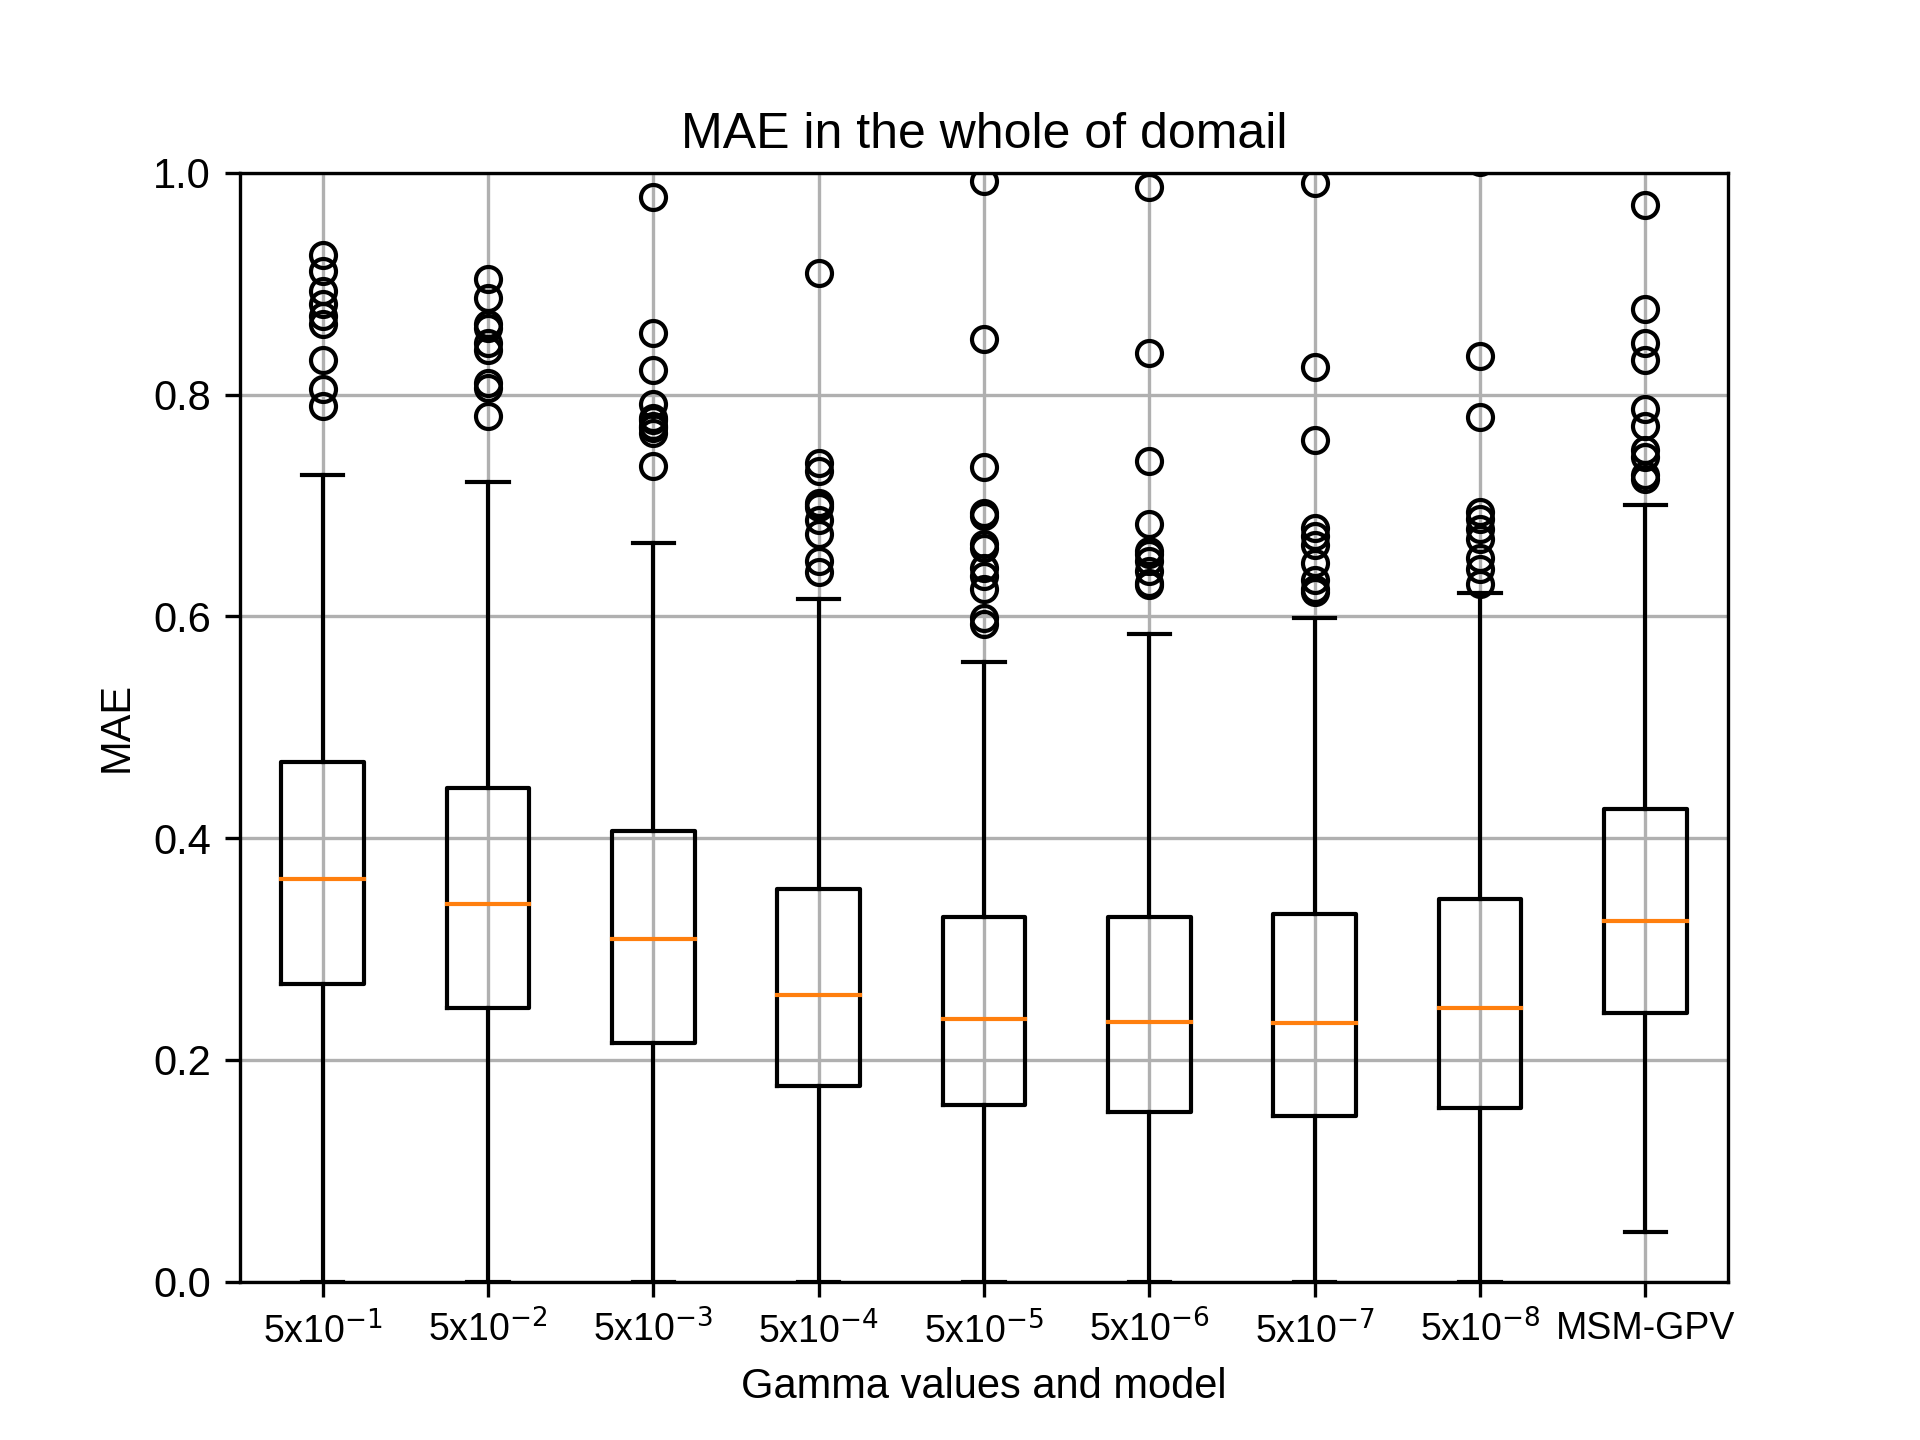

4月のsiteD,rg2=6の結果です。
kobayashi_yusukeThursday, October 22nd, 2020 at 4:25:55 PM GMT+09:00

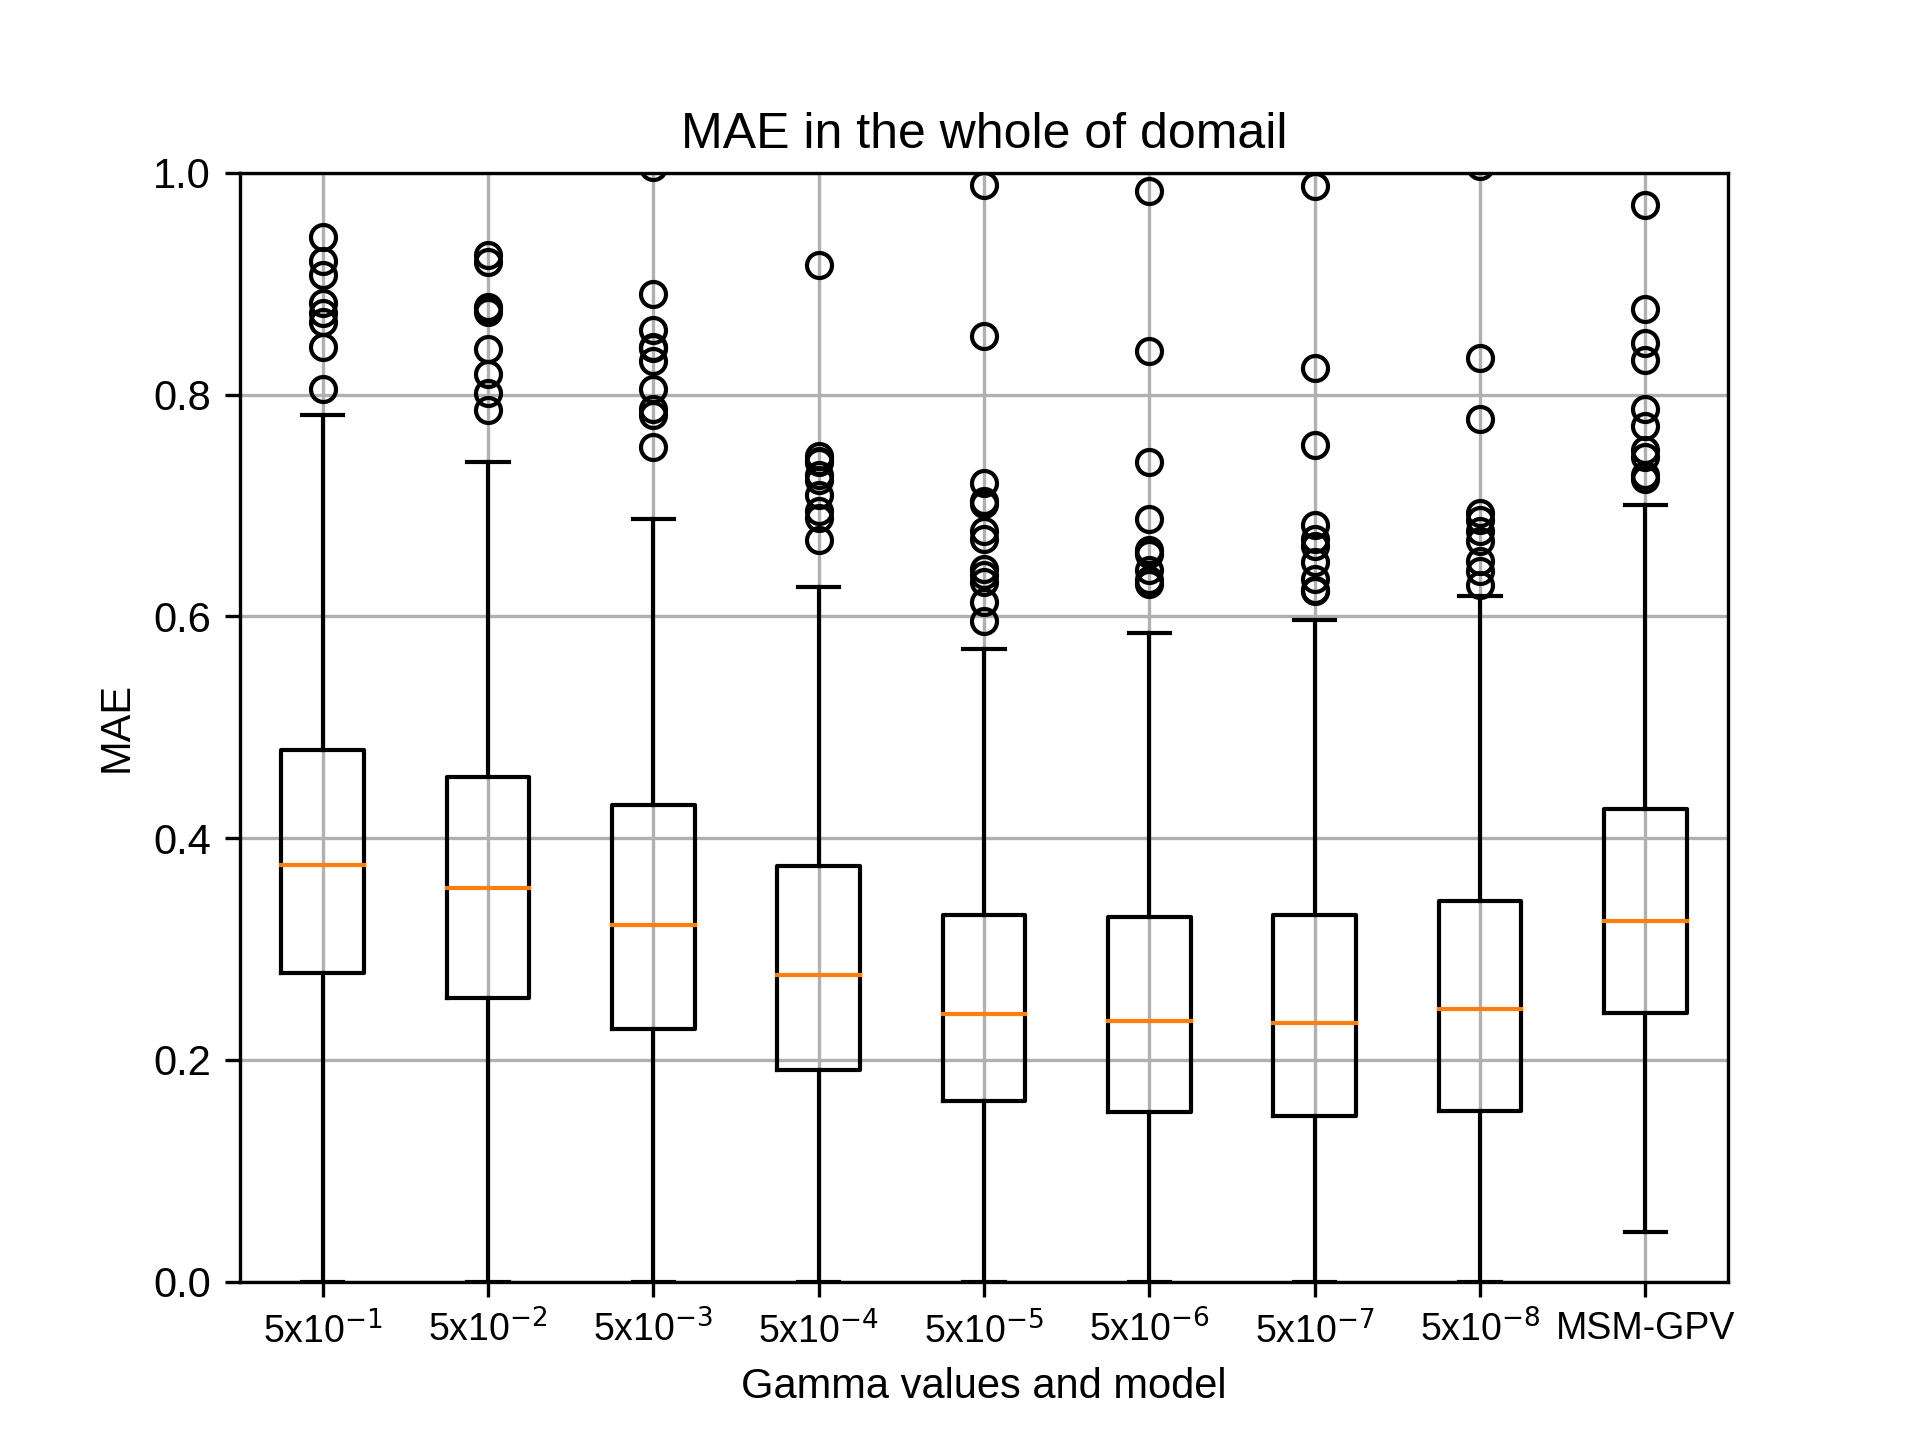
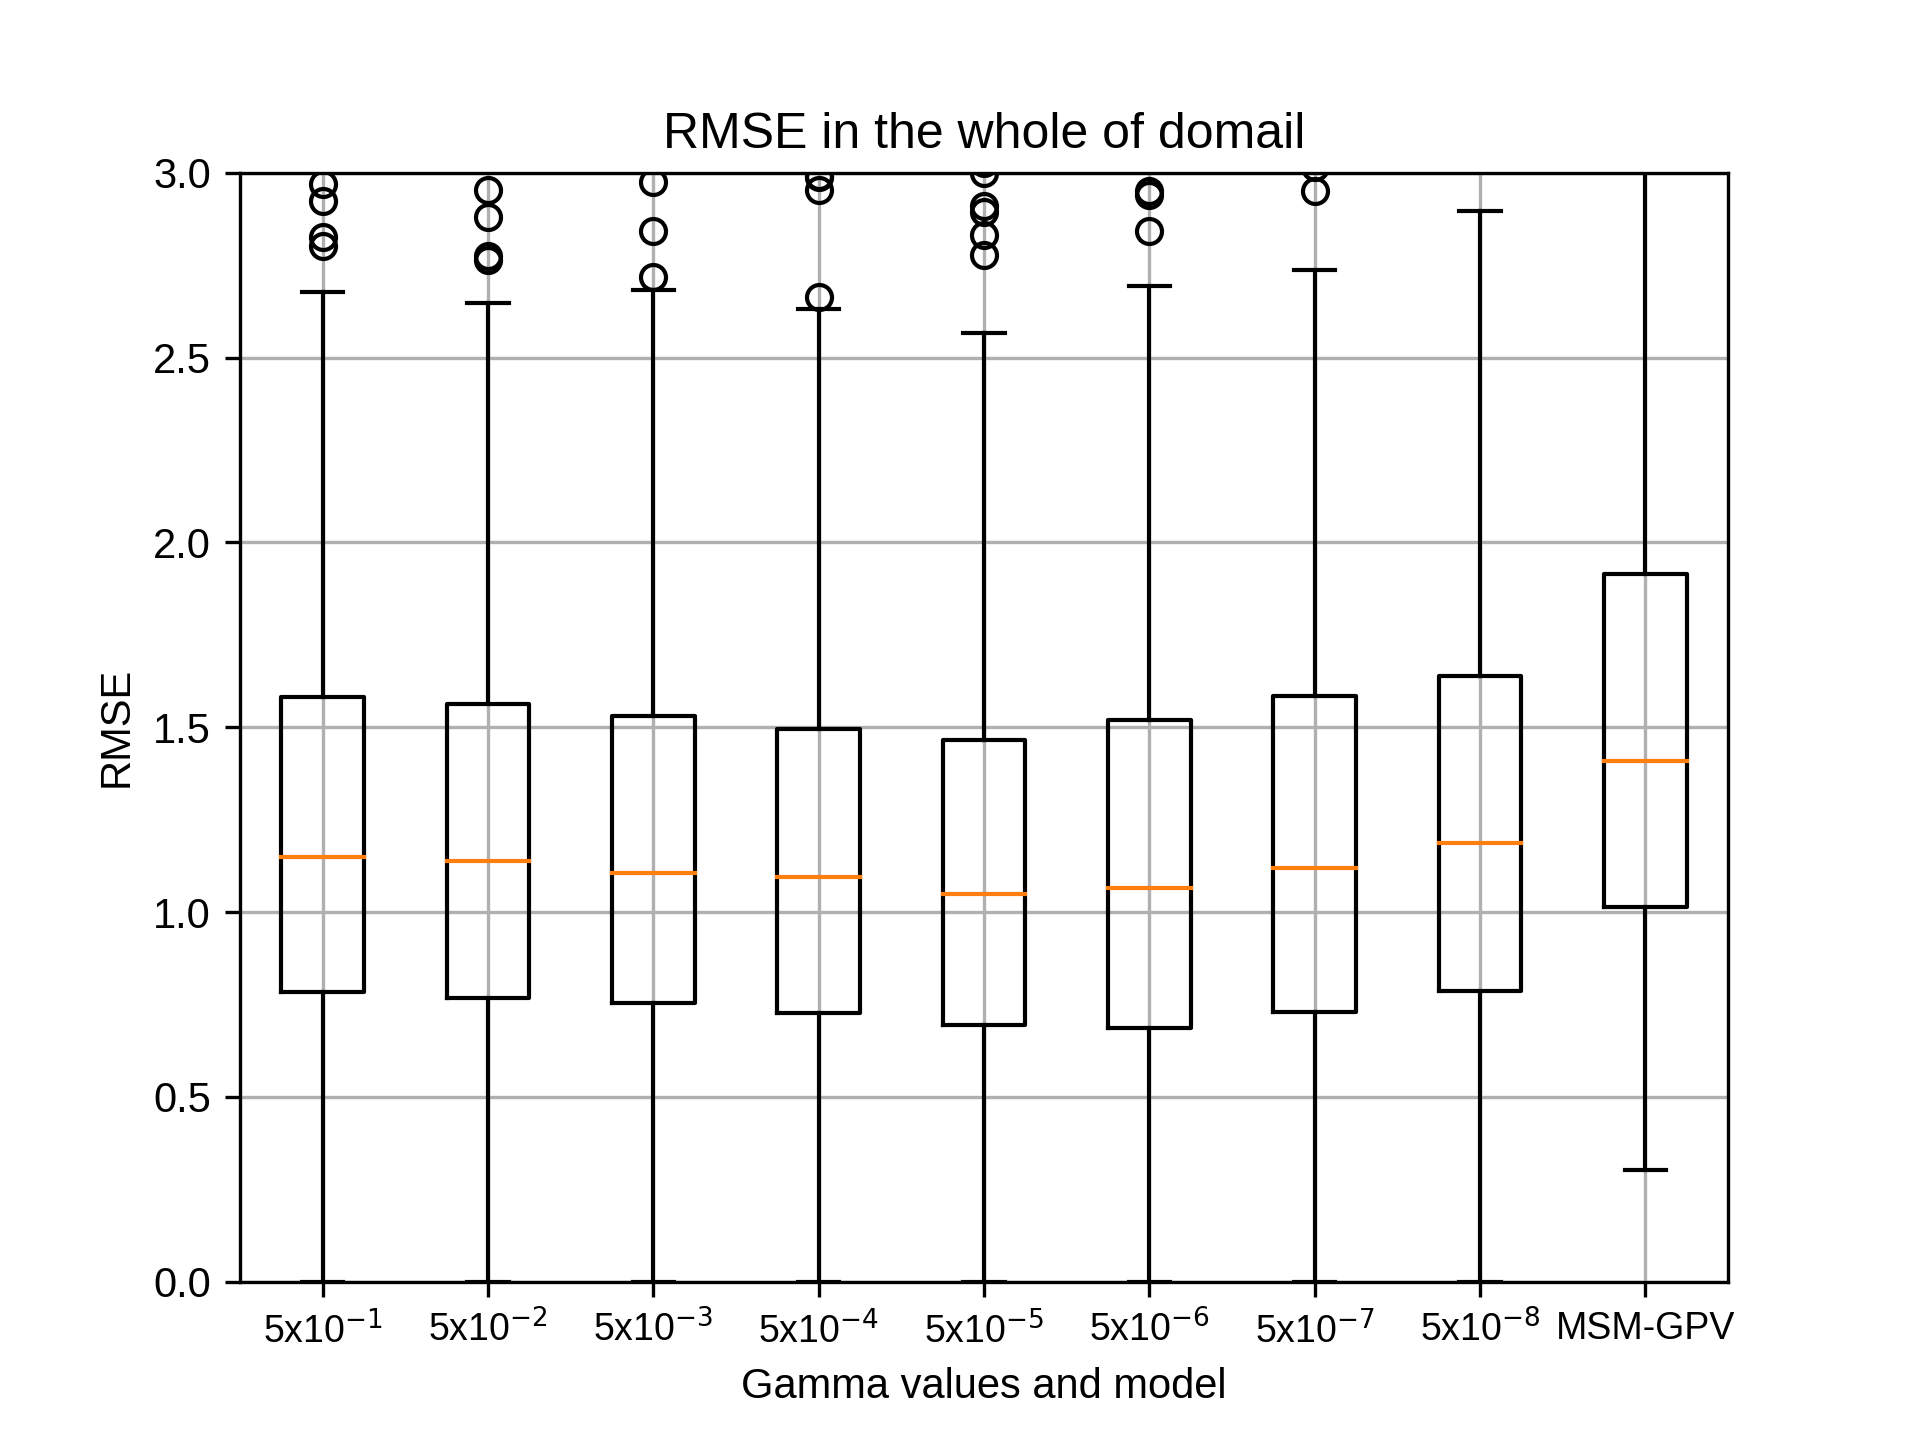
4月のsiteD,rg2=8の結果です。
kobayashi_yusukeThursday, October 22nd, 2020 at 4:26:22 PM GMT+09:00
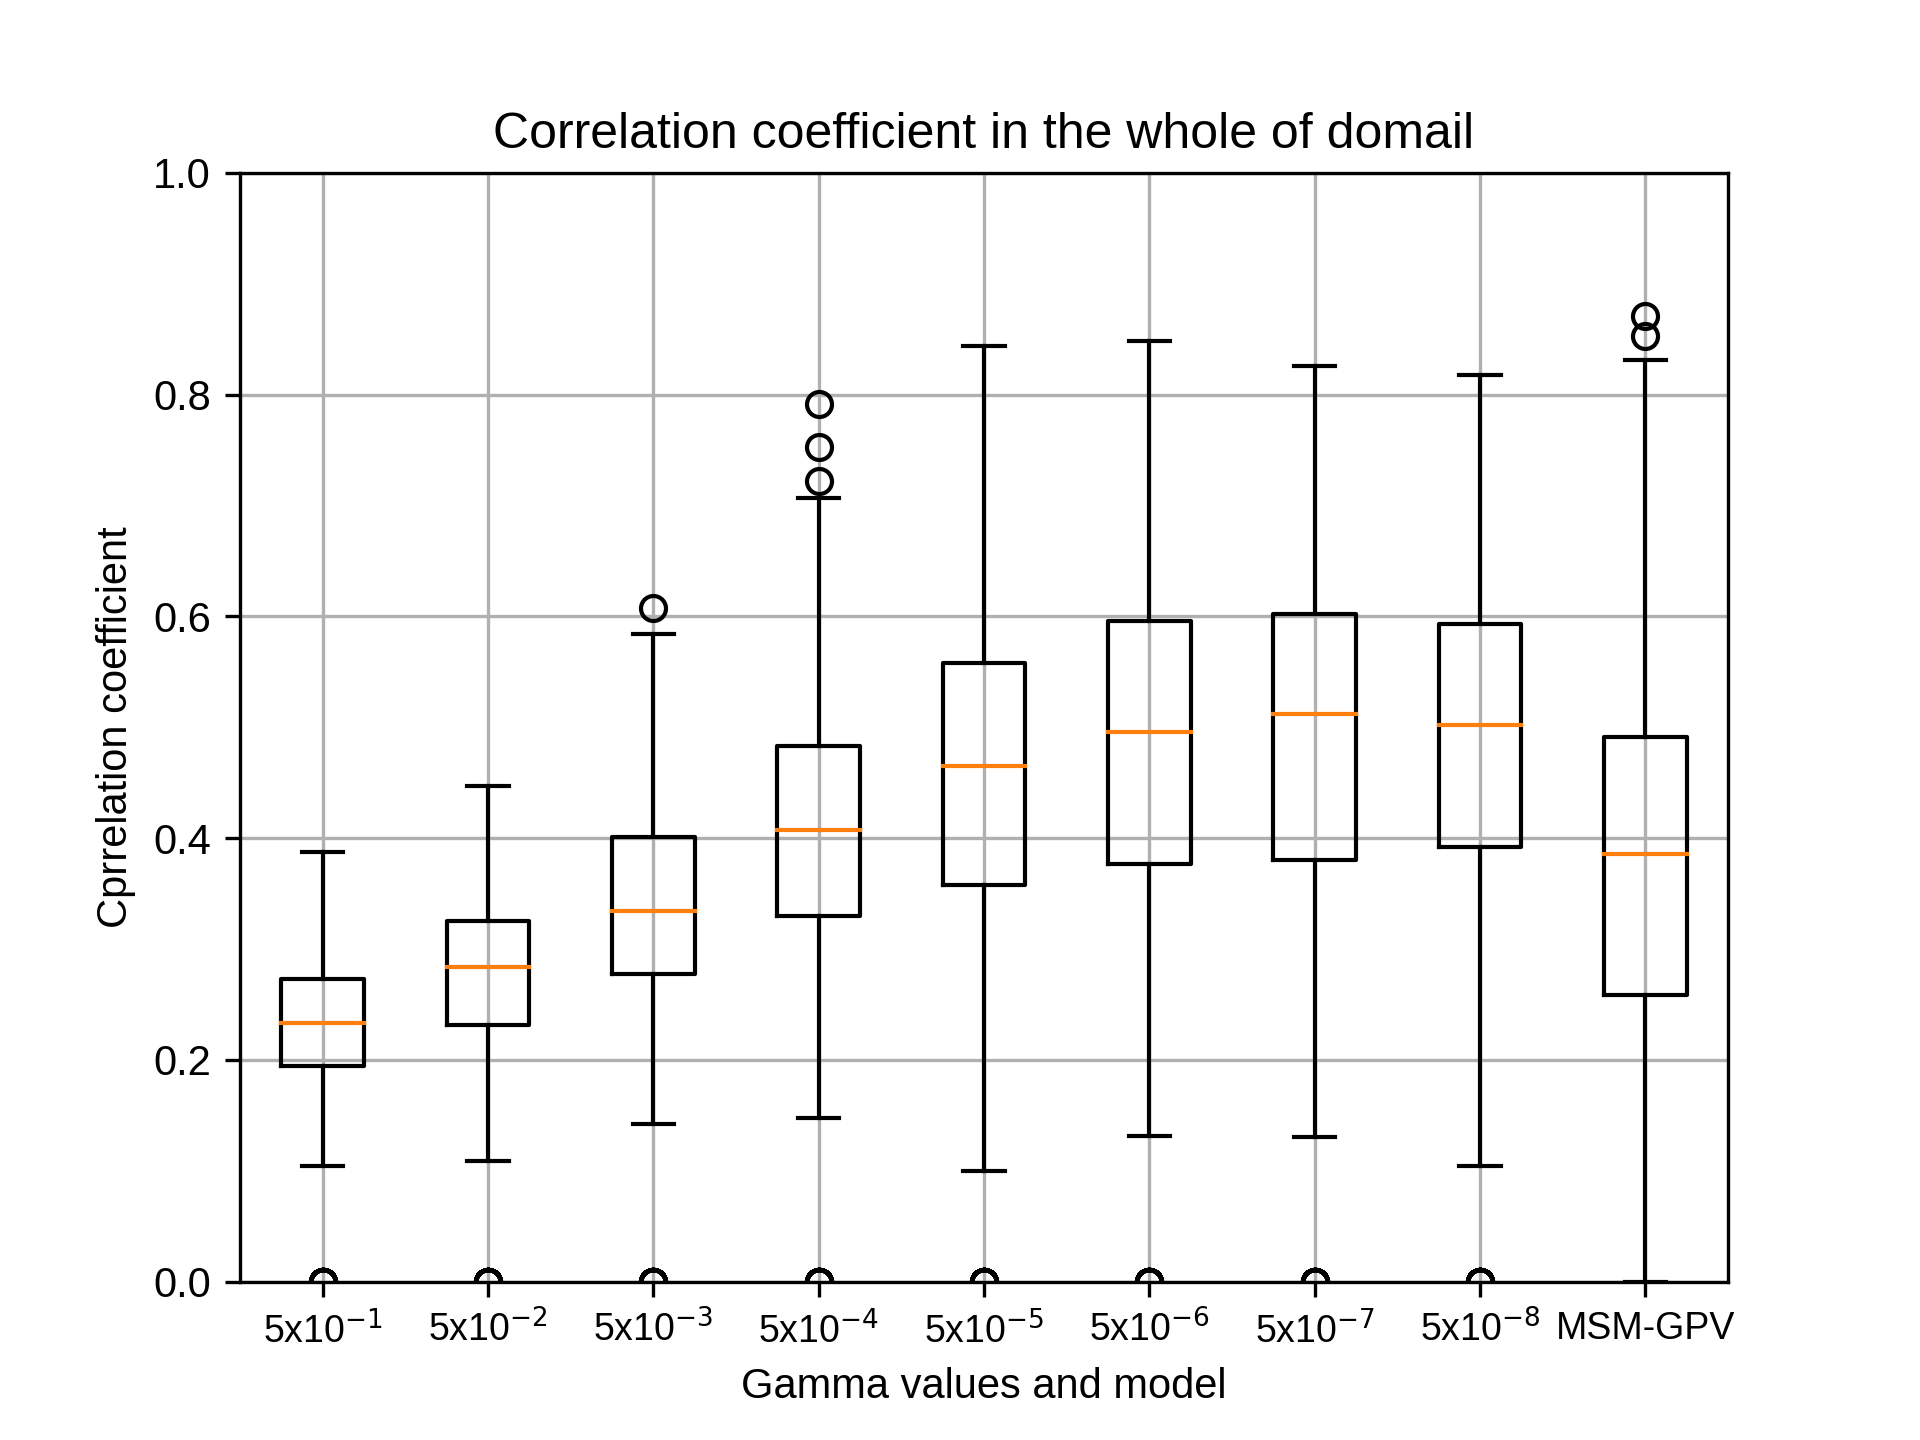
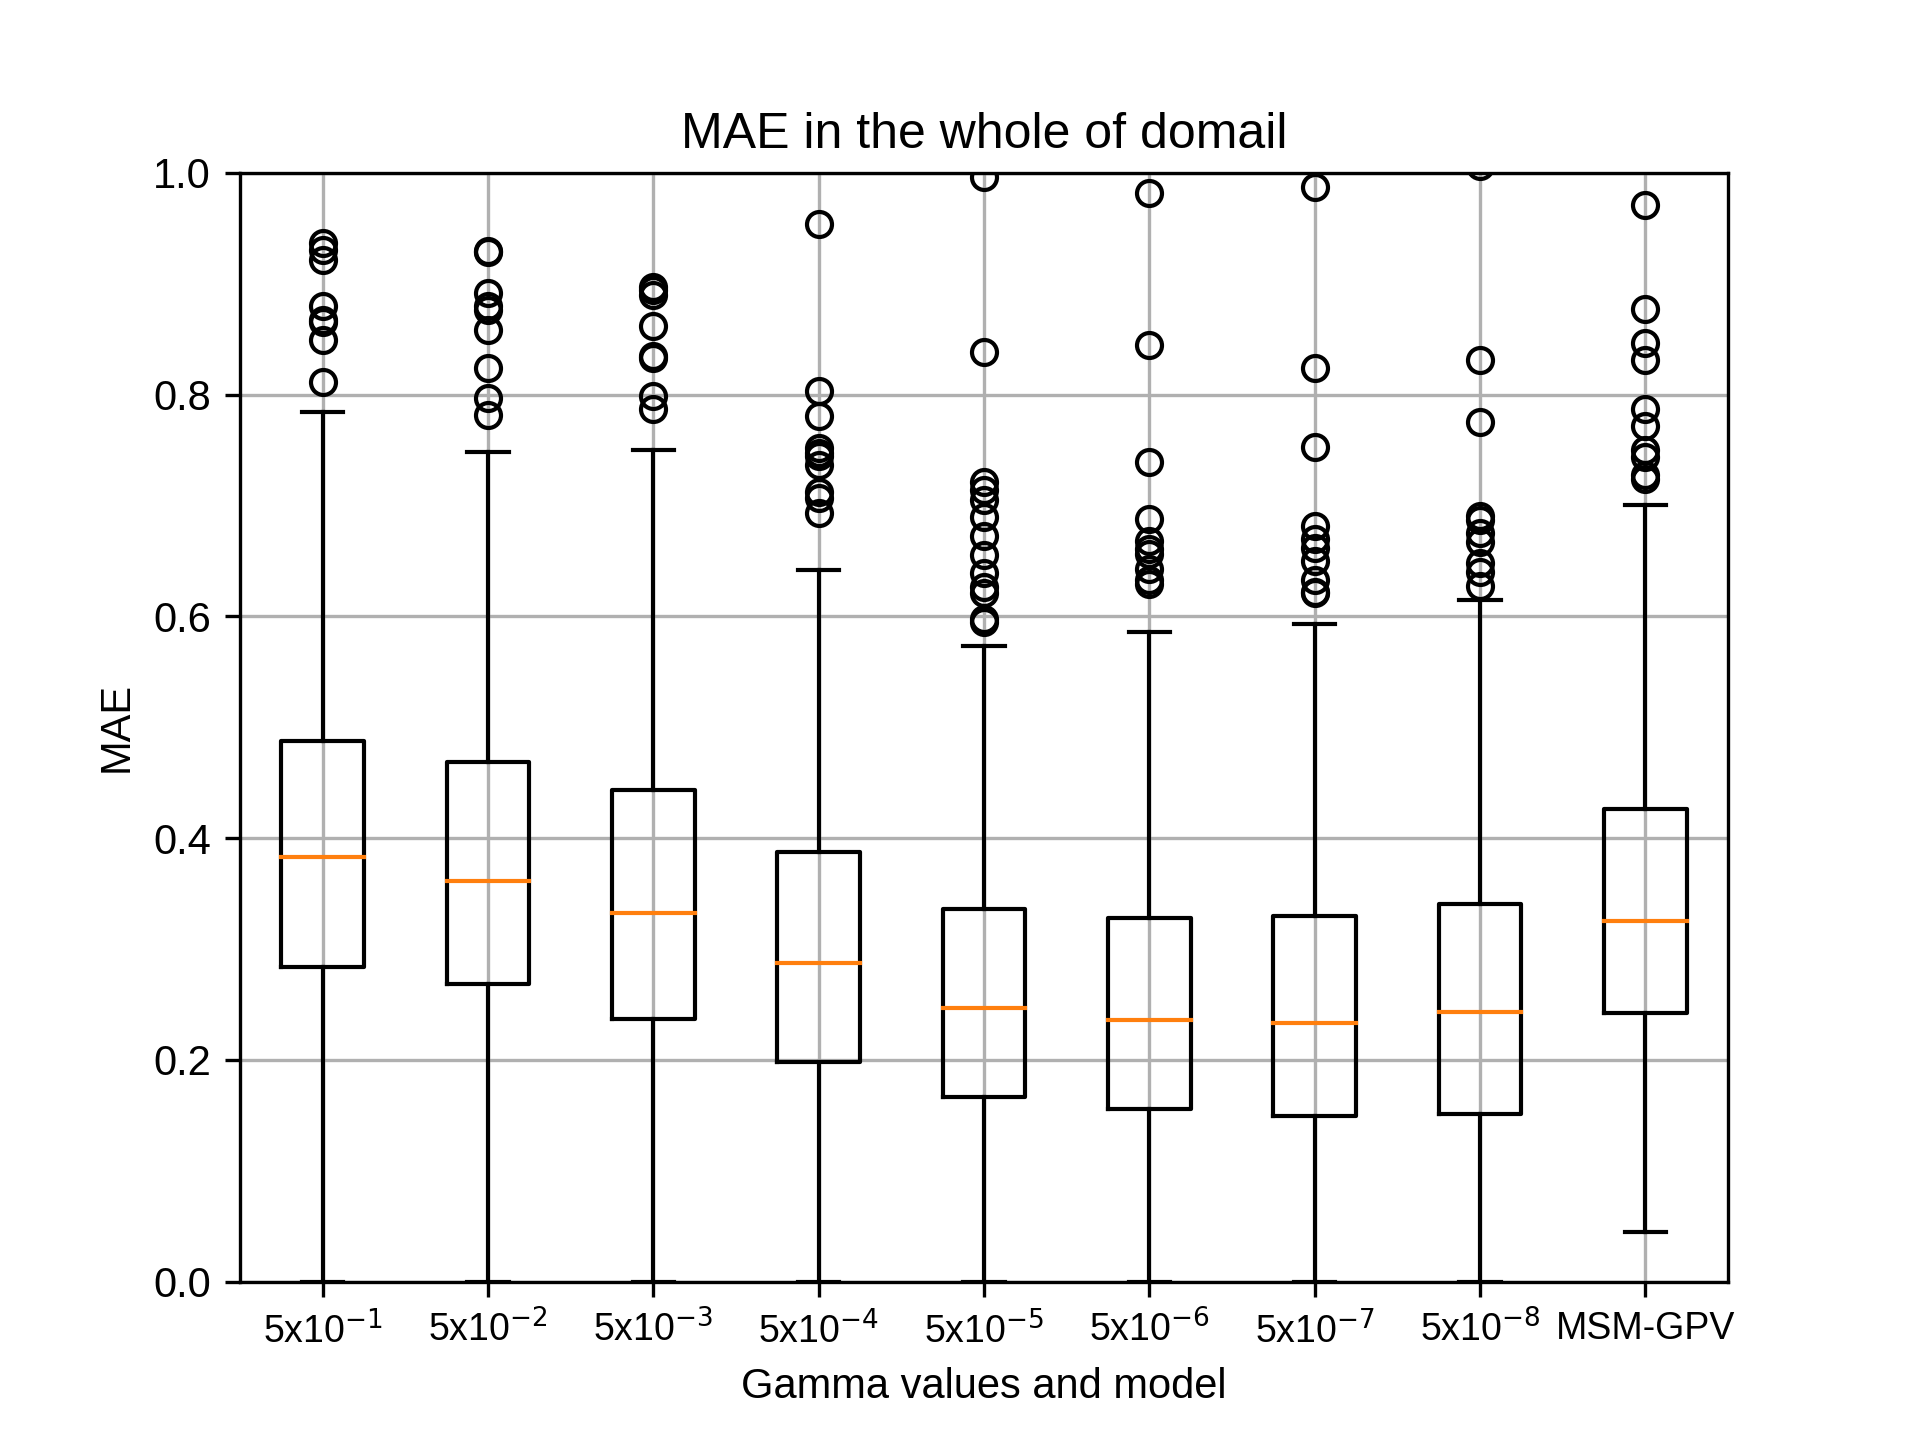
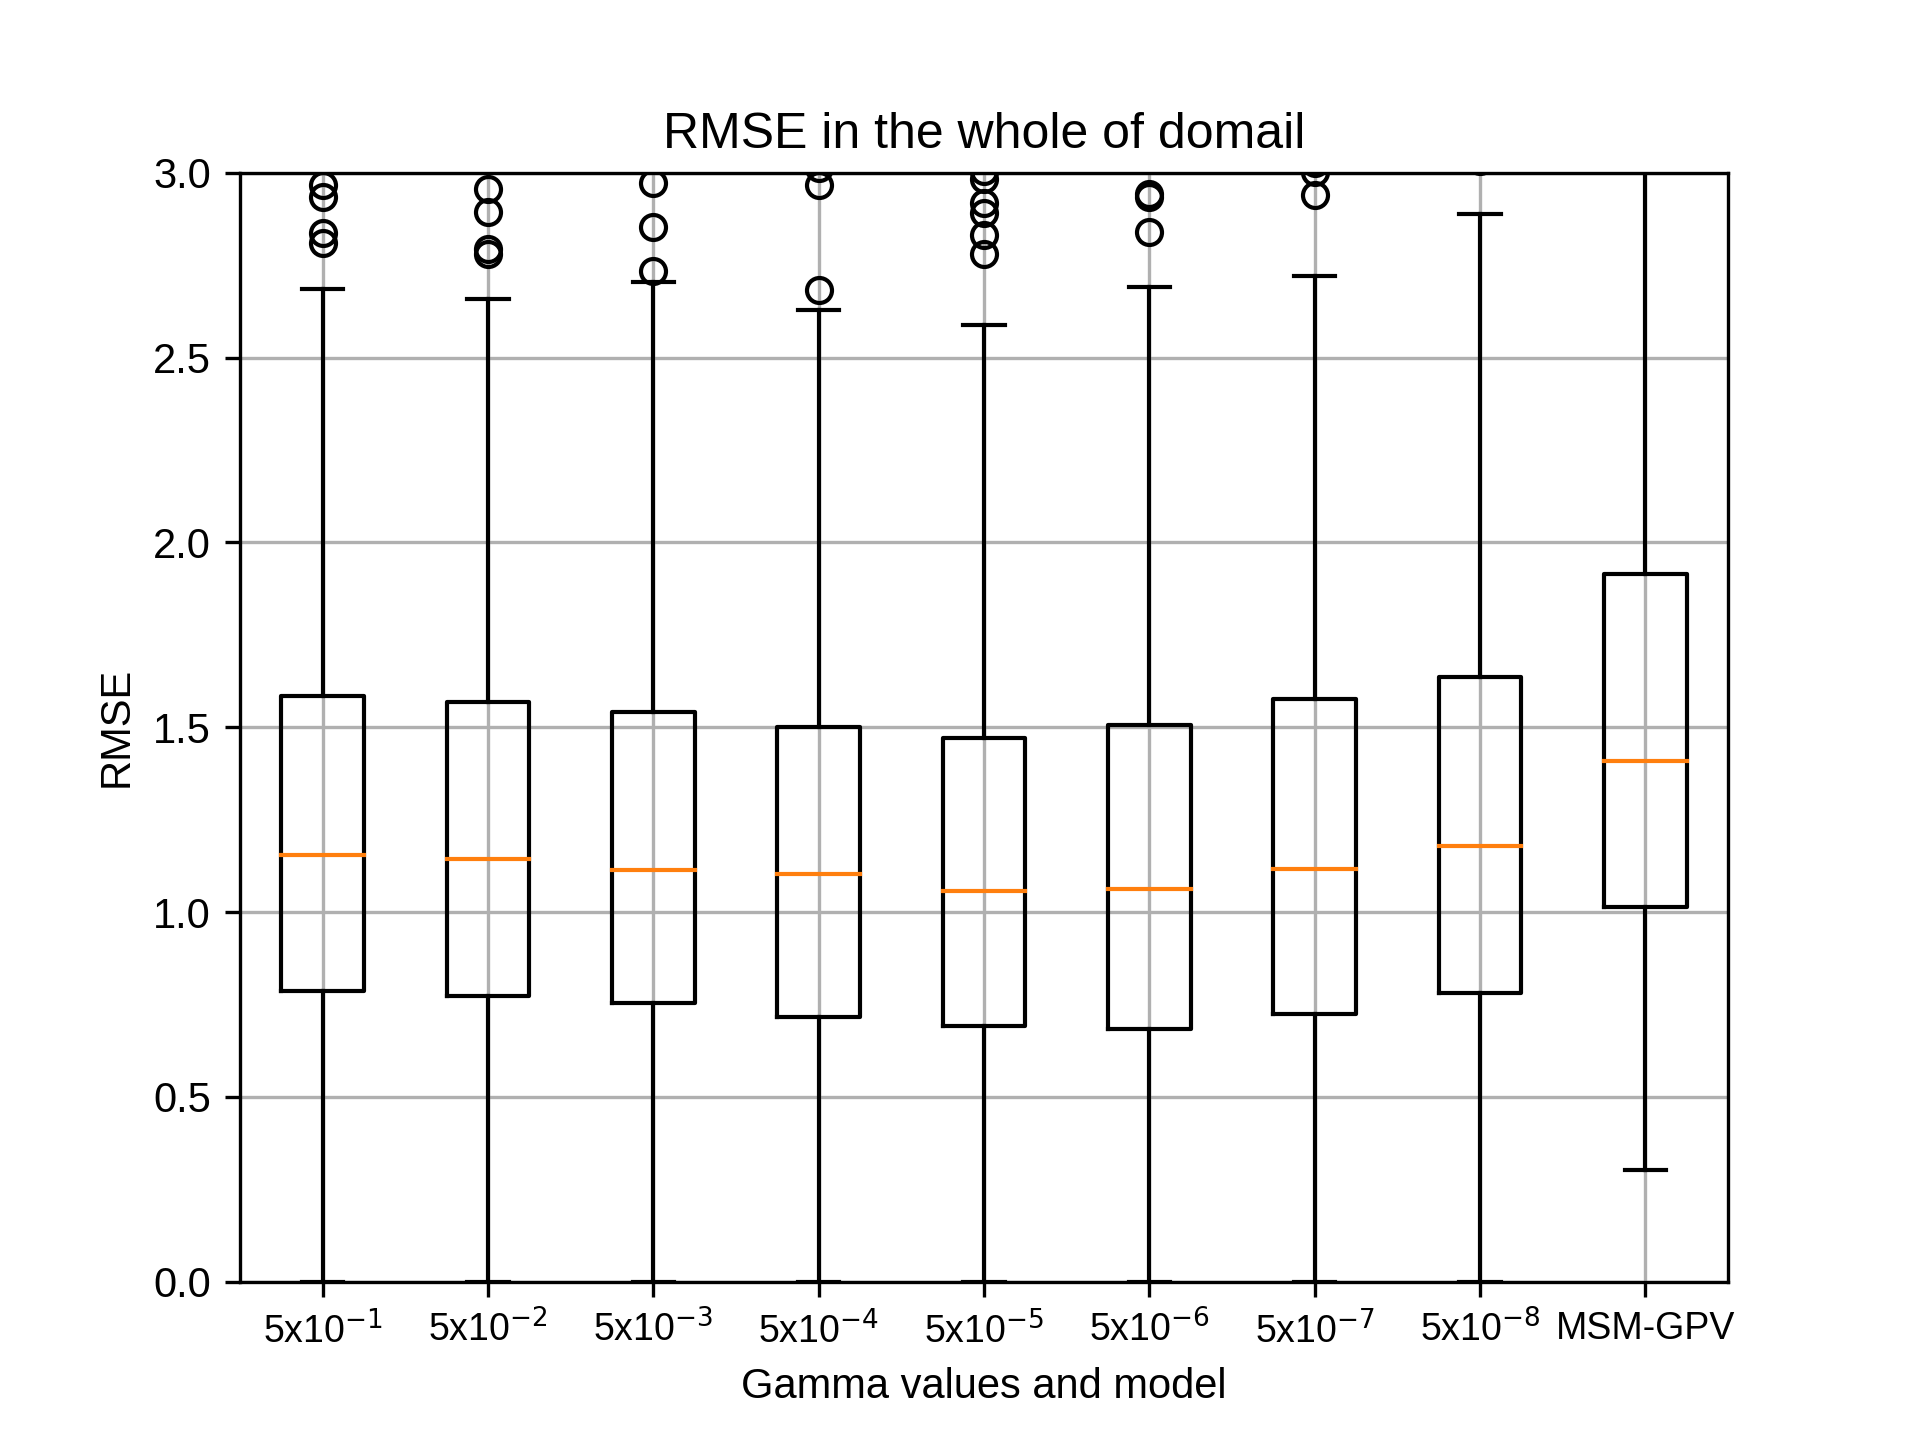
4月のsiteD,rg2=10の結果です。
kobayashi_yusukeThursday, October 22nd, 2020 at 4:26:40 PM GMT+09:00
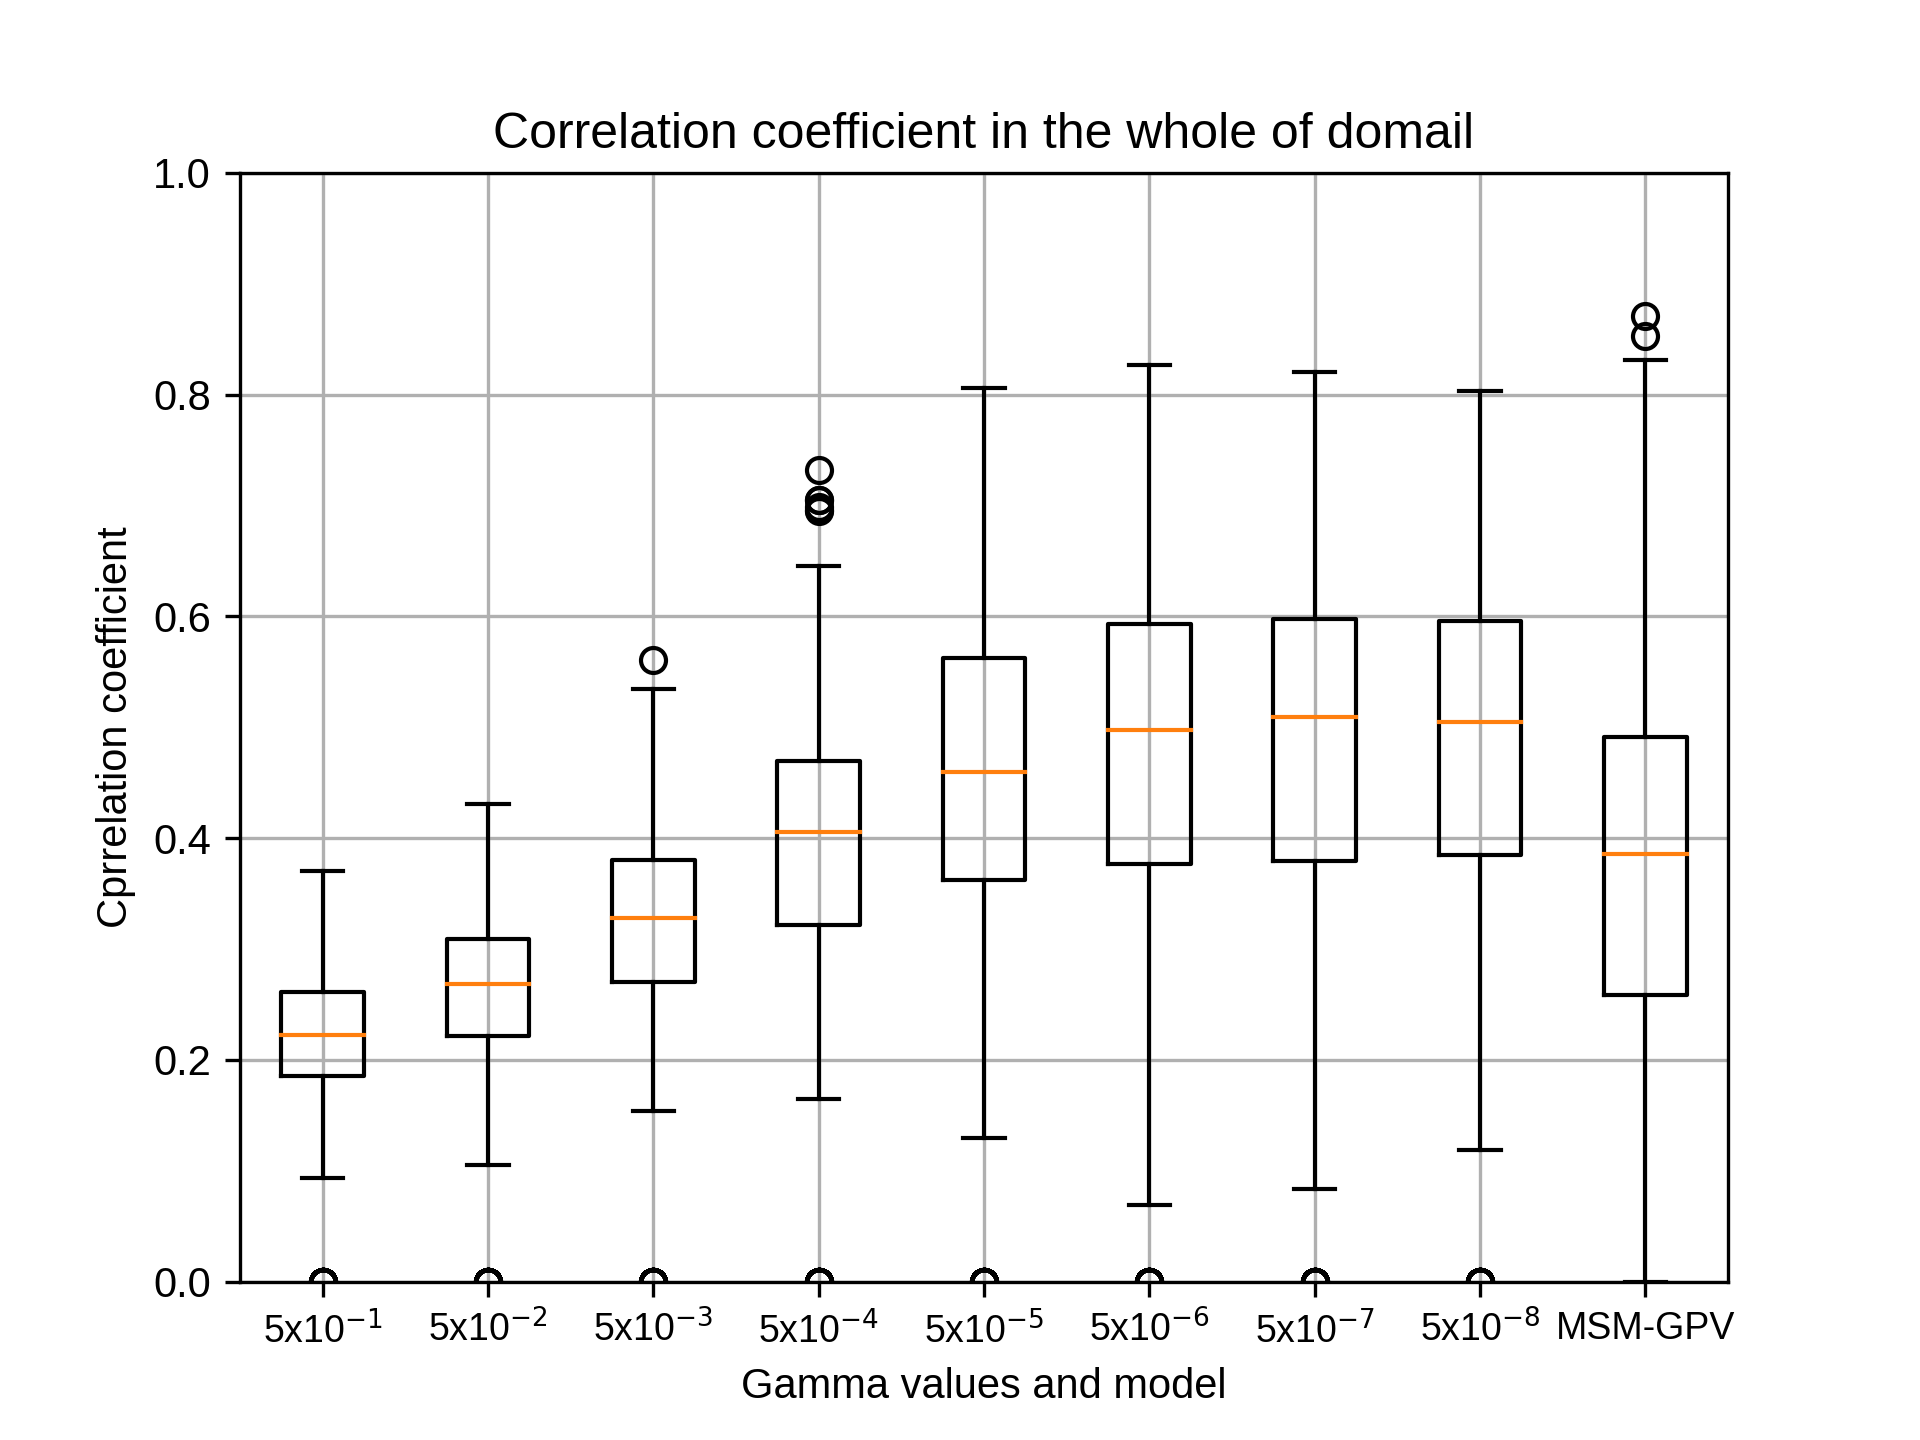
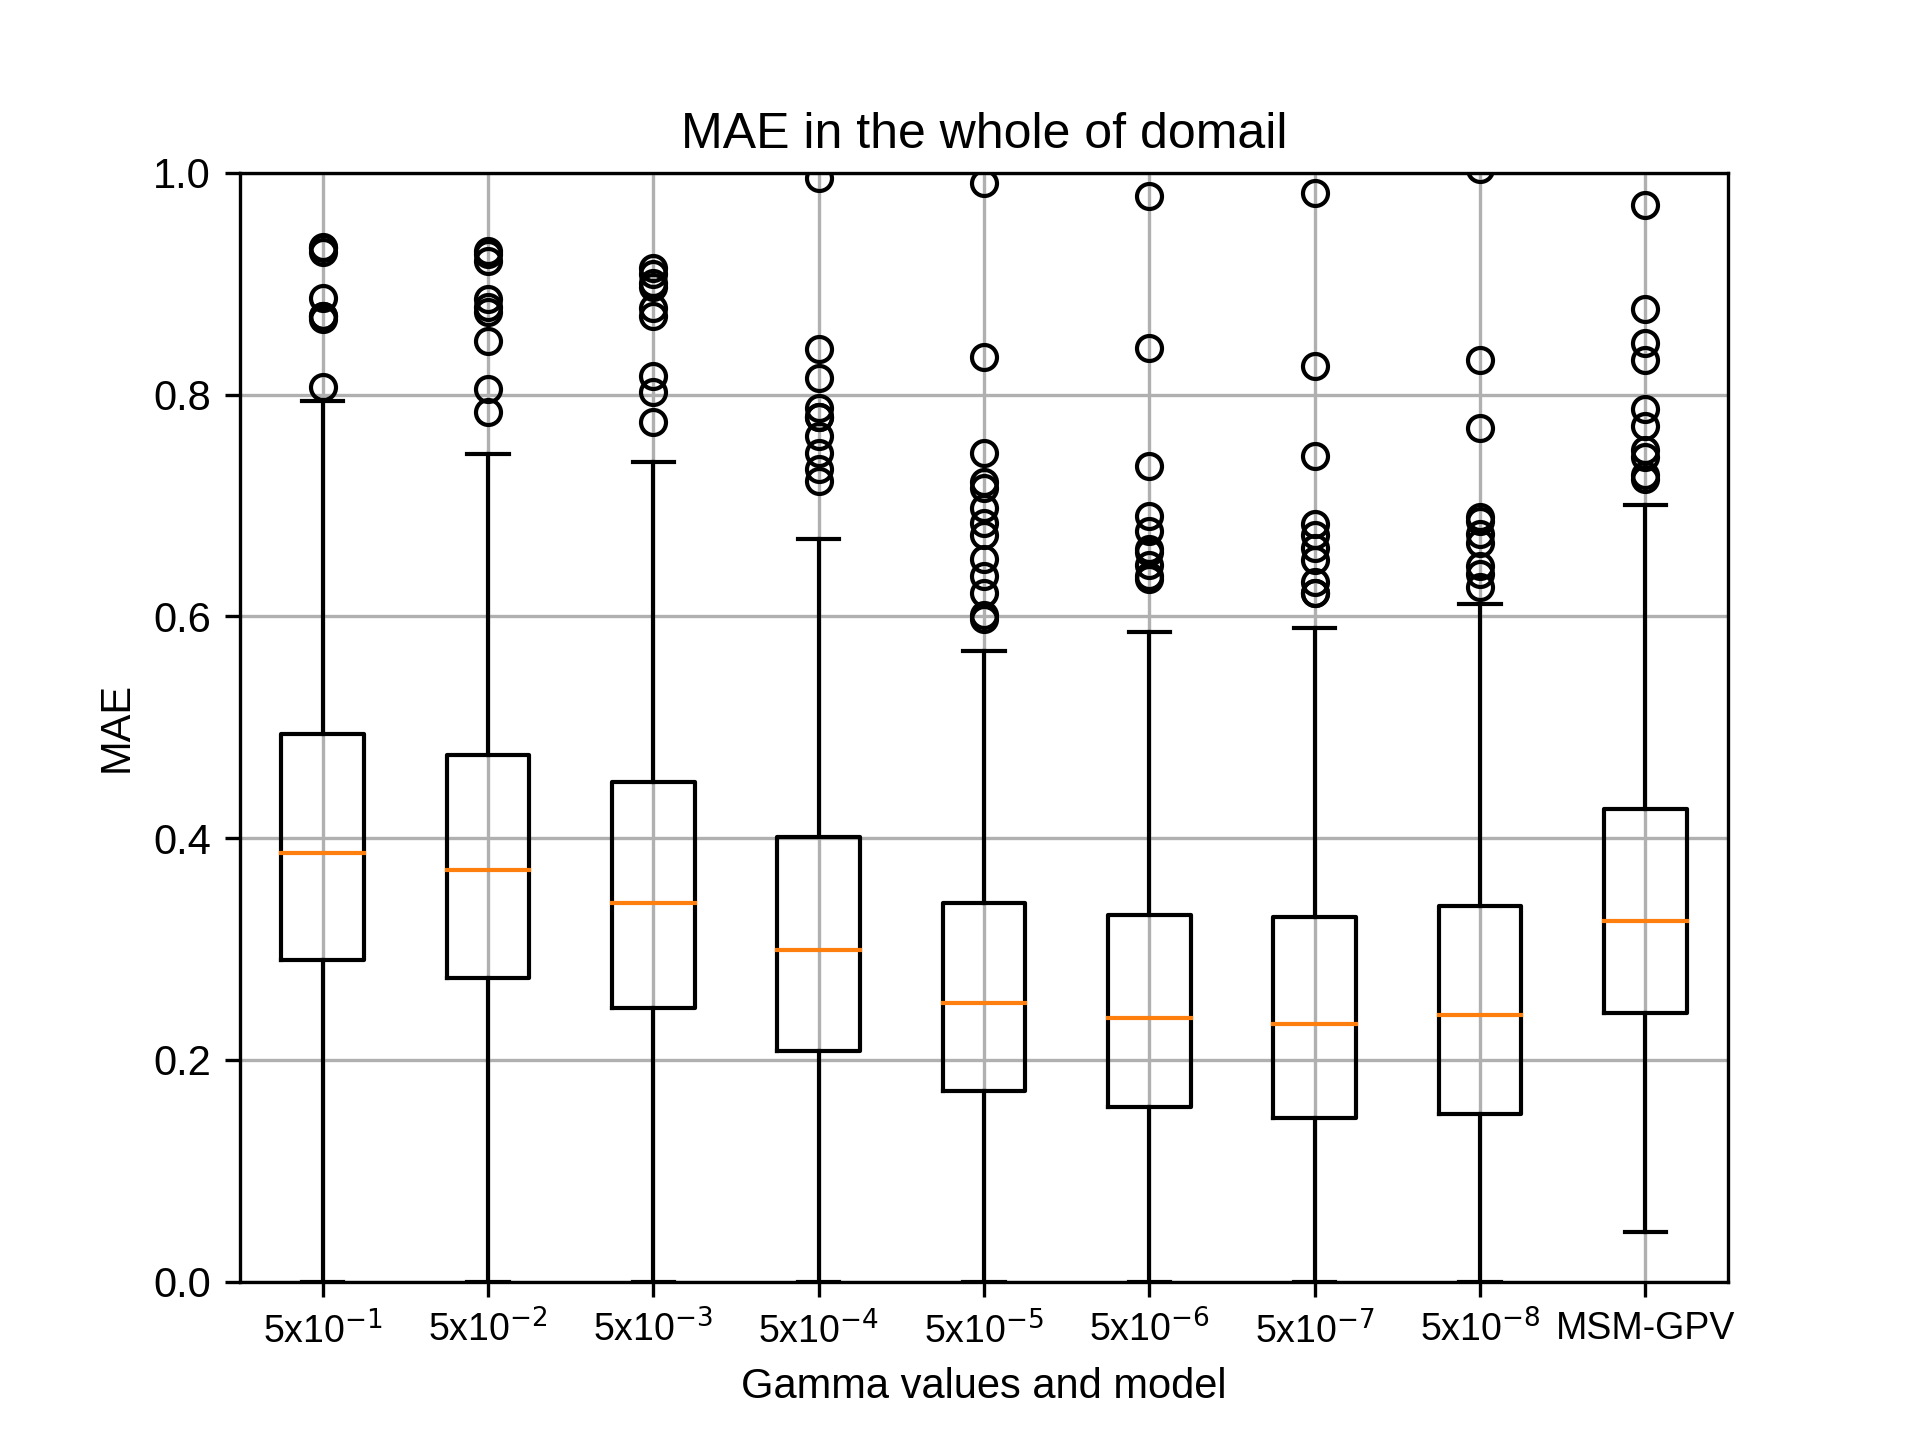
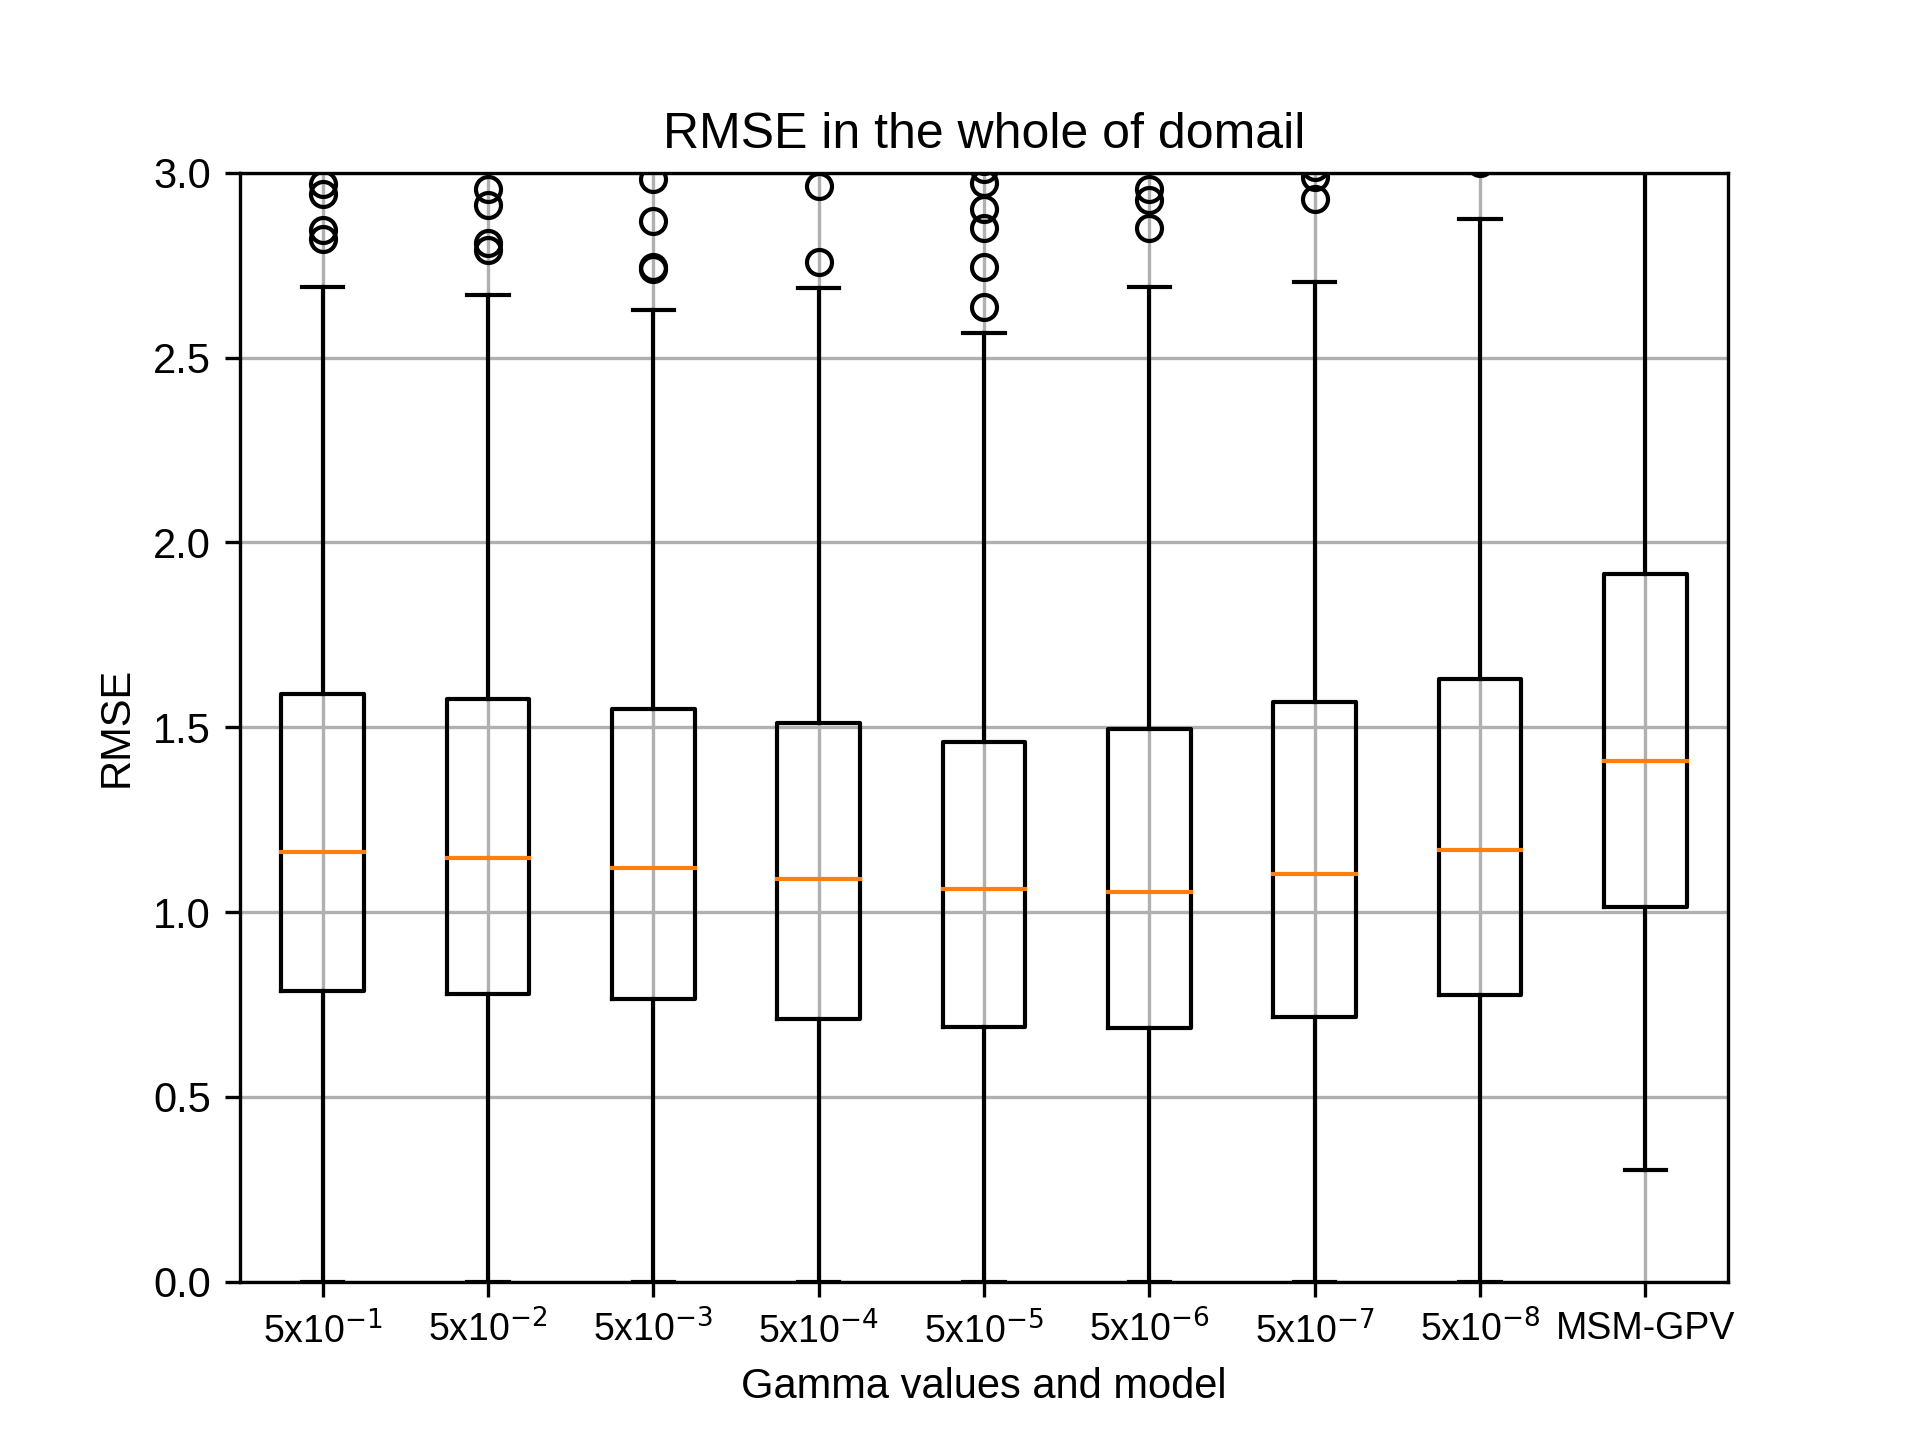
4月のsiteD,rg2=12の結果です。
4月のsiteDではrg2=10でgammaが5x10⁻⁷のとき、相関係数の中央値が最も高くなりました。
4月のsiteDではrg2=10でgammaが5x10⁻⁷のとき、相関係数の中央値が最も高くなりました。
kobayashi_yusukeThursday, October 22nd, 2020 at 4:26:56 PM GMT+09:00

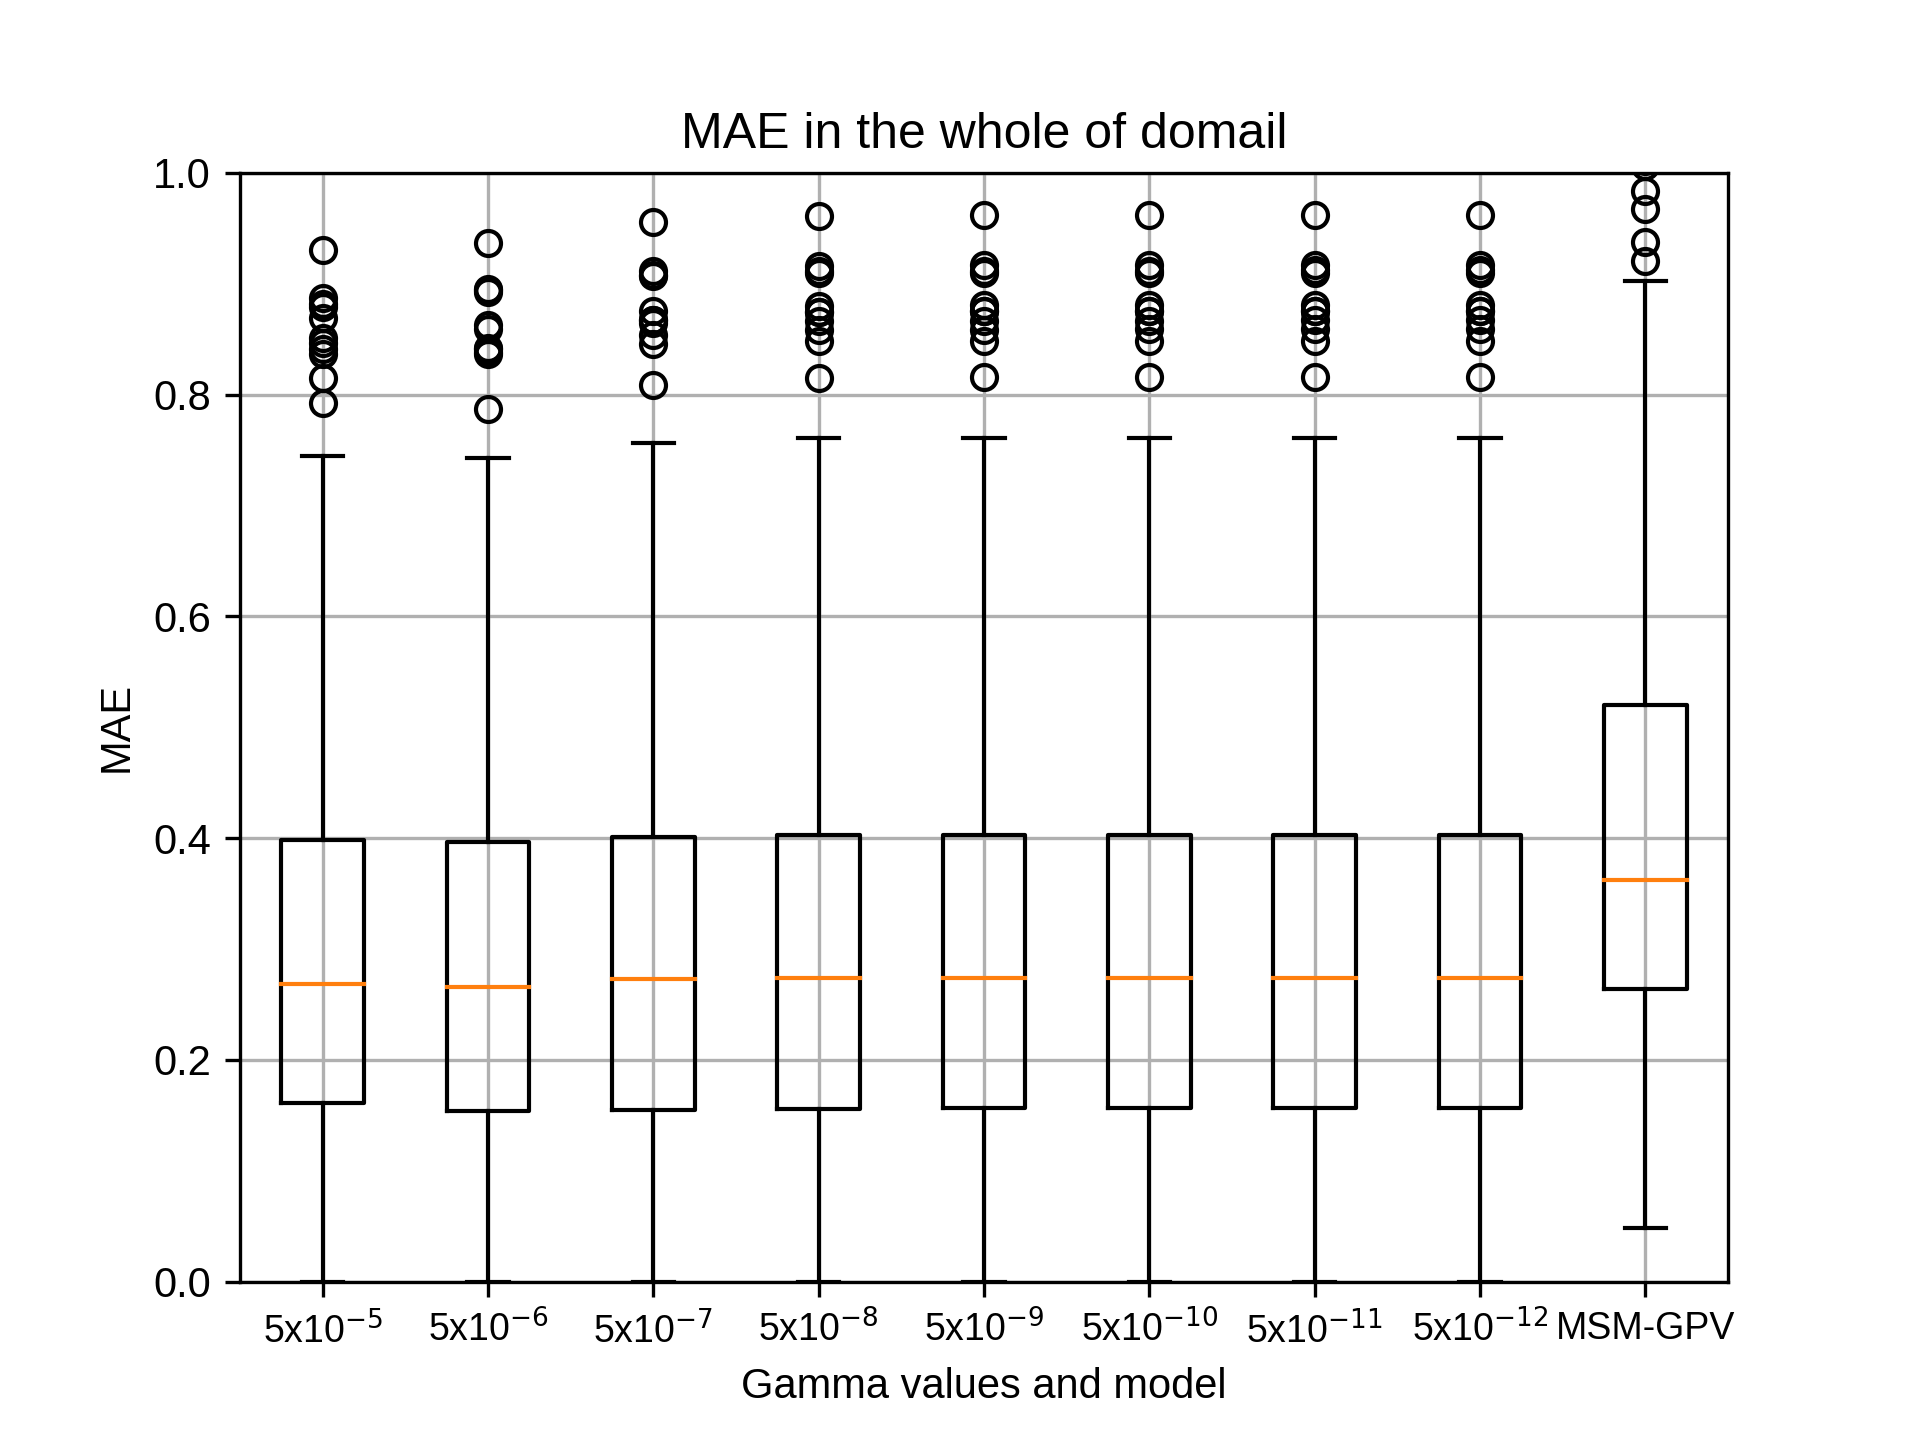
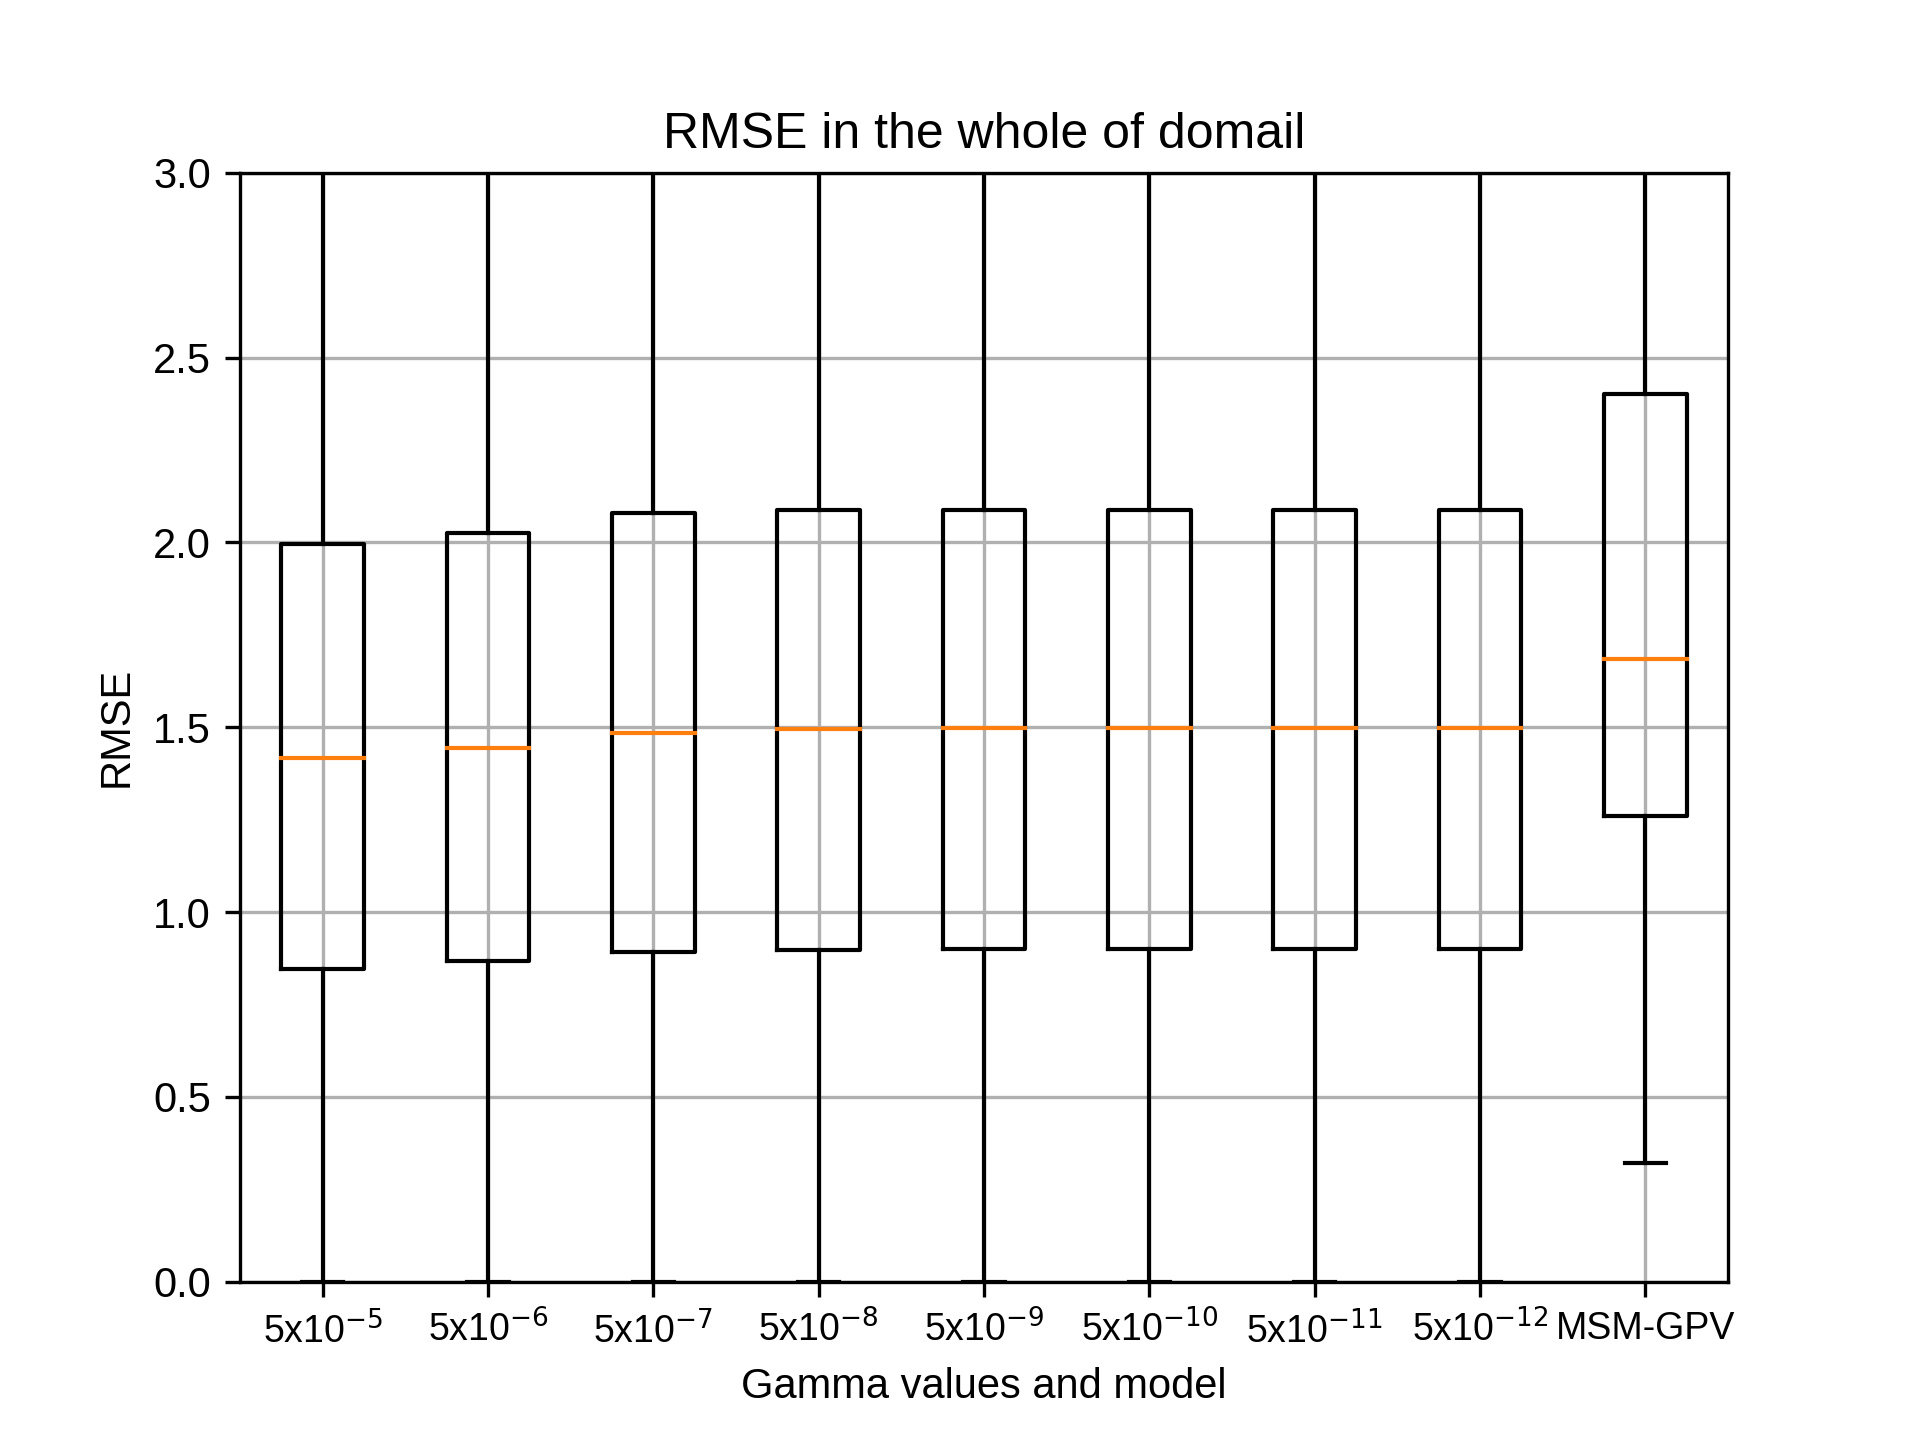
4月のsiteE,rg2=4の結果です。なお、ここからはgammaは5x10⁻⁵から5x10-12の範囲で行なっております。
kobayashi_yusukeThursday, October 22nd, 2020 at 4:27:10 PM GMT+09:00
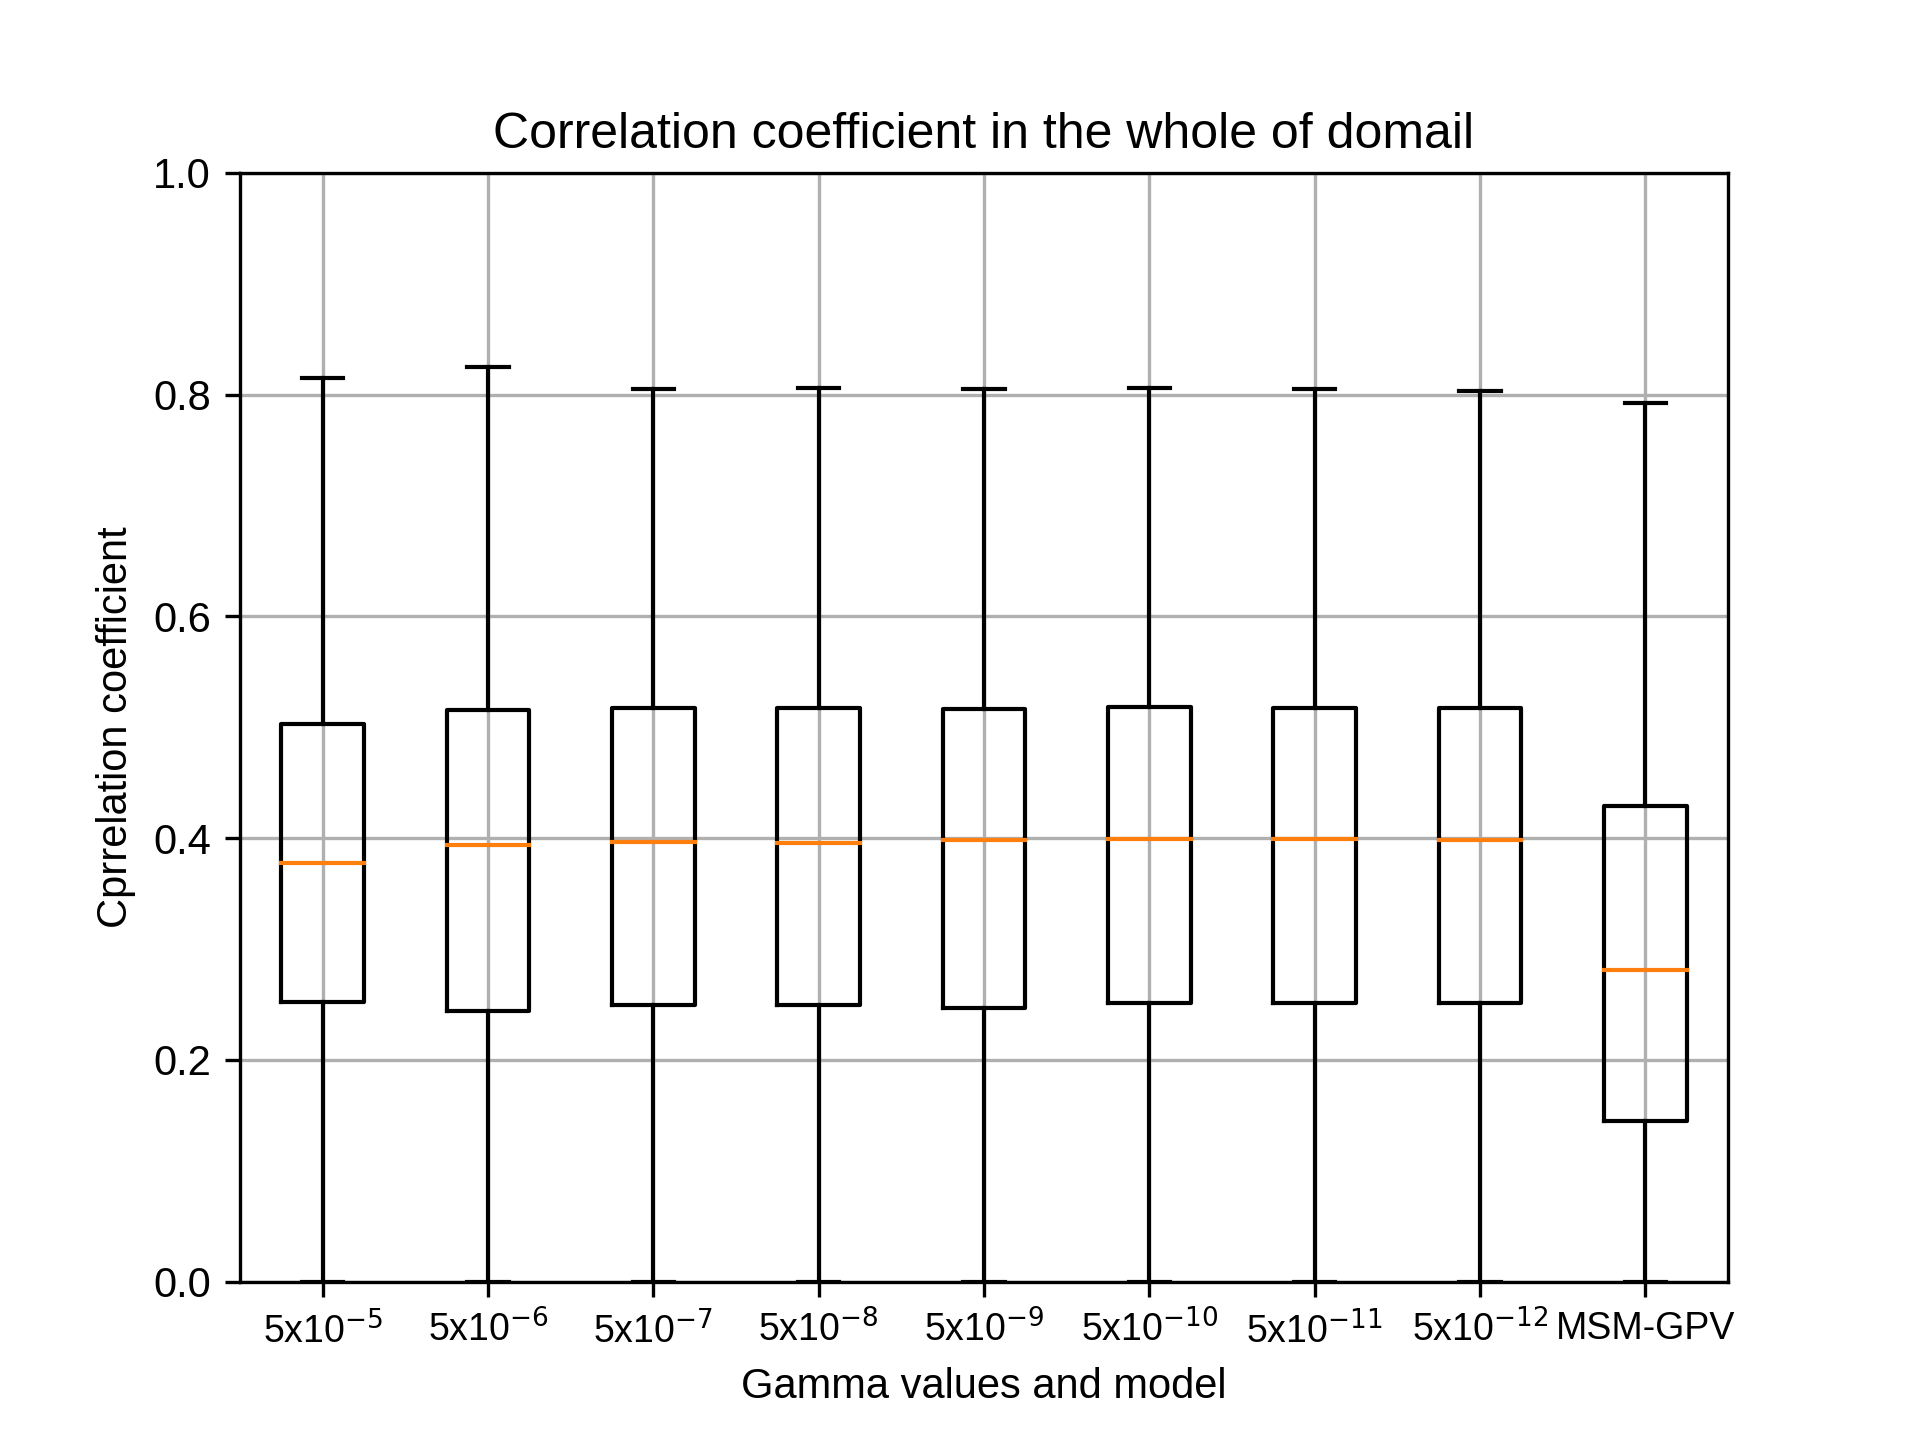
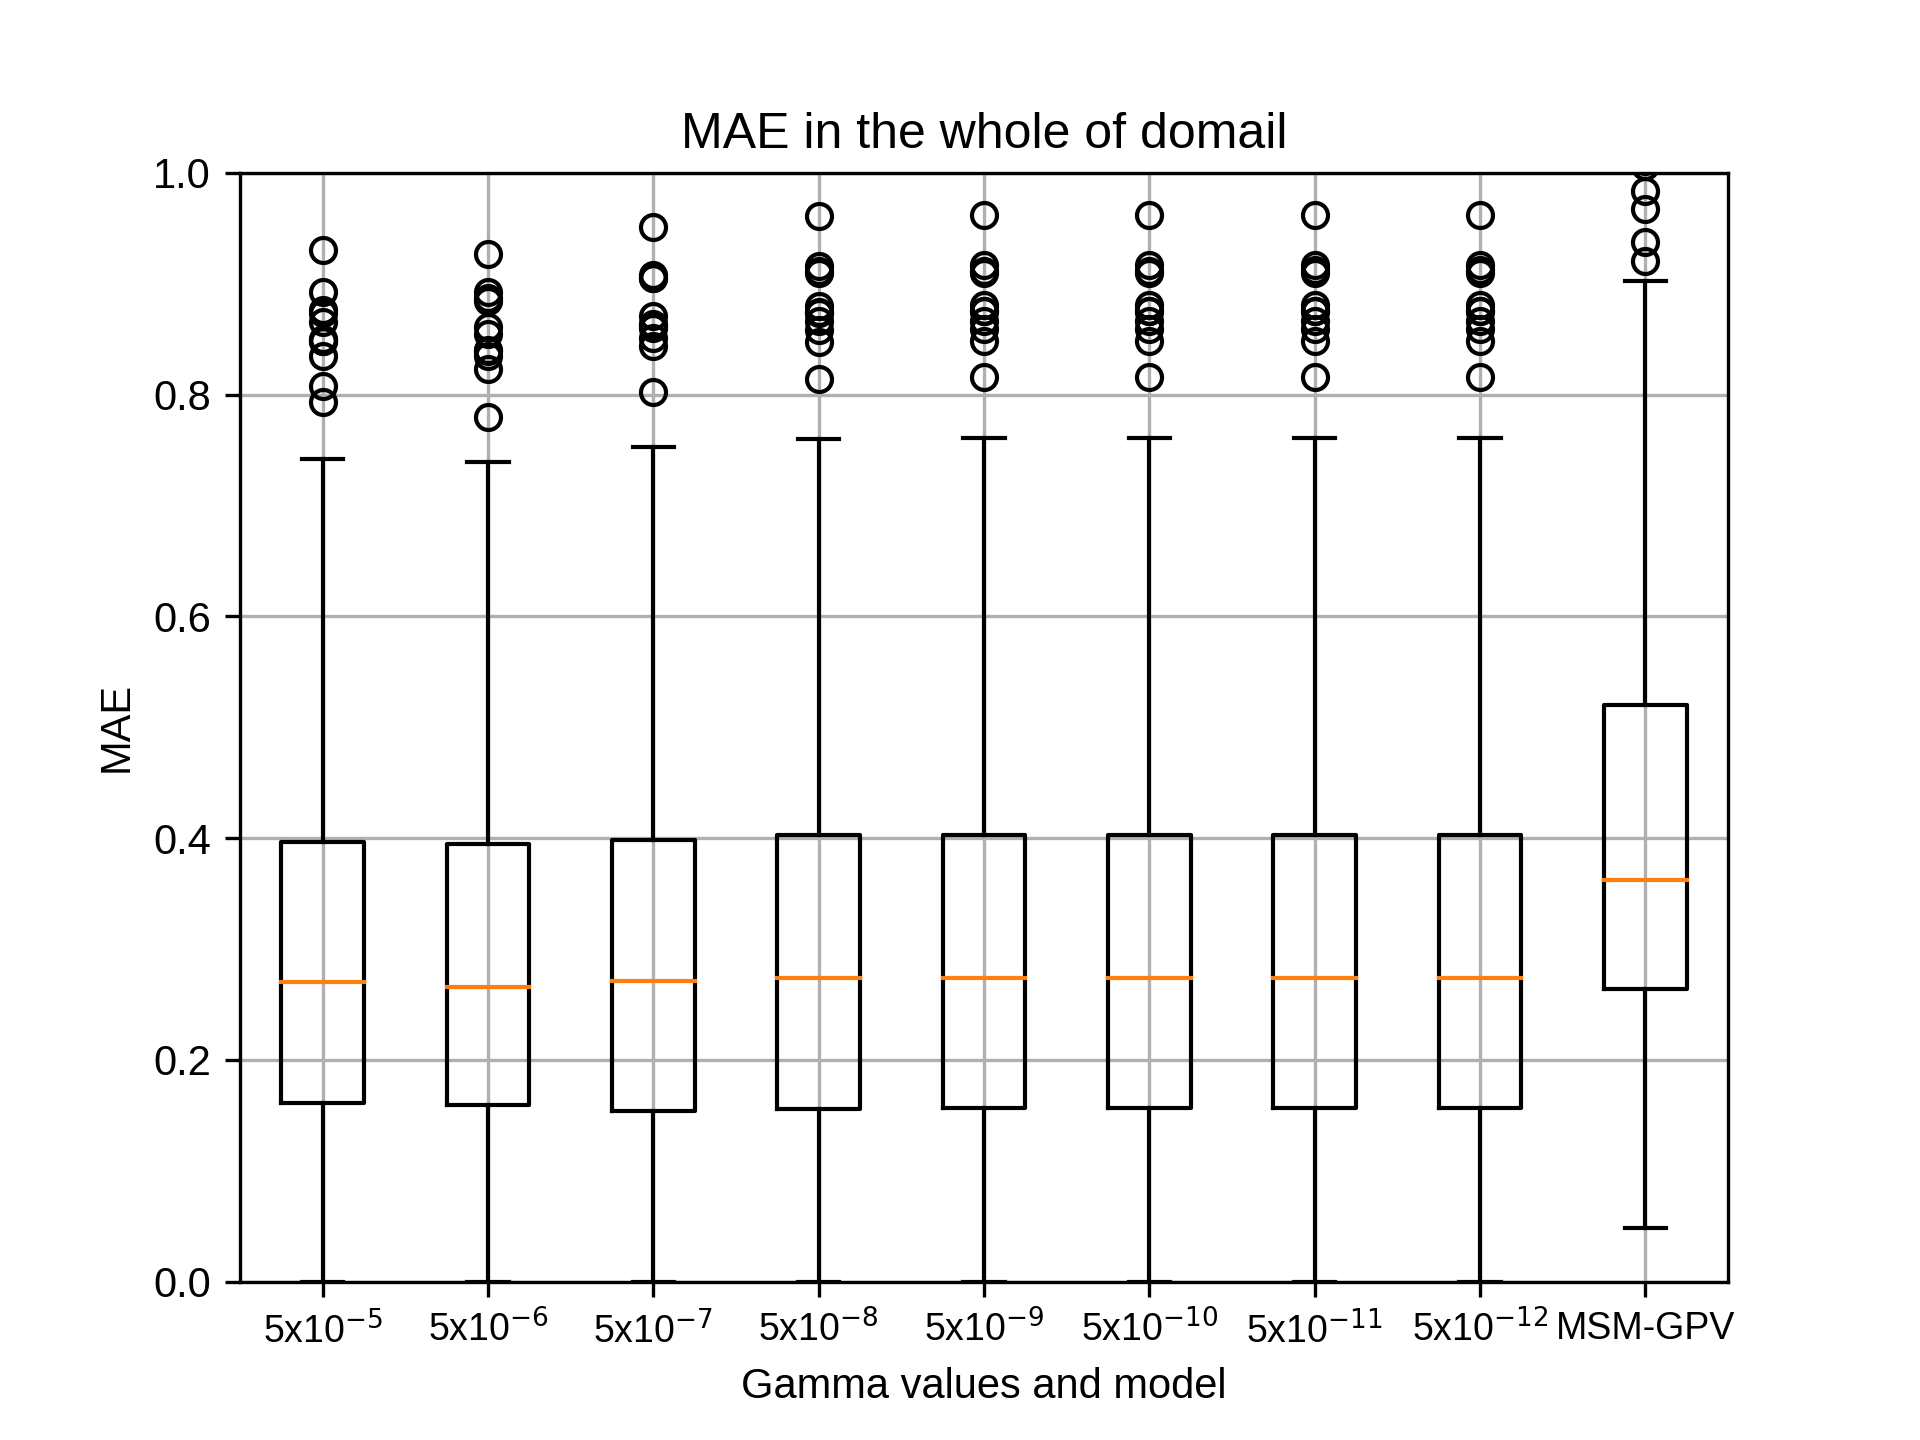
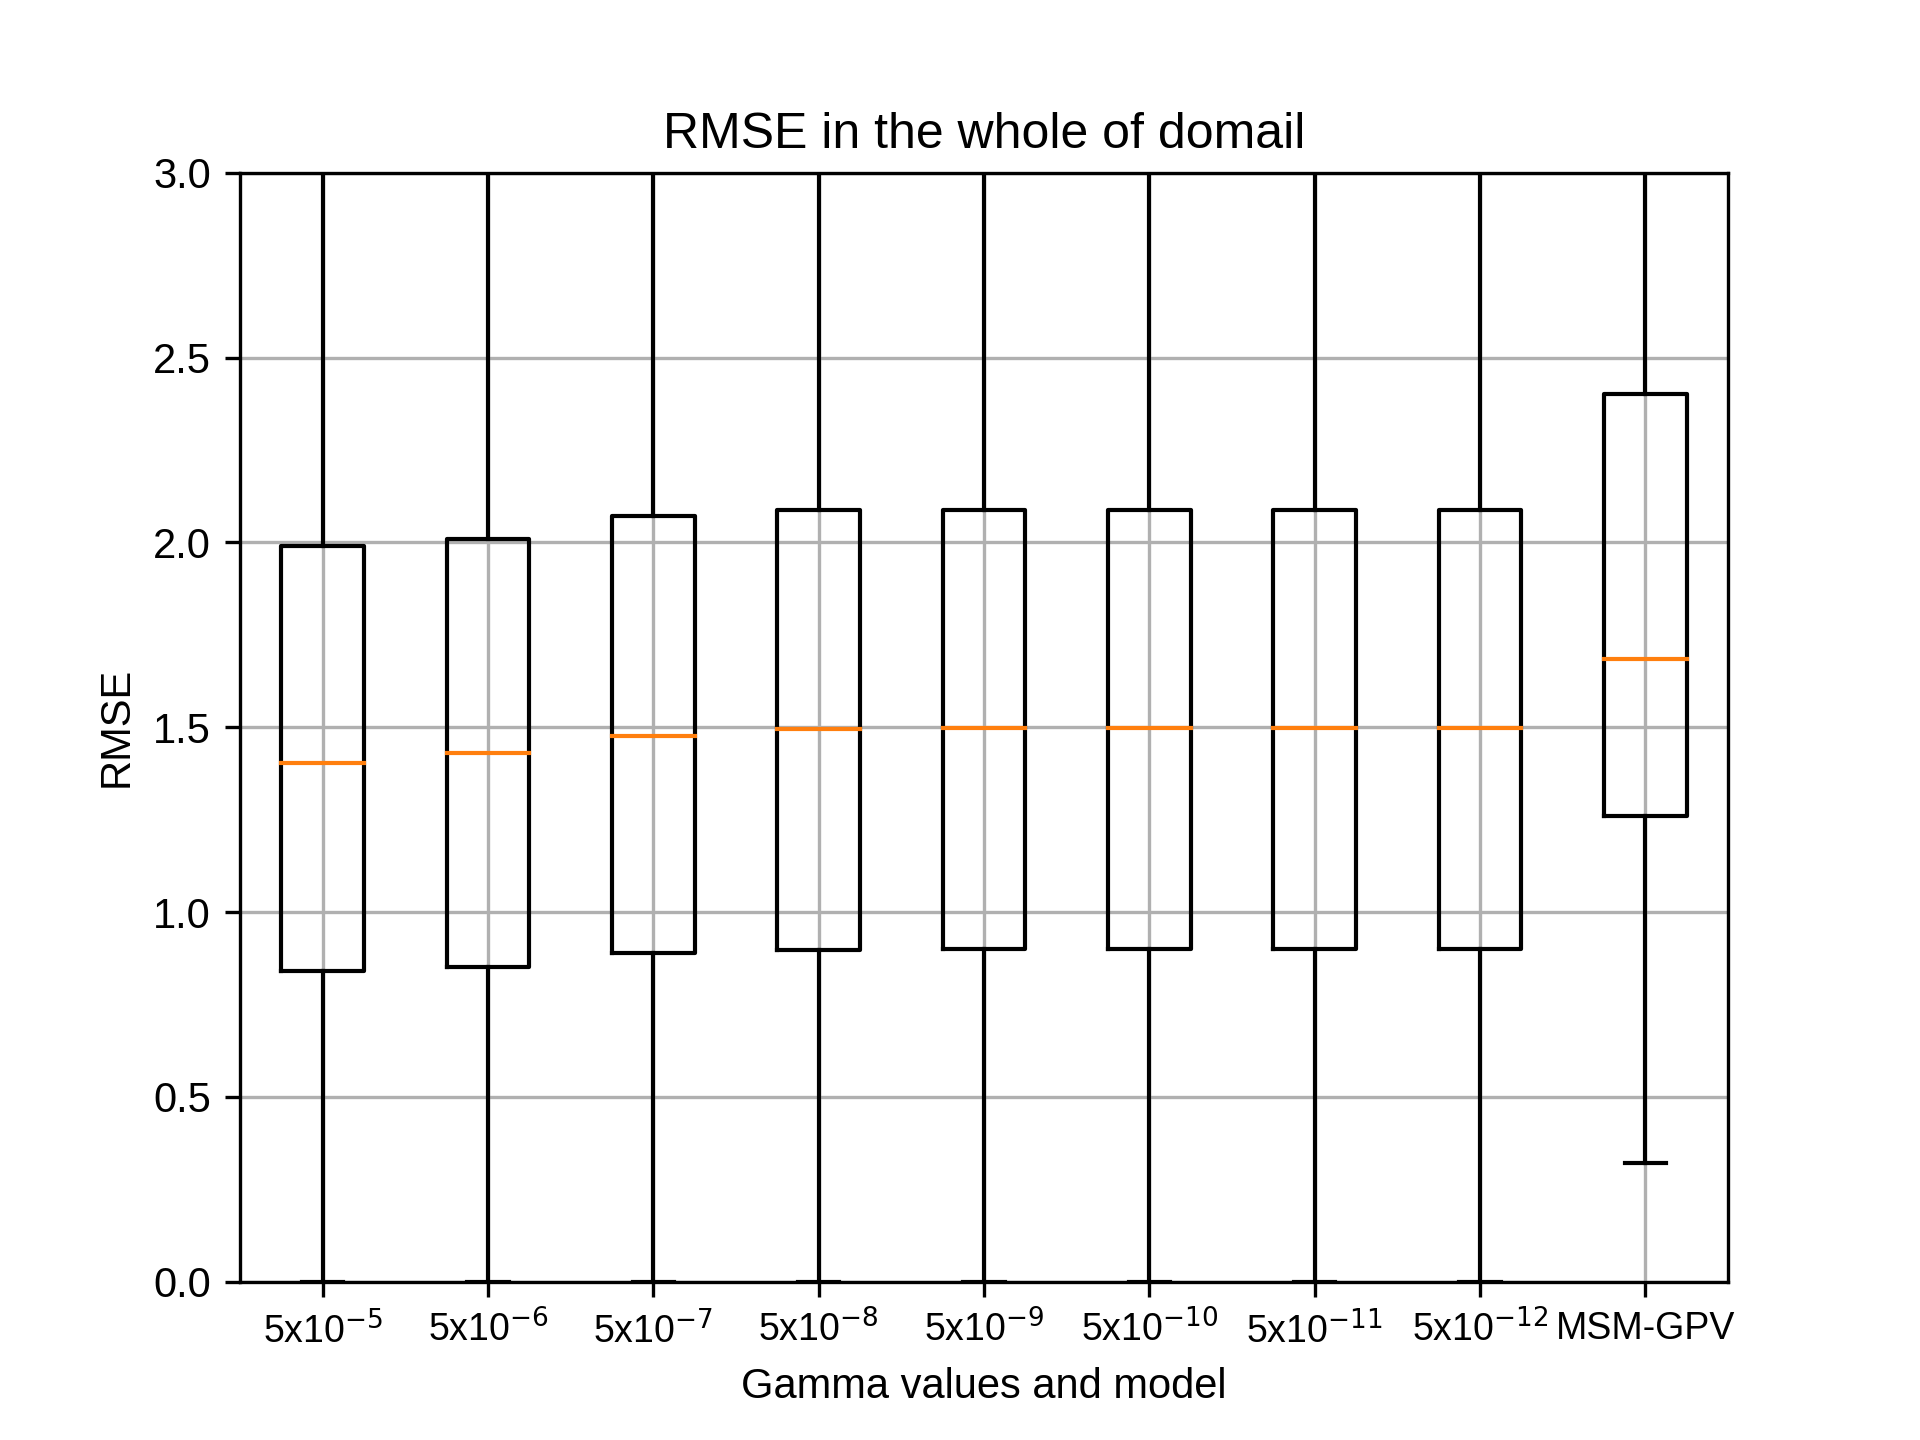
4月のsiteE,rg2=6の結果です。
kobayashi_yusukeThursday, October 22nd, 2020 at 4:27:24 PM GMT+09:00
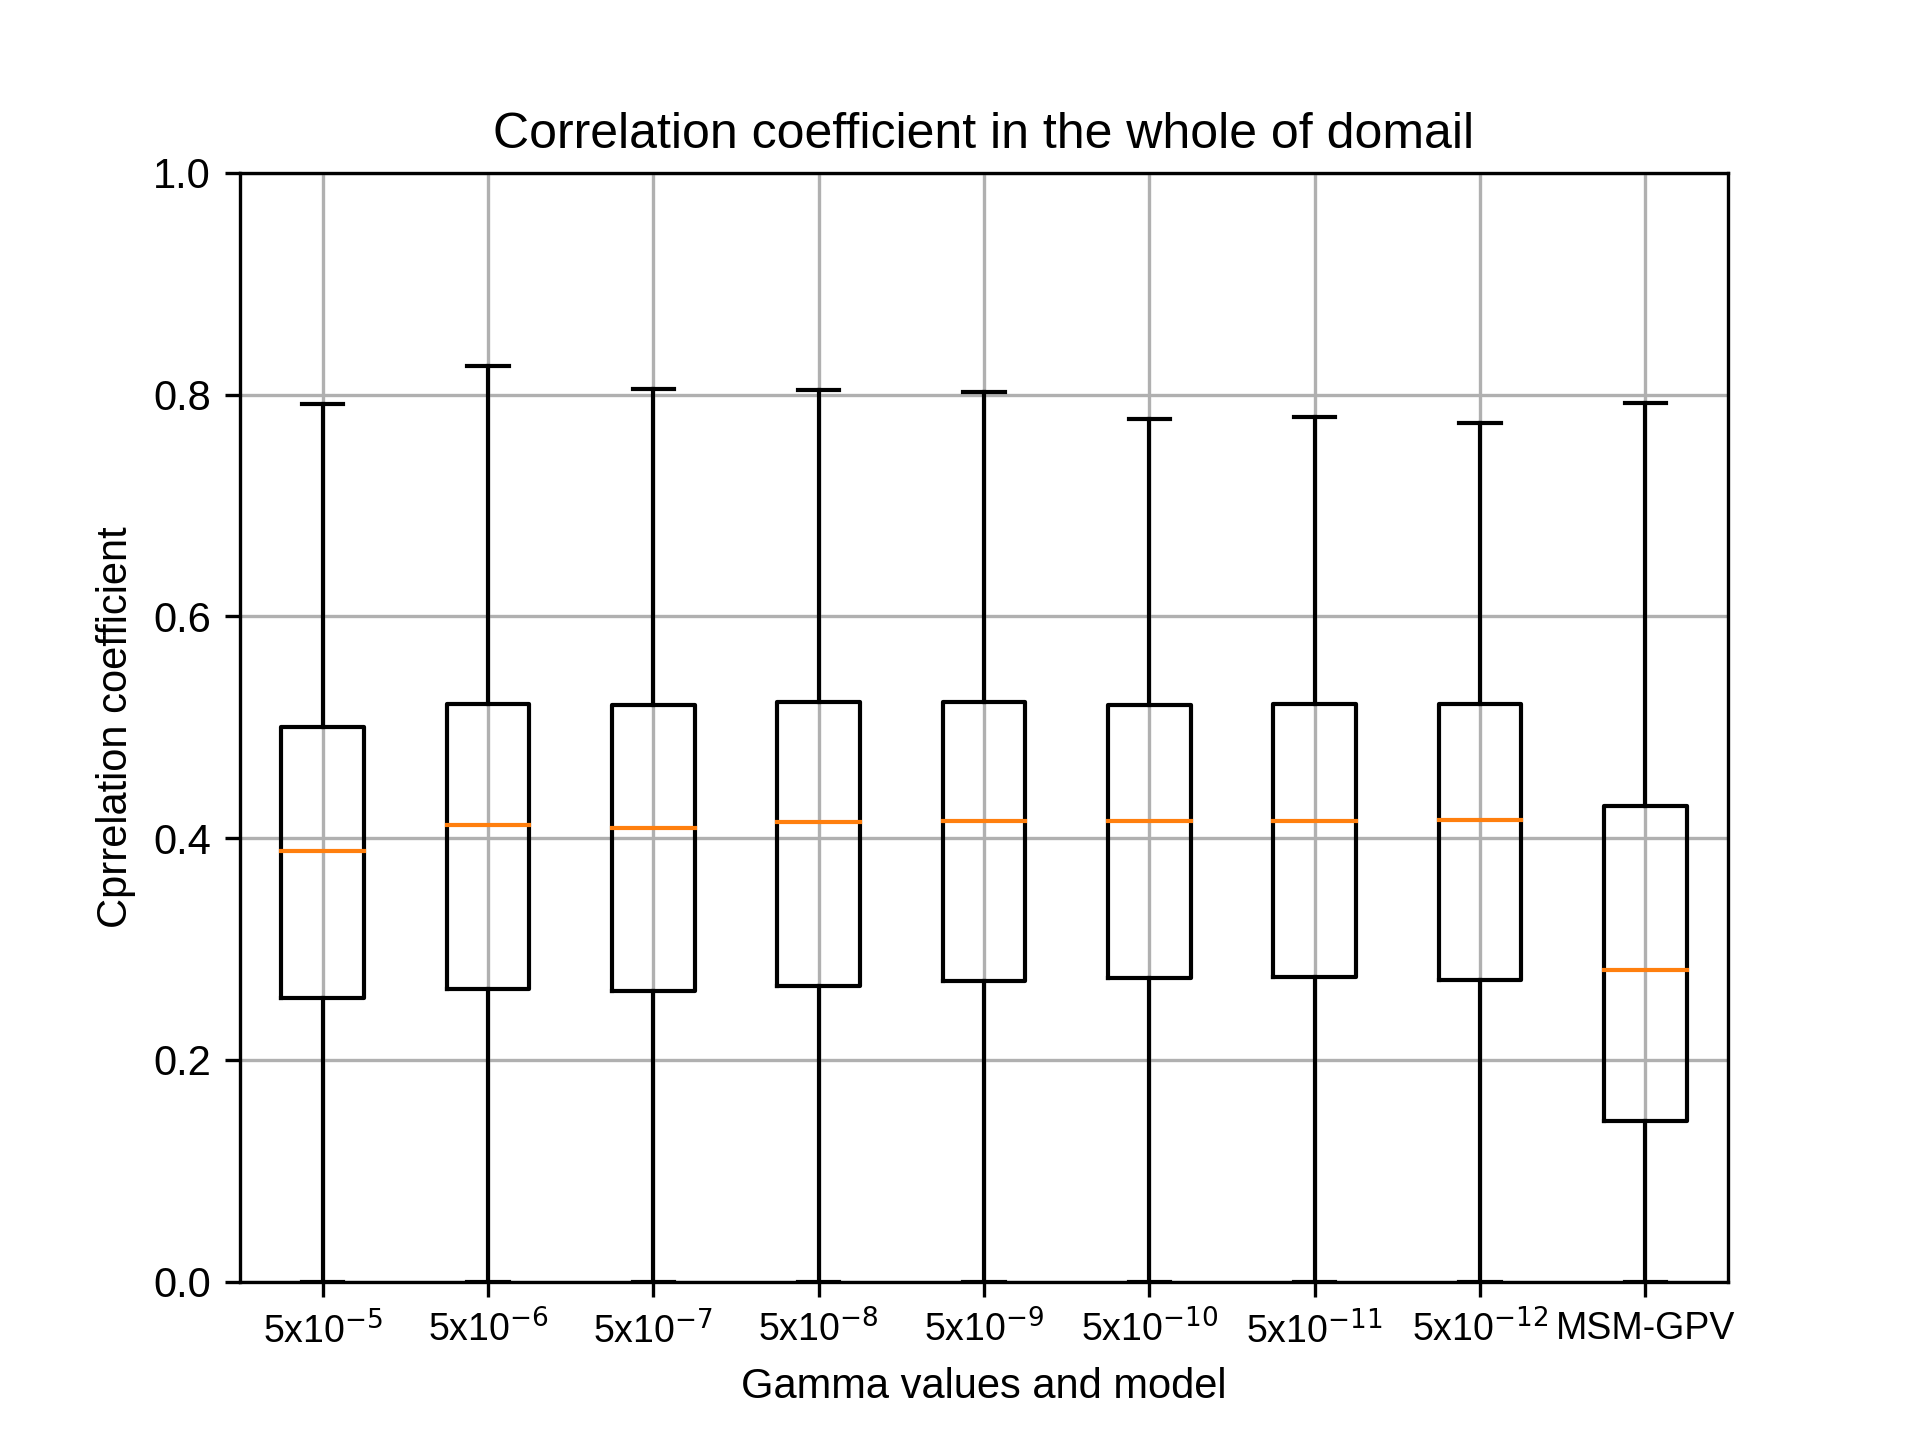
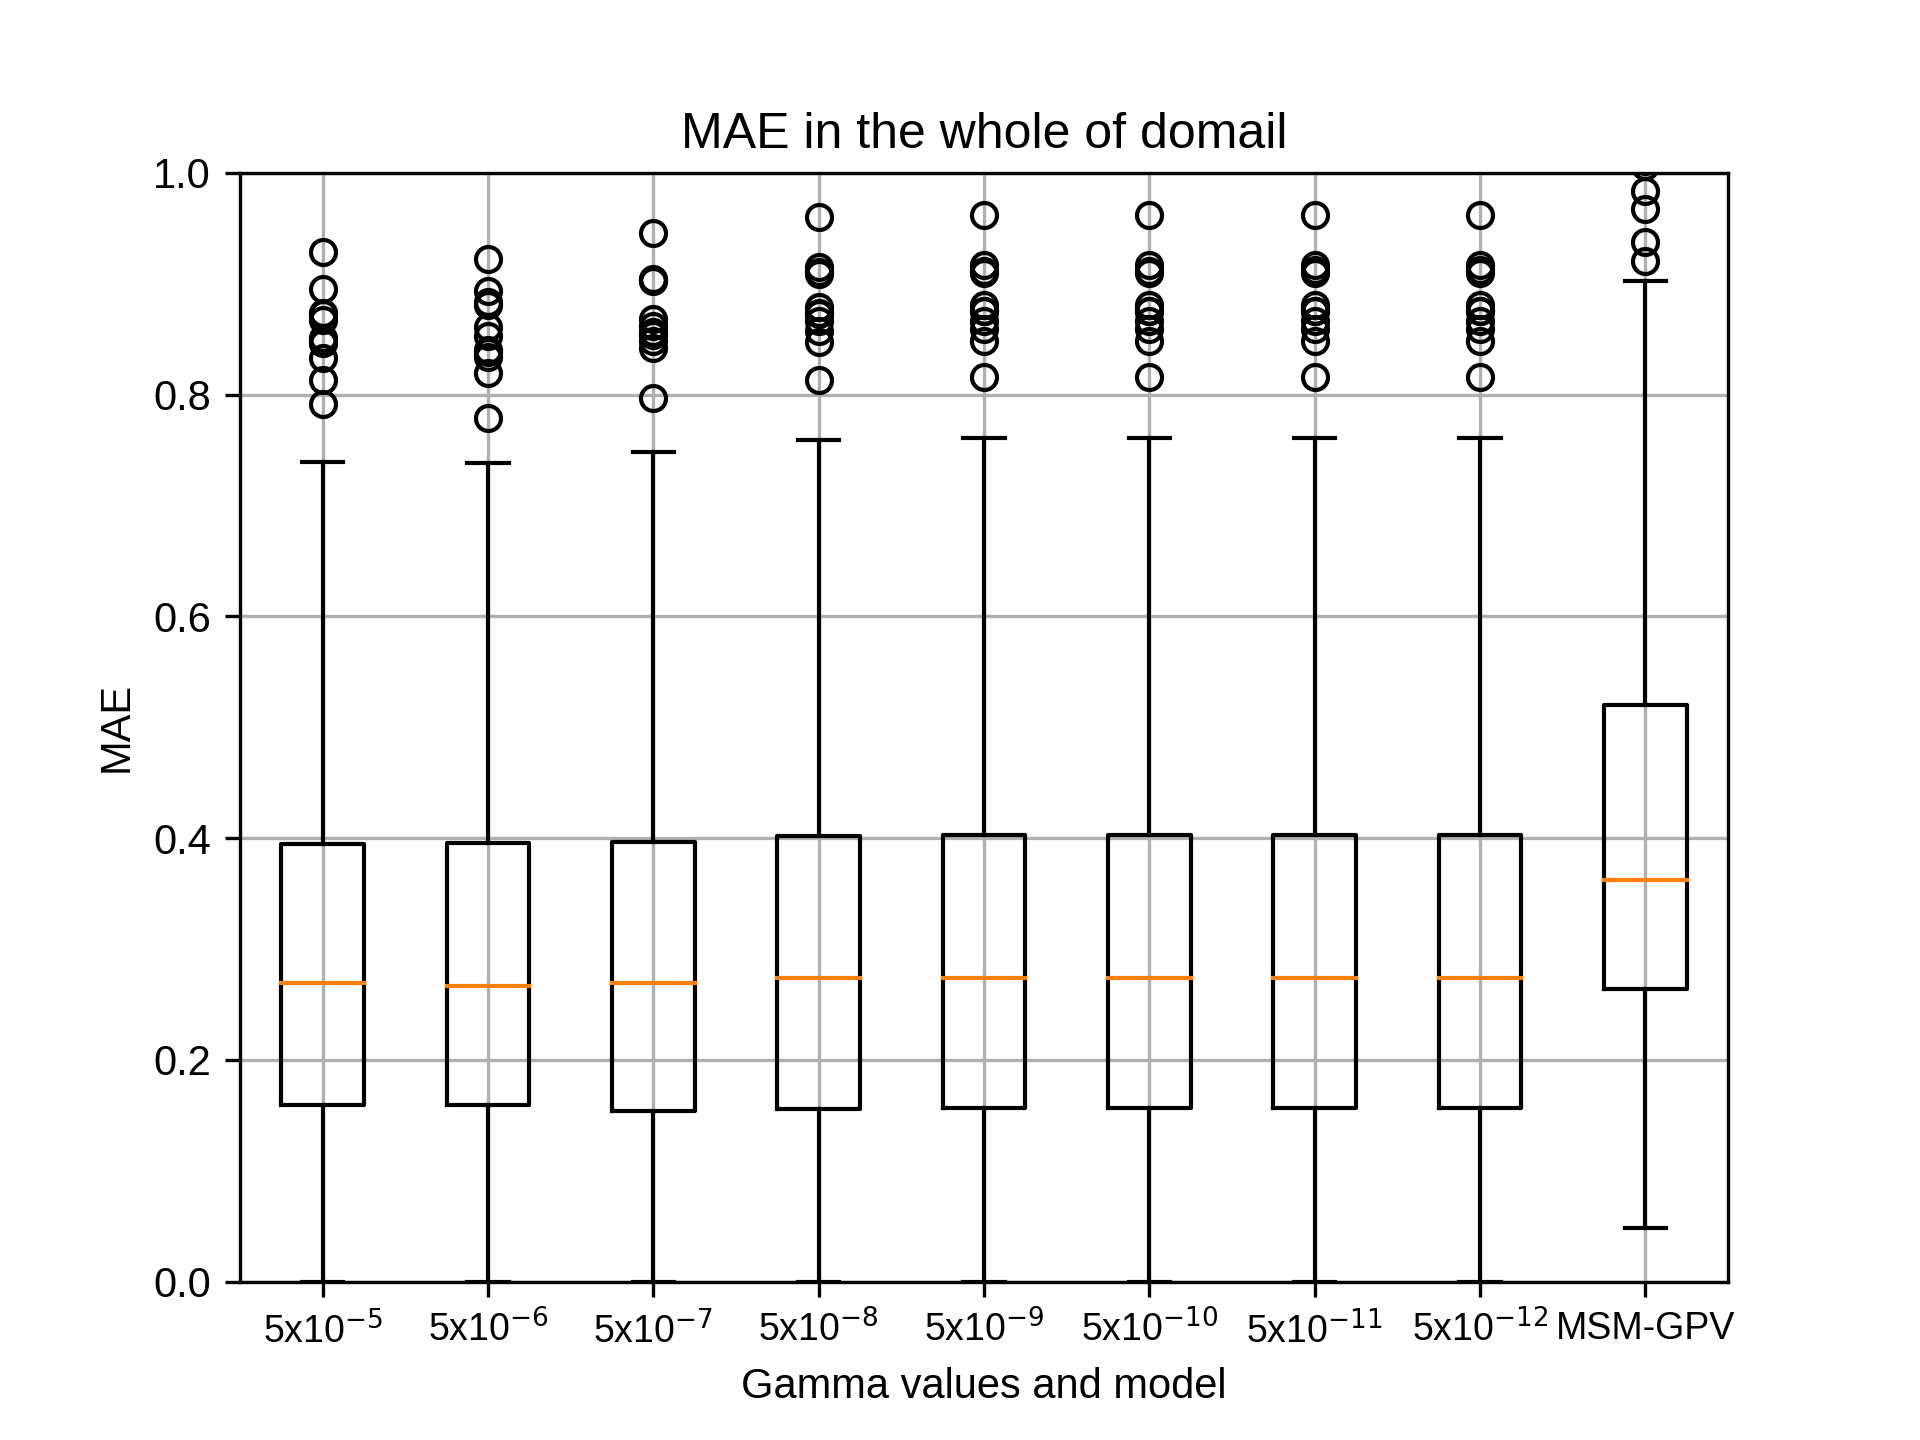
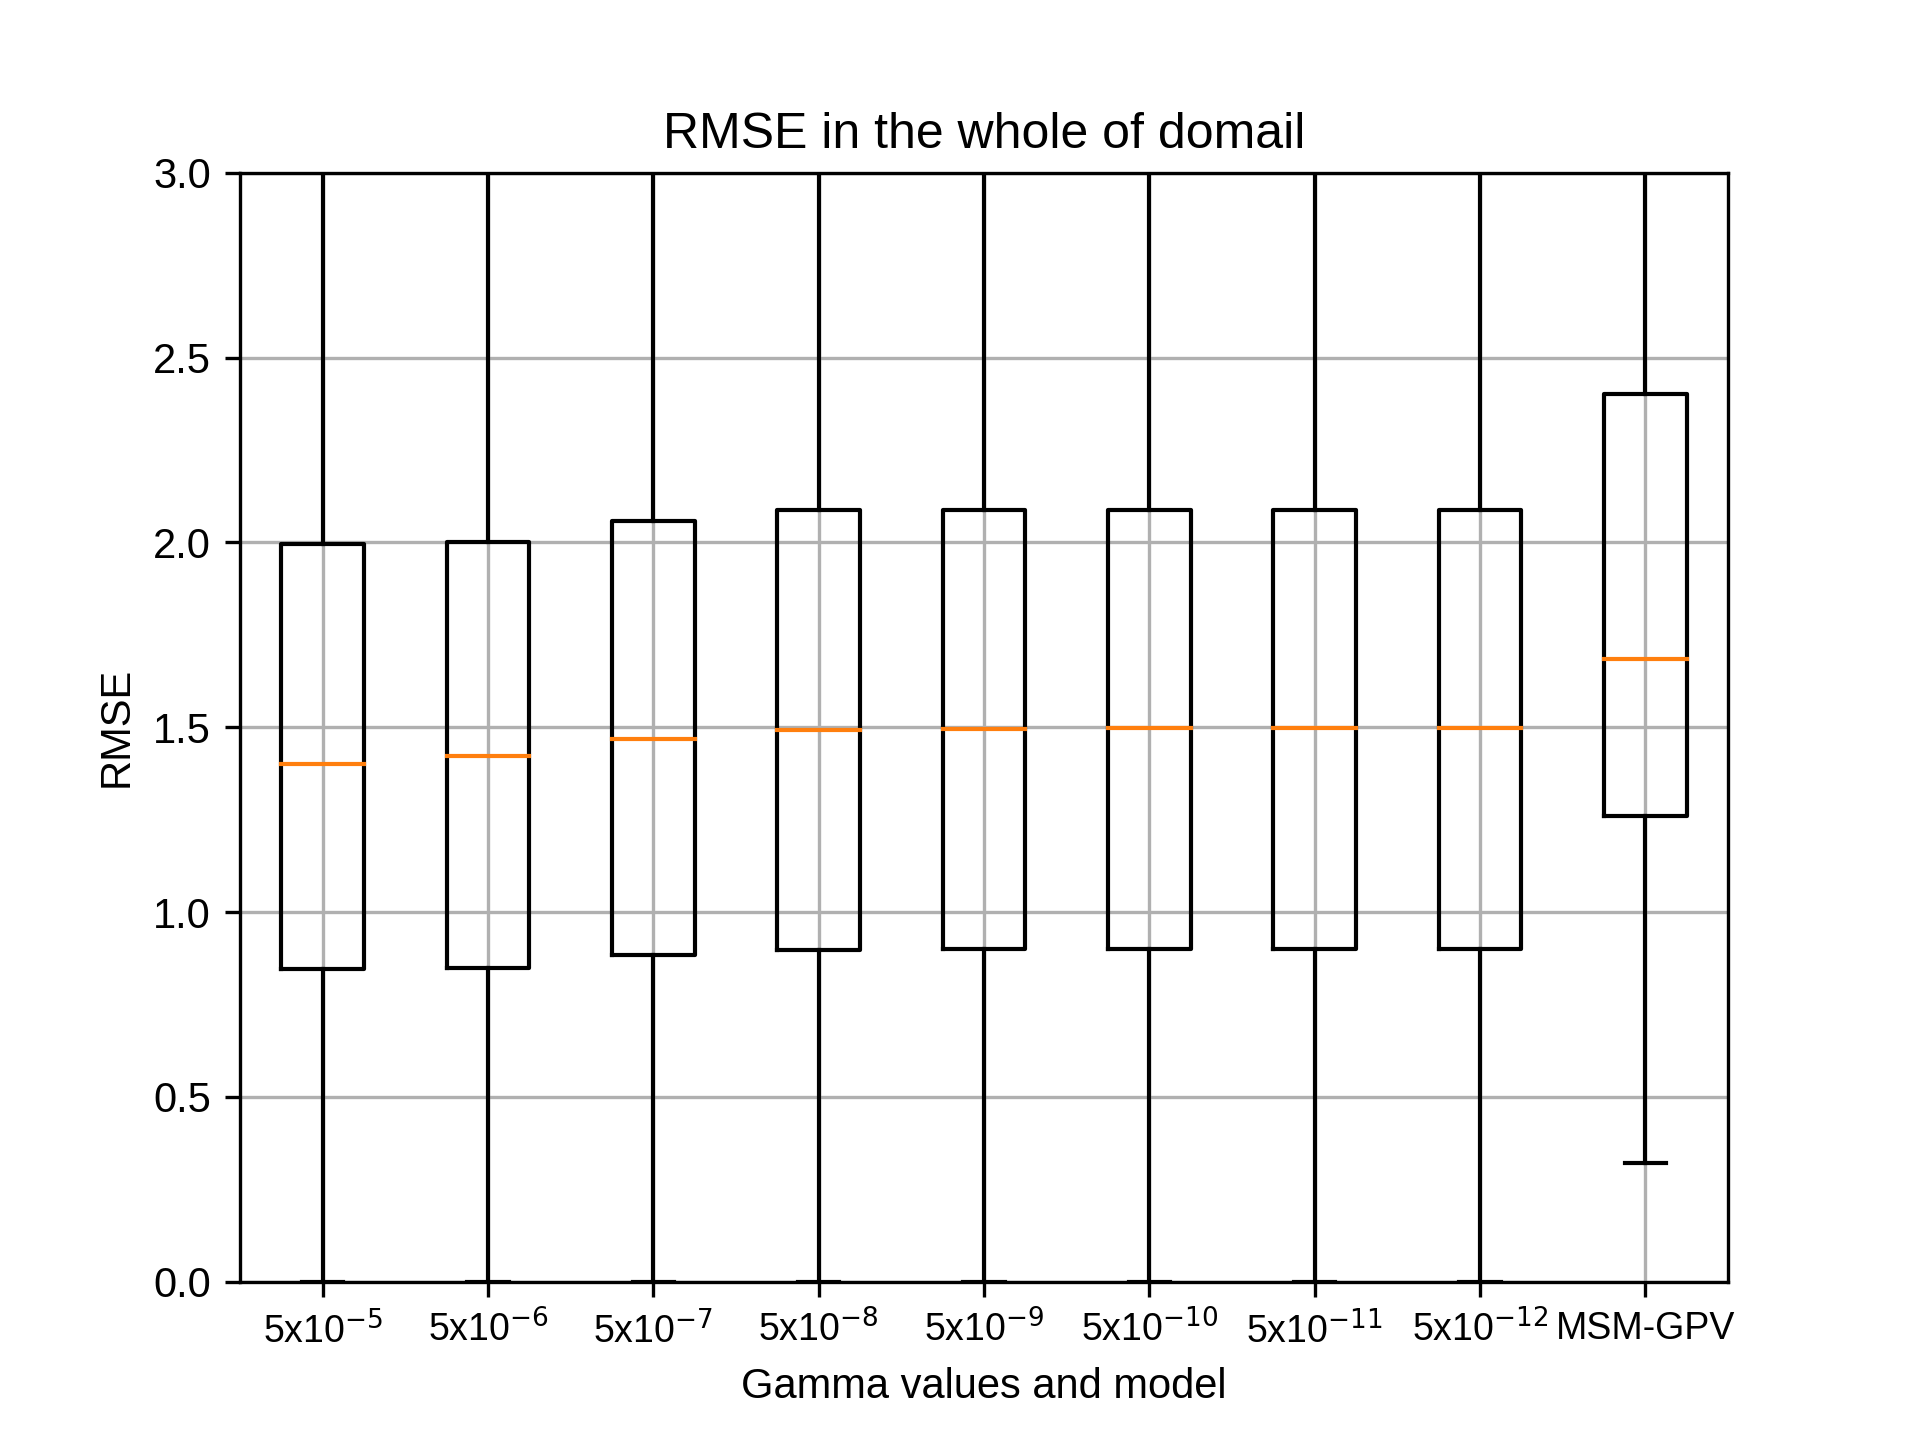
4月のsiteE,rg2=8の結果です。
kobayashi_yusukeThursday, October 22nd, 2020 at 4:28:04 PM GMT+09:00
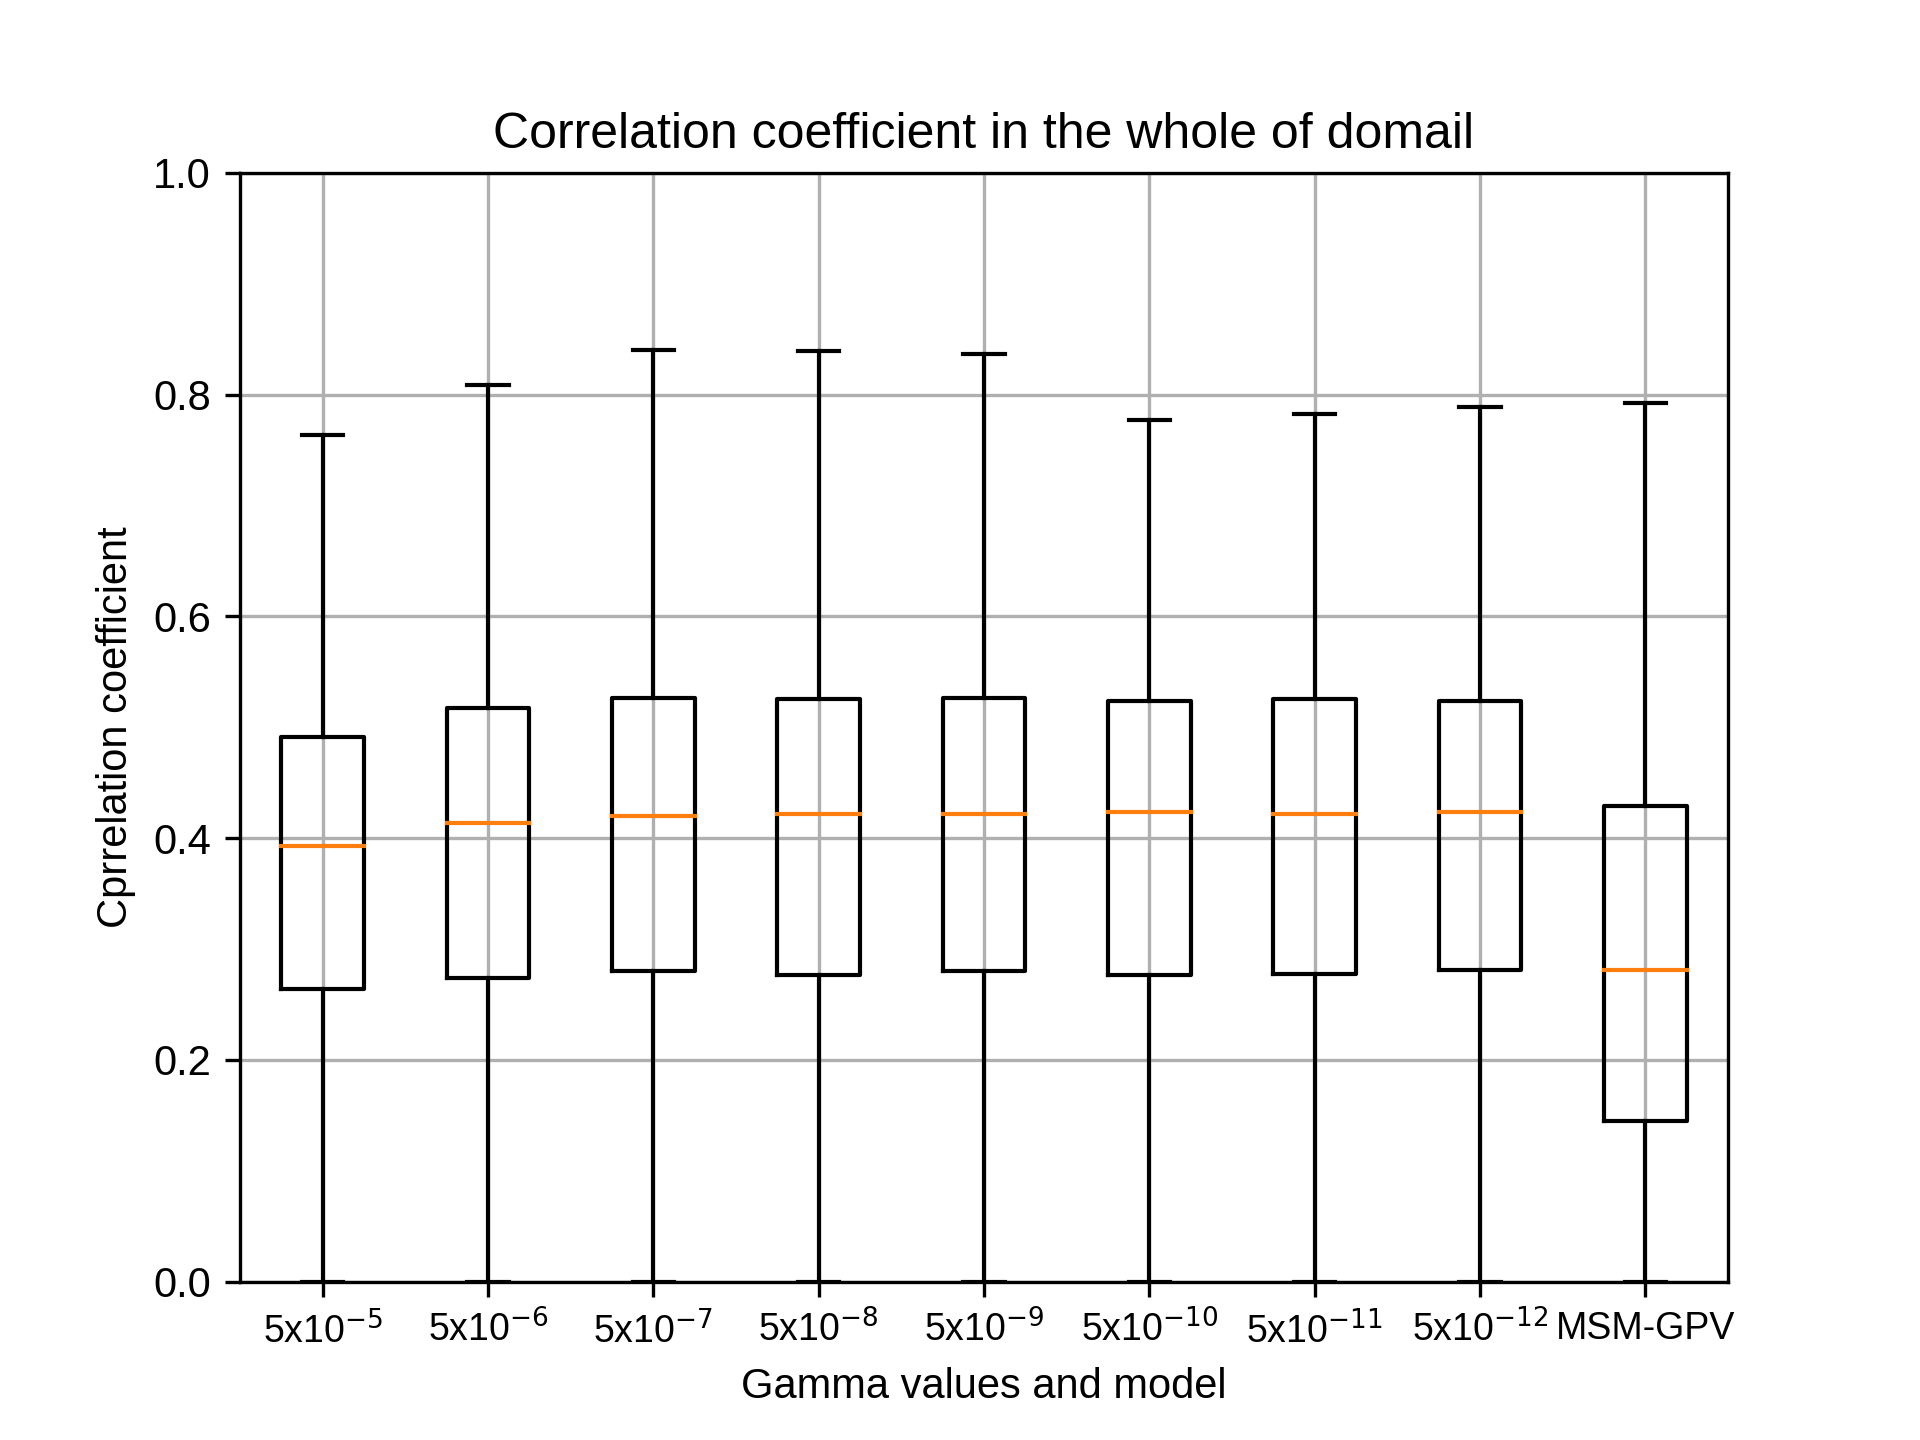


4月のsiteE,rg2=10の結果です。
kobayashi_yusukeThursday, October 22nd, 2020 at 4:28:44 PM GMT+09:00
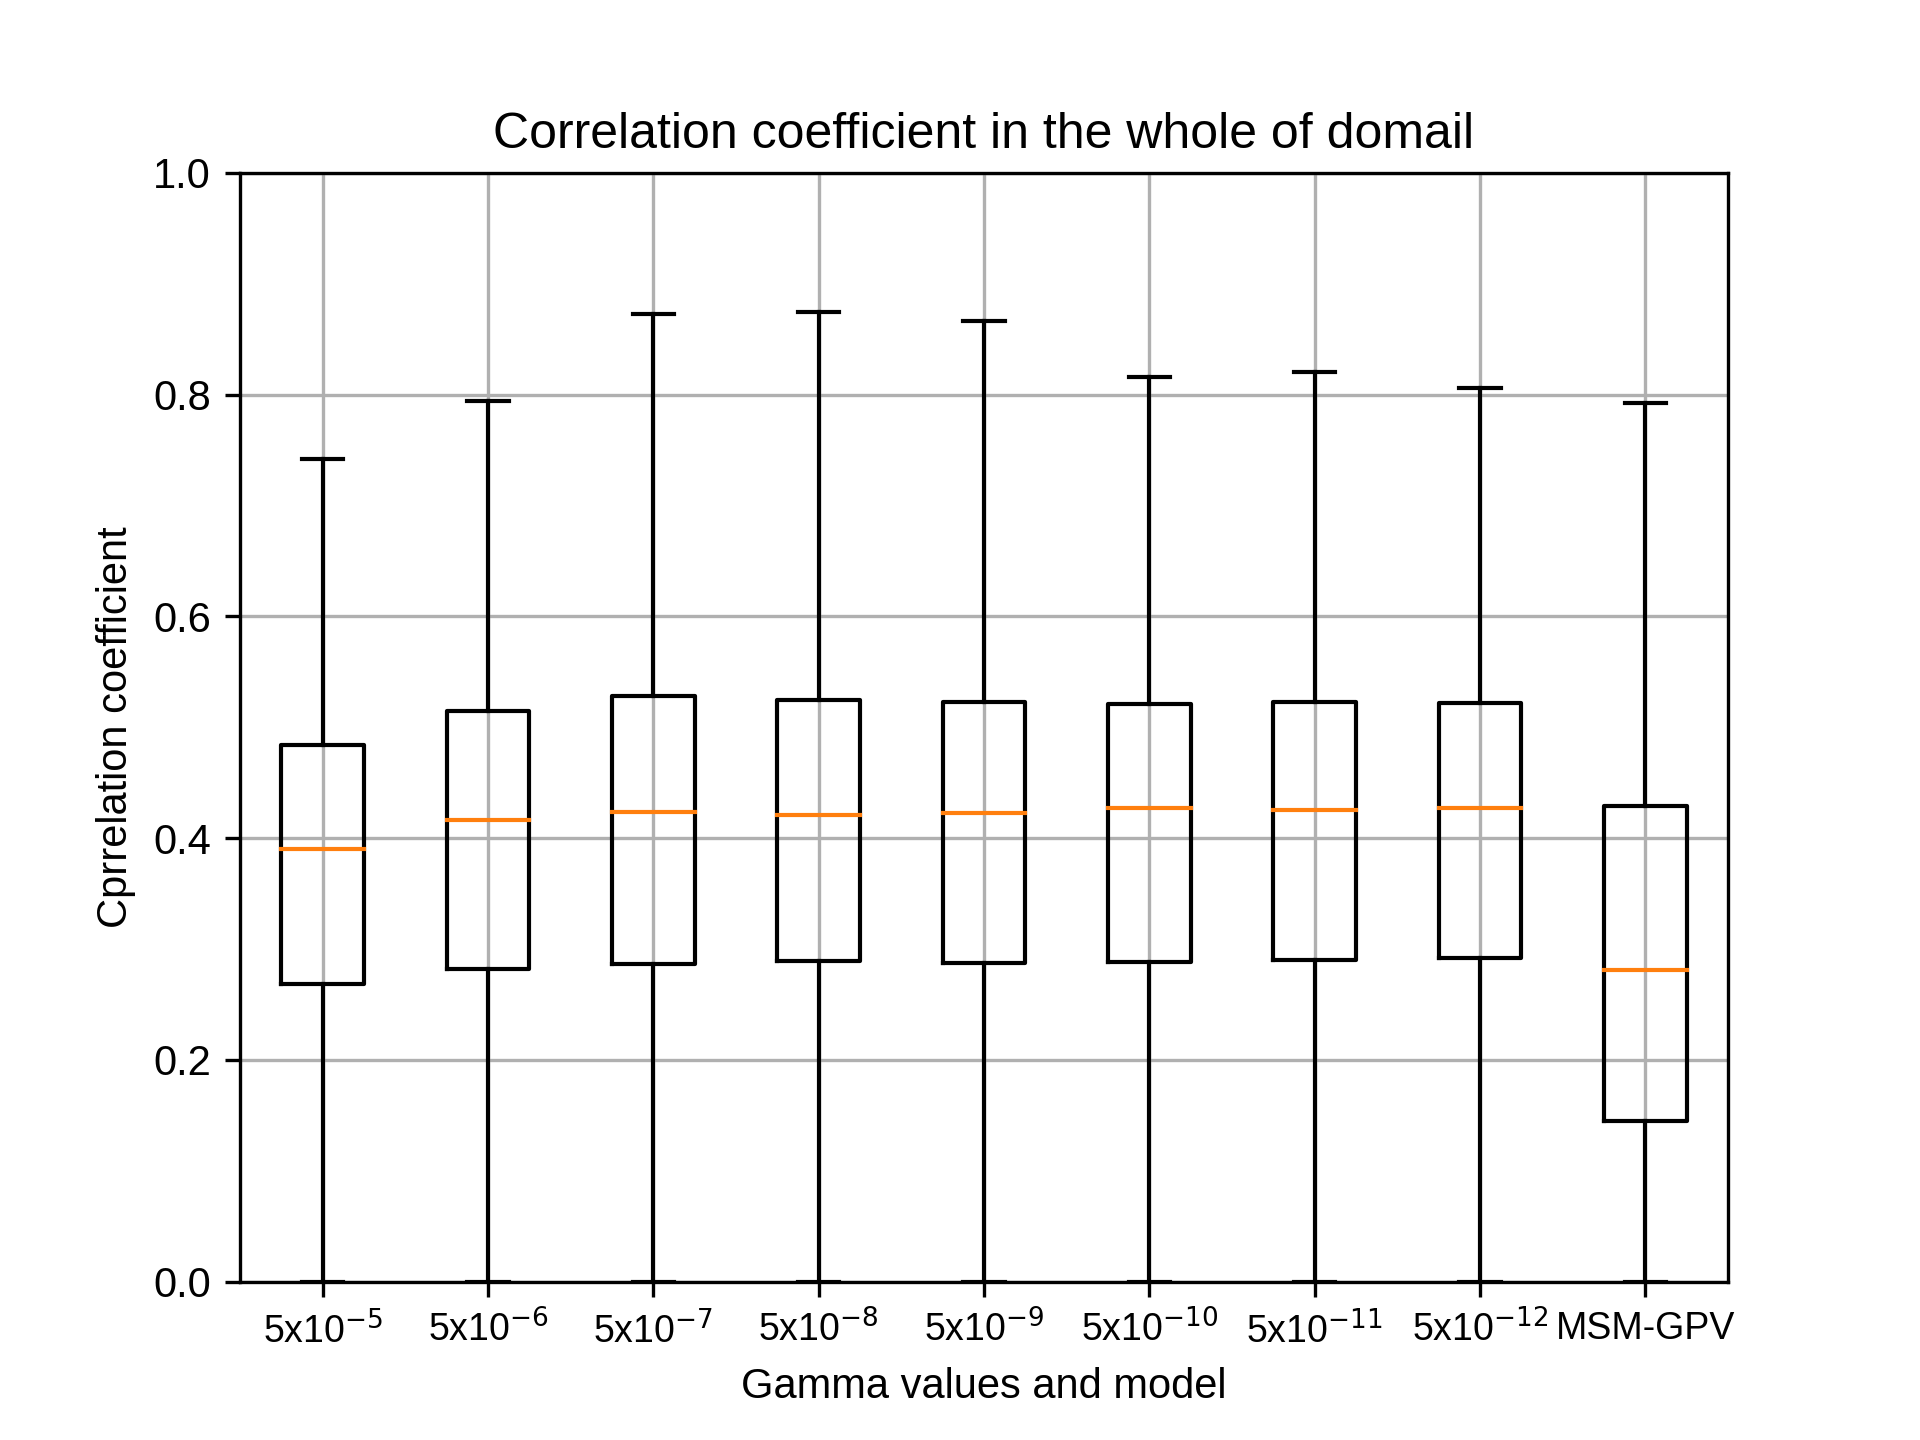


4月のsiteE,rg2=12の結果です。
4月のsiteEではrg2=12でgammaが5x10⁻¹⁰のとき、相関係数の中央値が最も高くなりました。
4月のsiteEではrg2=12でgammaが5x10⁻¹⁰のとき、相関係数の中央値が最も高くなりました。
kobayashi_yusukeThursday, October 22nd, 2020 at 4:29:04 PM GMT+09:00

最後に7月の結果は表の右2列となります。特徴量ベクトルは10もしくは12、gammaは当初の結果と同じになりました。ただ、特徴量ベクトルはrg2=8,10,12で大きな差はございませんでした。
cost,epsilonはそれぞれこれまでのハイパーパラメータ決定で相関係数の中央値が最大の者を採用しました。詳細は添付のエクセルをご参照ください。
cost,epsilonはそれぞれこれまでのハイパーパラメータ決定で相関係数の中央値が最大の者を採用しました。詳細は添付のエクセルをご参照ください。
kobayashi_yusukeThursday, October 22nd, 2020 at 4:29:31 PM GMT+09:00
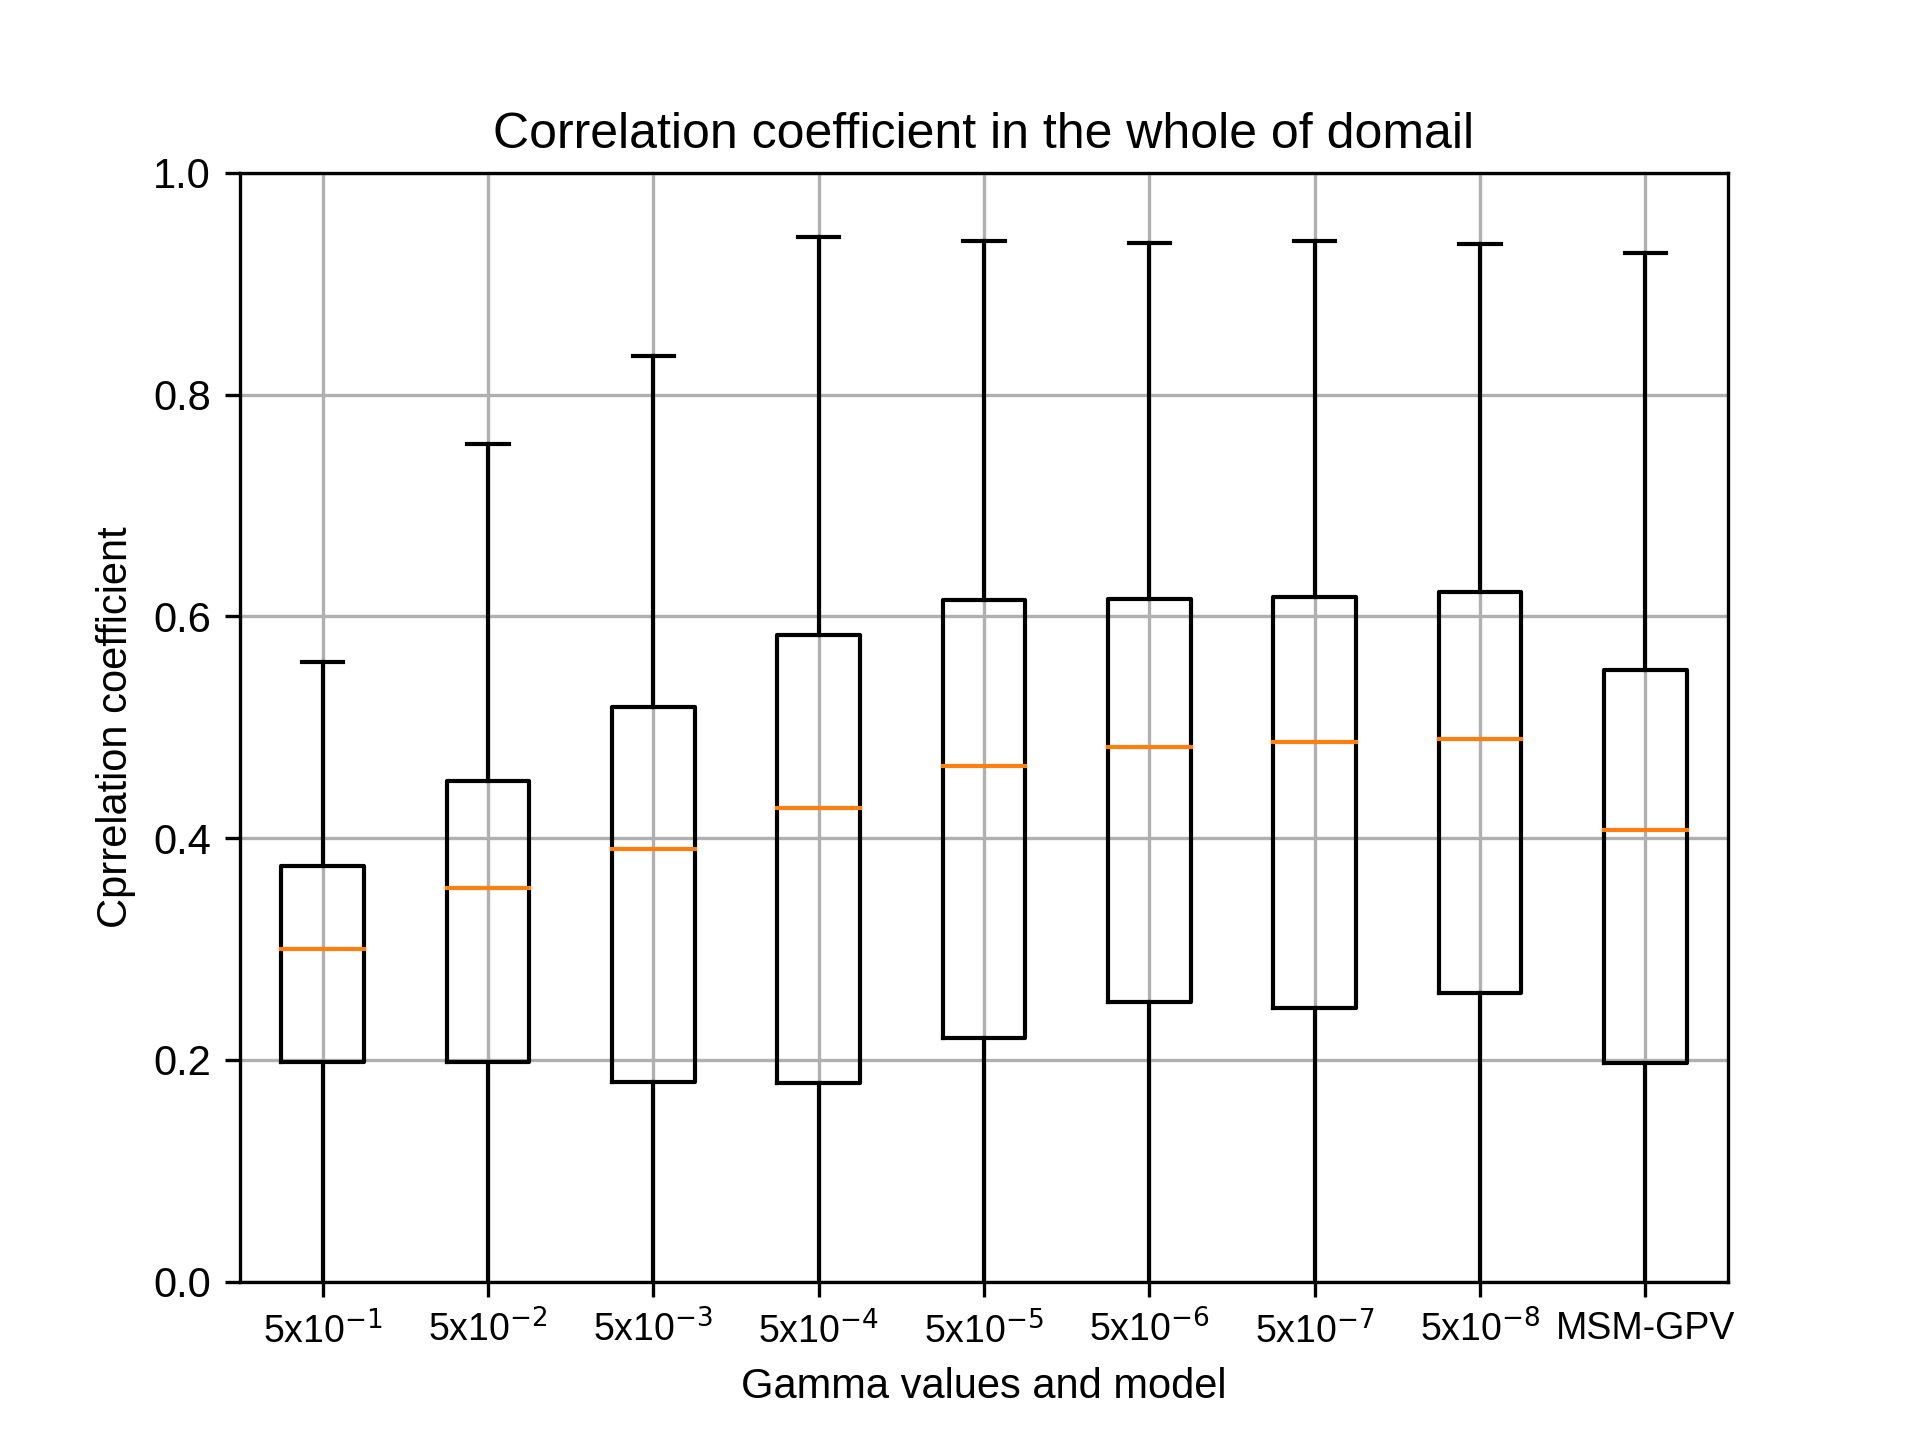
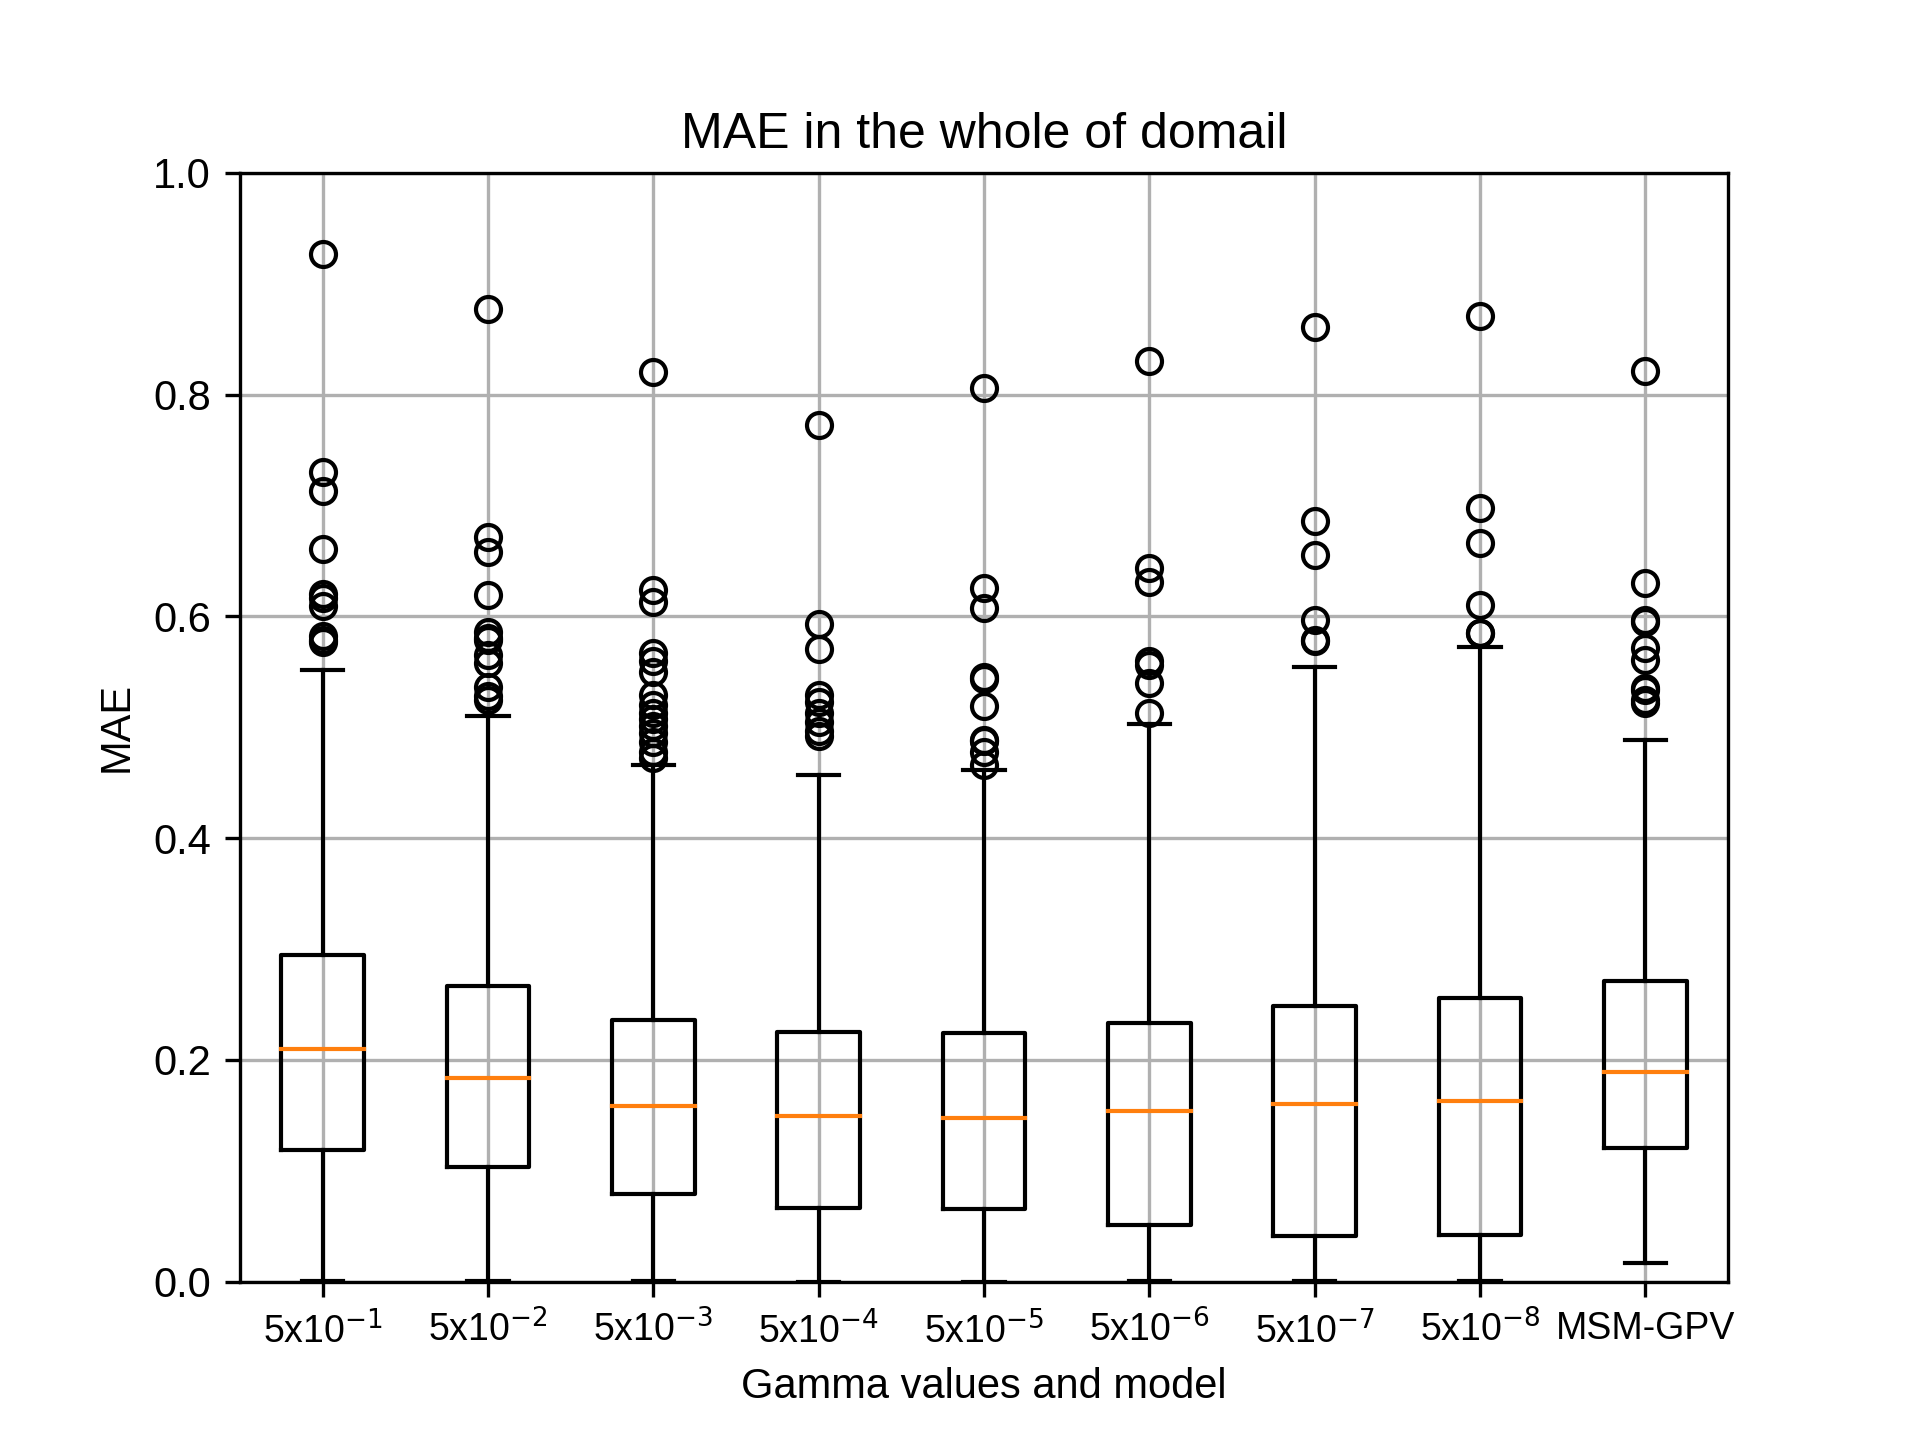
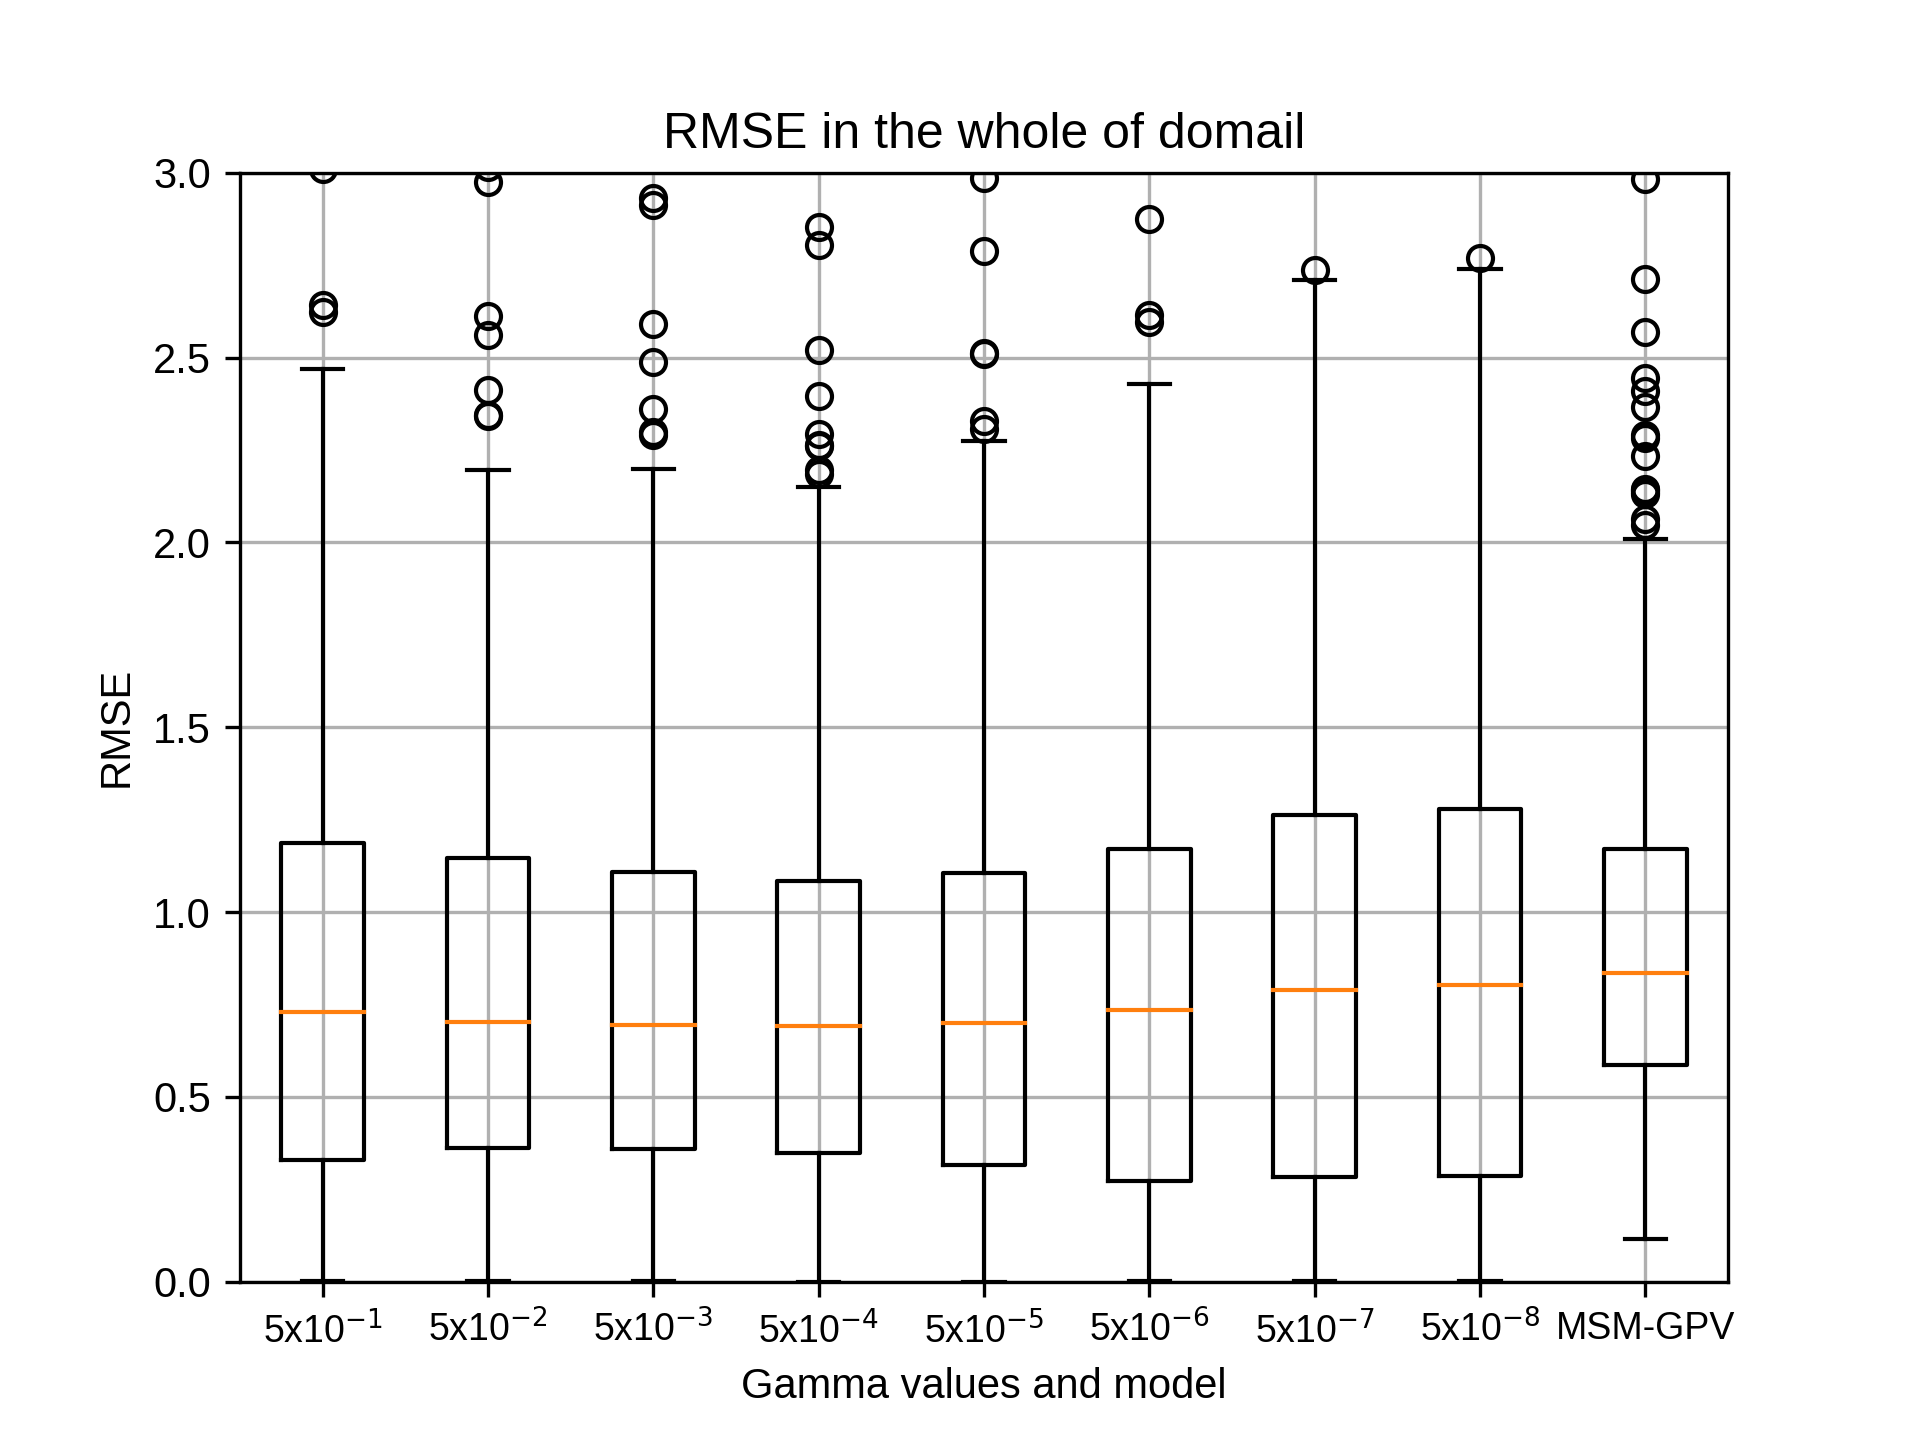
まずは7月のsiteA,rg2=4の結果です。
kobayashi_yusukeThursday, October 22nd, 2020 at 4:29:43 PM GMT+09:00
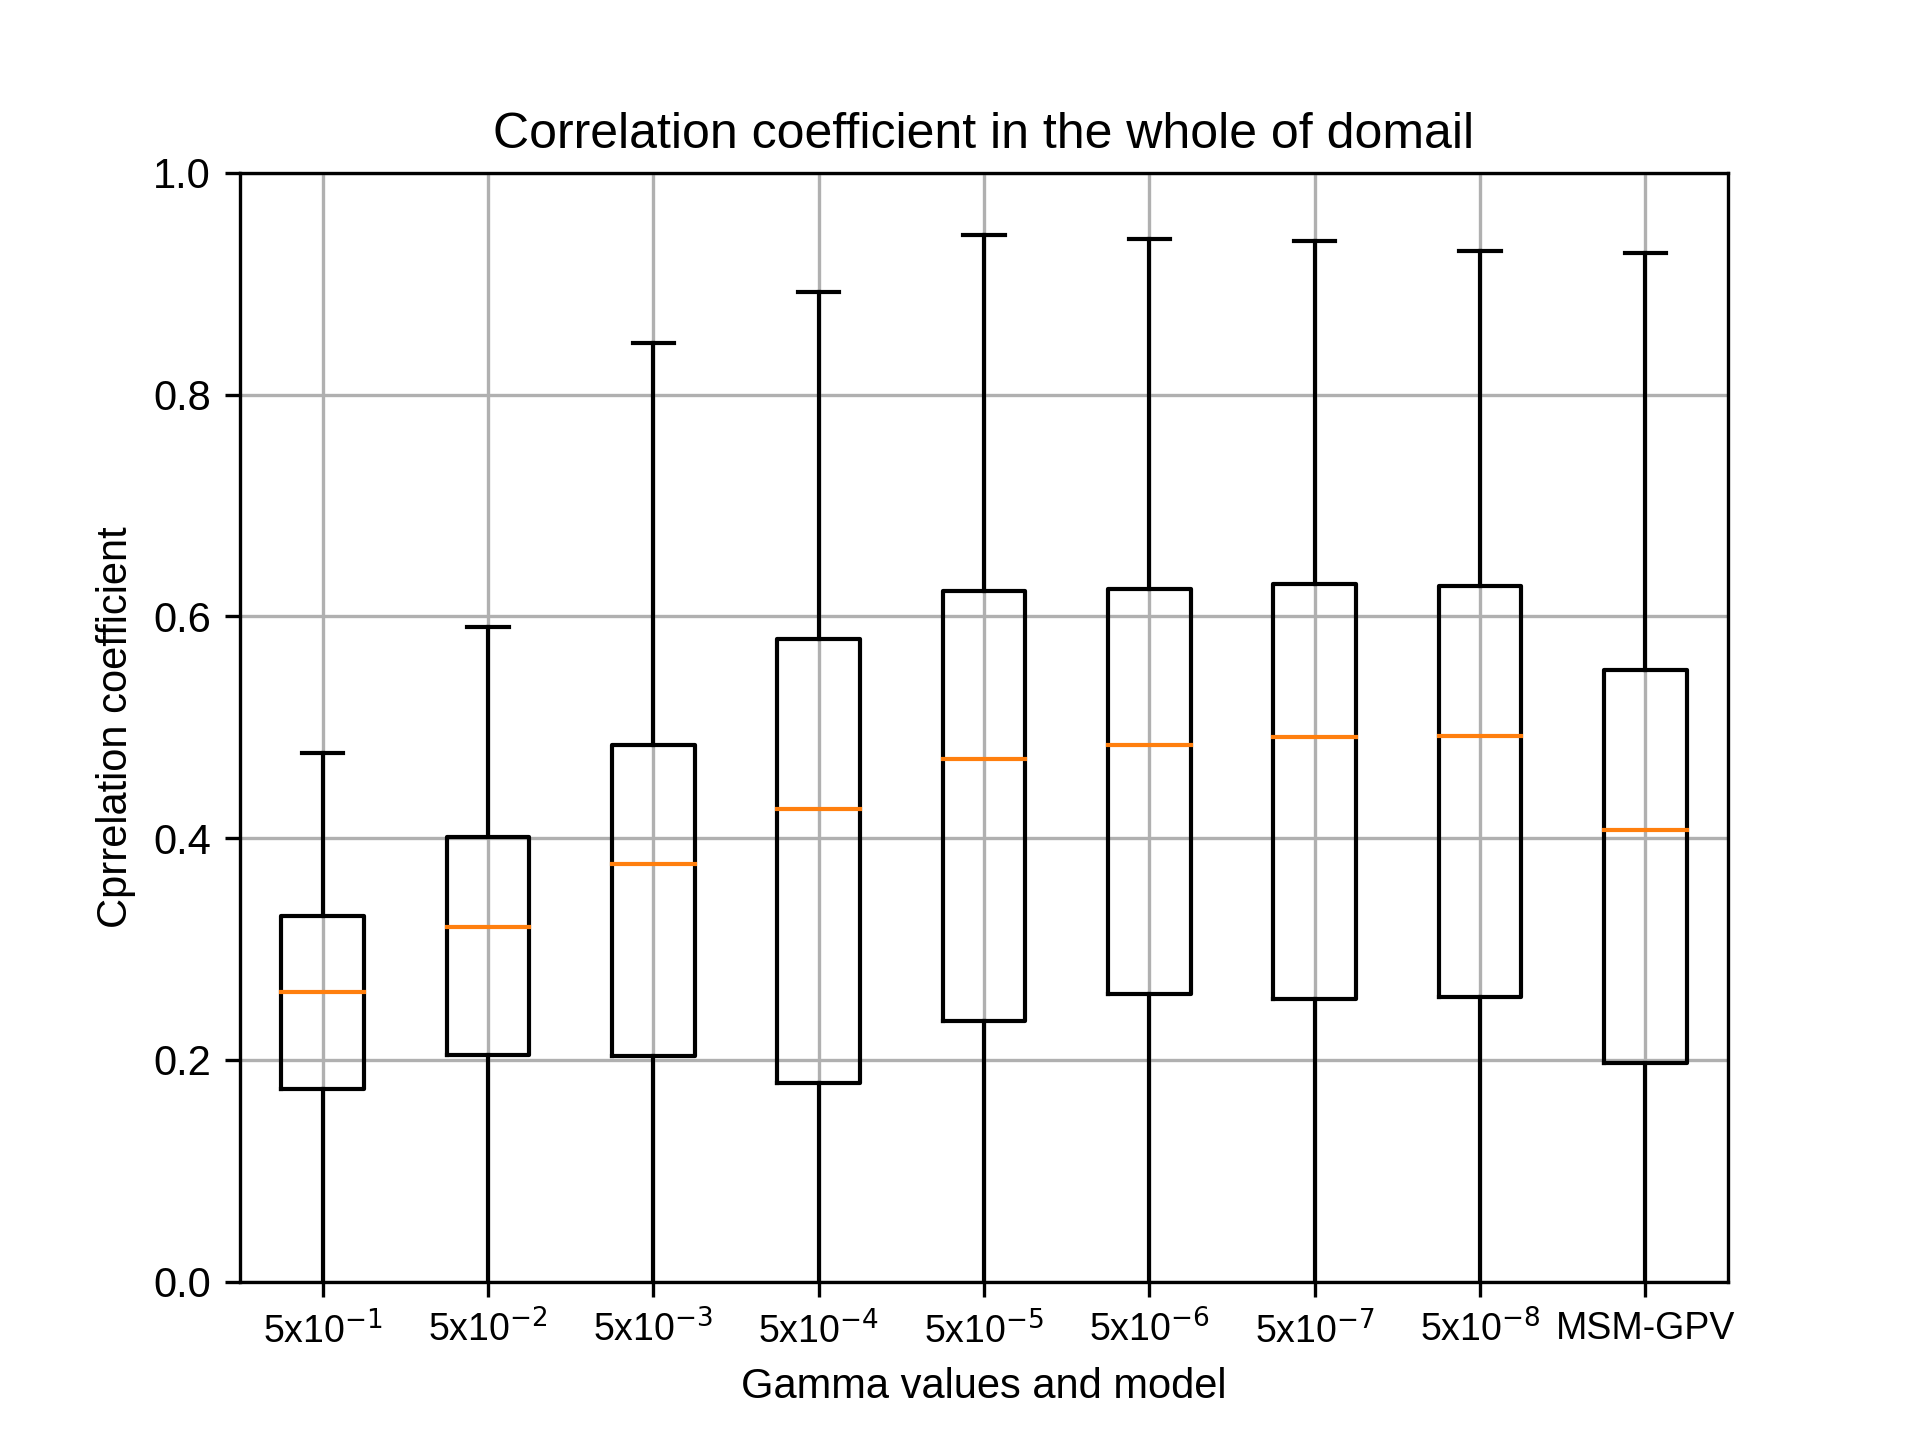
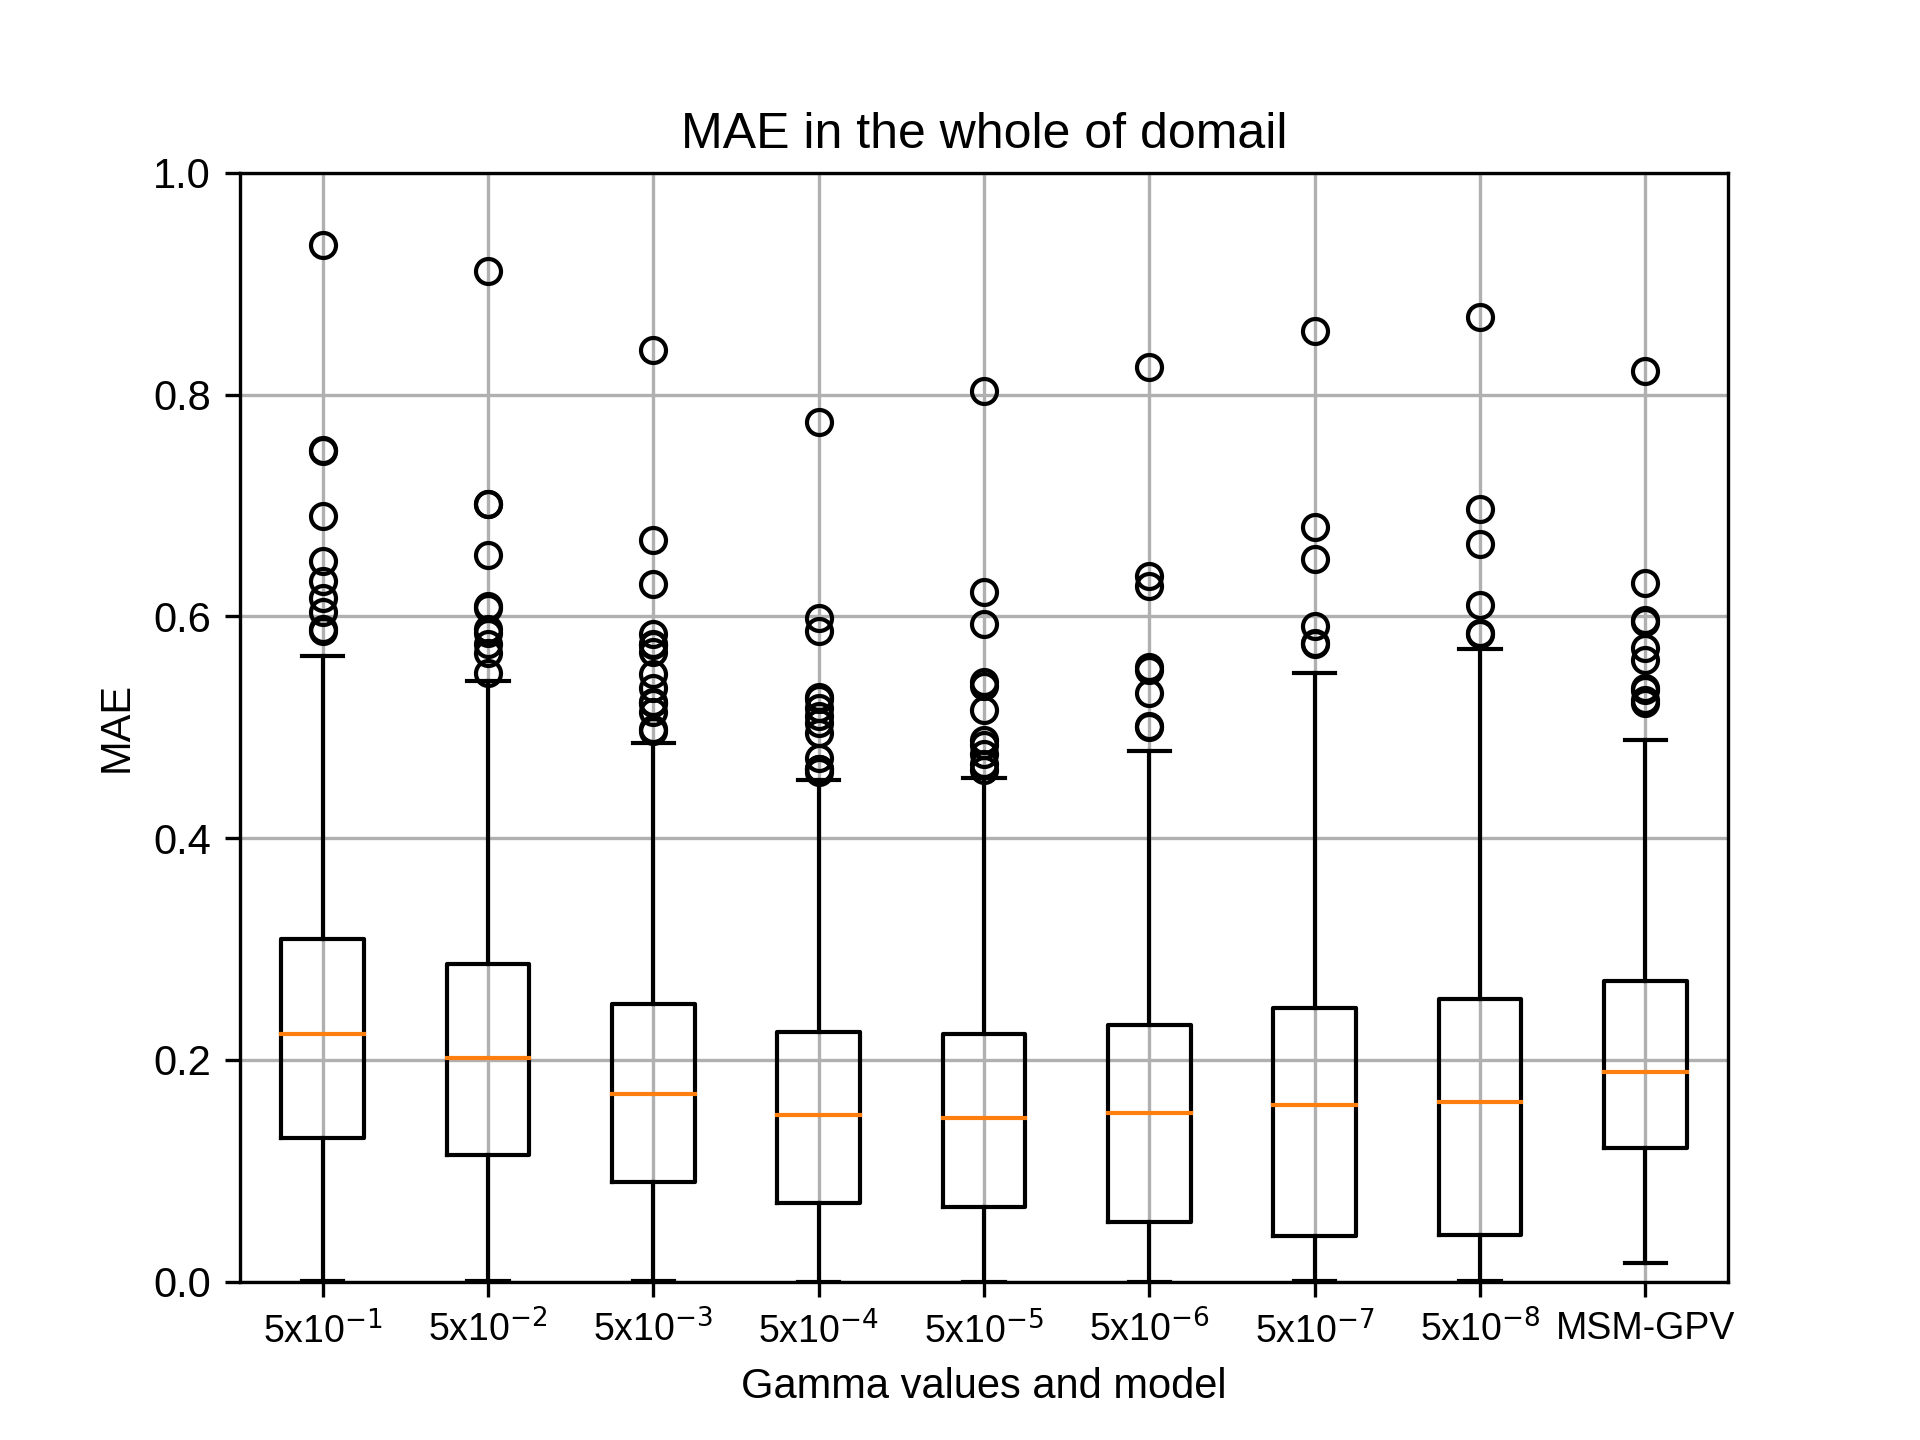
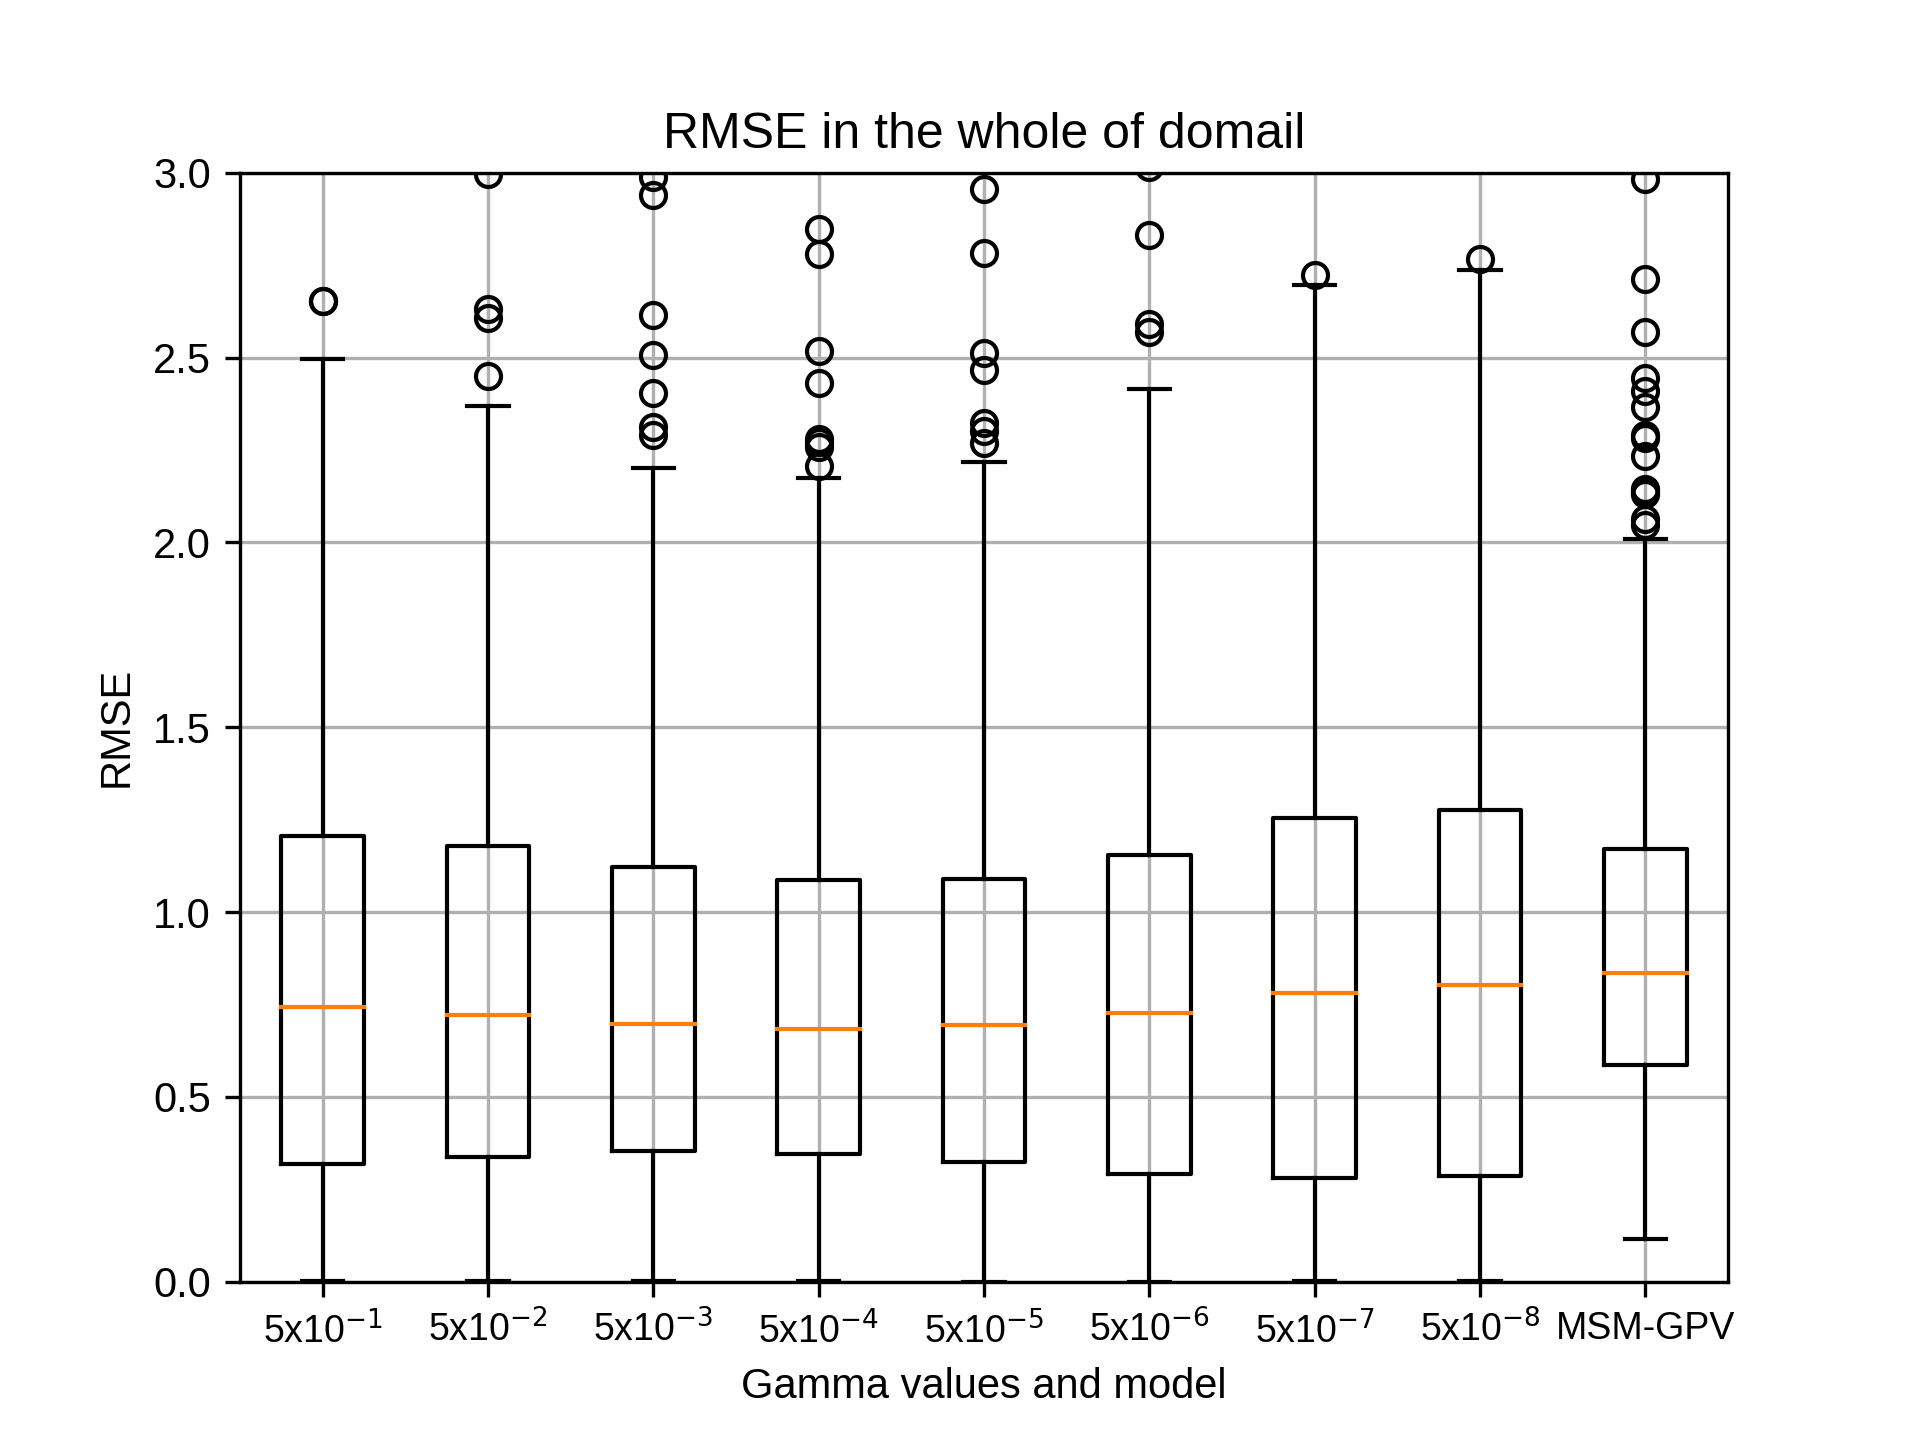
7月のsiteA,rg2=6の結果です。
kobayashi_yusukeThursday, October 22nd, 2020 at 4:30:00 PM GMT+09:00
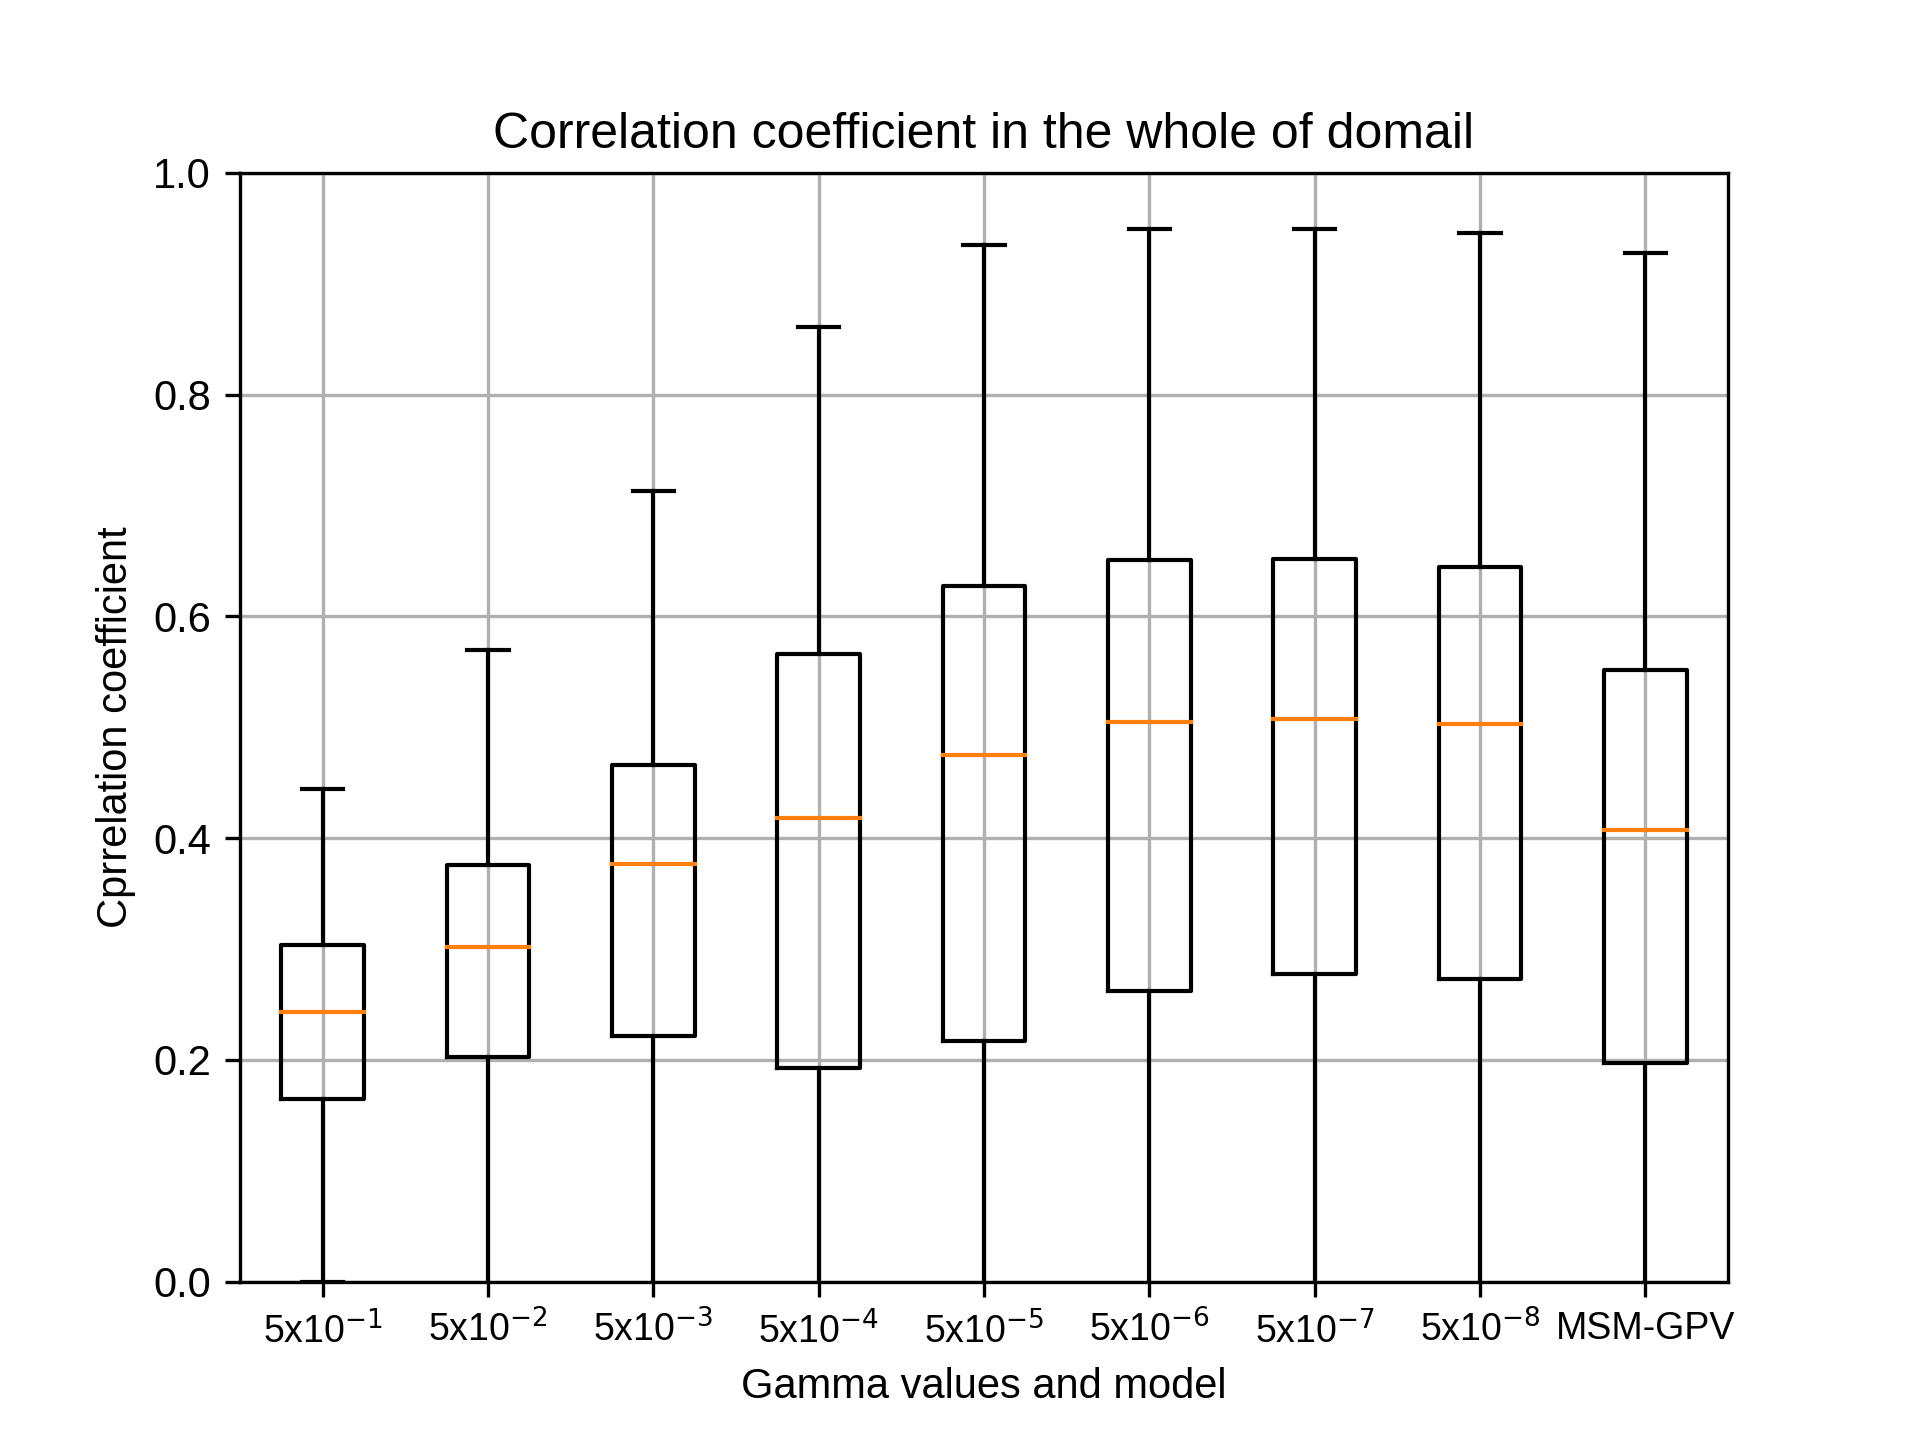
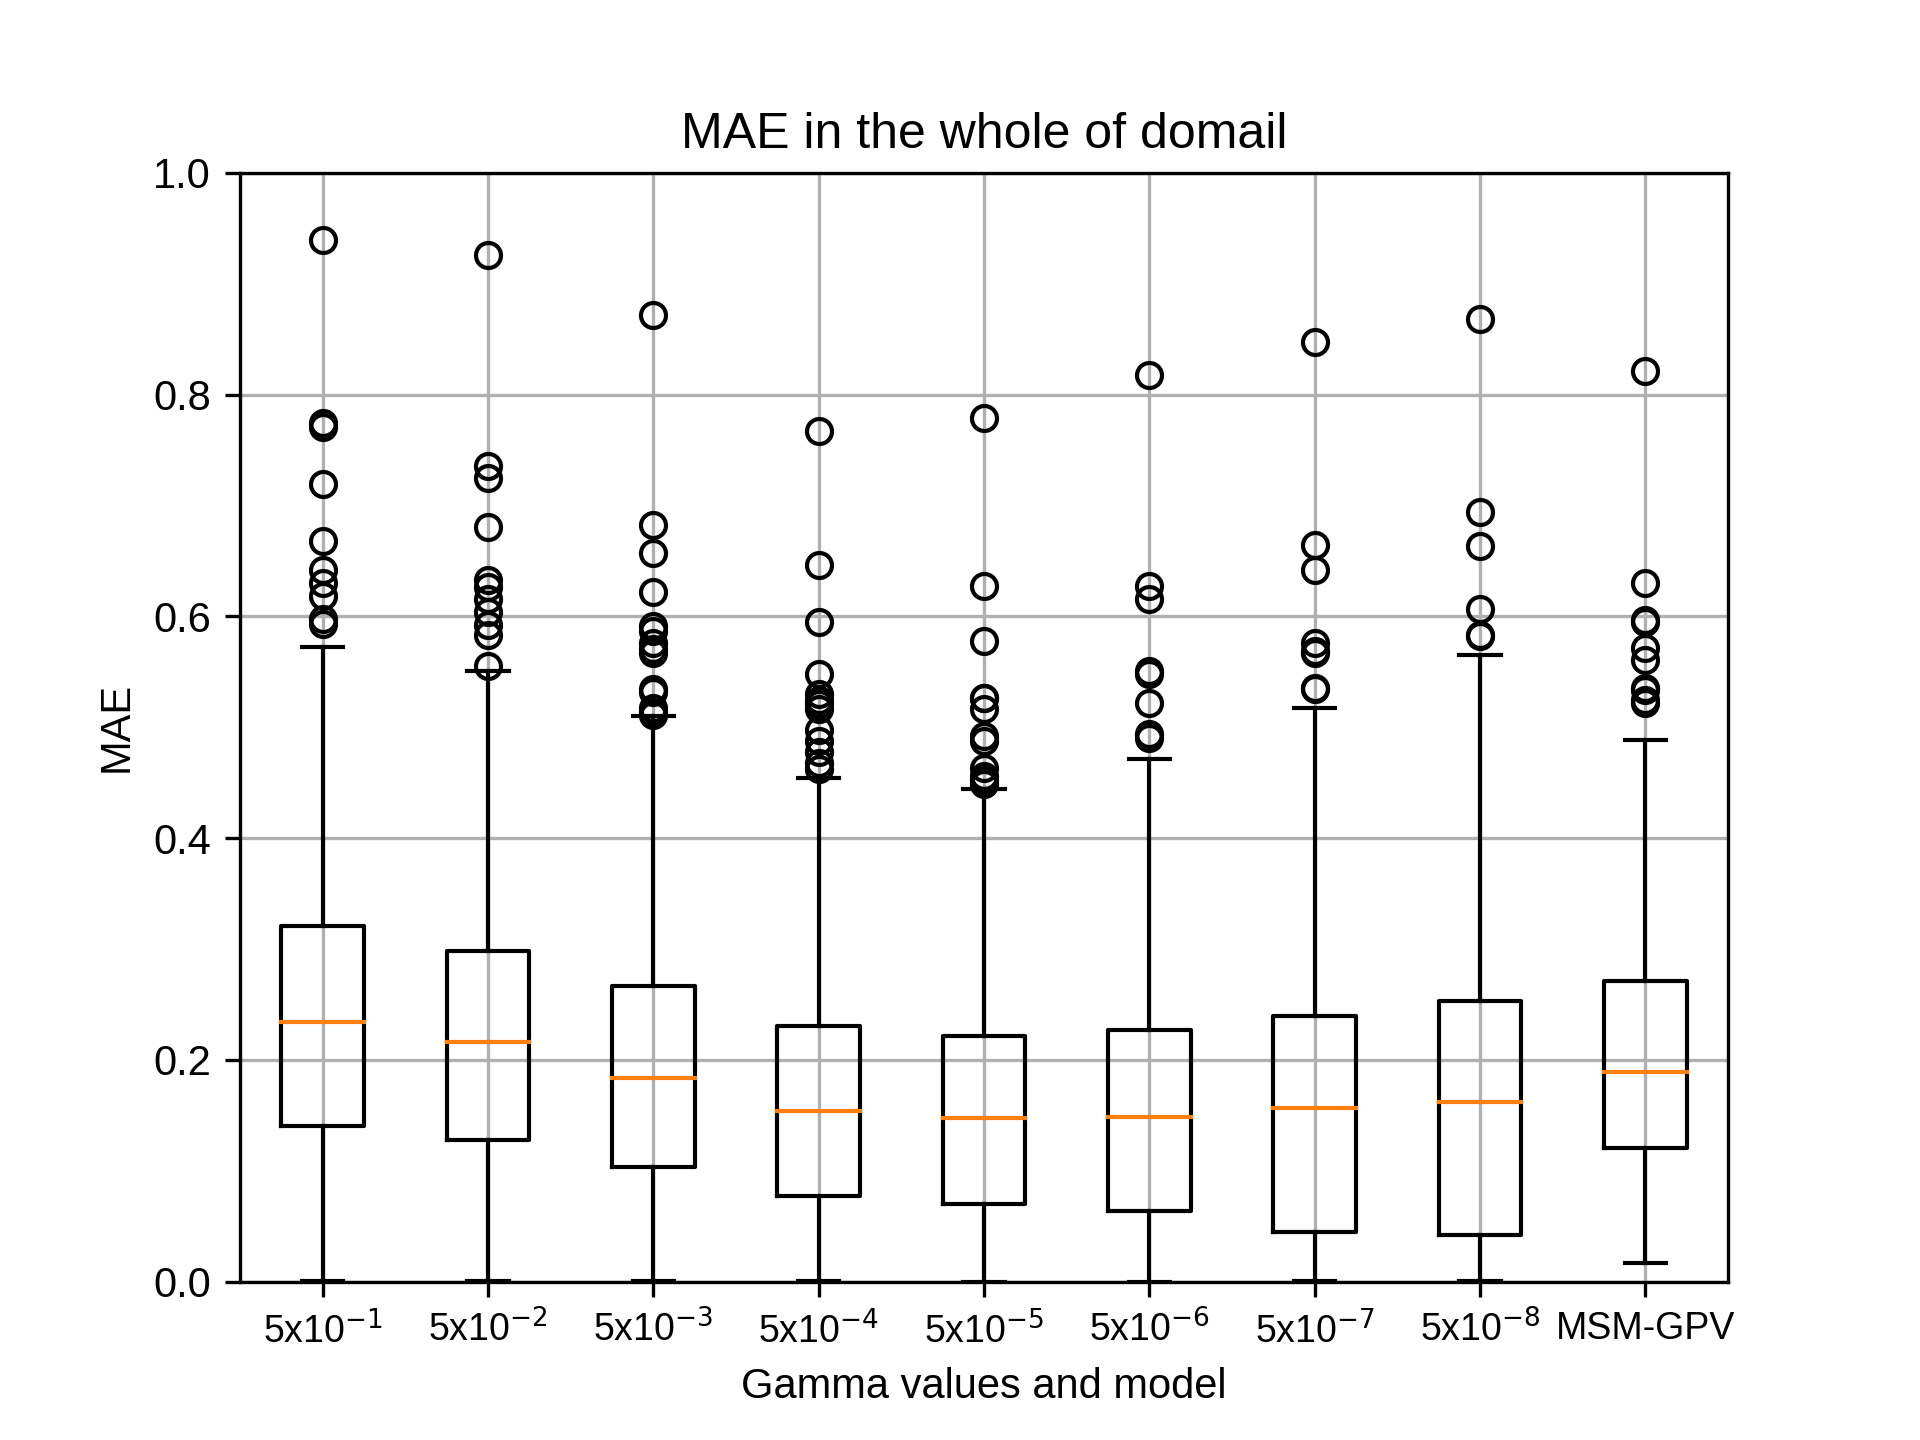
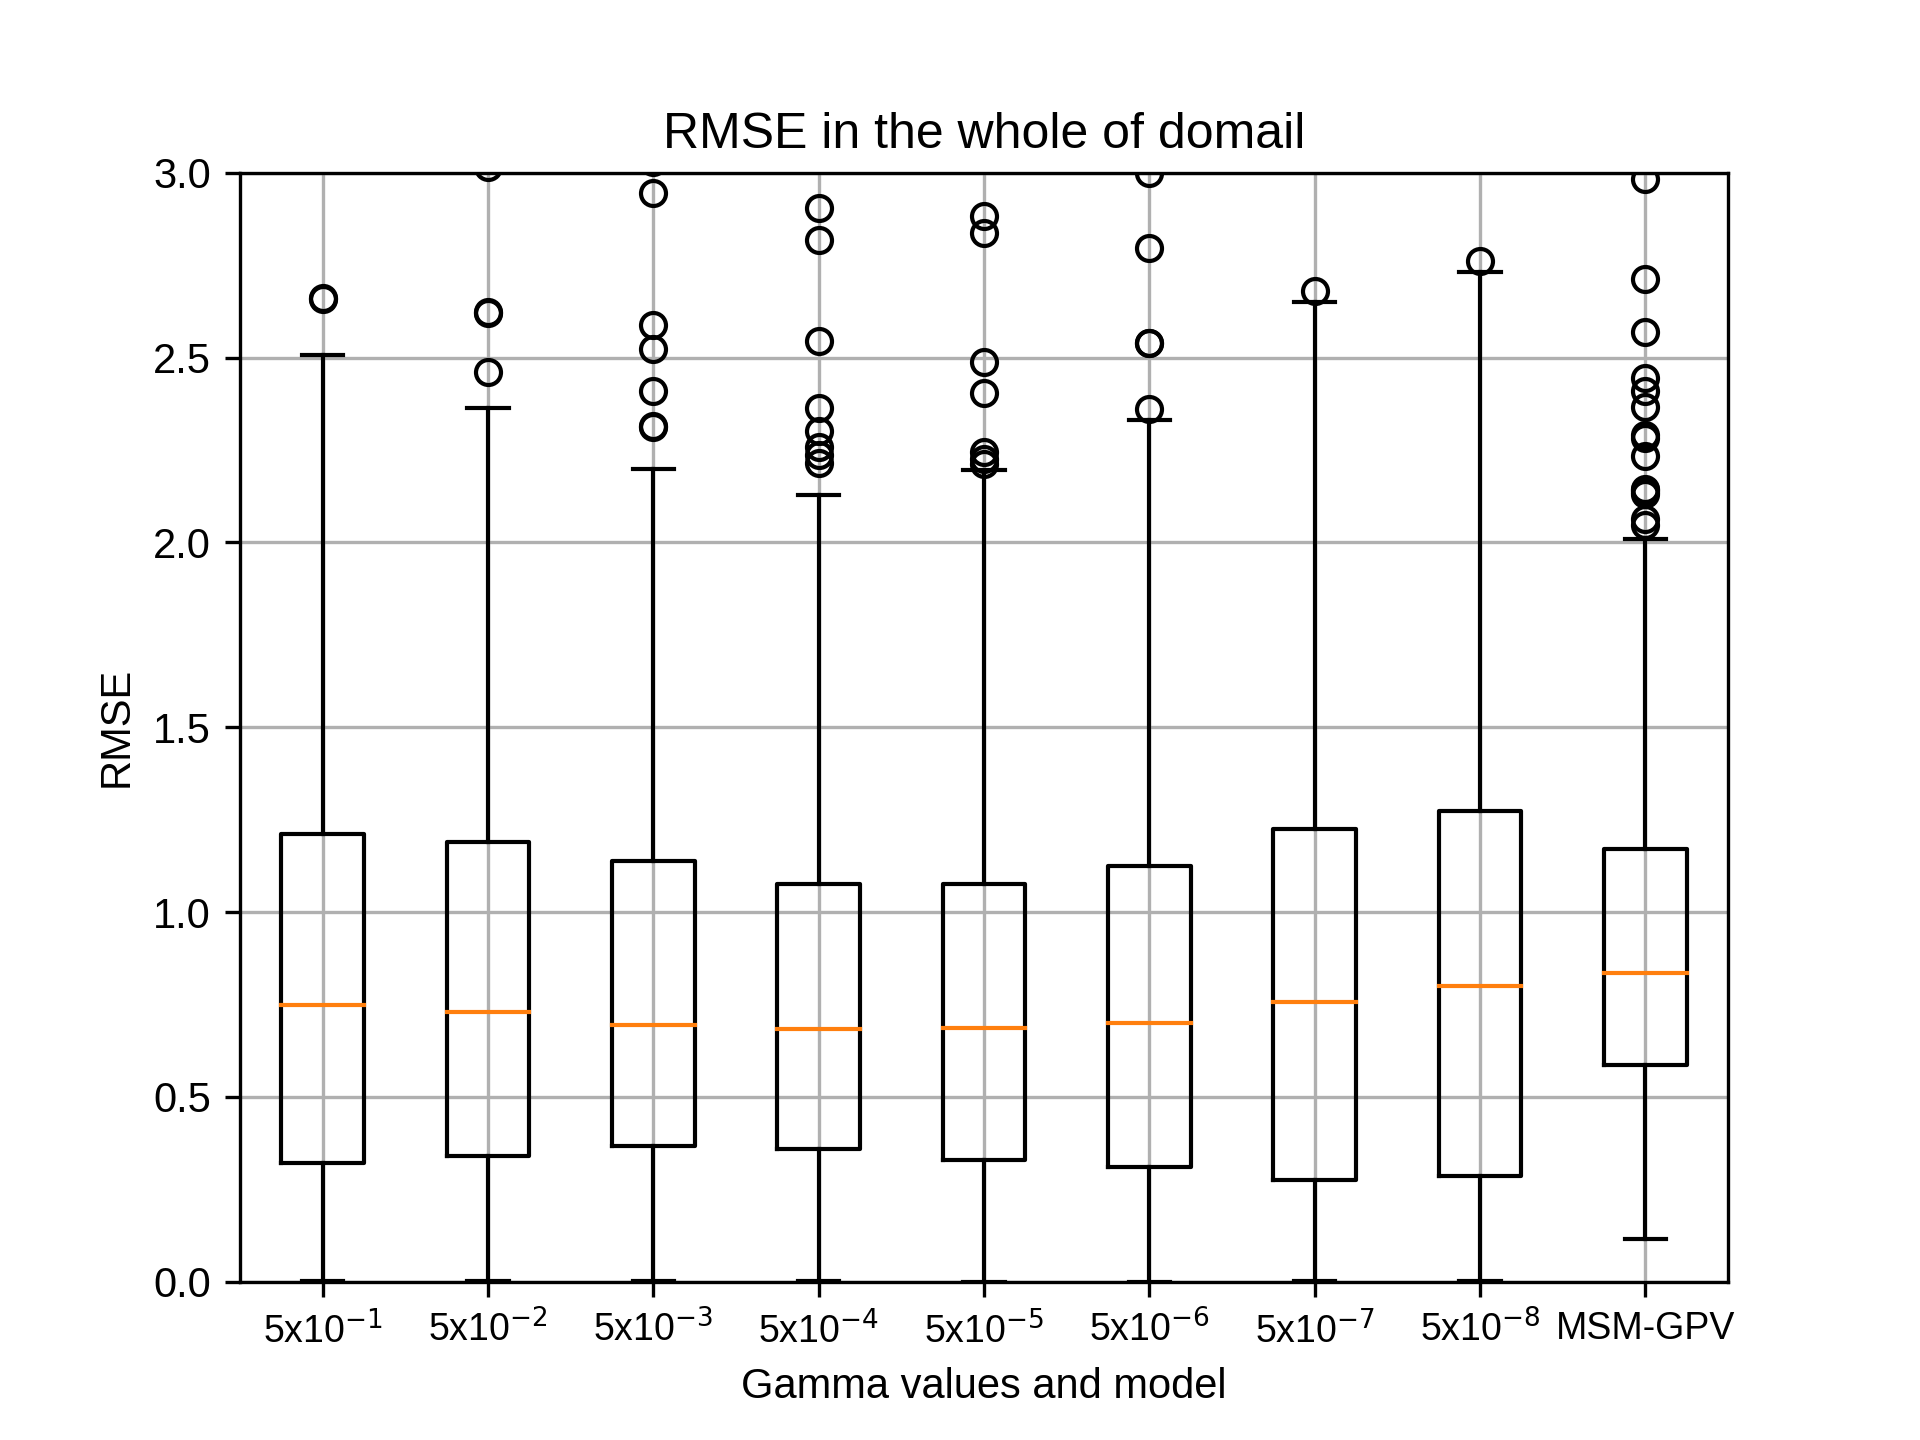
7月のsiteA,rg2=8の結果です。
kobayashi_yusukeThursday, October 22nd, 2020 at 4:30:53 PM GMT+09:00
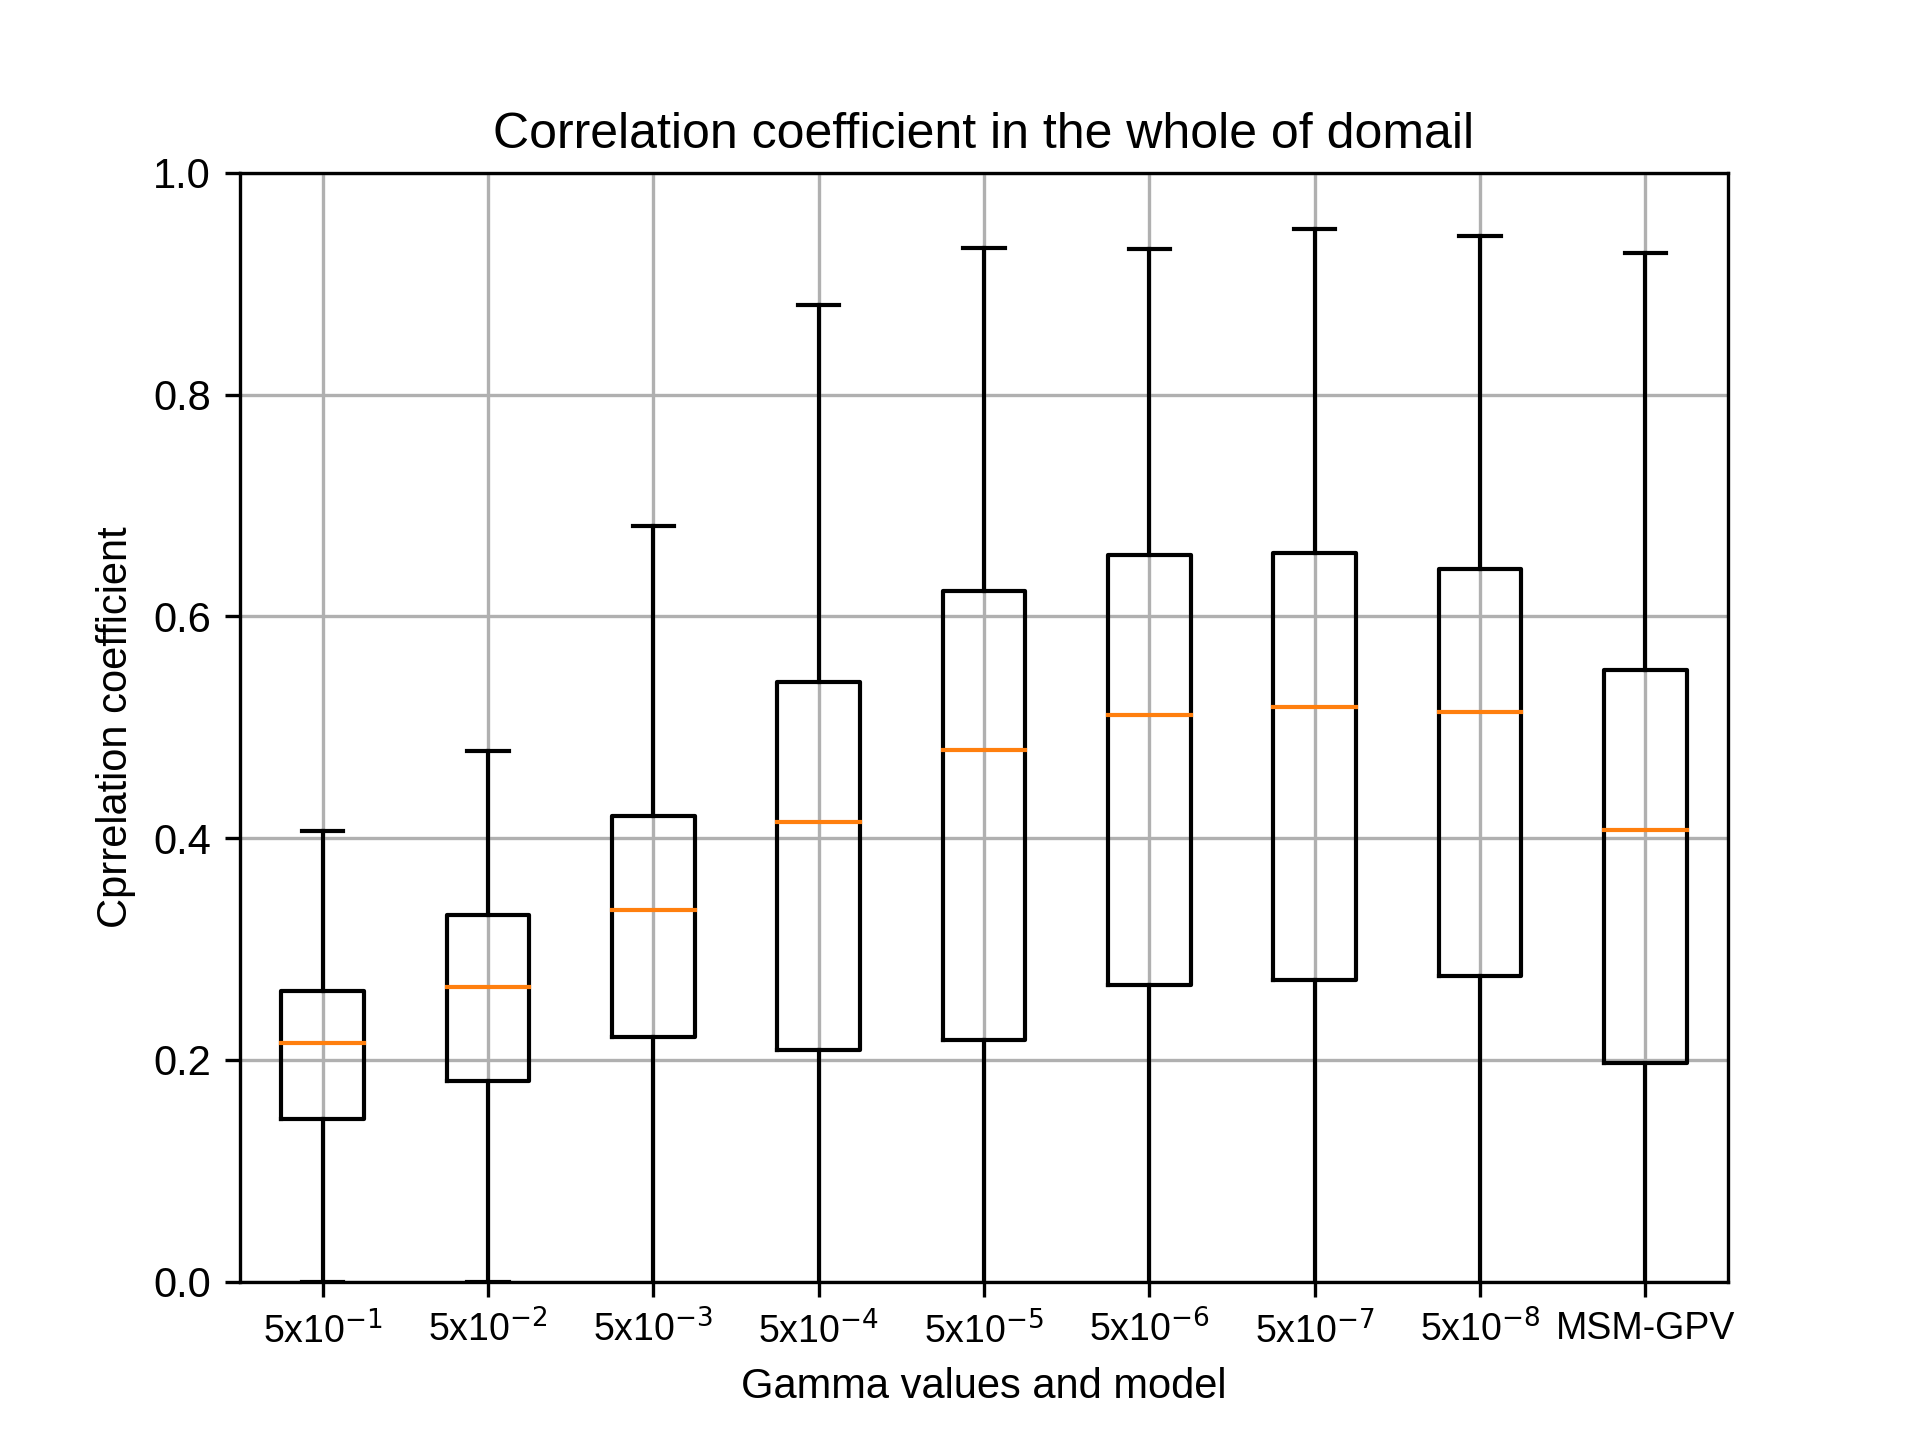
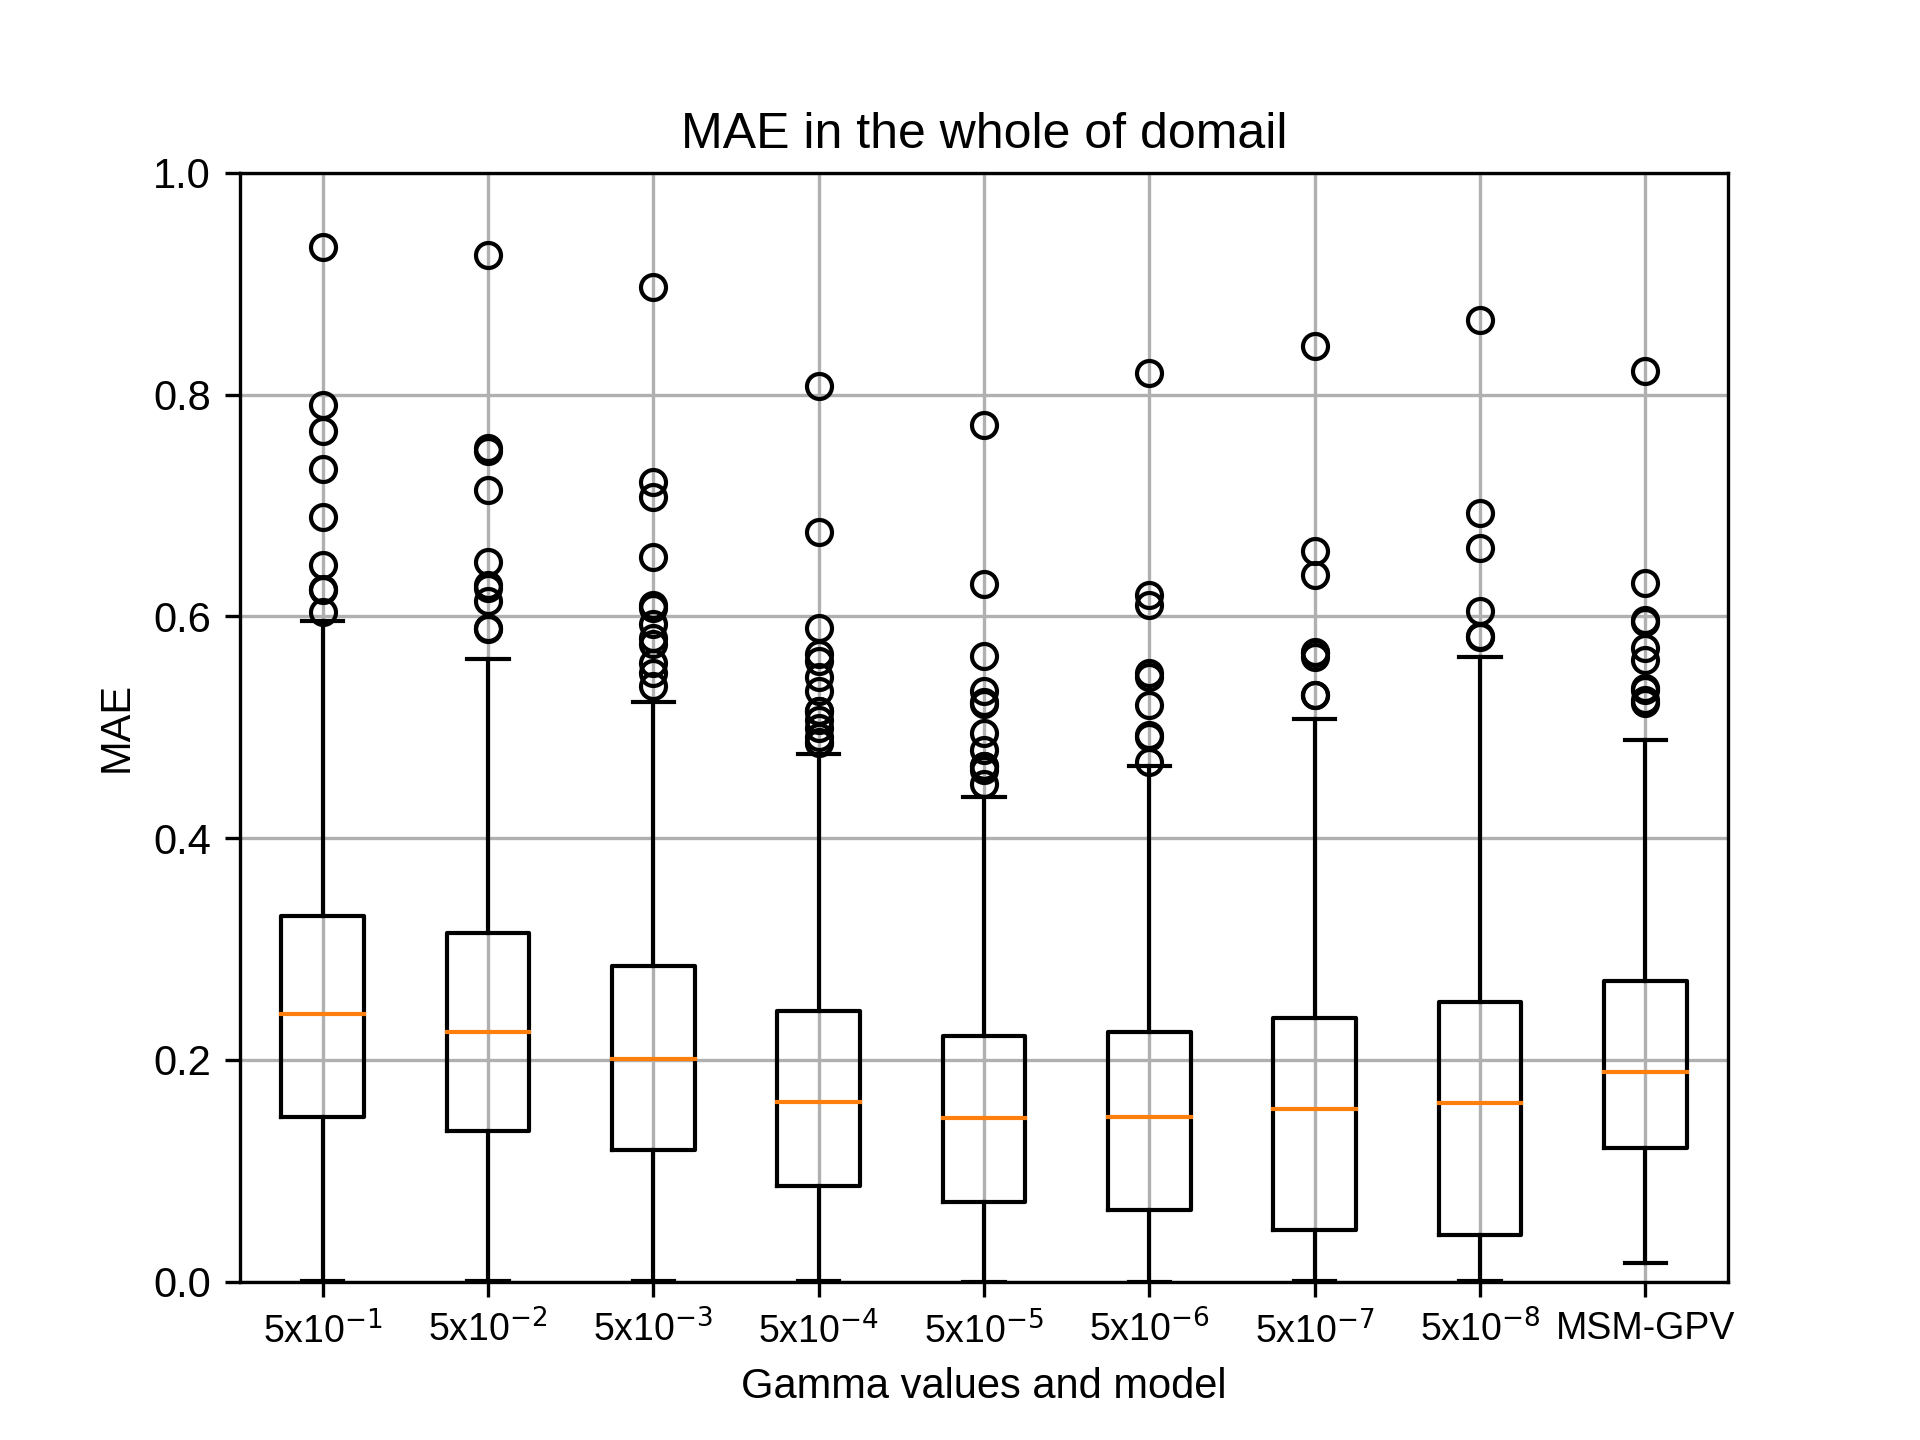
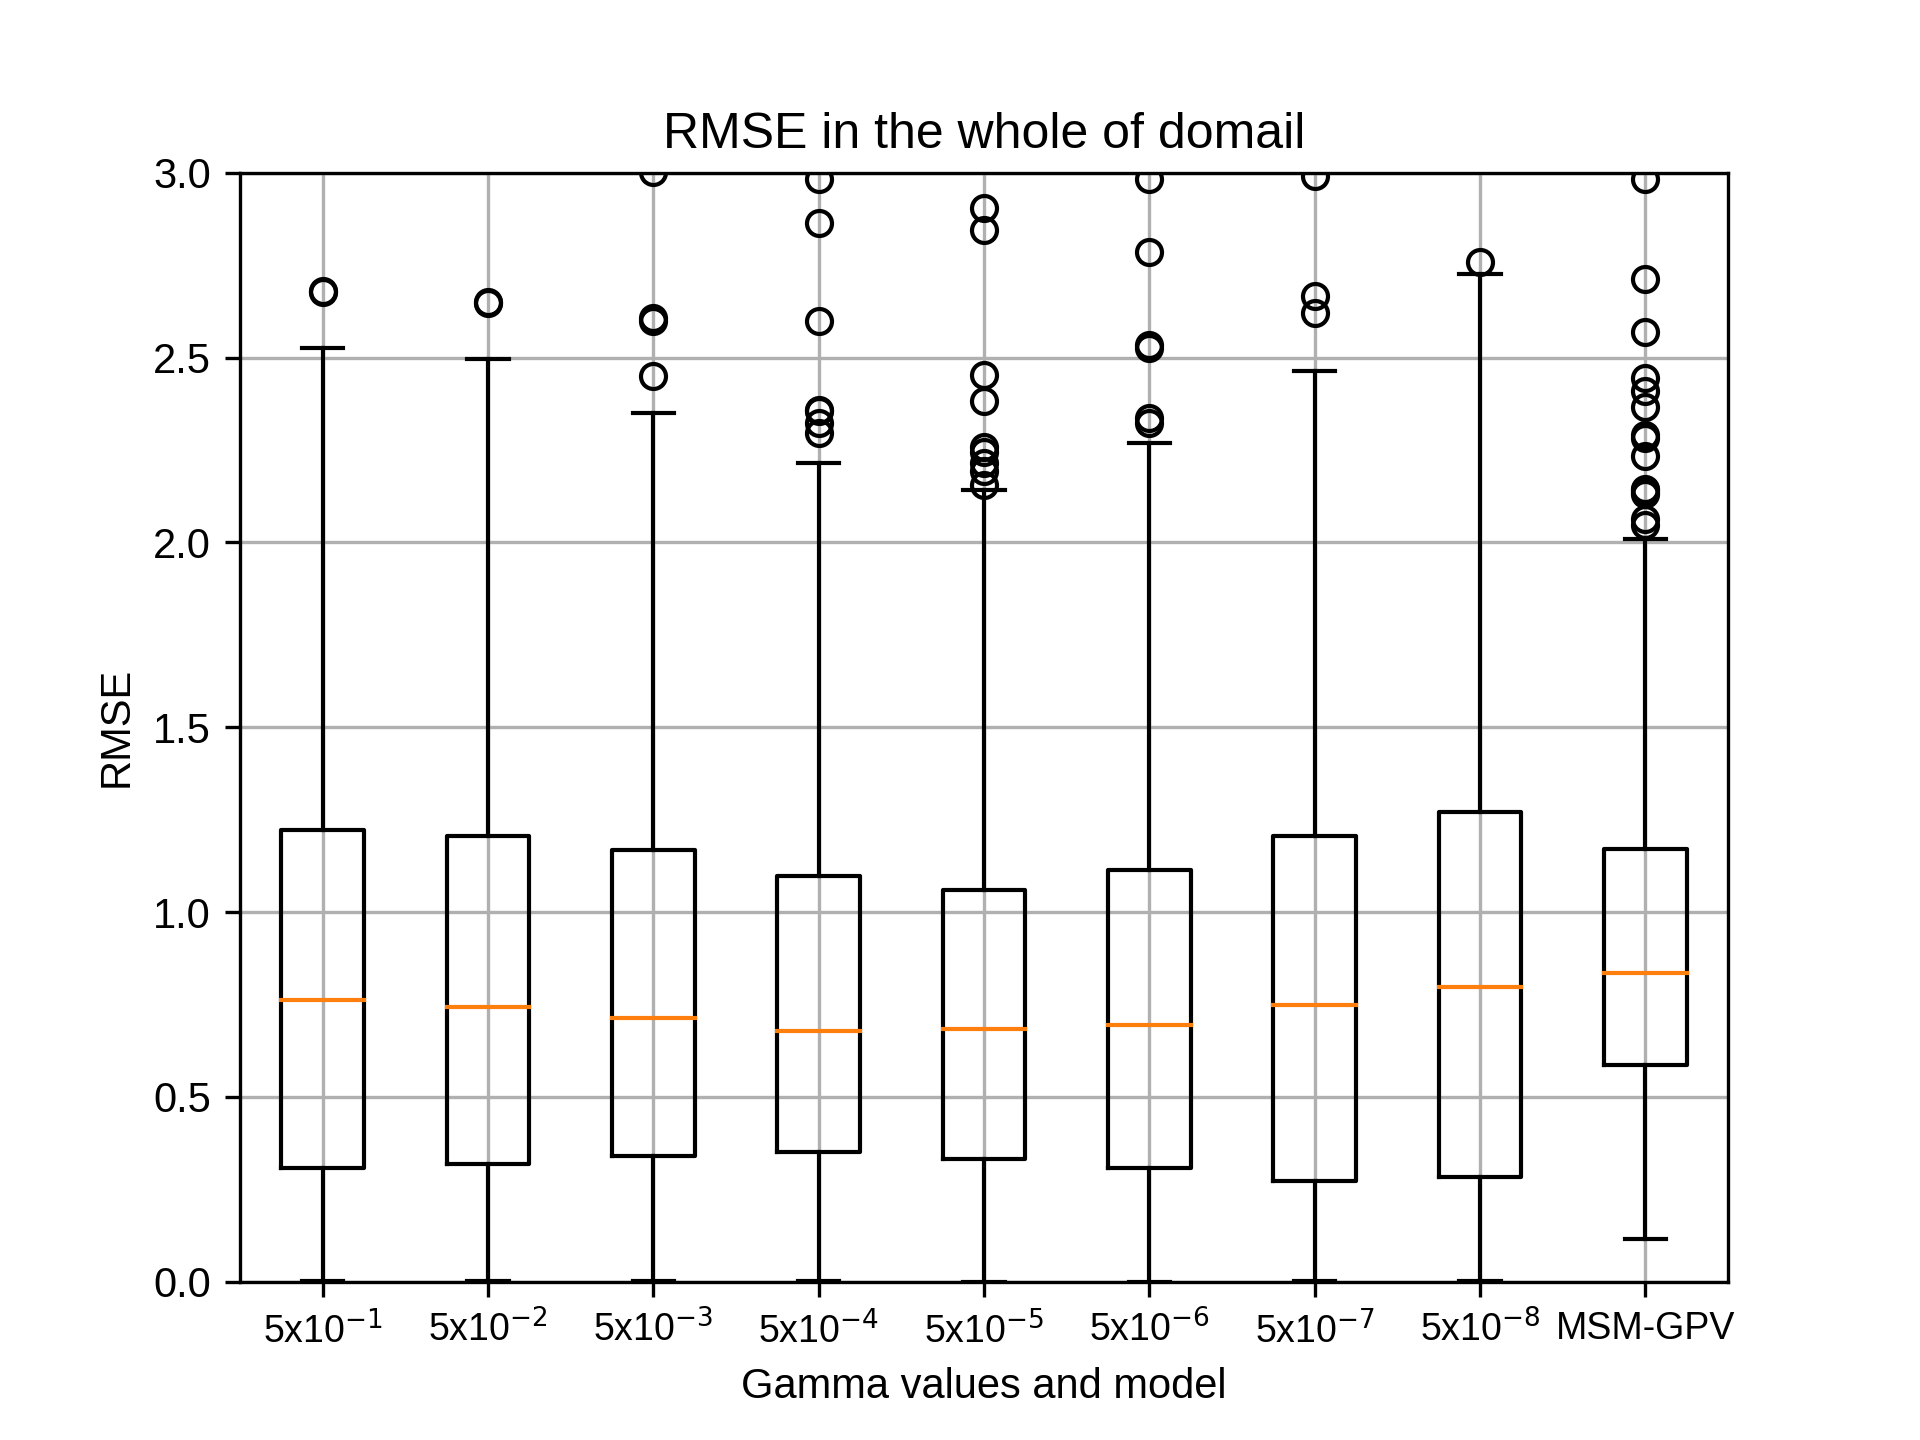
7月のsiteA,rg2=12の結果です。
7月のsiteAではrg2=12でgammaが5x10⁻⁷のとき、相関係数の中央値が最も高くなりました。
7月のsiteAではrg2=12でgammaが5x10⁻⁷のとき、相関係数の中央値が最も高くなりました。
kobayashi_yusukeThursday, October 22nd, 2020 at 4:31:11 PM GMT+09:00
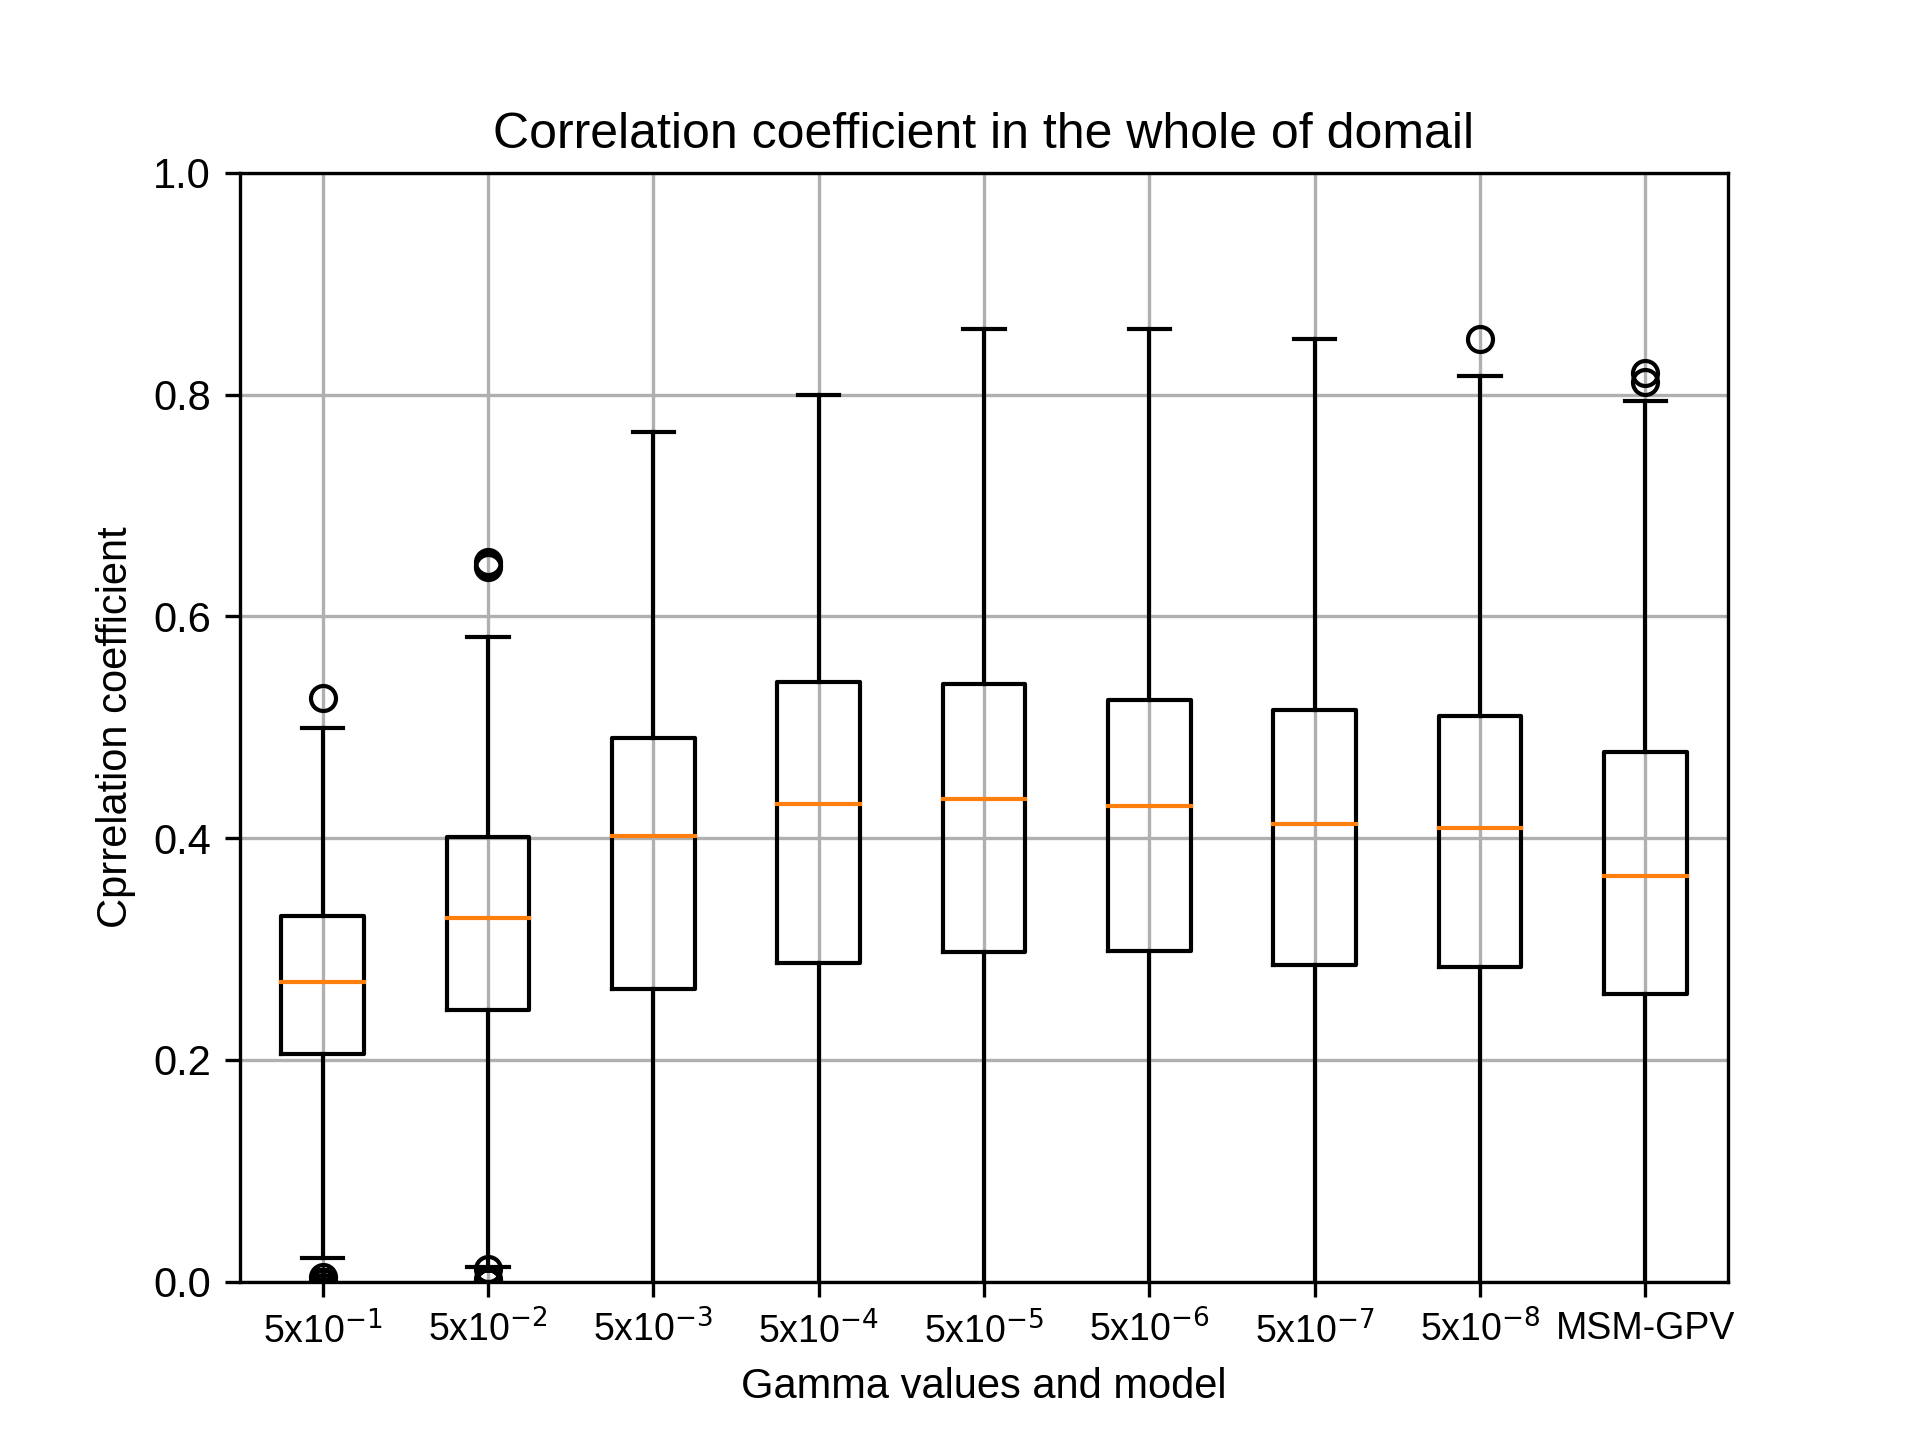
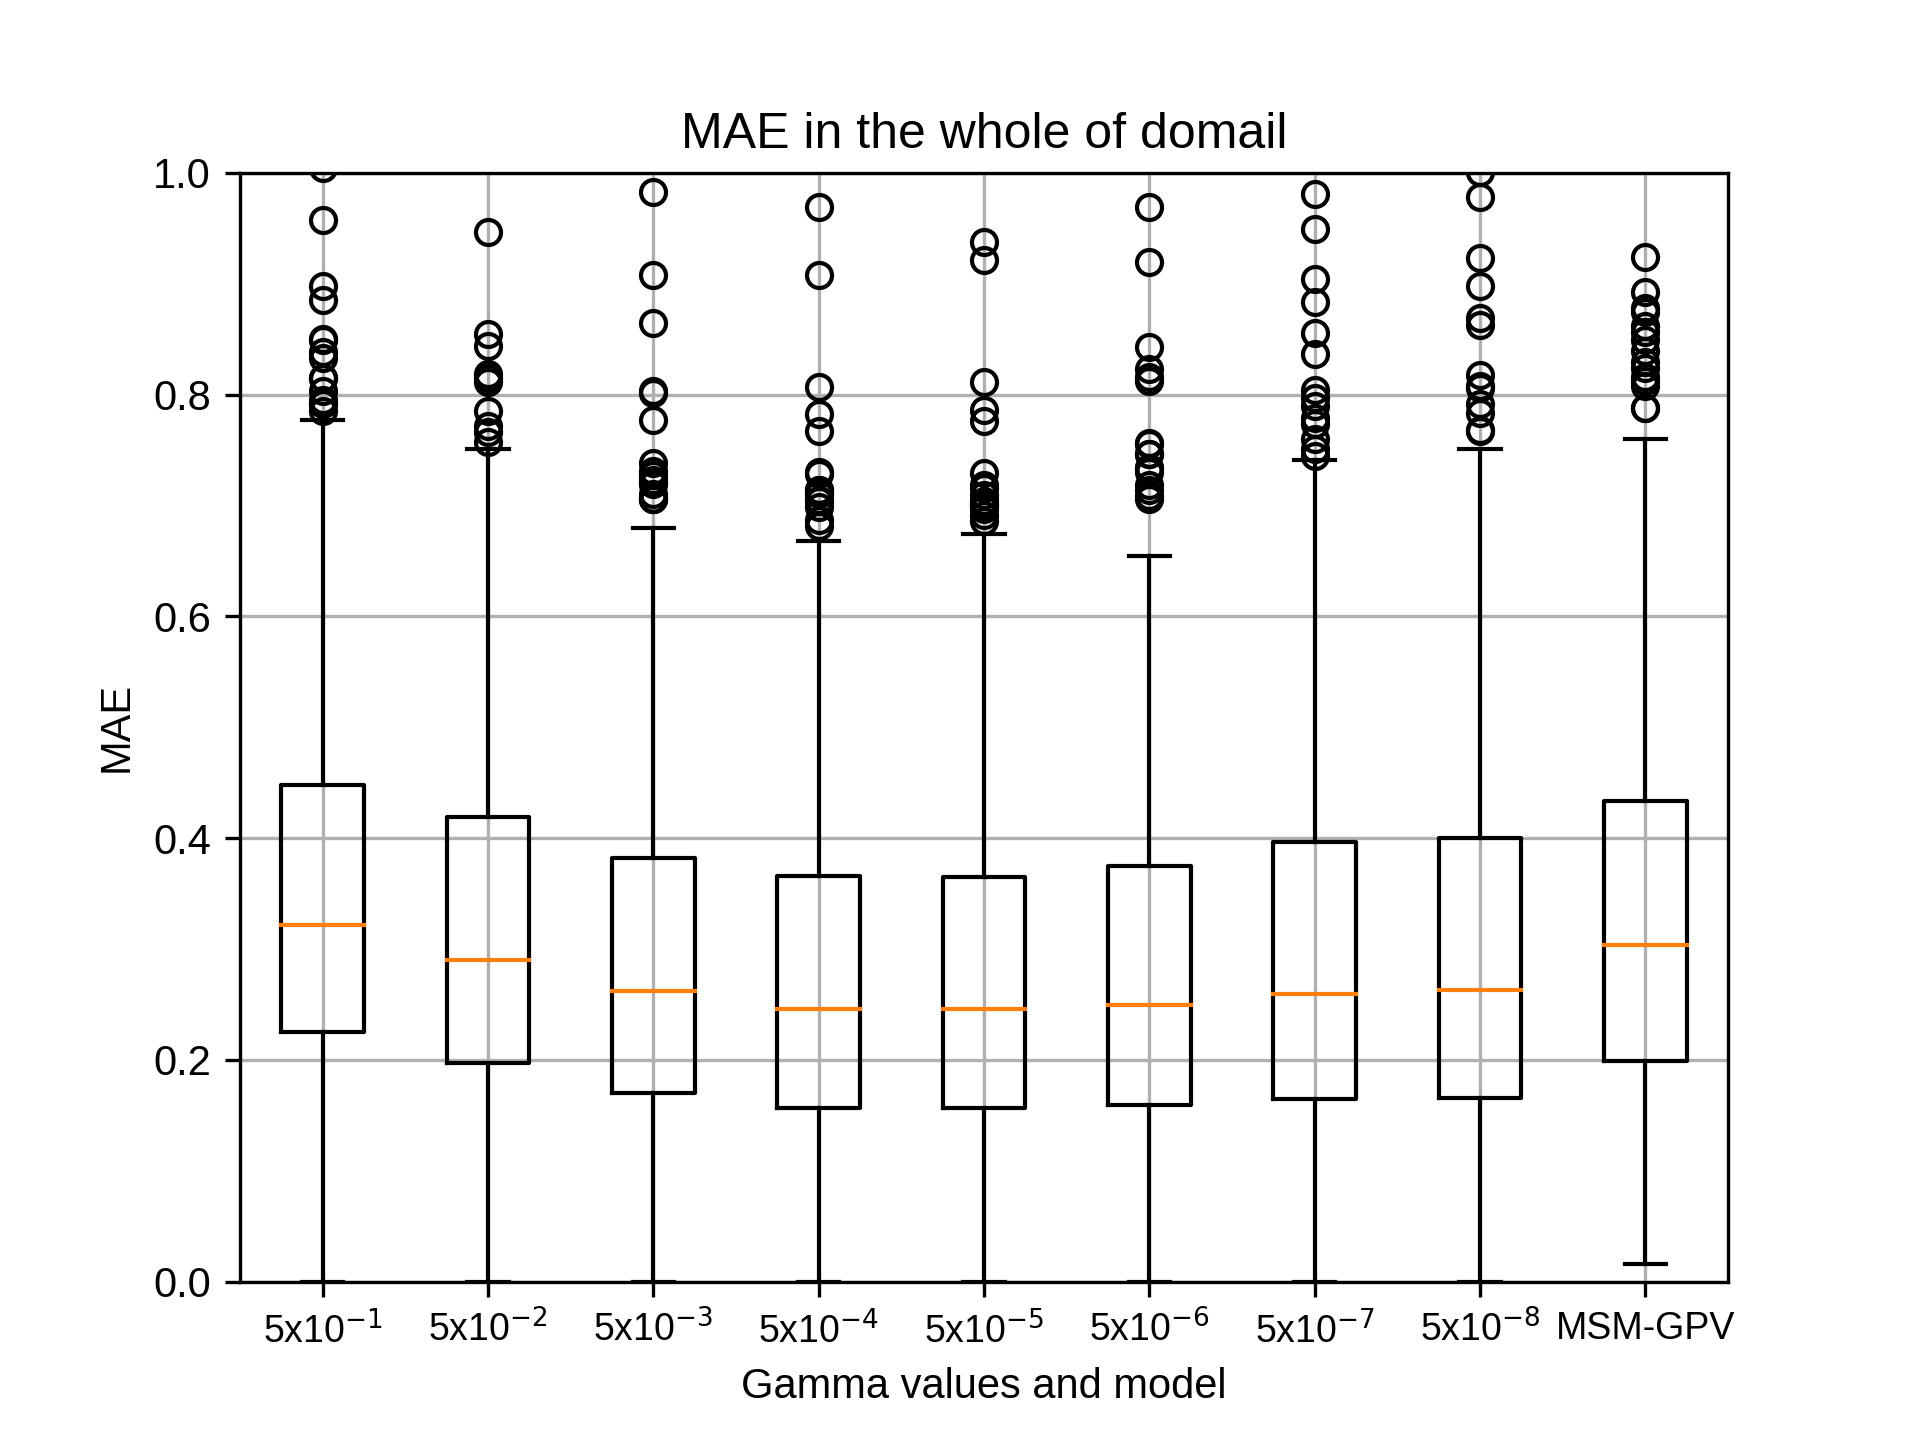
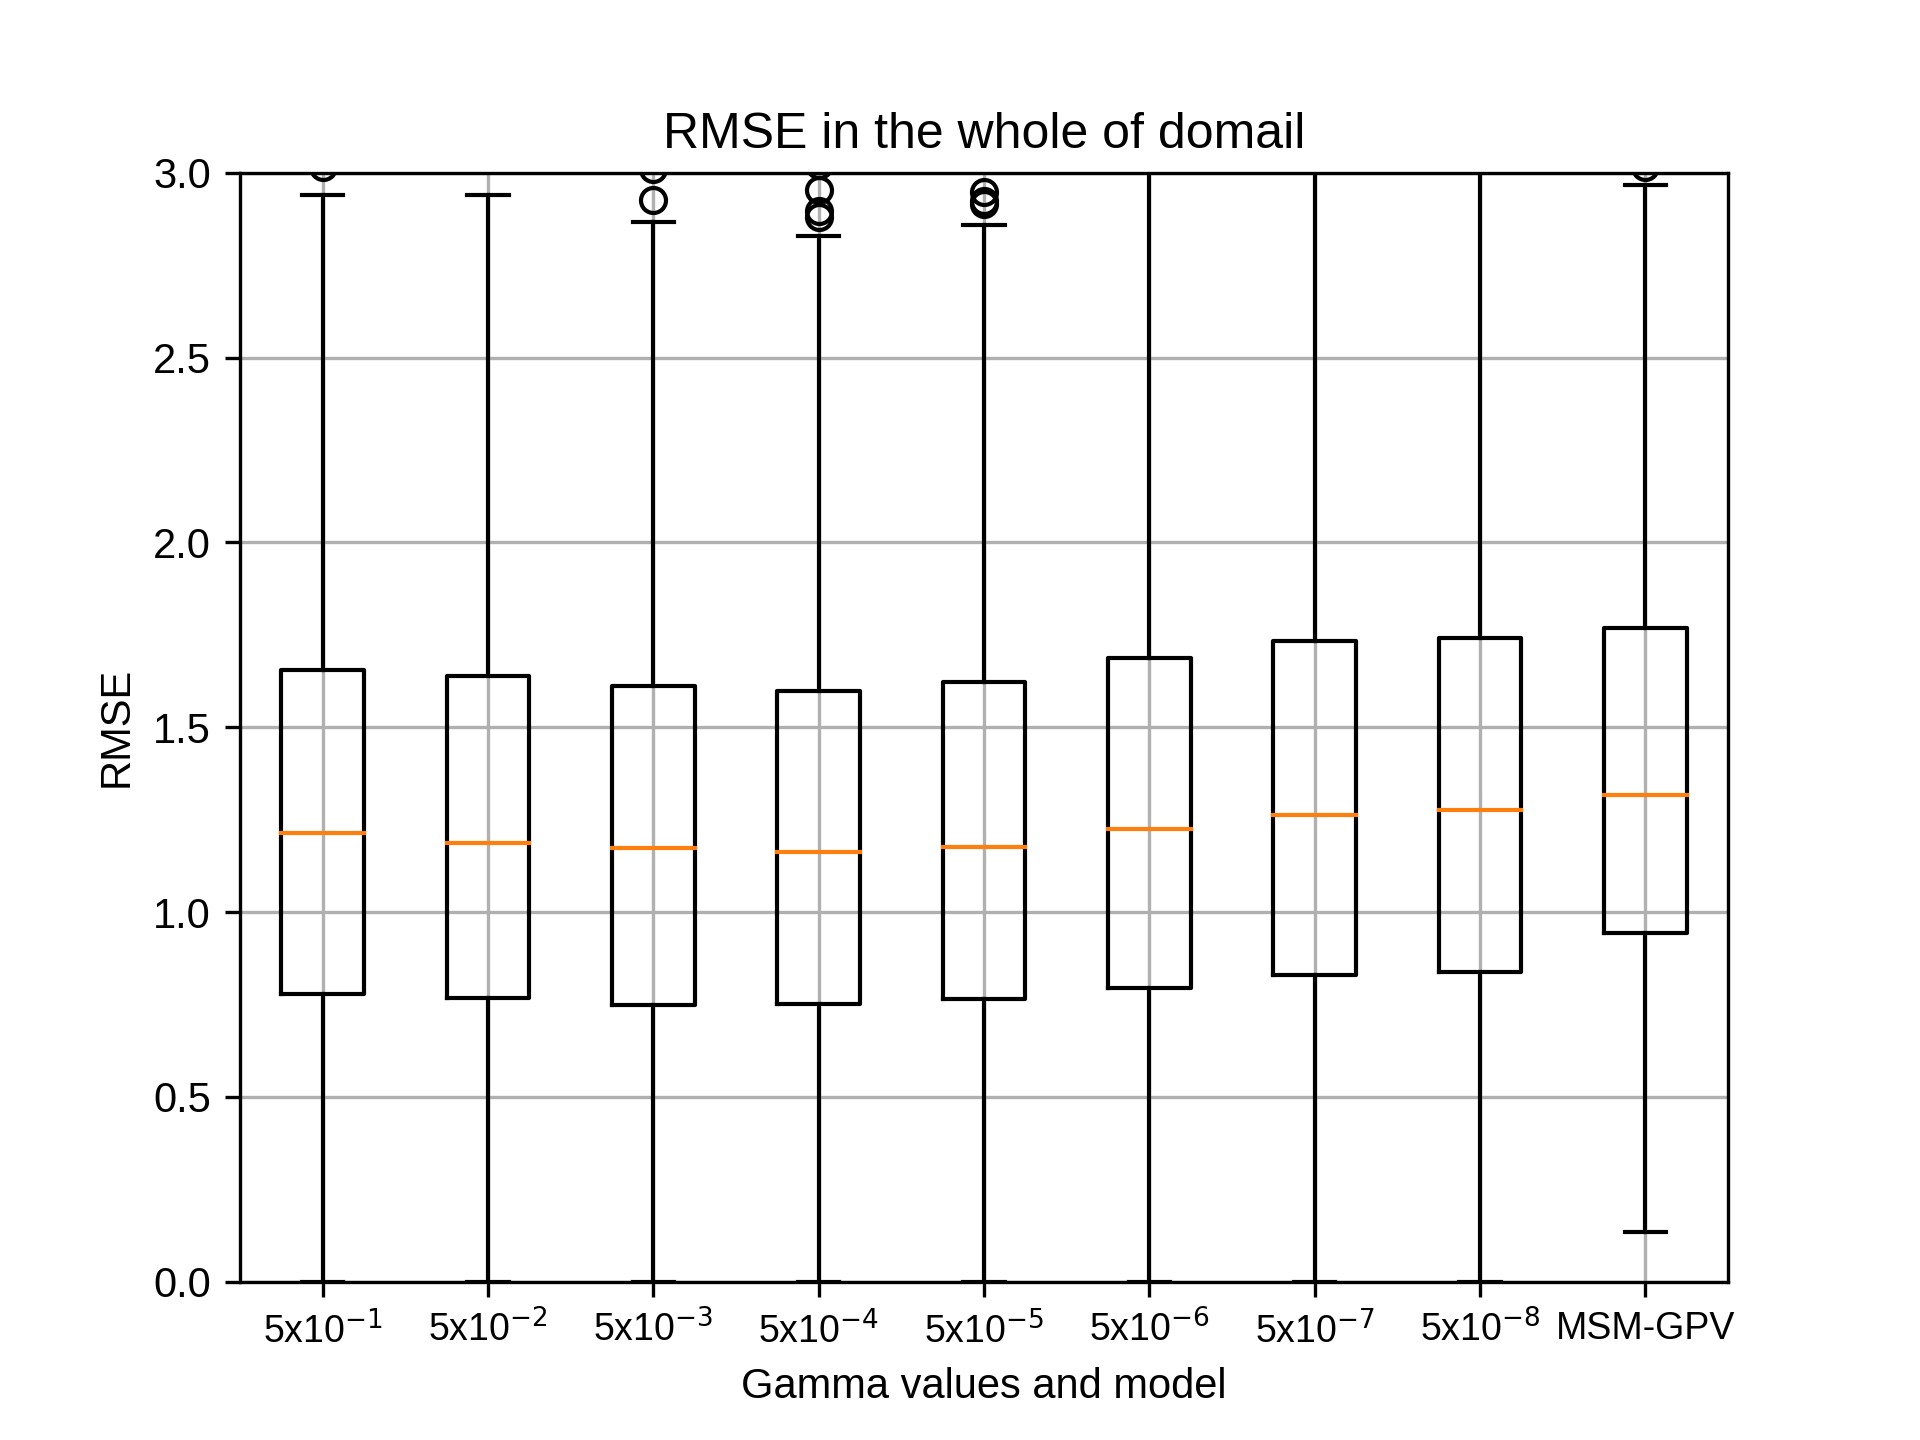
7月のsiteB,rg2=4の結果です。
kobayashi_yusukeThursday, October 22nd, 2020 at 4:31:30 PM GMT+09:00

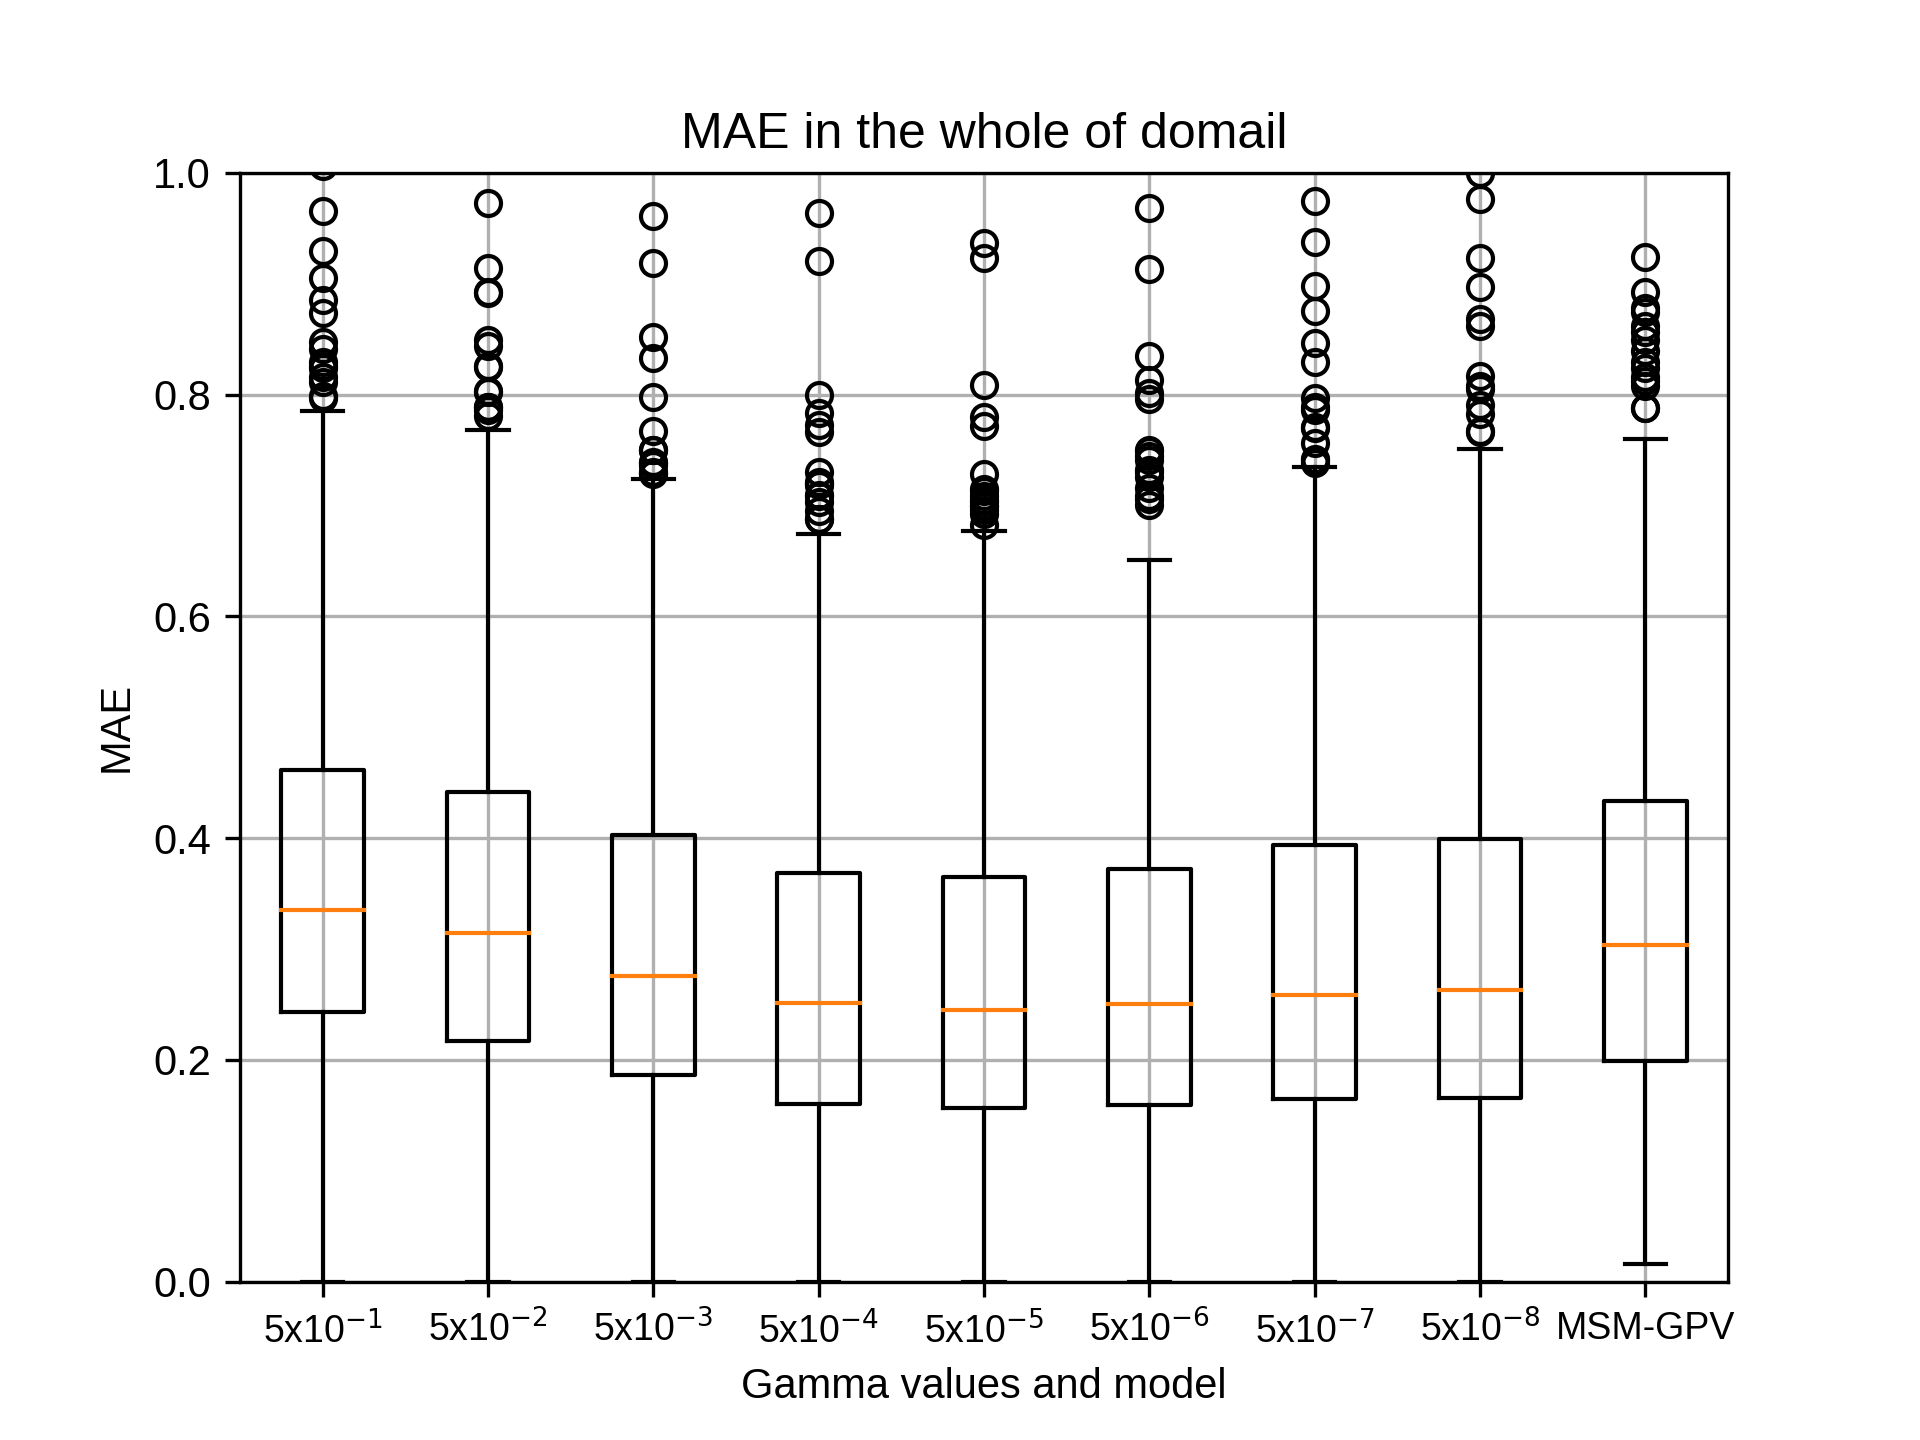

7月のsiteB,rg2=6の結果です。
kobayashi_yusukeThursday, October 22nd, 2020 at 4:31:51 PM GMT+09:00
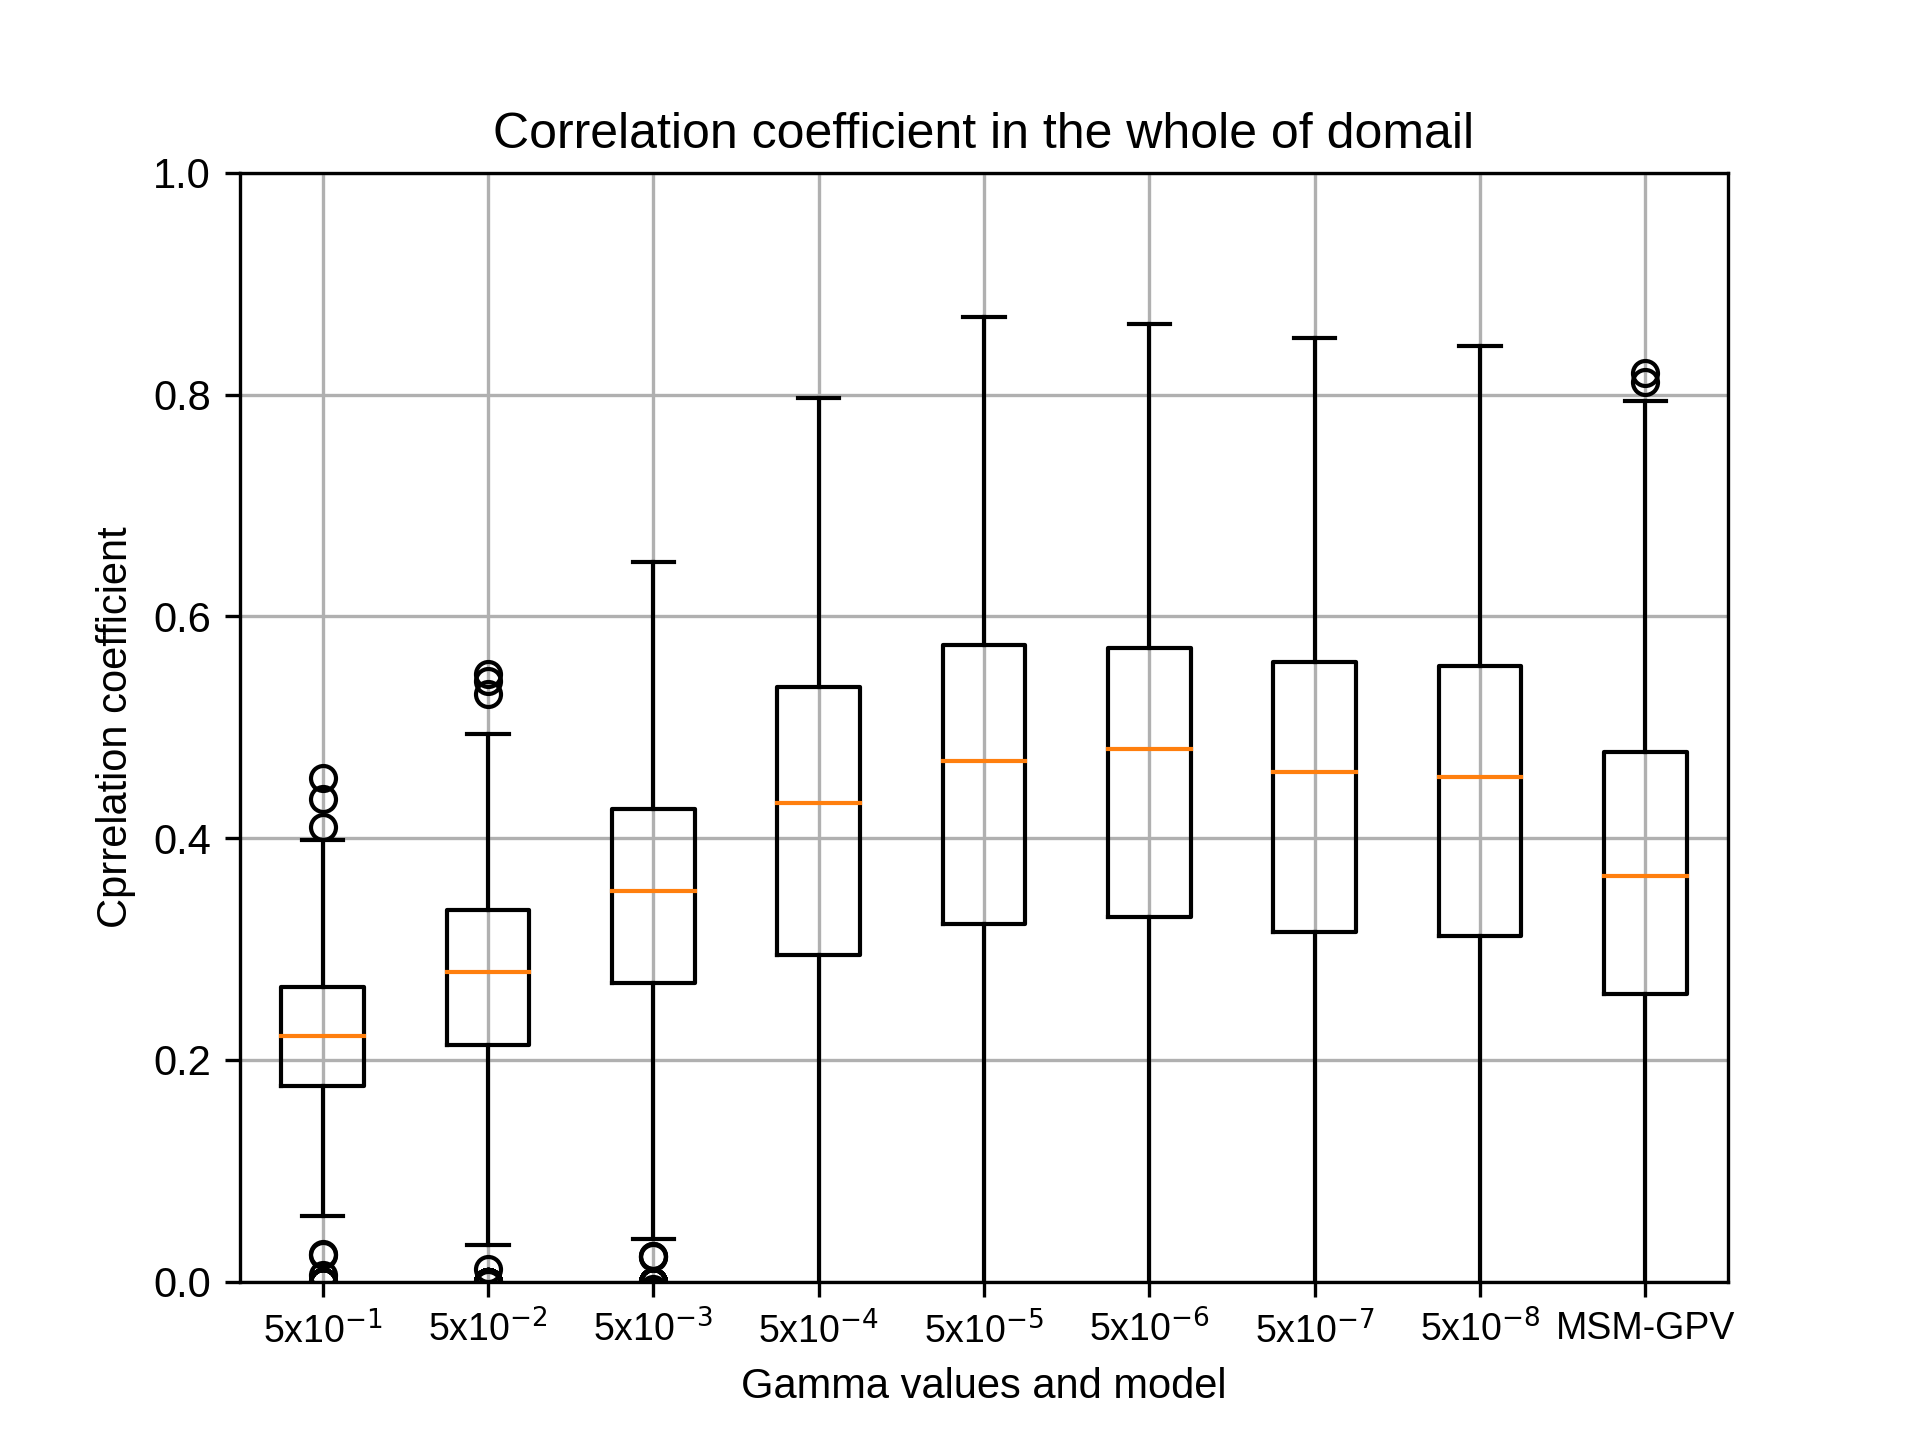
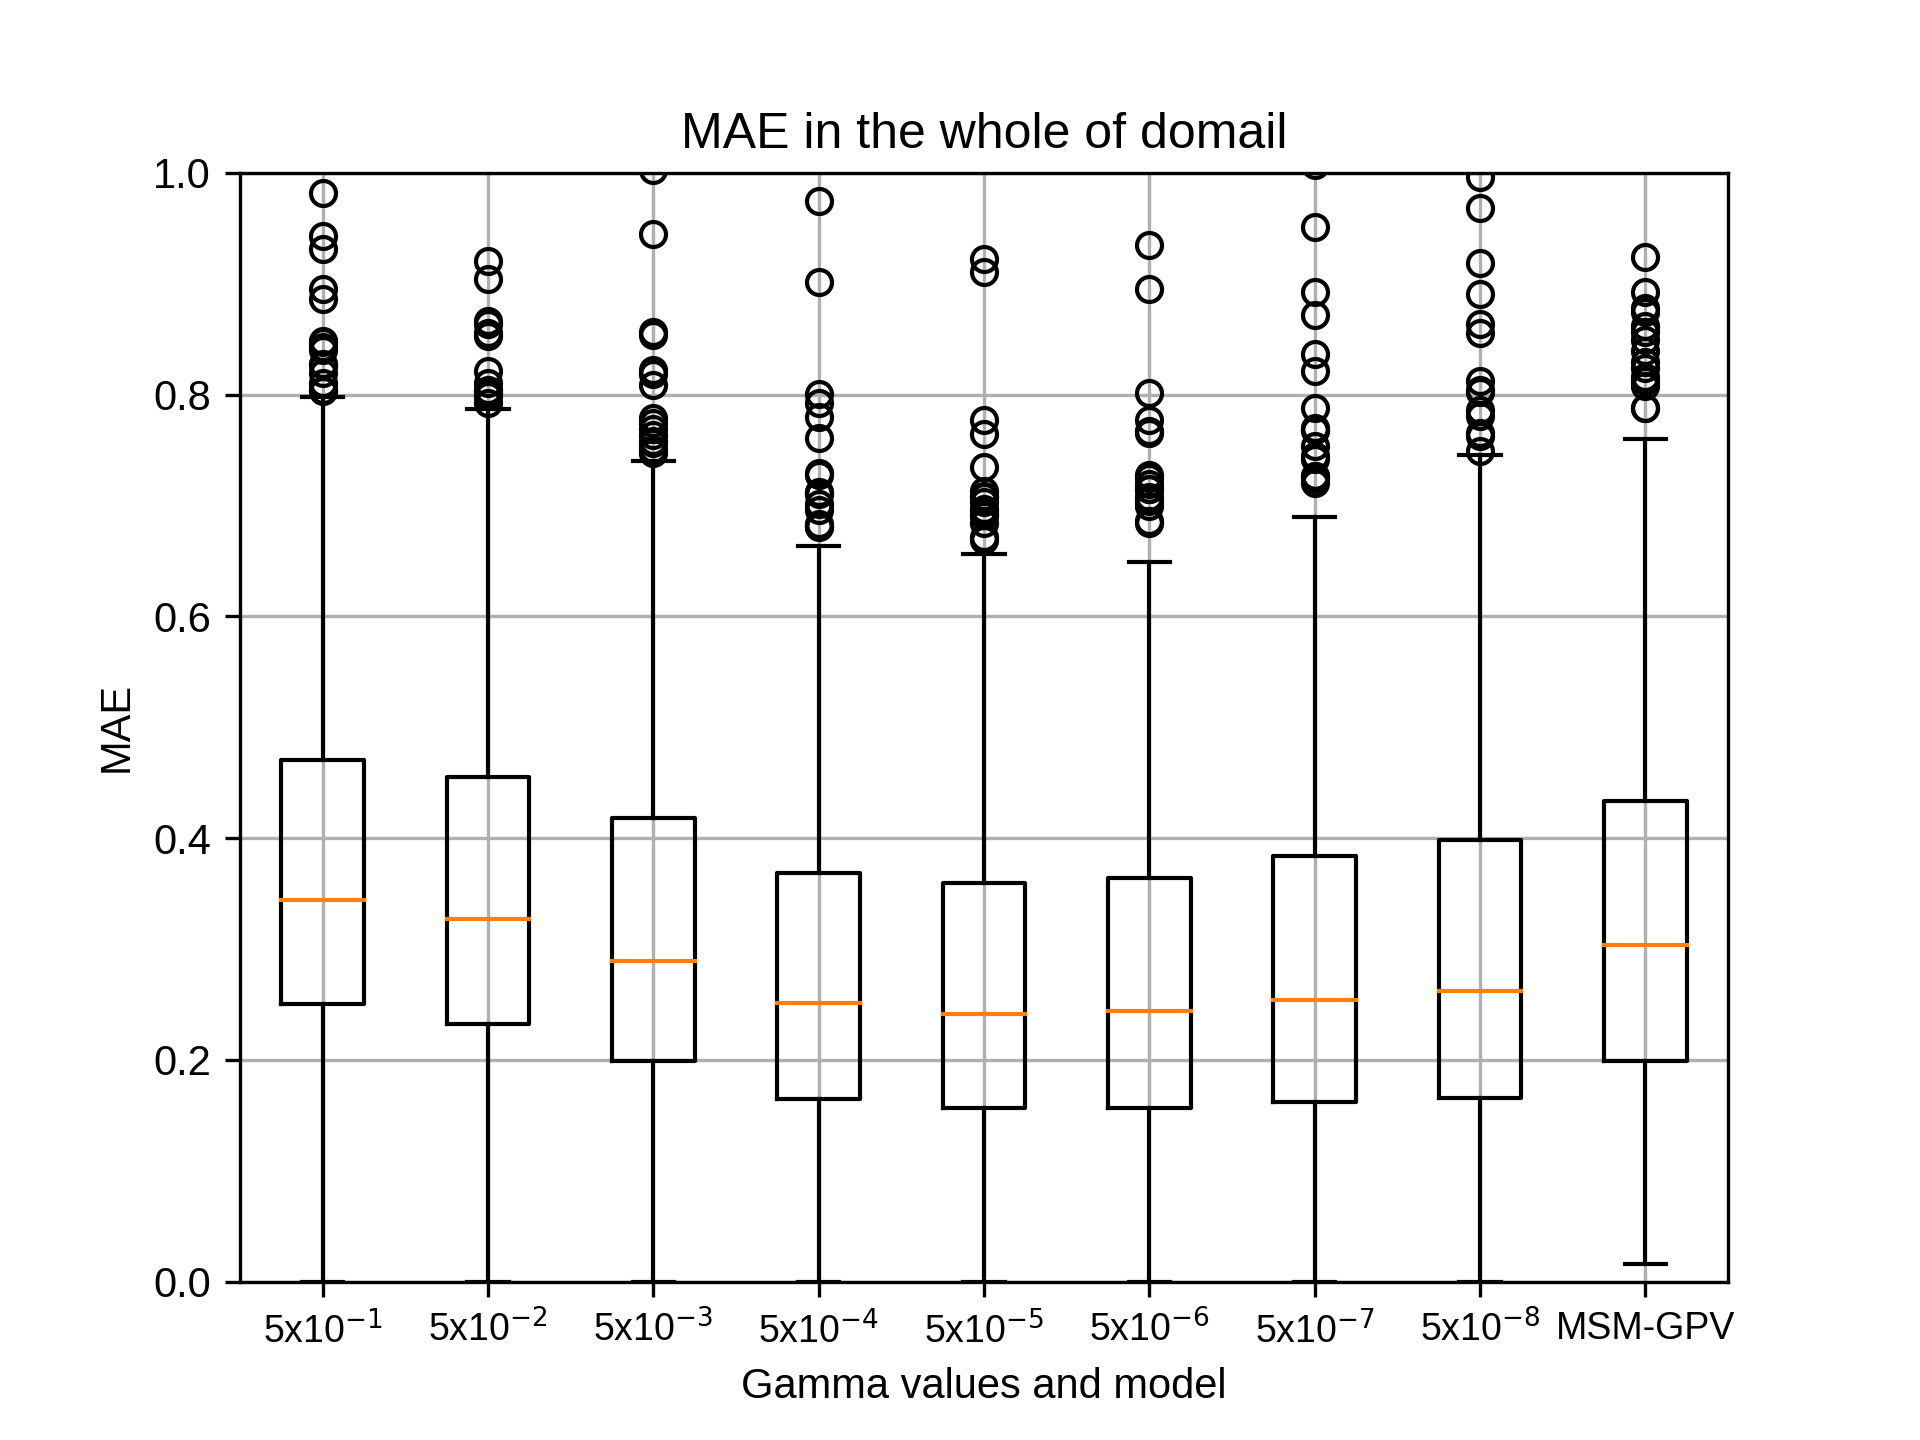

7月のsiteB,rg2=8の結果です。
kobayashi_yusukeThursday, October 22nd, 2020 at 4:32:18 PM GMT+09:00

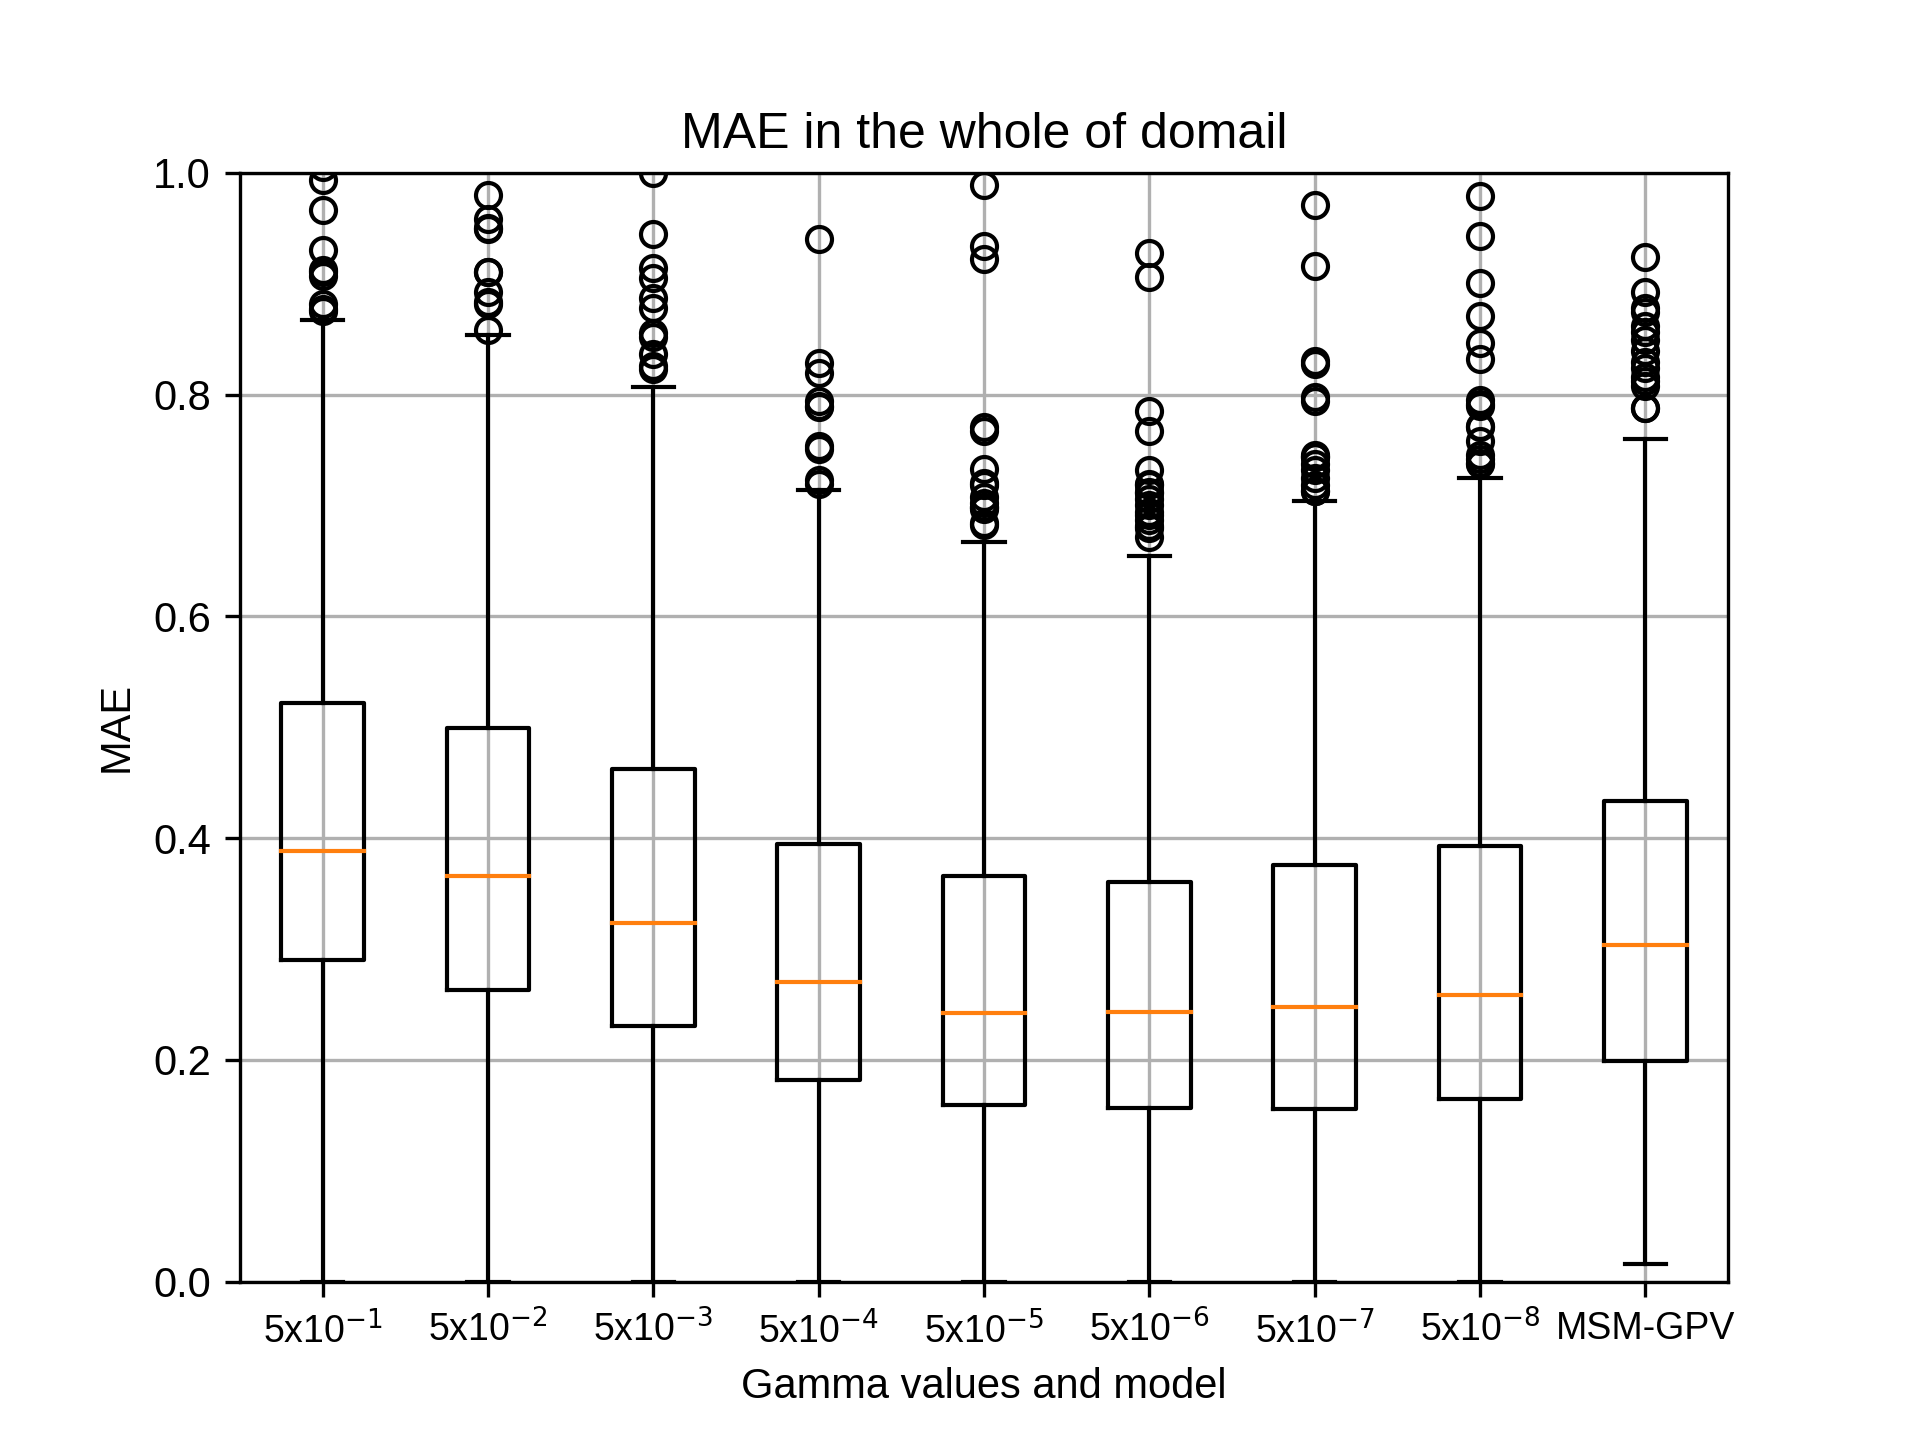

7月のsiteB,rg2=10の結果です。
kobayashi_yusukeThursday, October 22nd, 2020 at 4:32:40 PM GMT+09:00

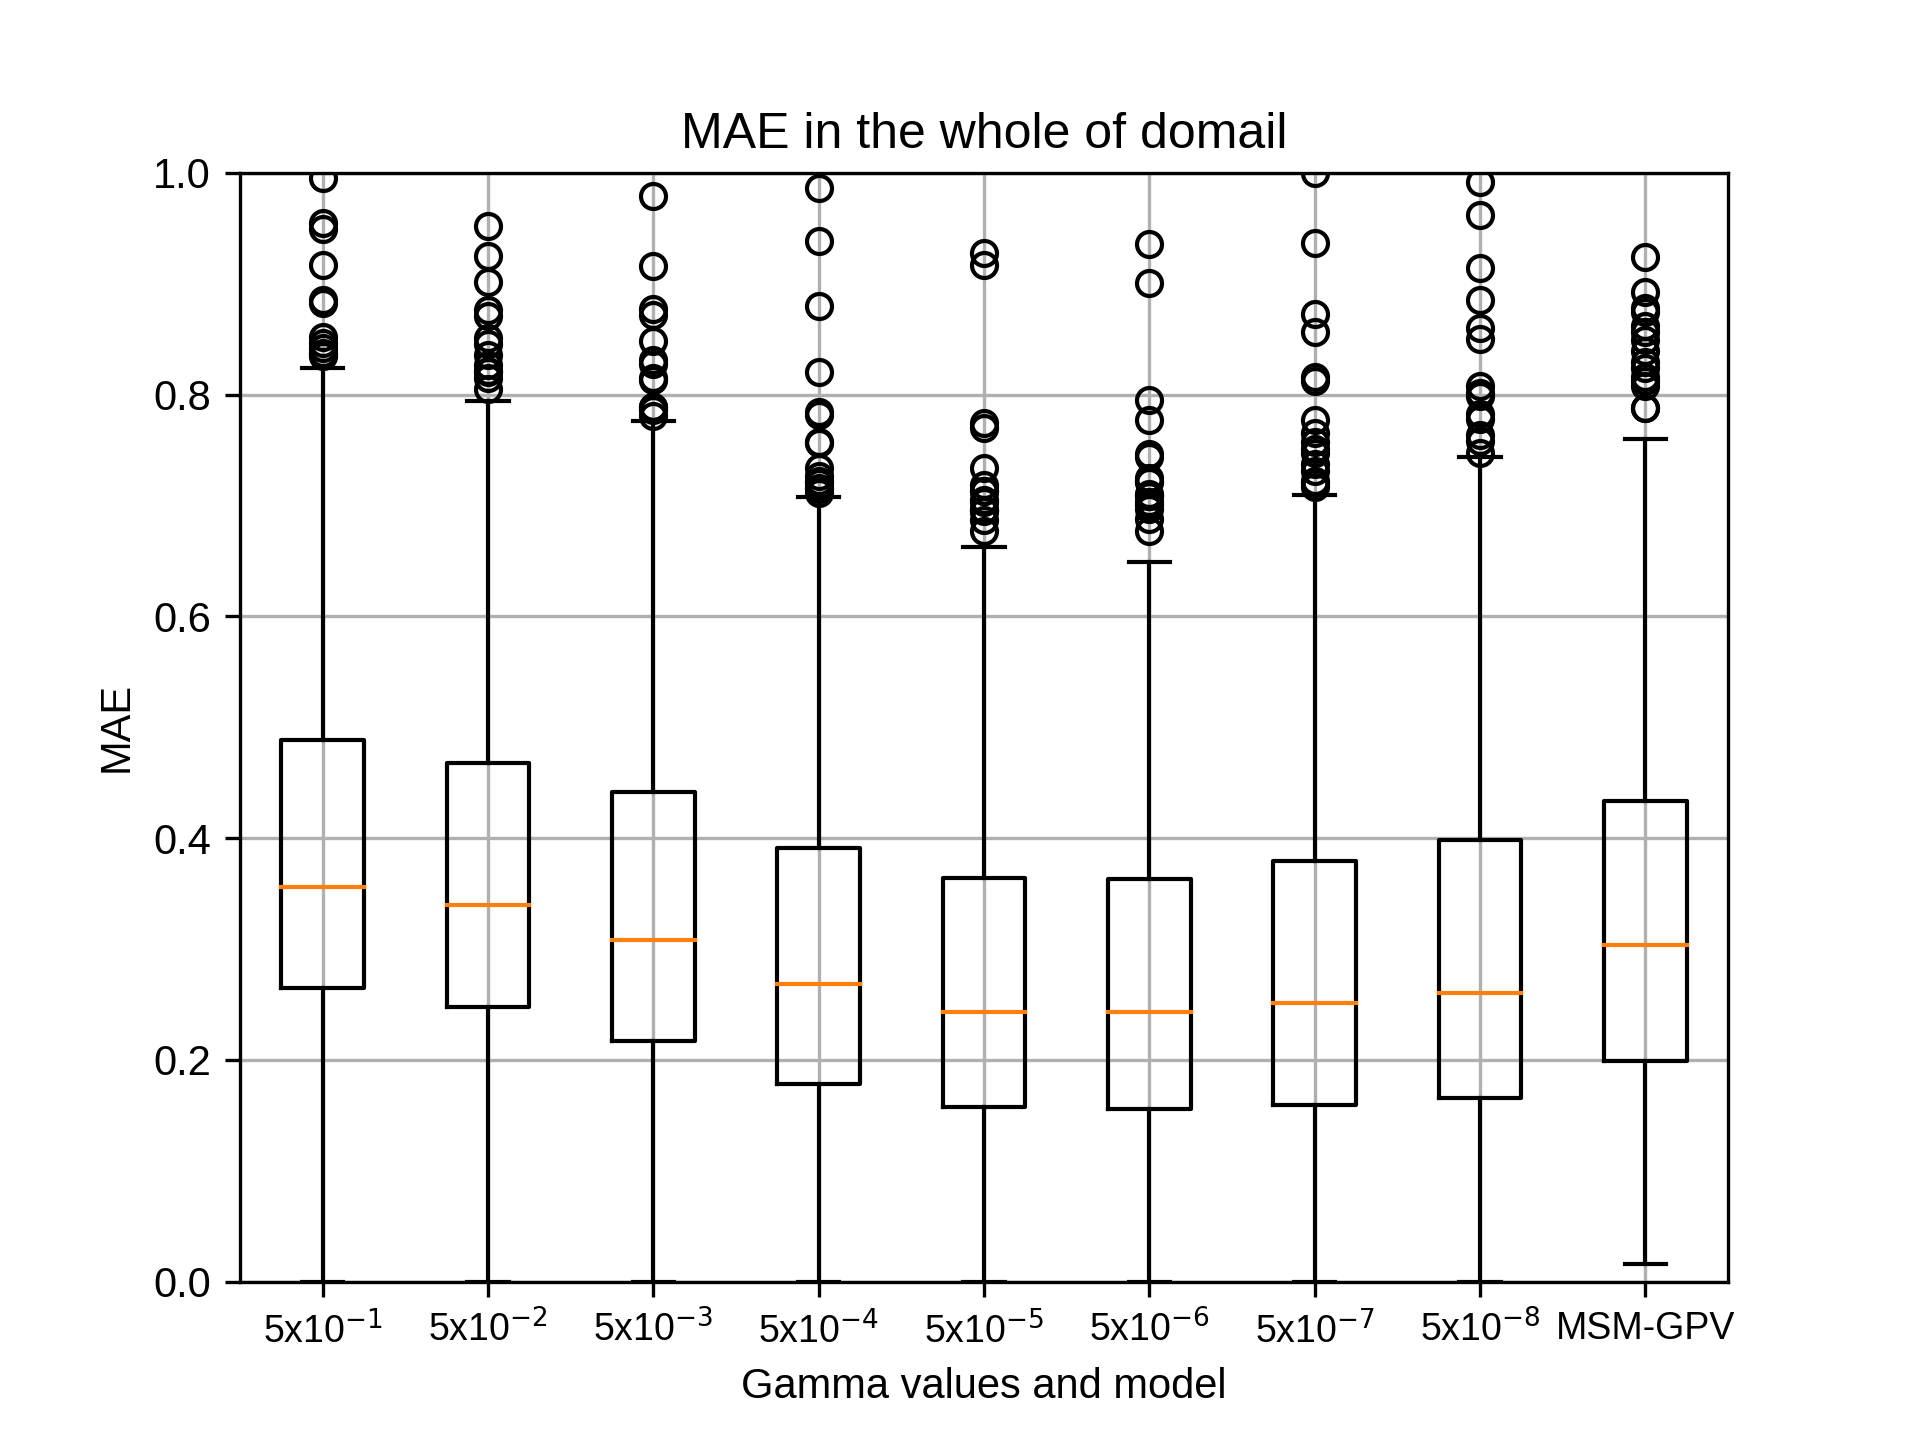
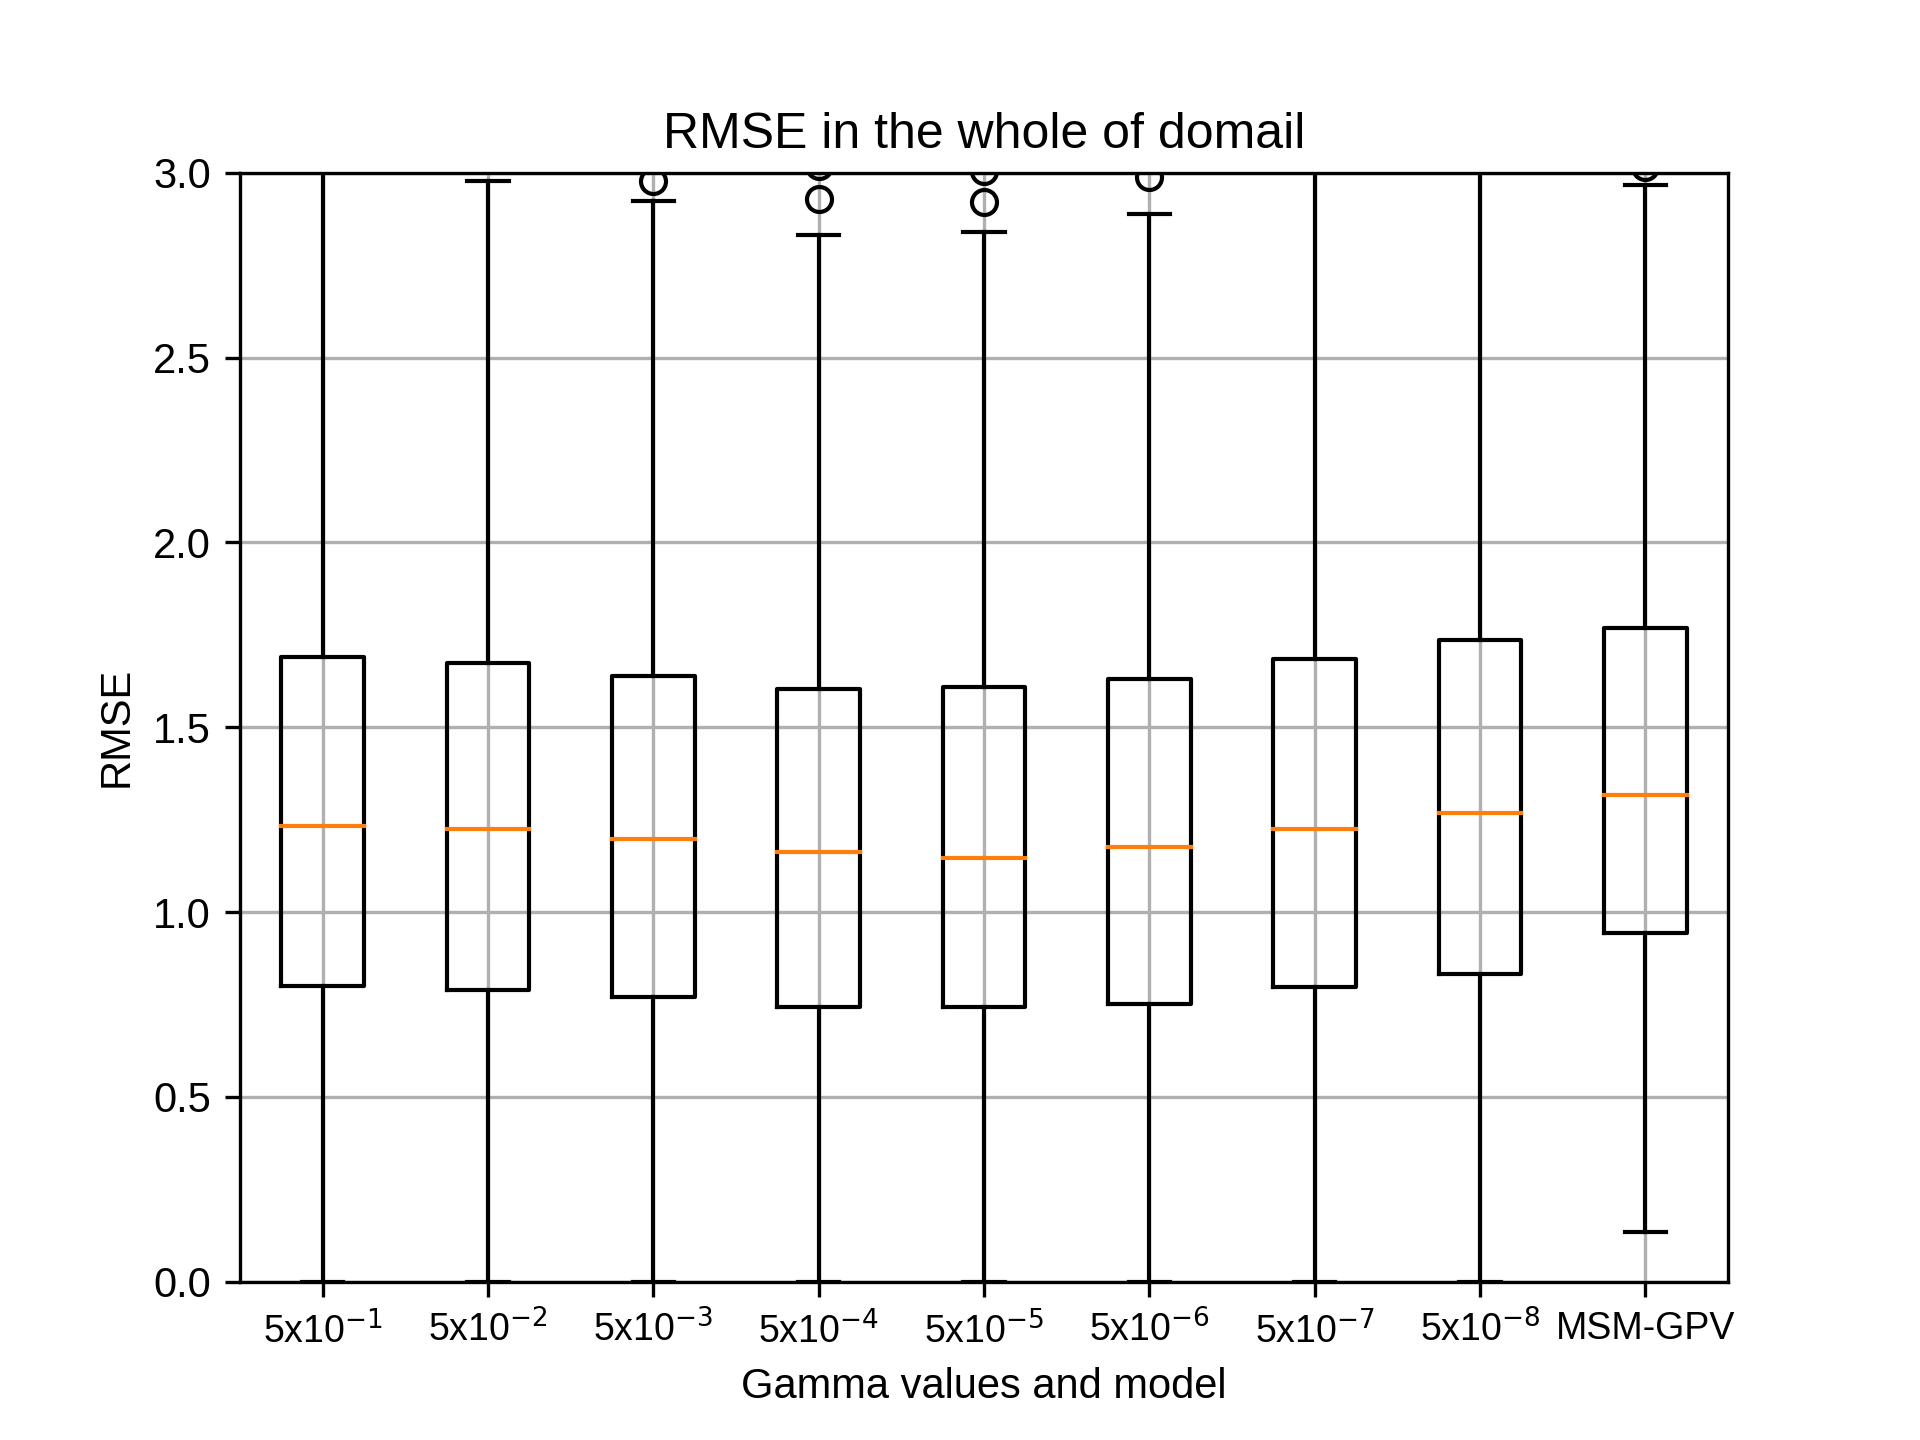
7月のsiteB,rg2=12の結果です。
7月のsiteBではrg2=10でgammaが5x10⁻⁶のとき、相関係数の中央値が最も高くなりました。
7月のsiteBではrg2=10でgammaが5x10⁻⁶のとき、相関係数の中央値が最も高くなりました。
kobayashi_yusukeThursday, October 22nd, 2020 at 4:32:57 PM GMT+09:00
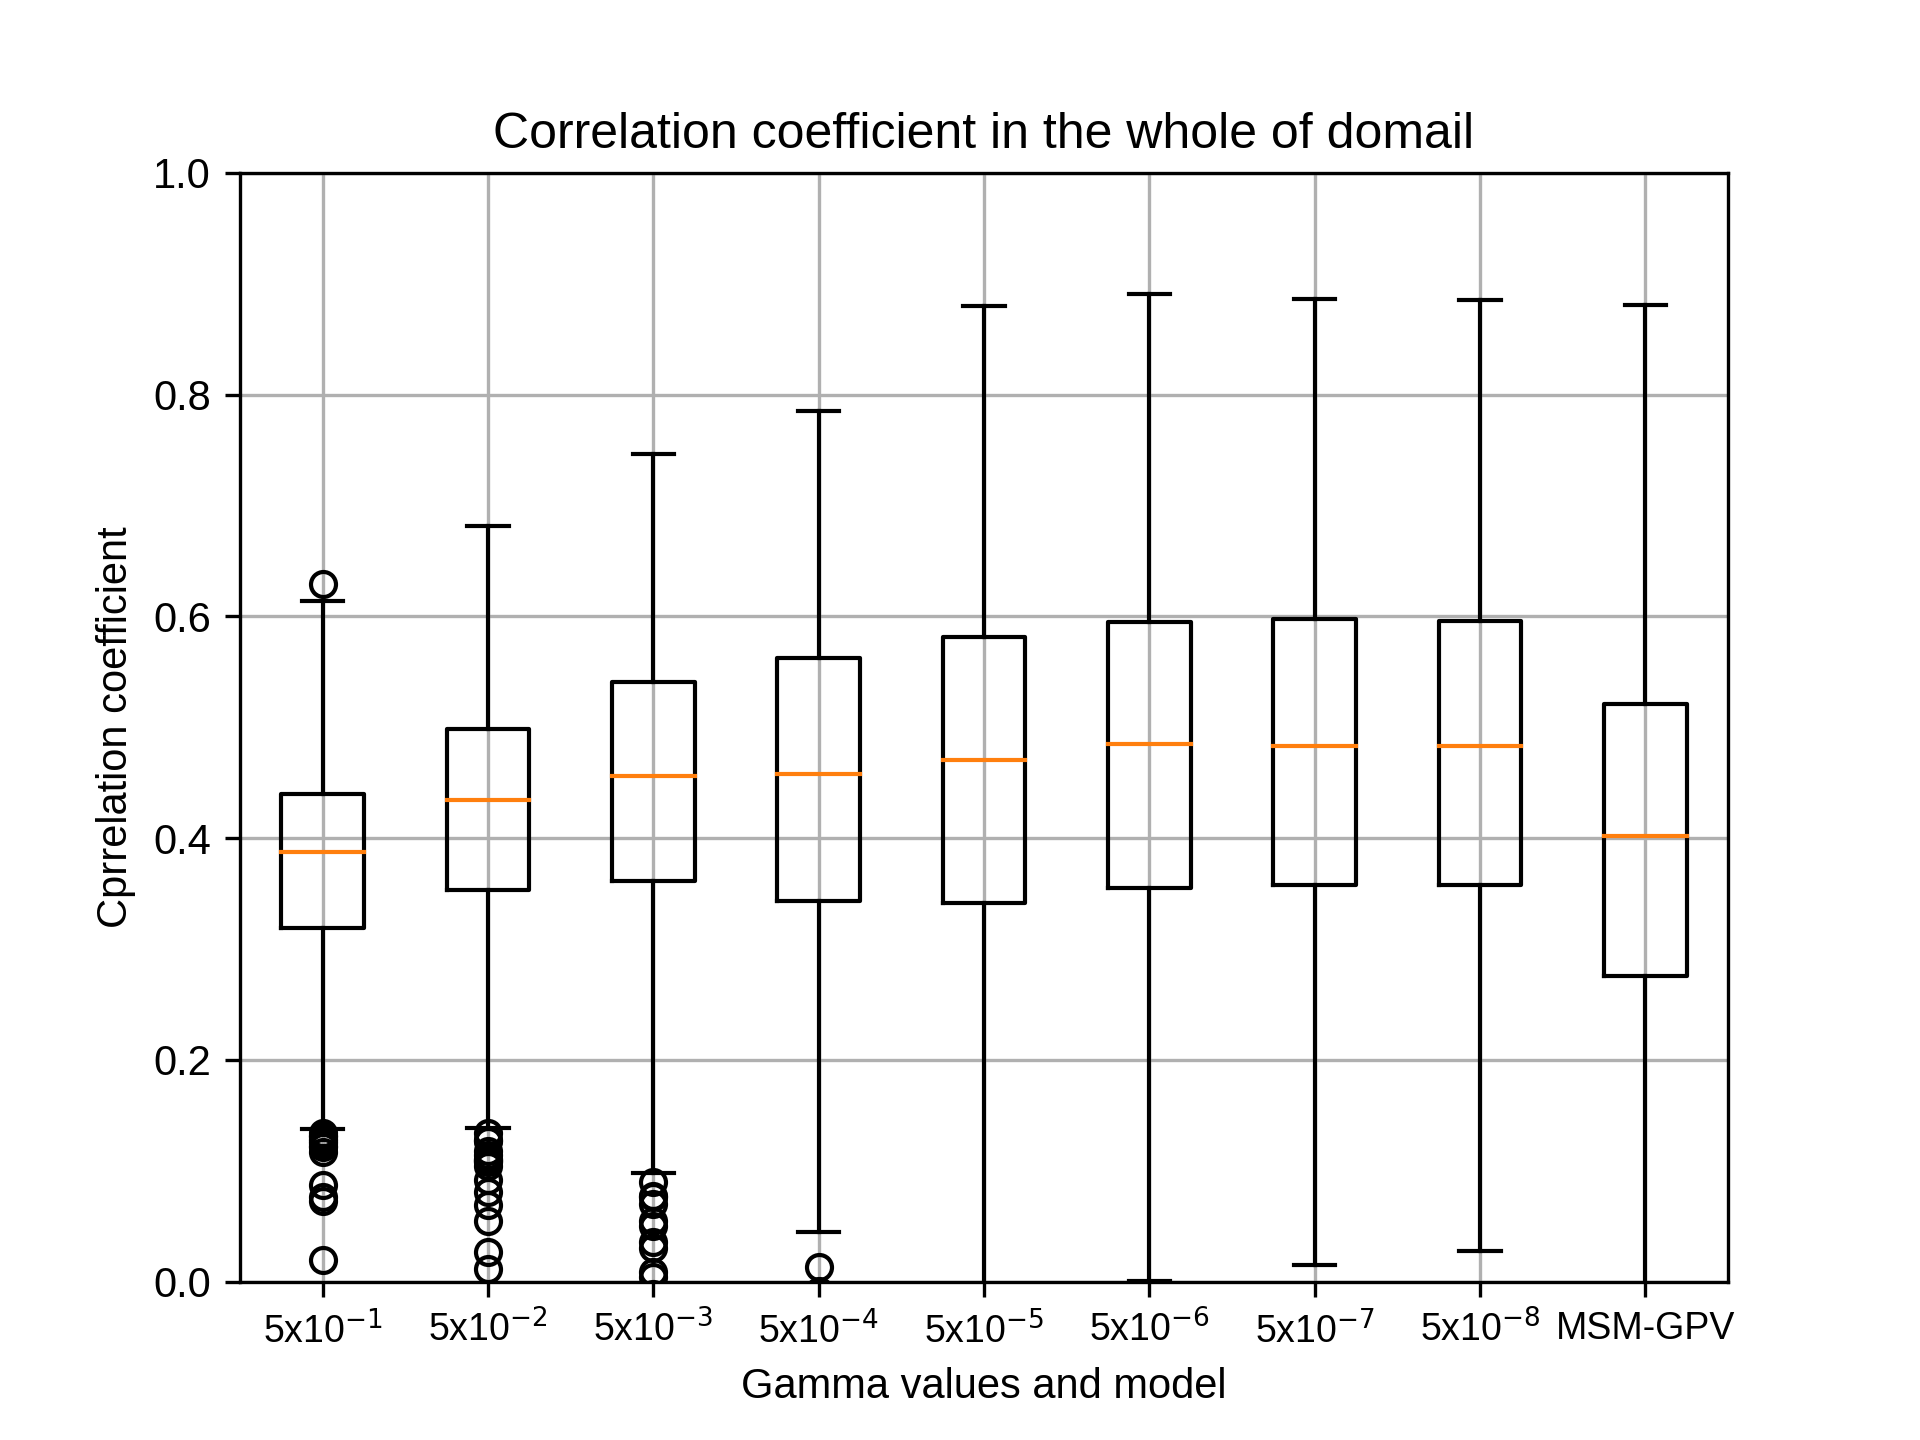
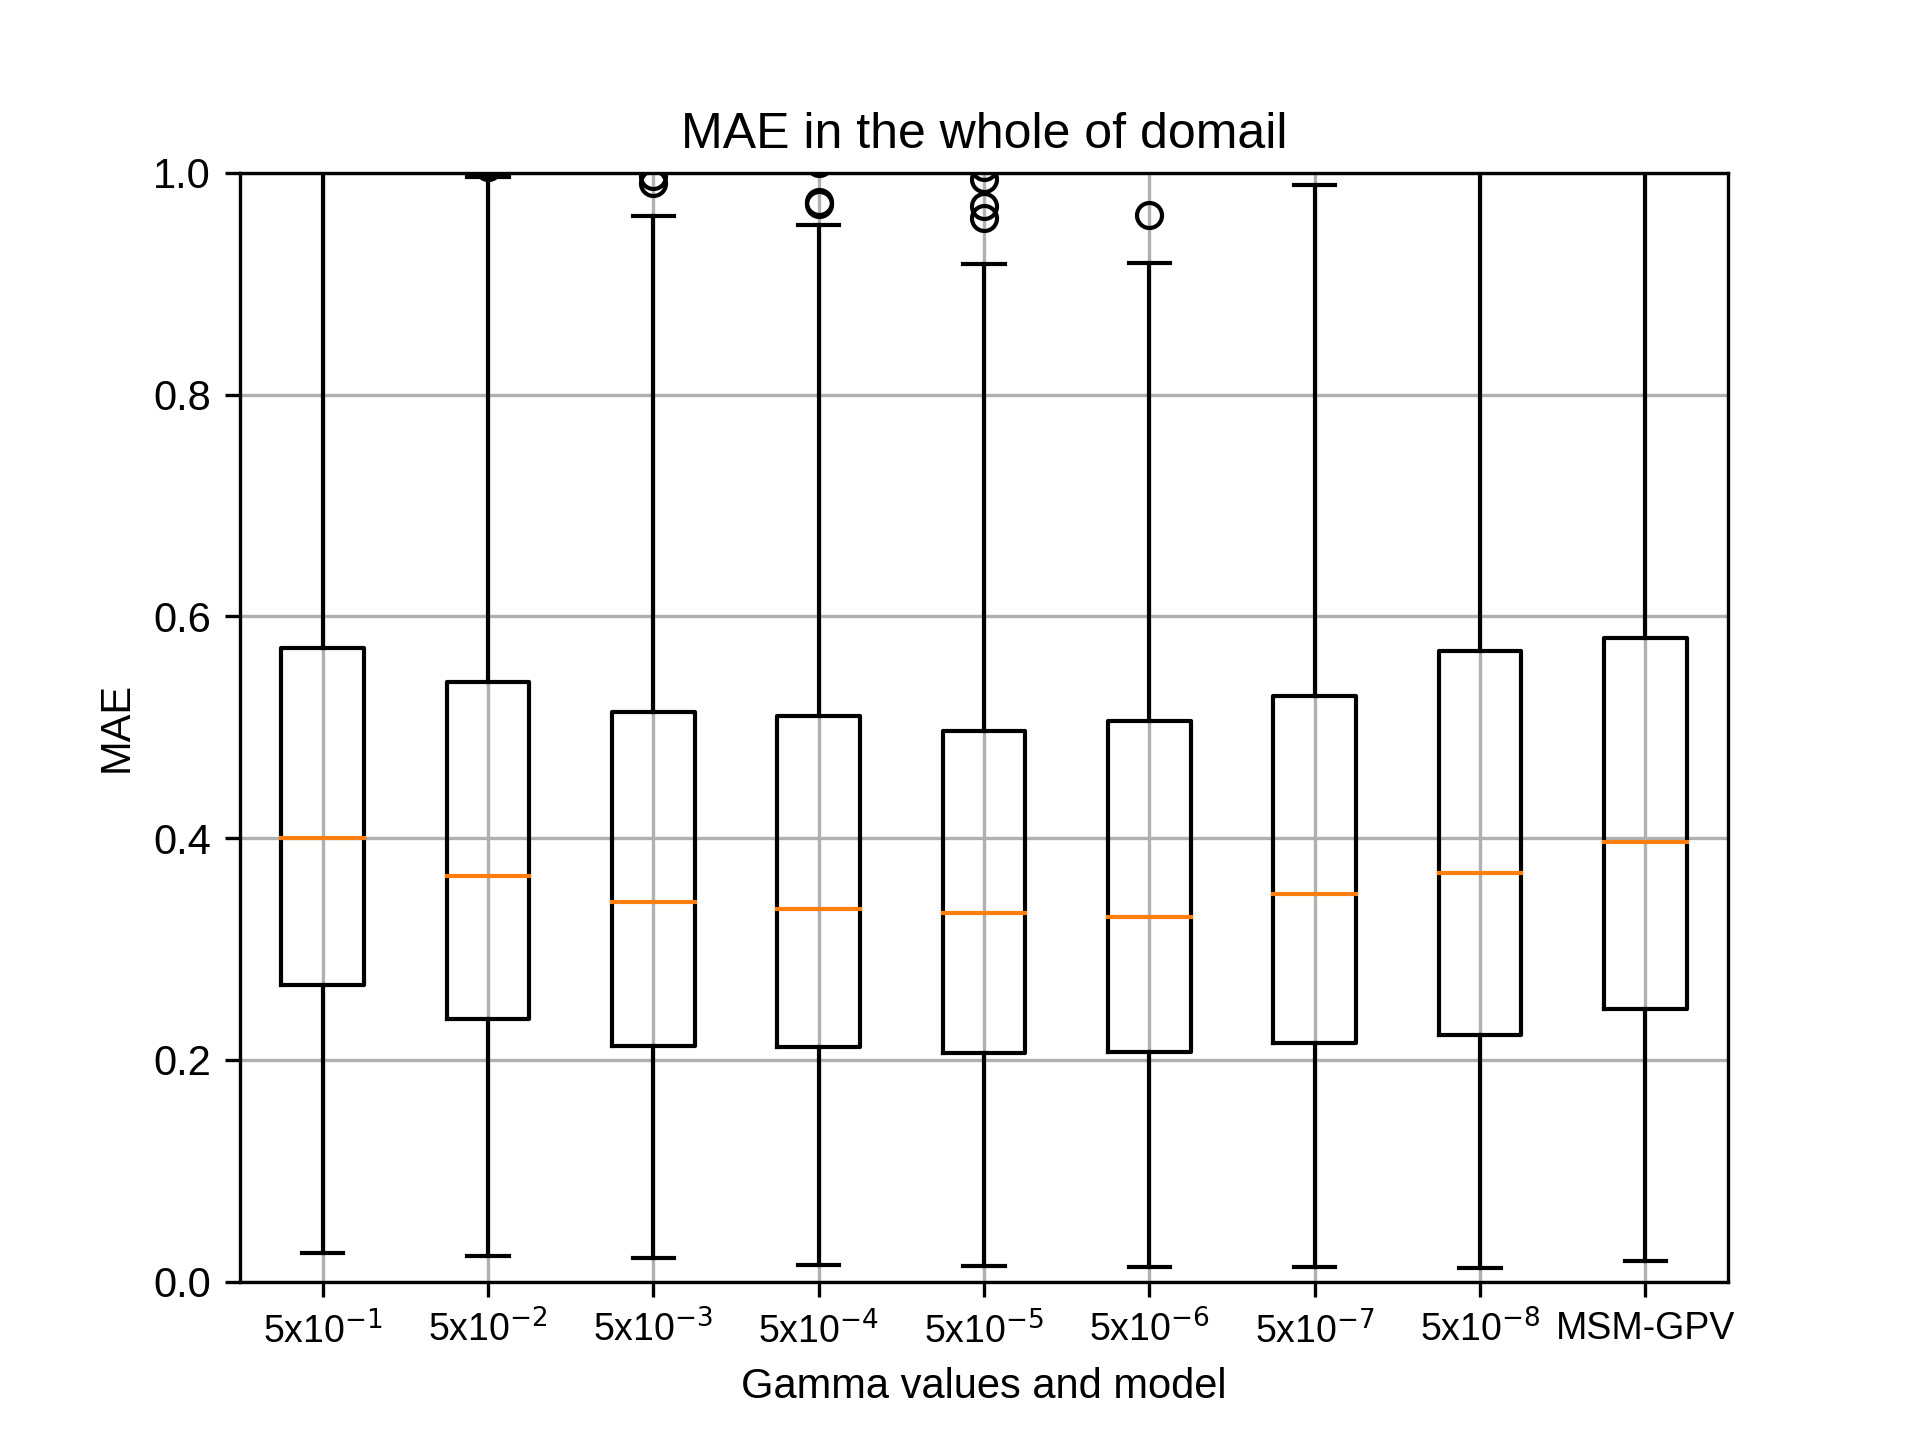
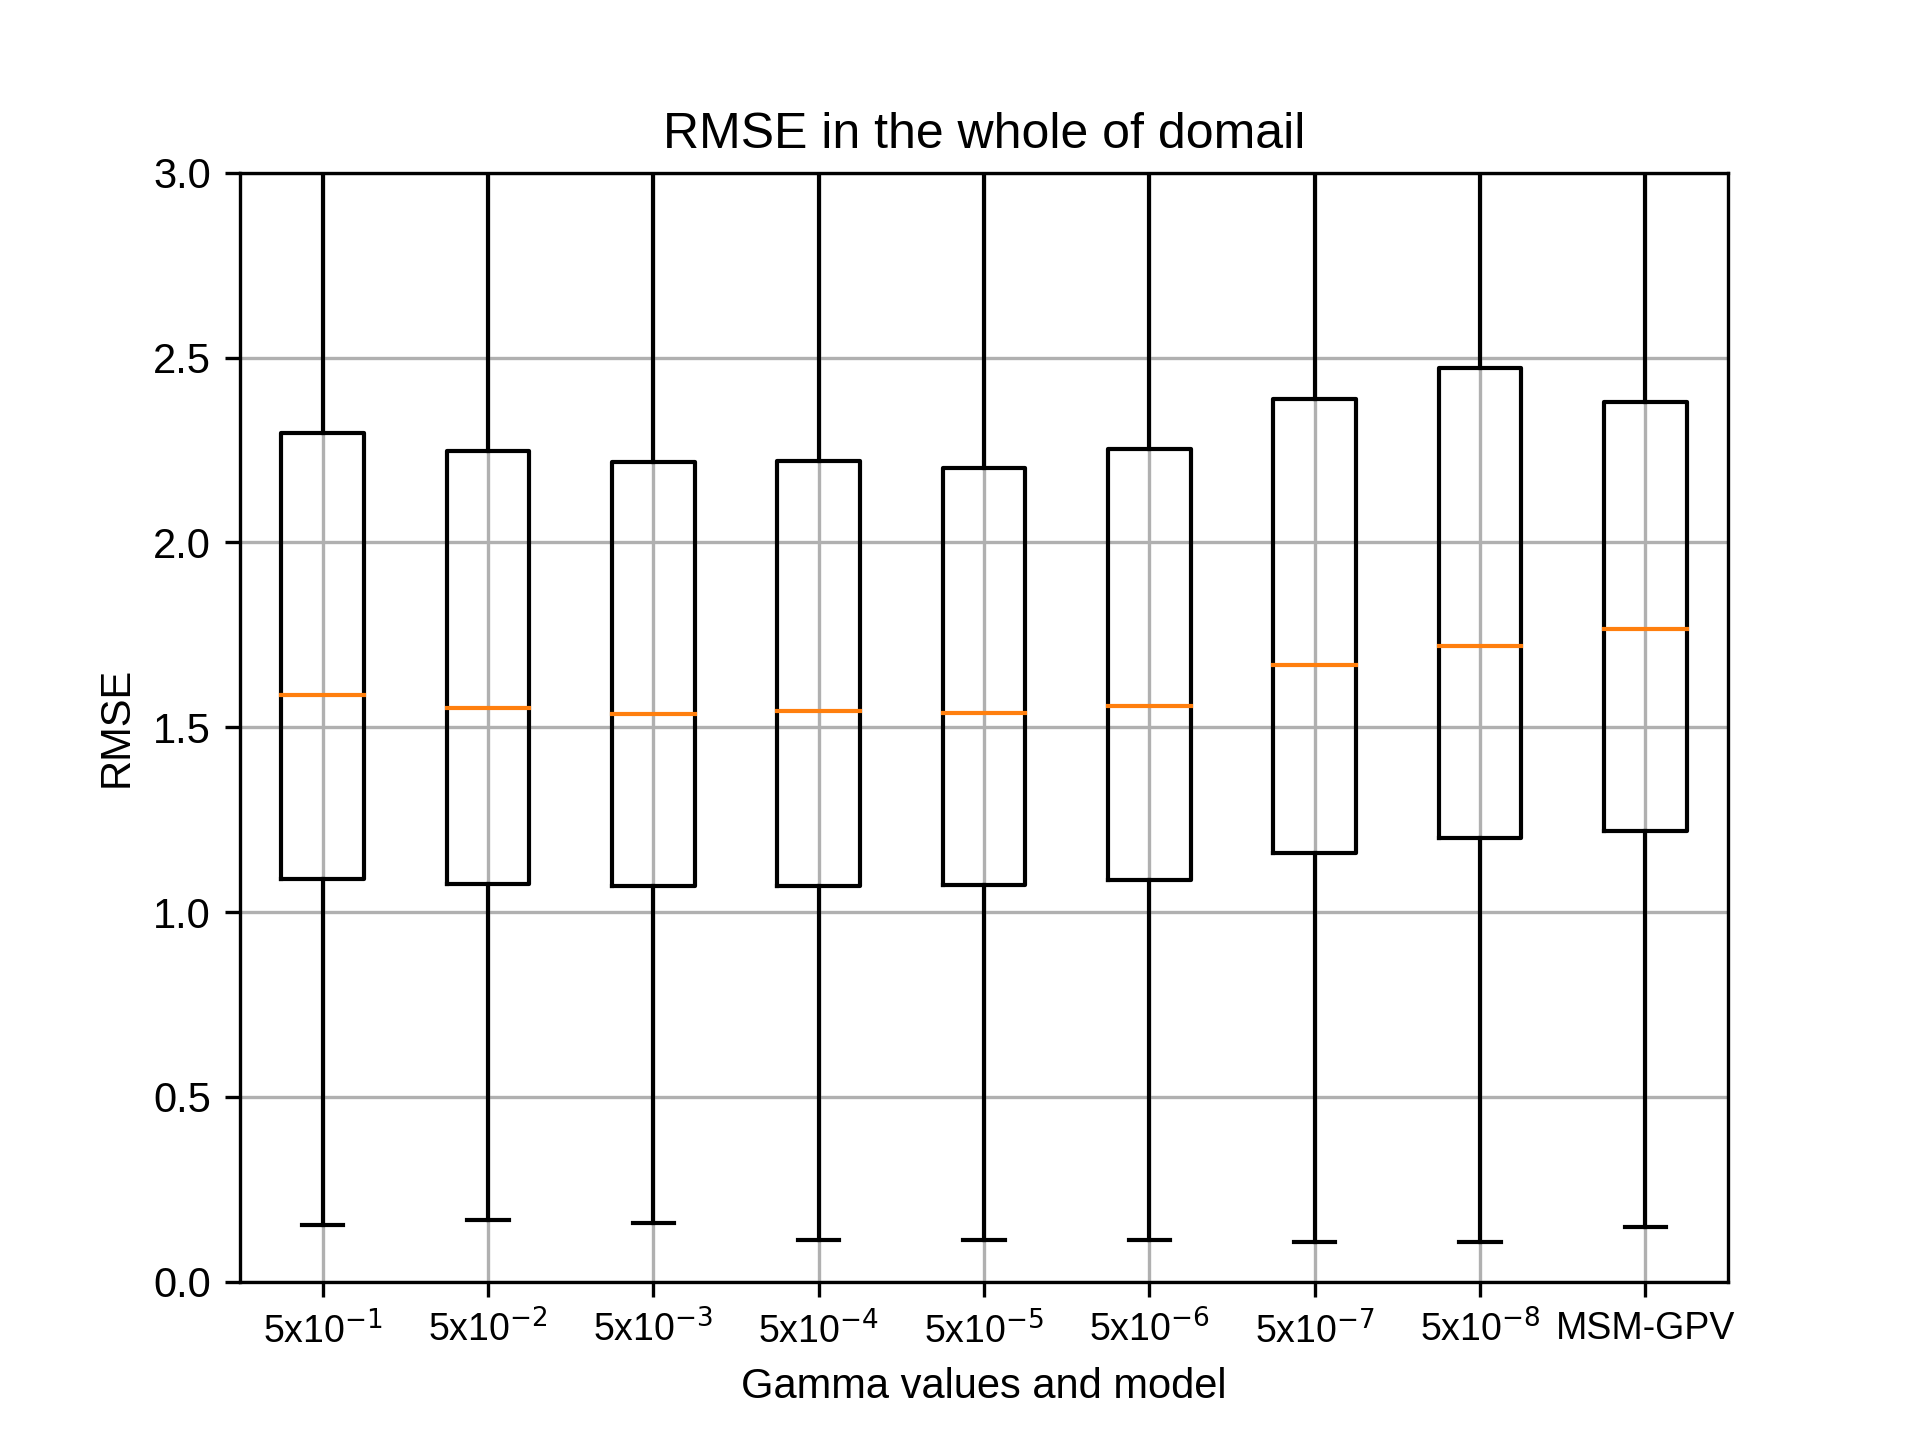
7月のsiteC,rg2=4の結果です。
kobayashi_yusukeThursday, October 22nd, 2020 at 4:33:11 PM GMT+09:00
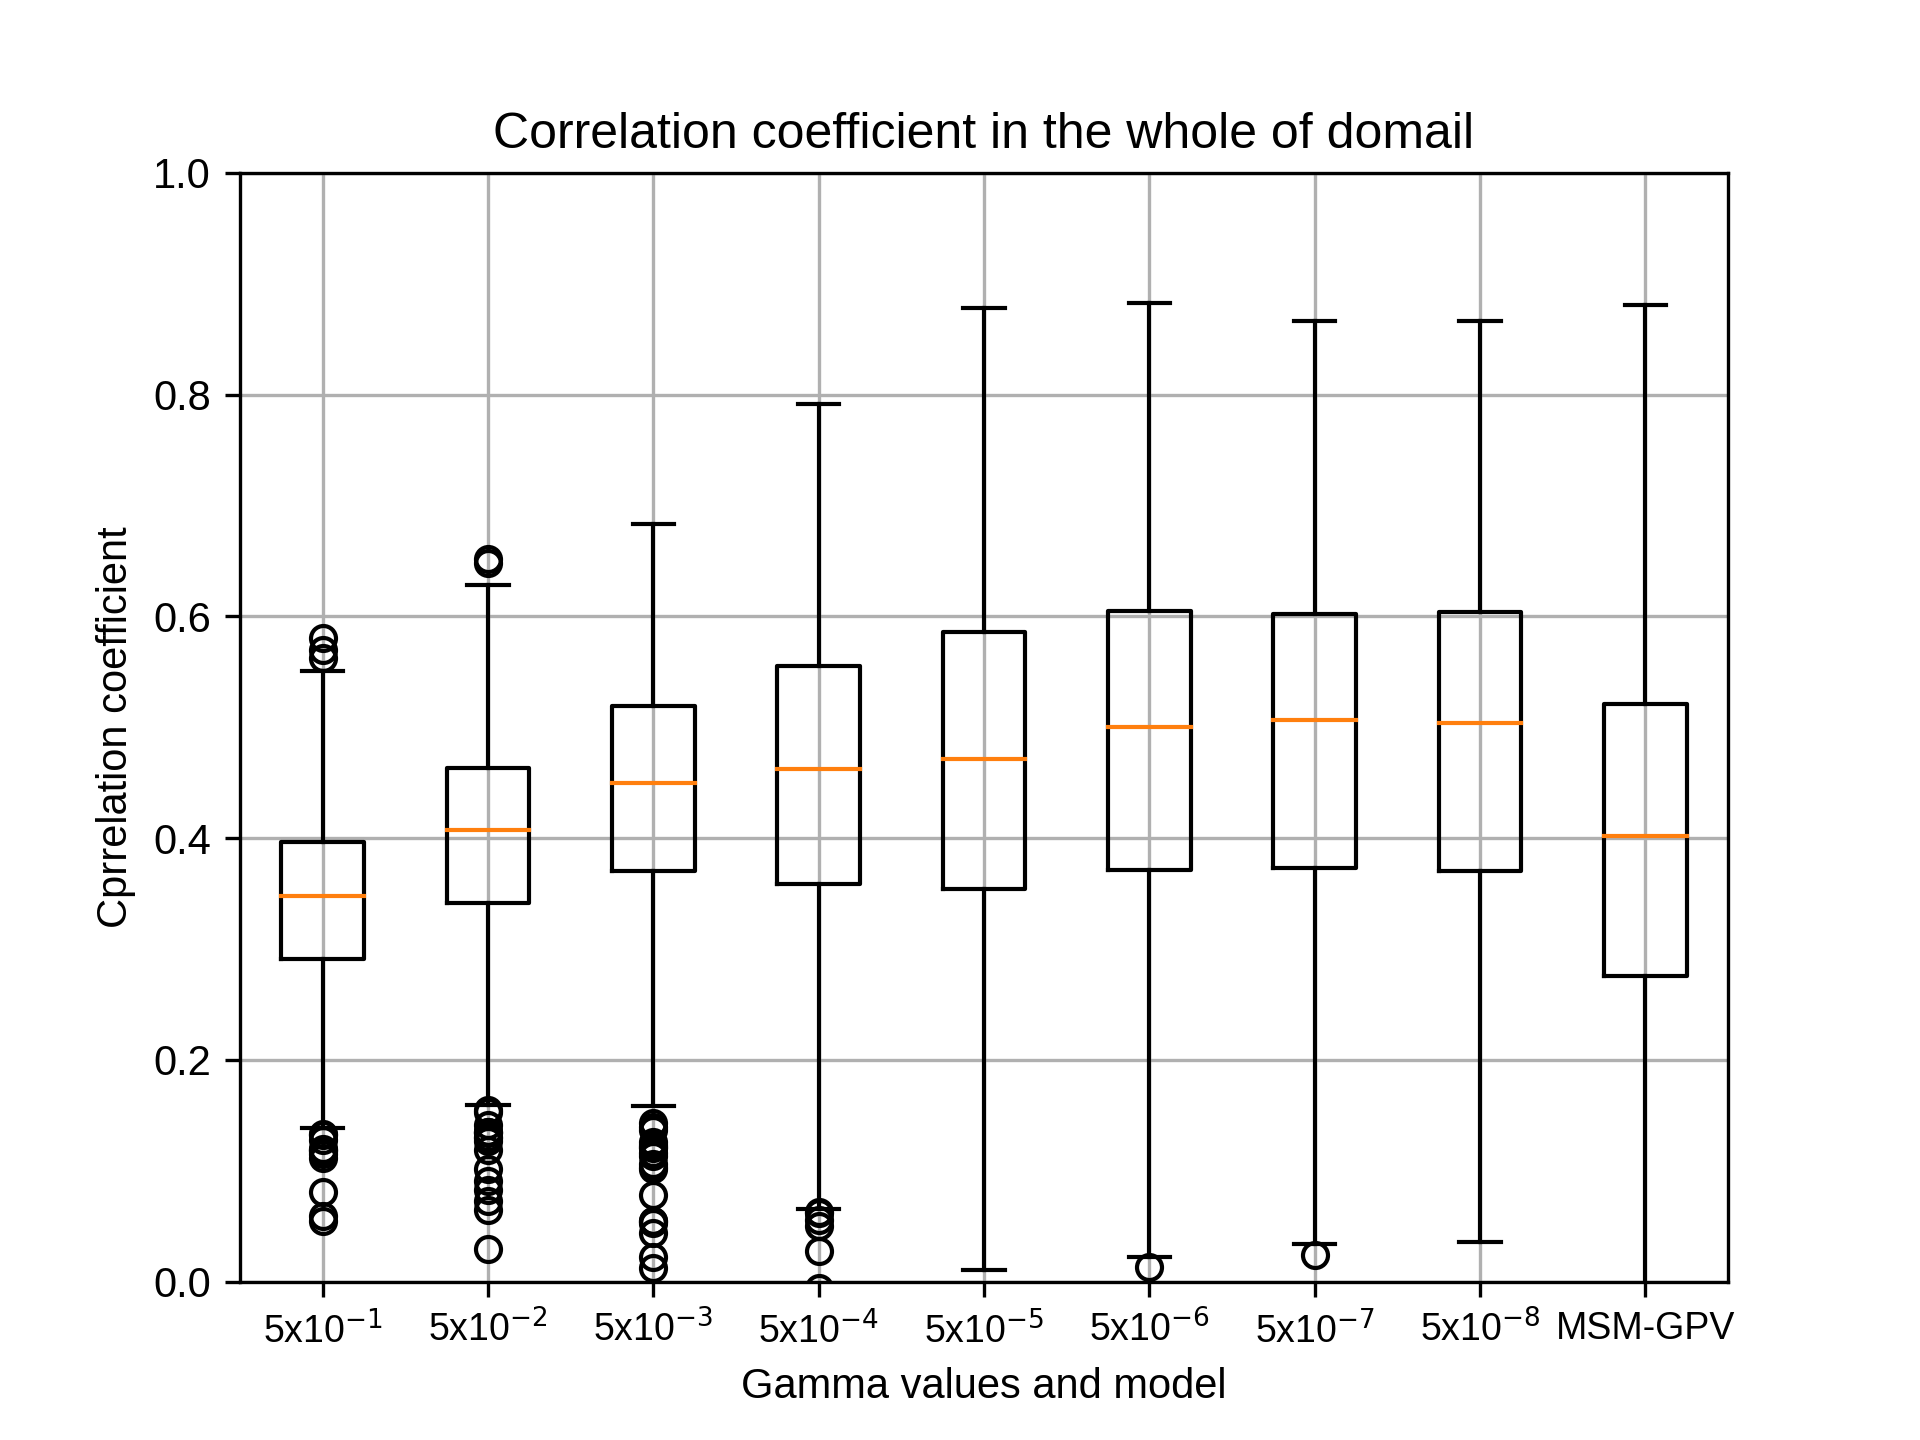
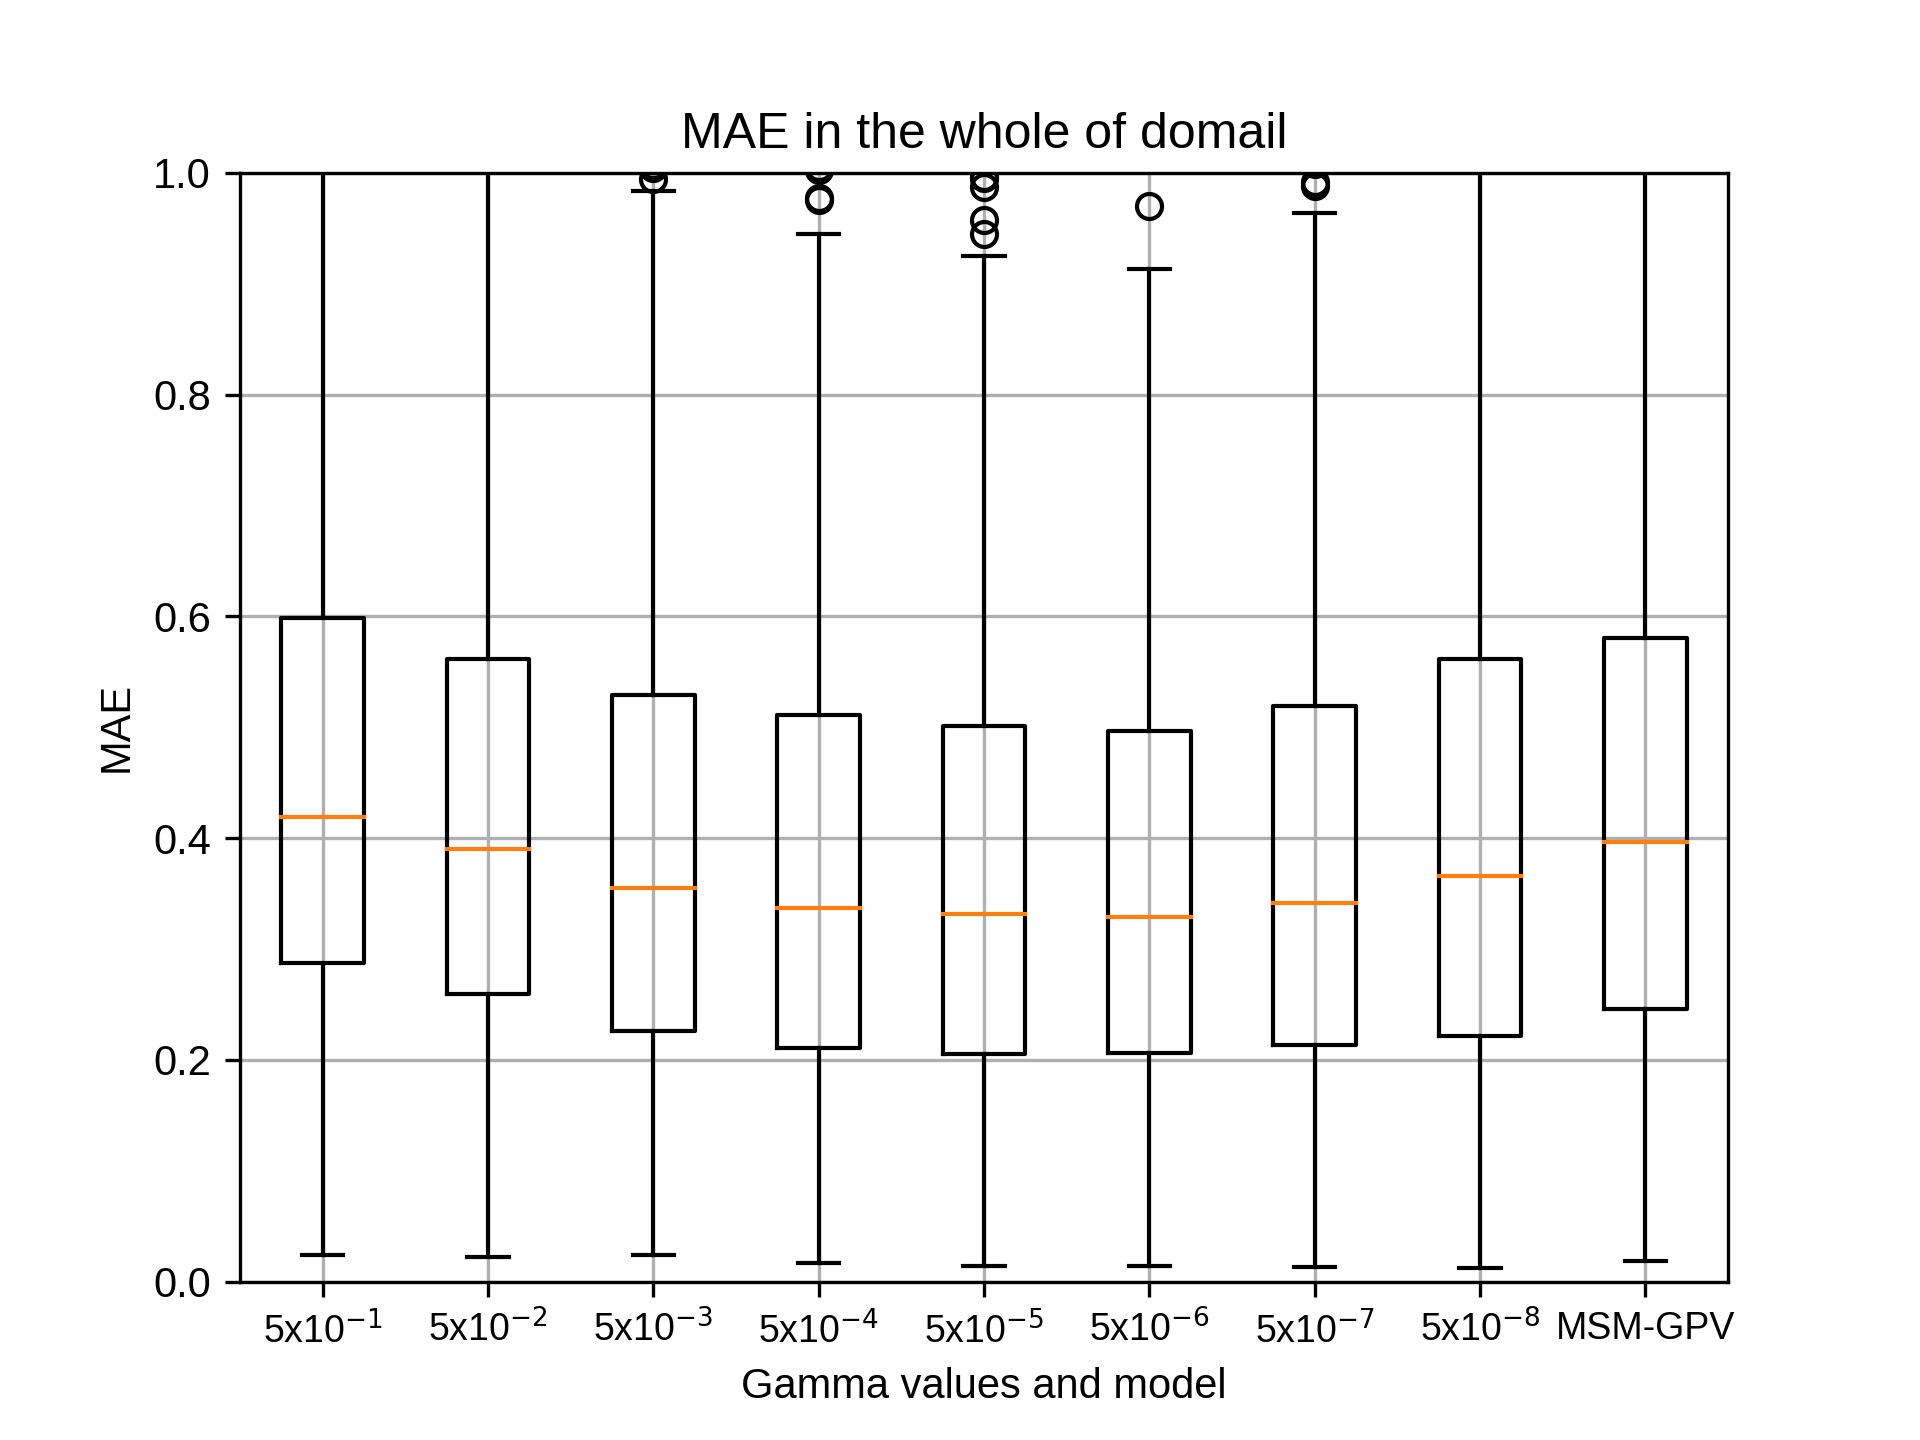
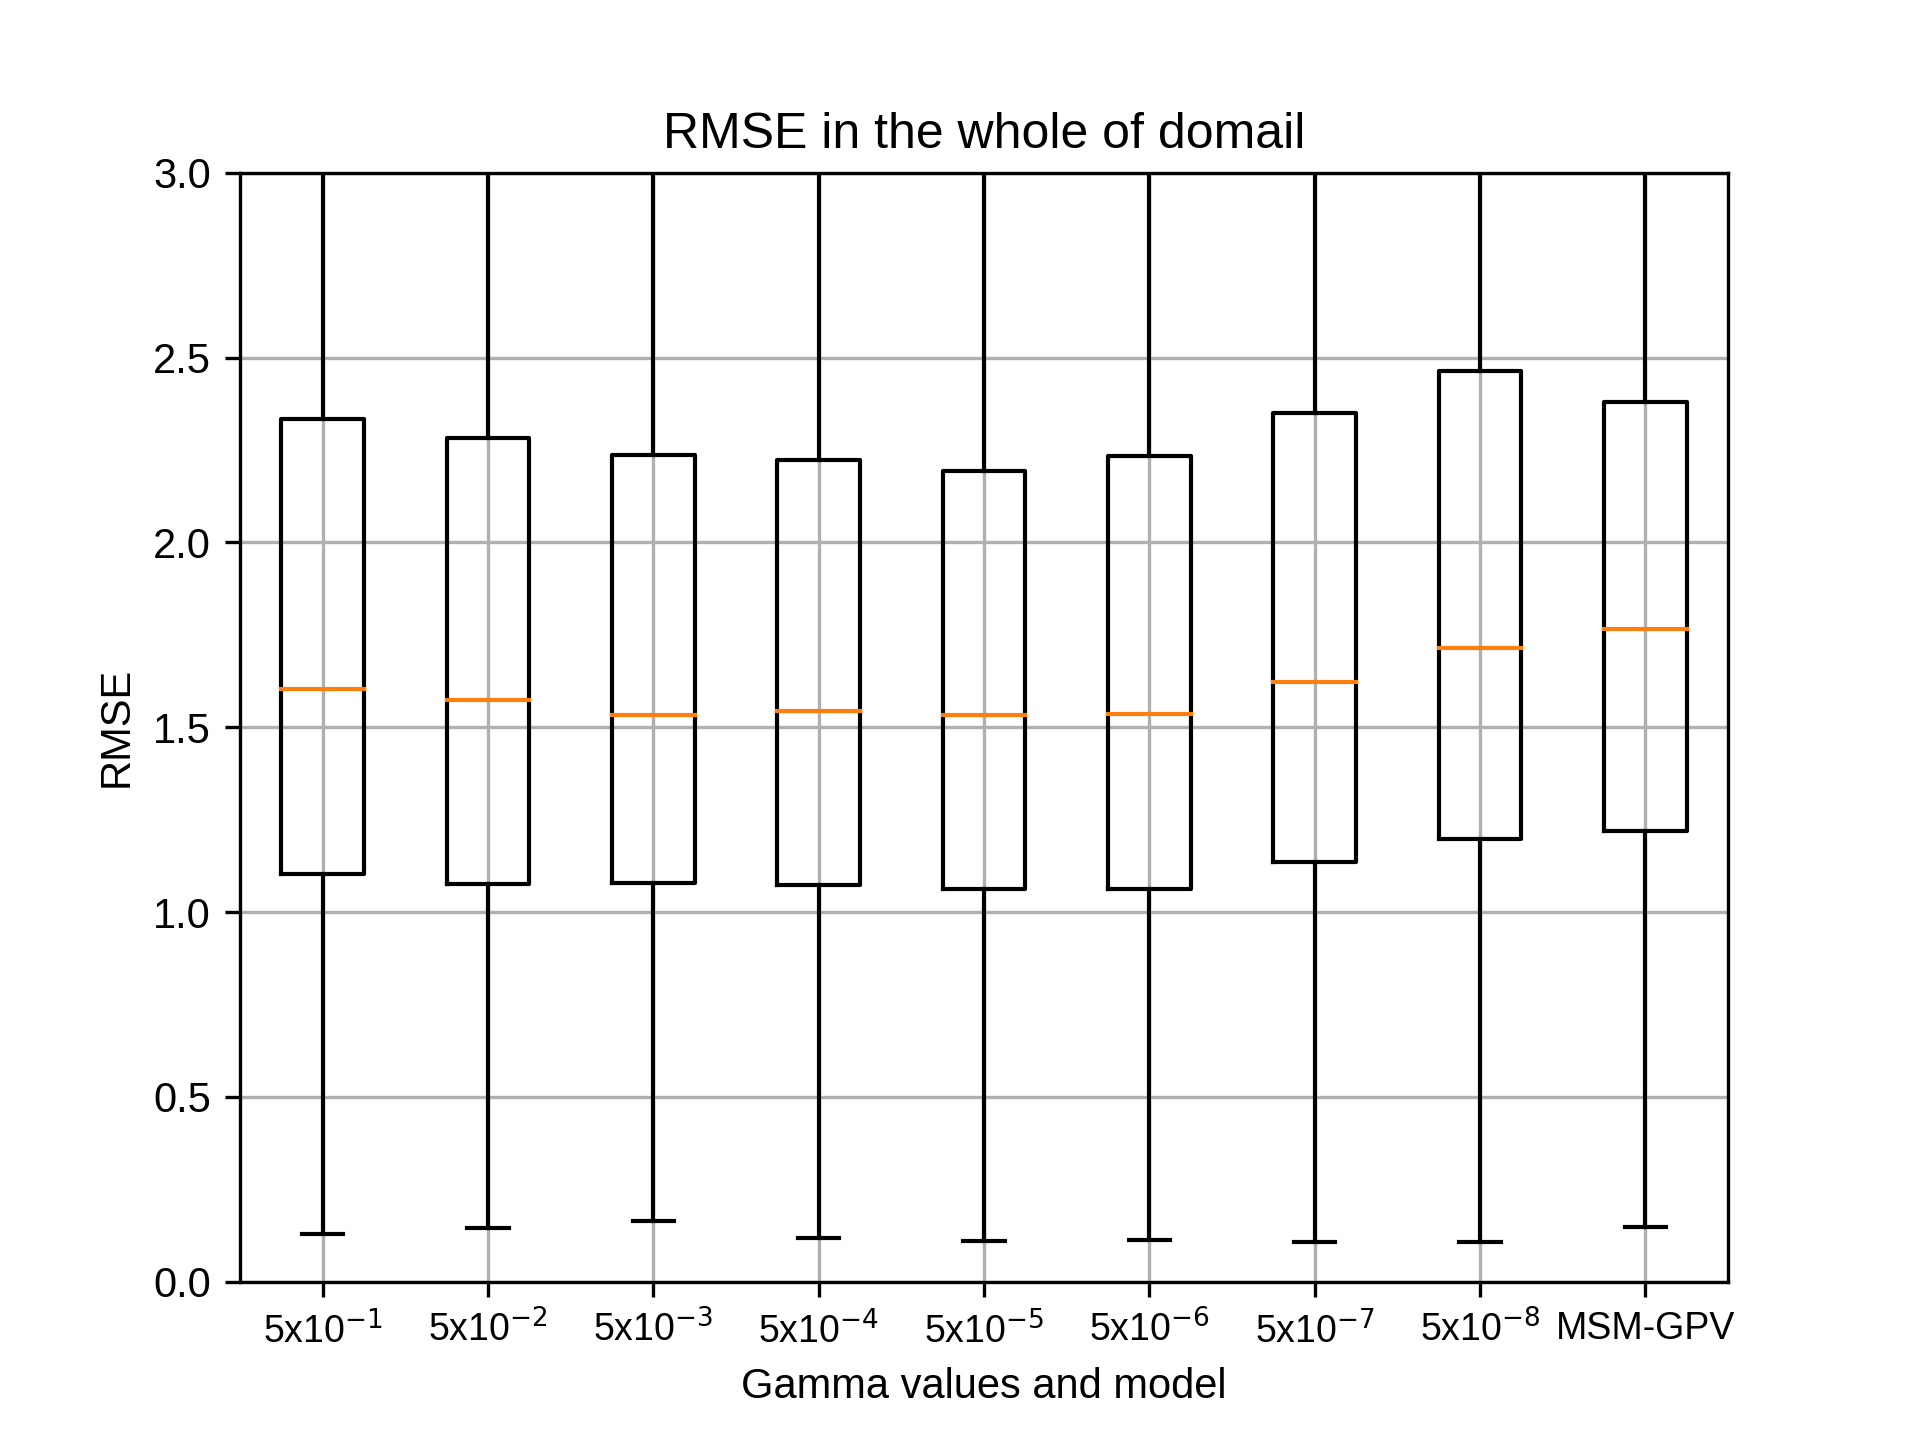
7月のsiteC,rg2=6の結果です。
kobayashi_yusukeThursday, October 22nd, 2020 at 4:33:29 PM GMT+09:00
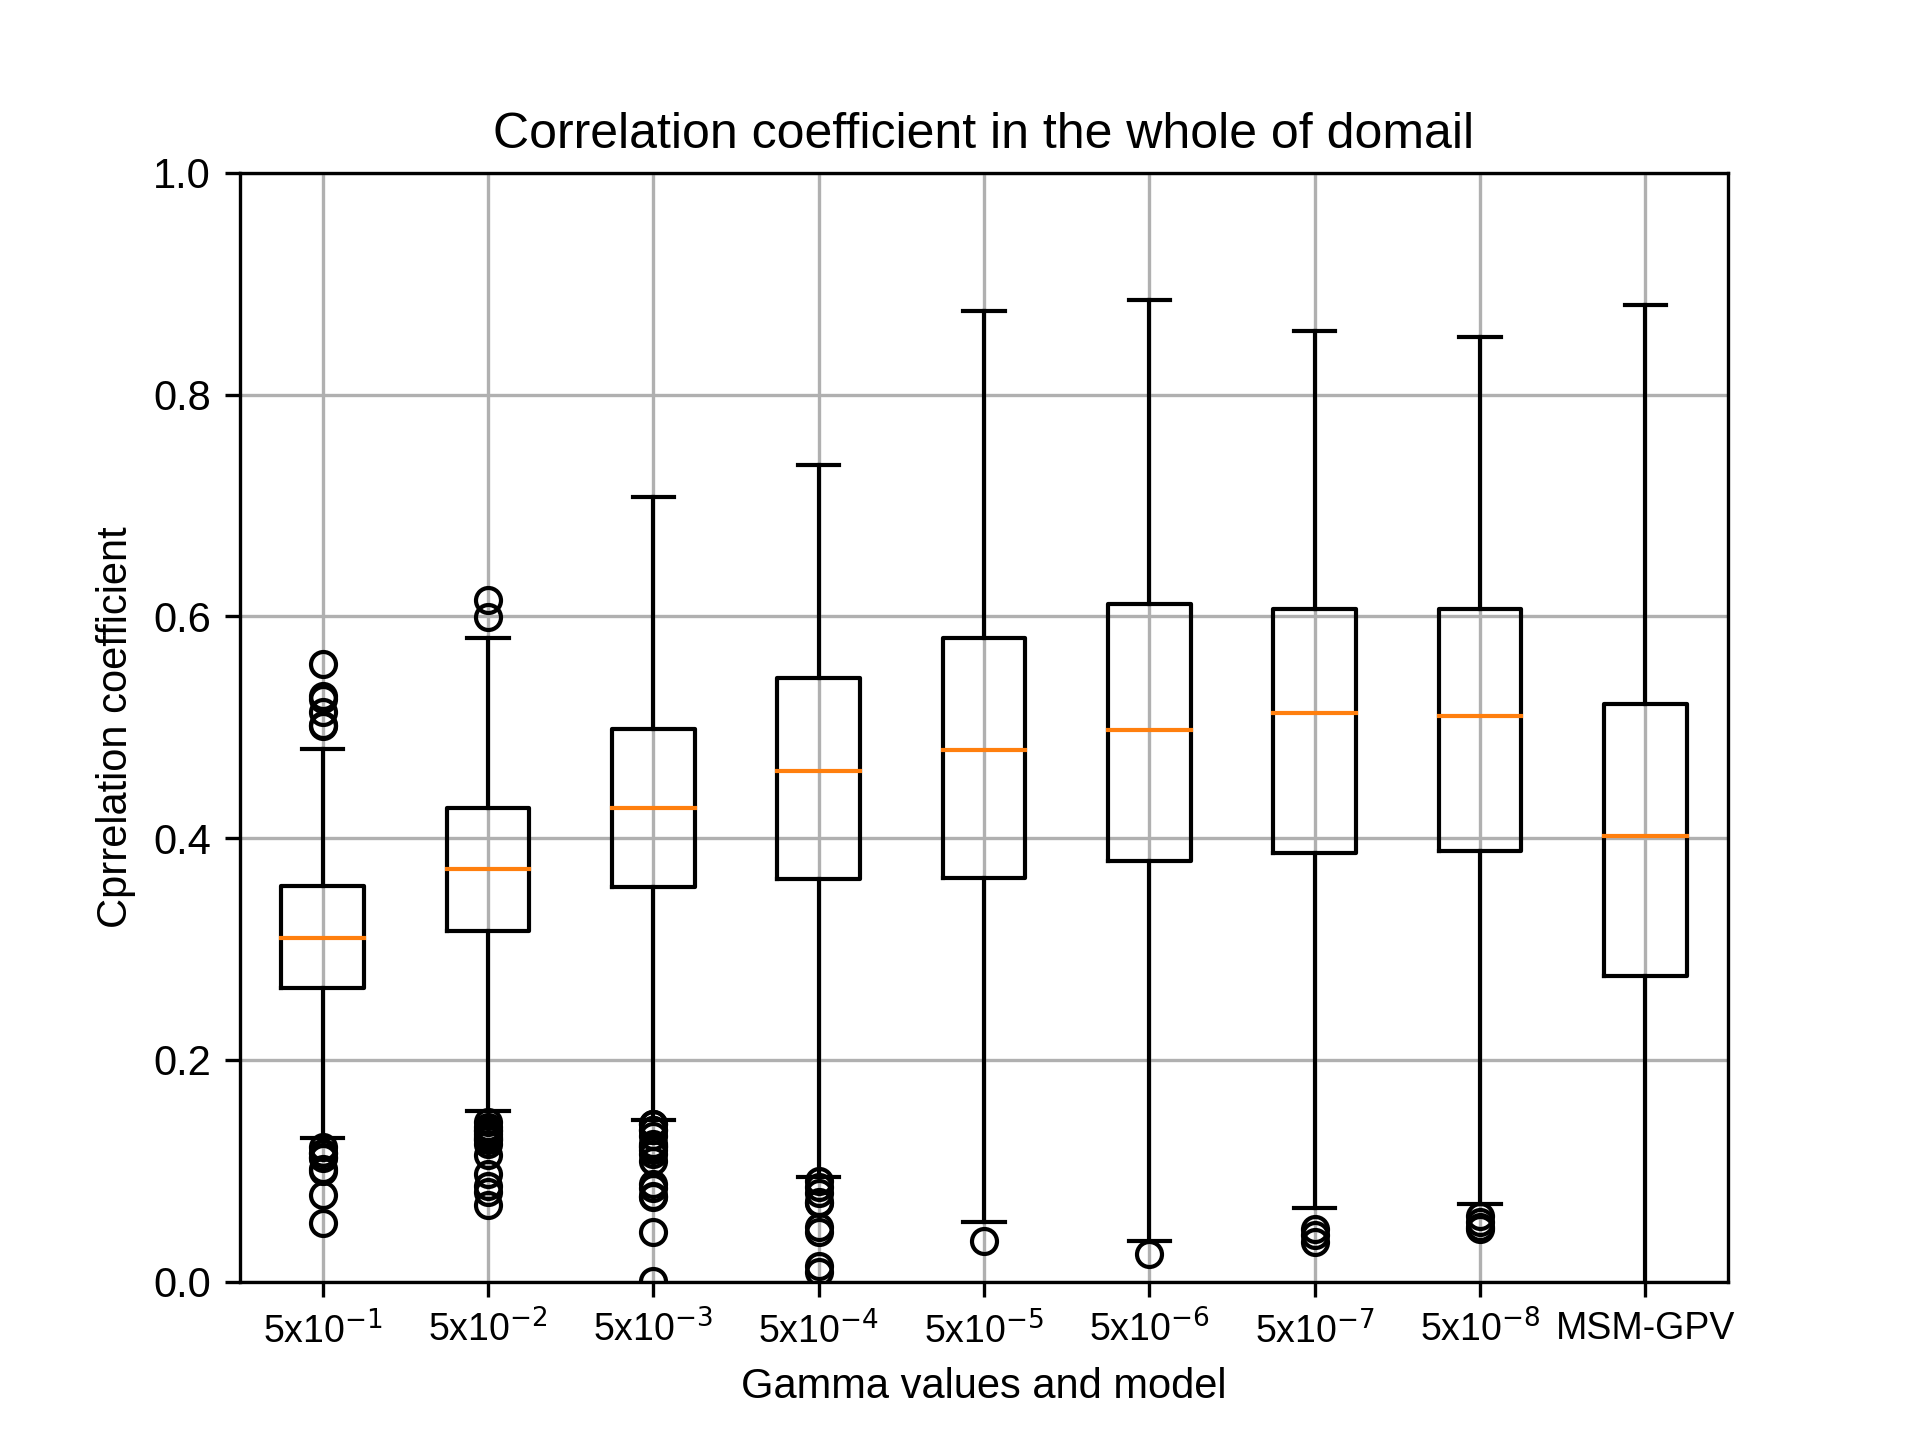
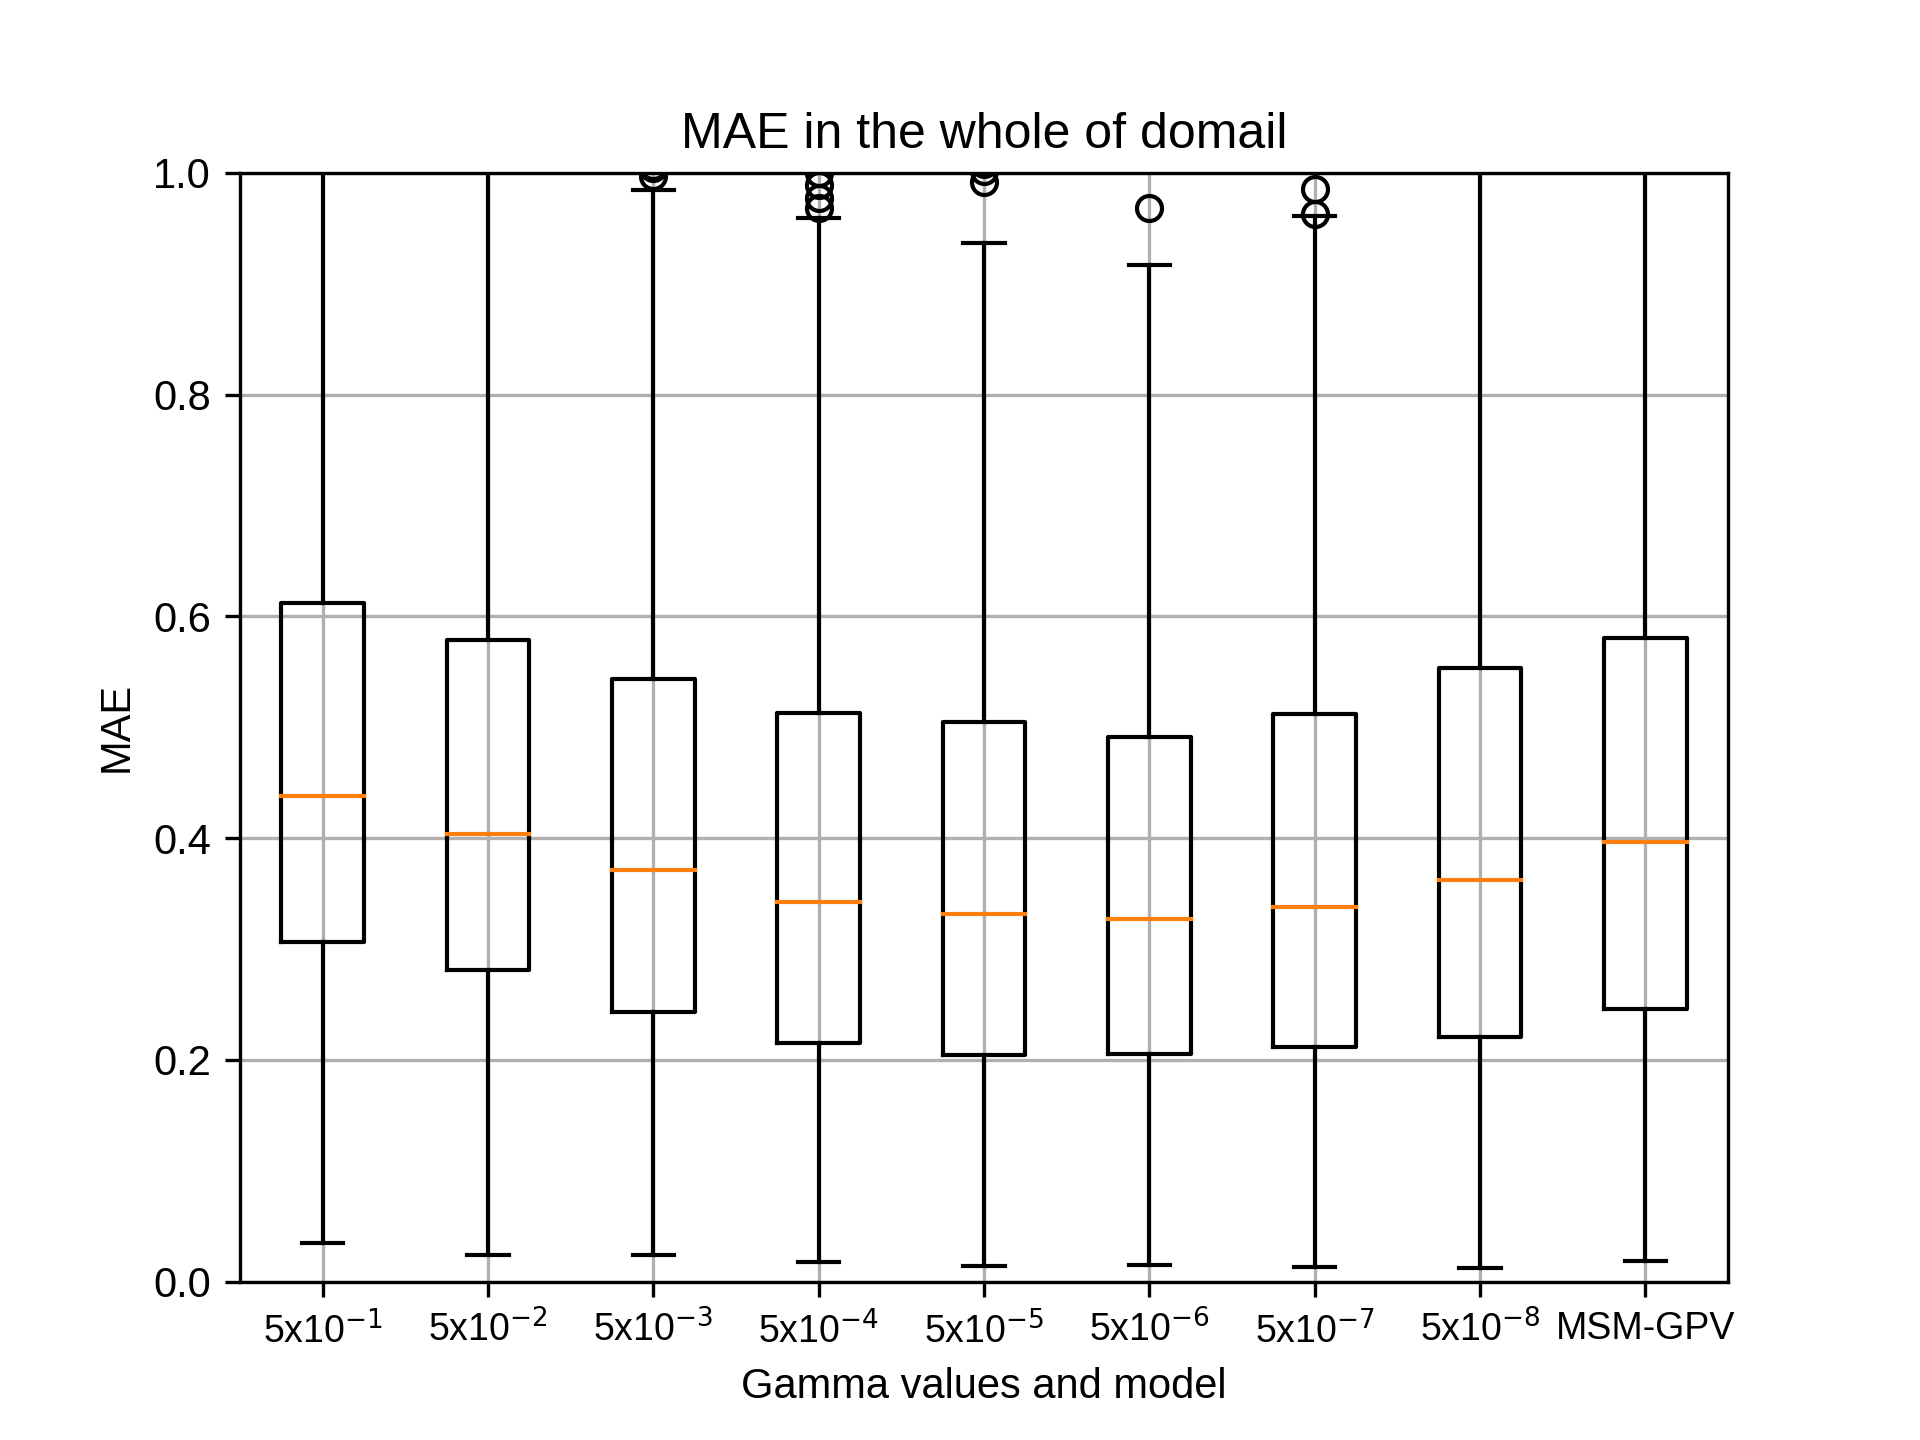
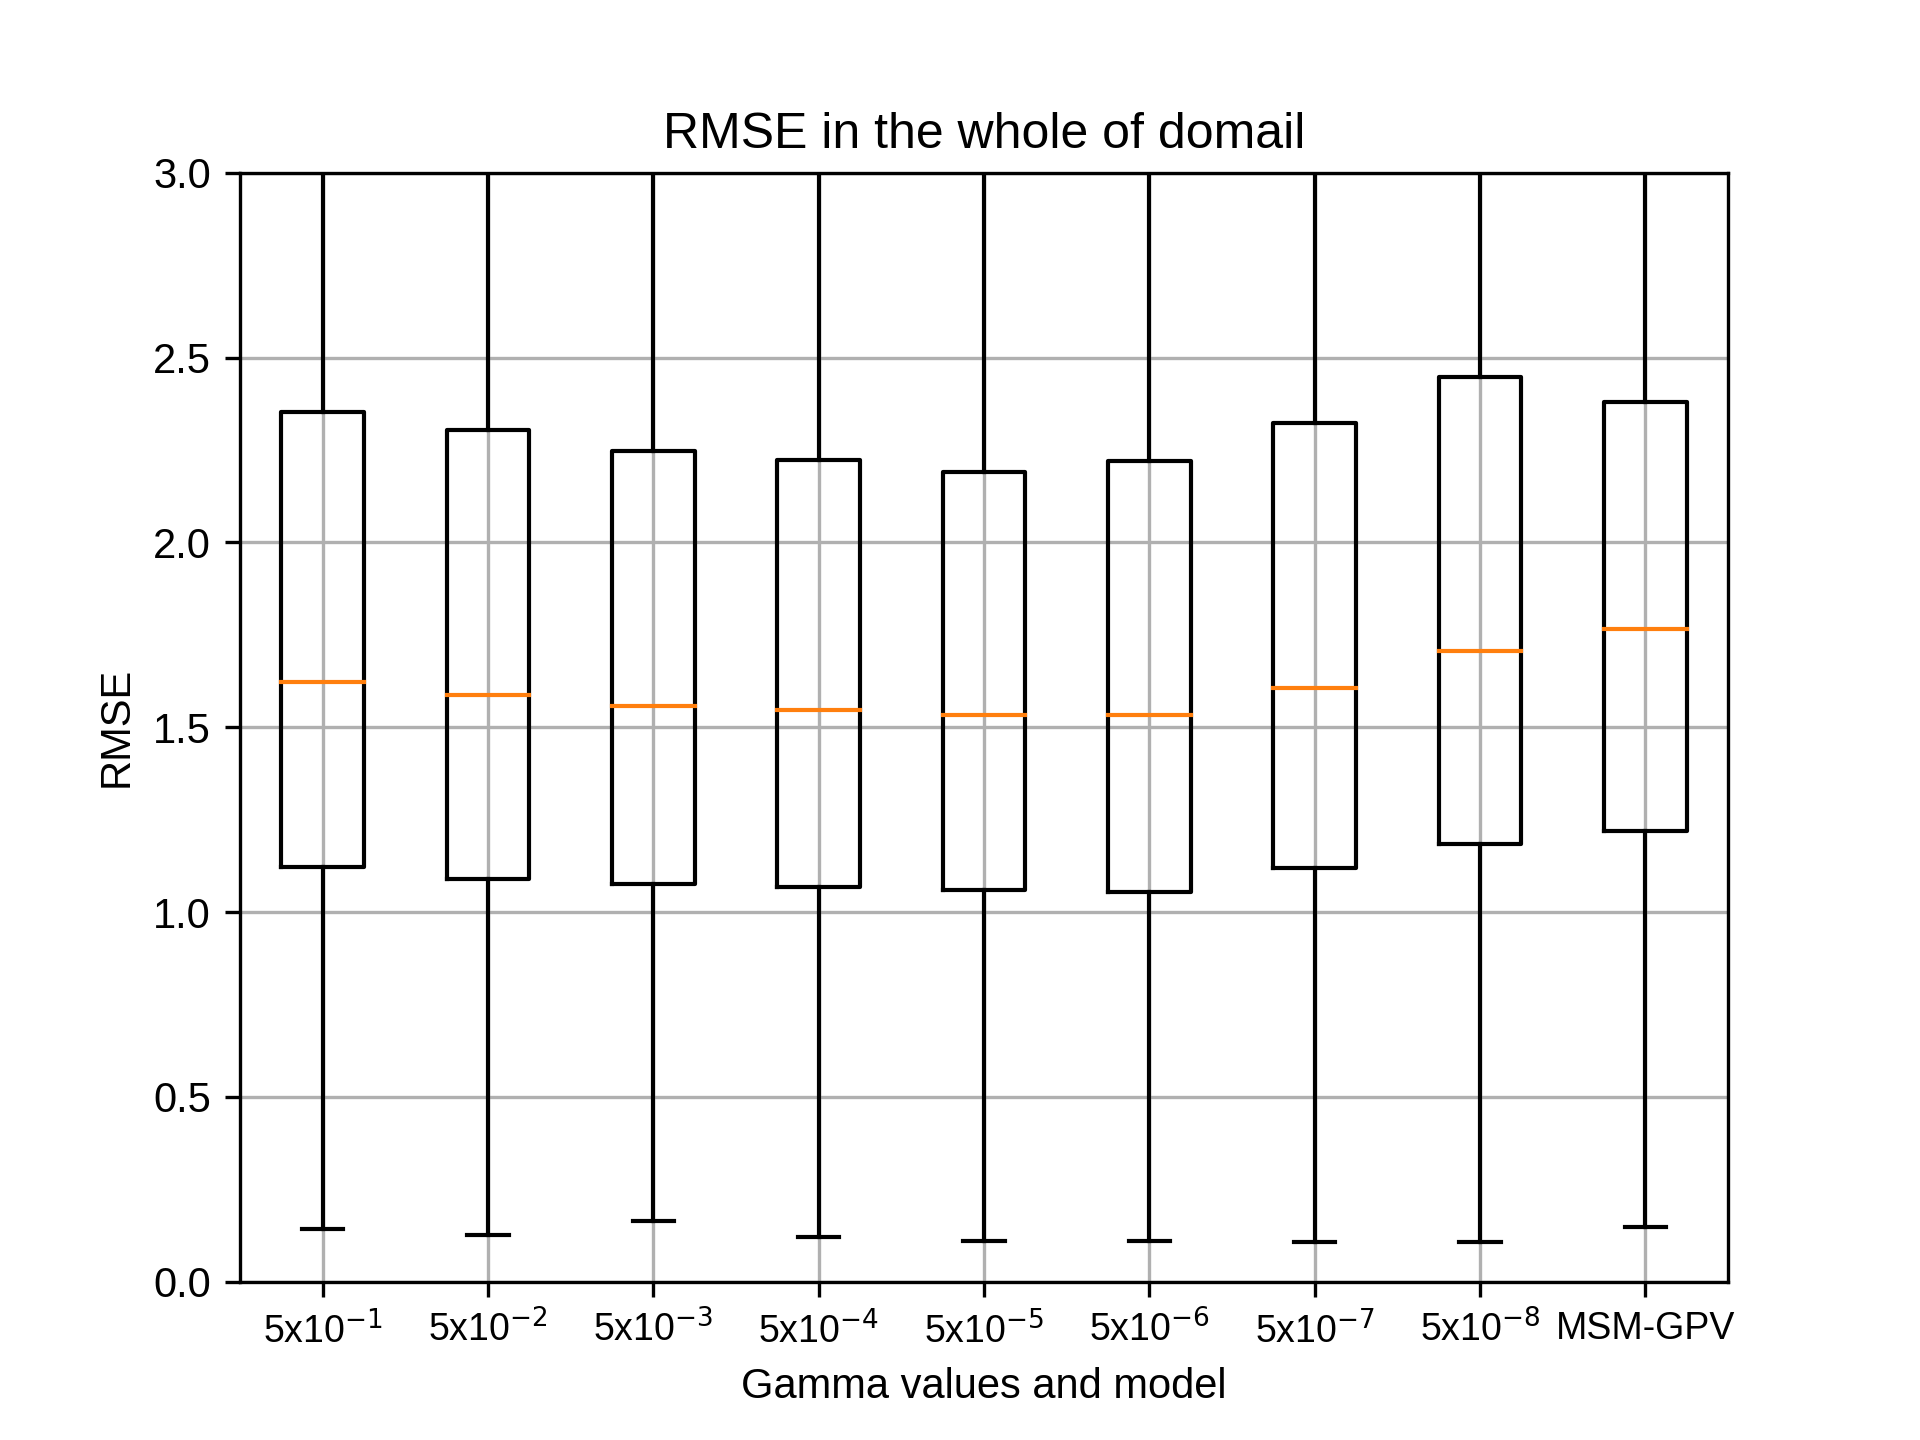
7月のsiteC,rg2=8の結果です。
kobayashi_yusukeThursday, October 22nd, 2020 at 4:33:48 PM GMT+09:00


7月のsiteC,rg2=10の結果です。
kobayashi_yusukeThursday, October 22nd, 2020 at 4:34:13 PM GMT+09:00
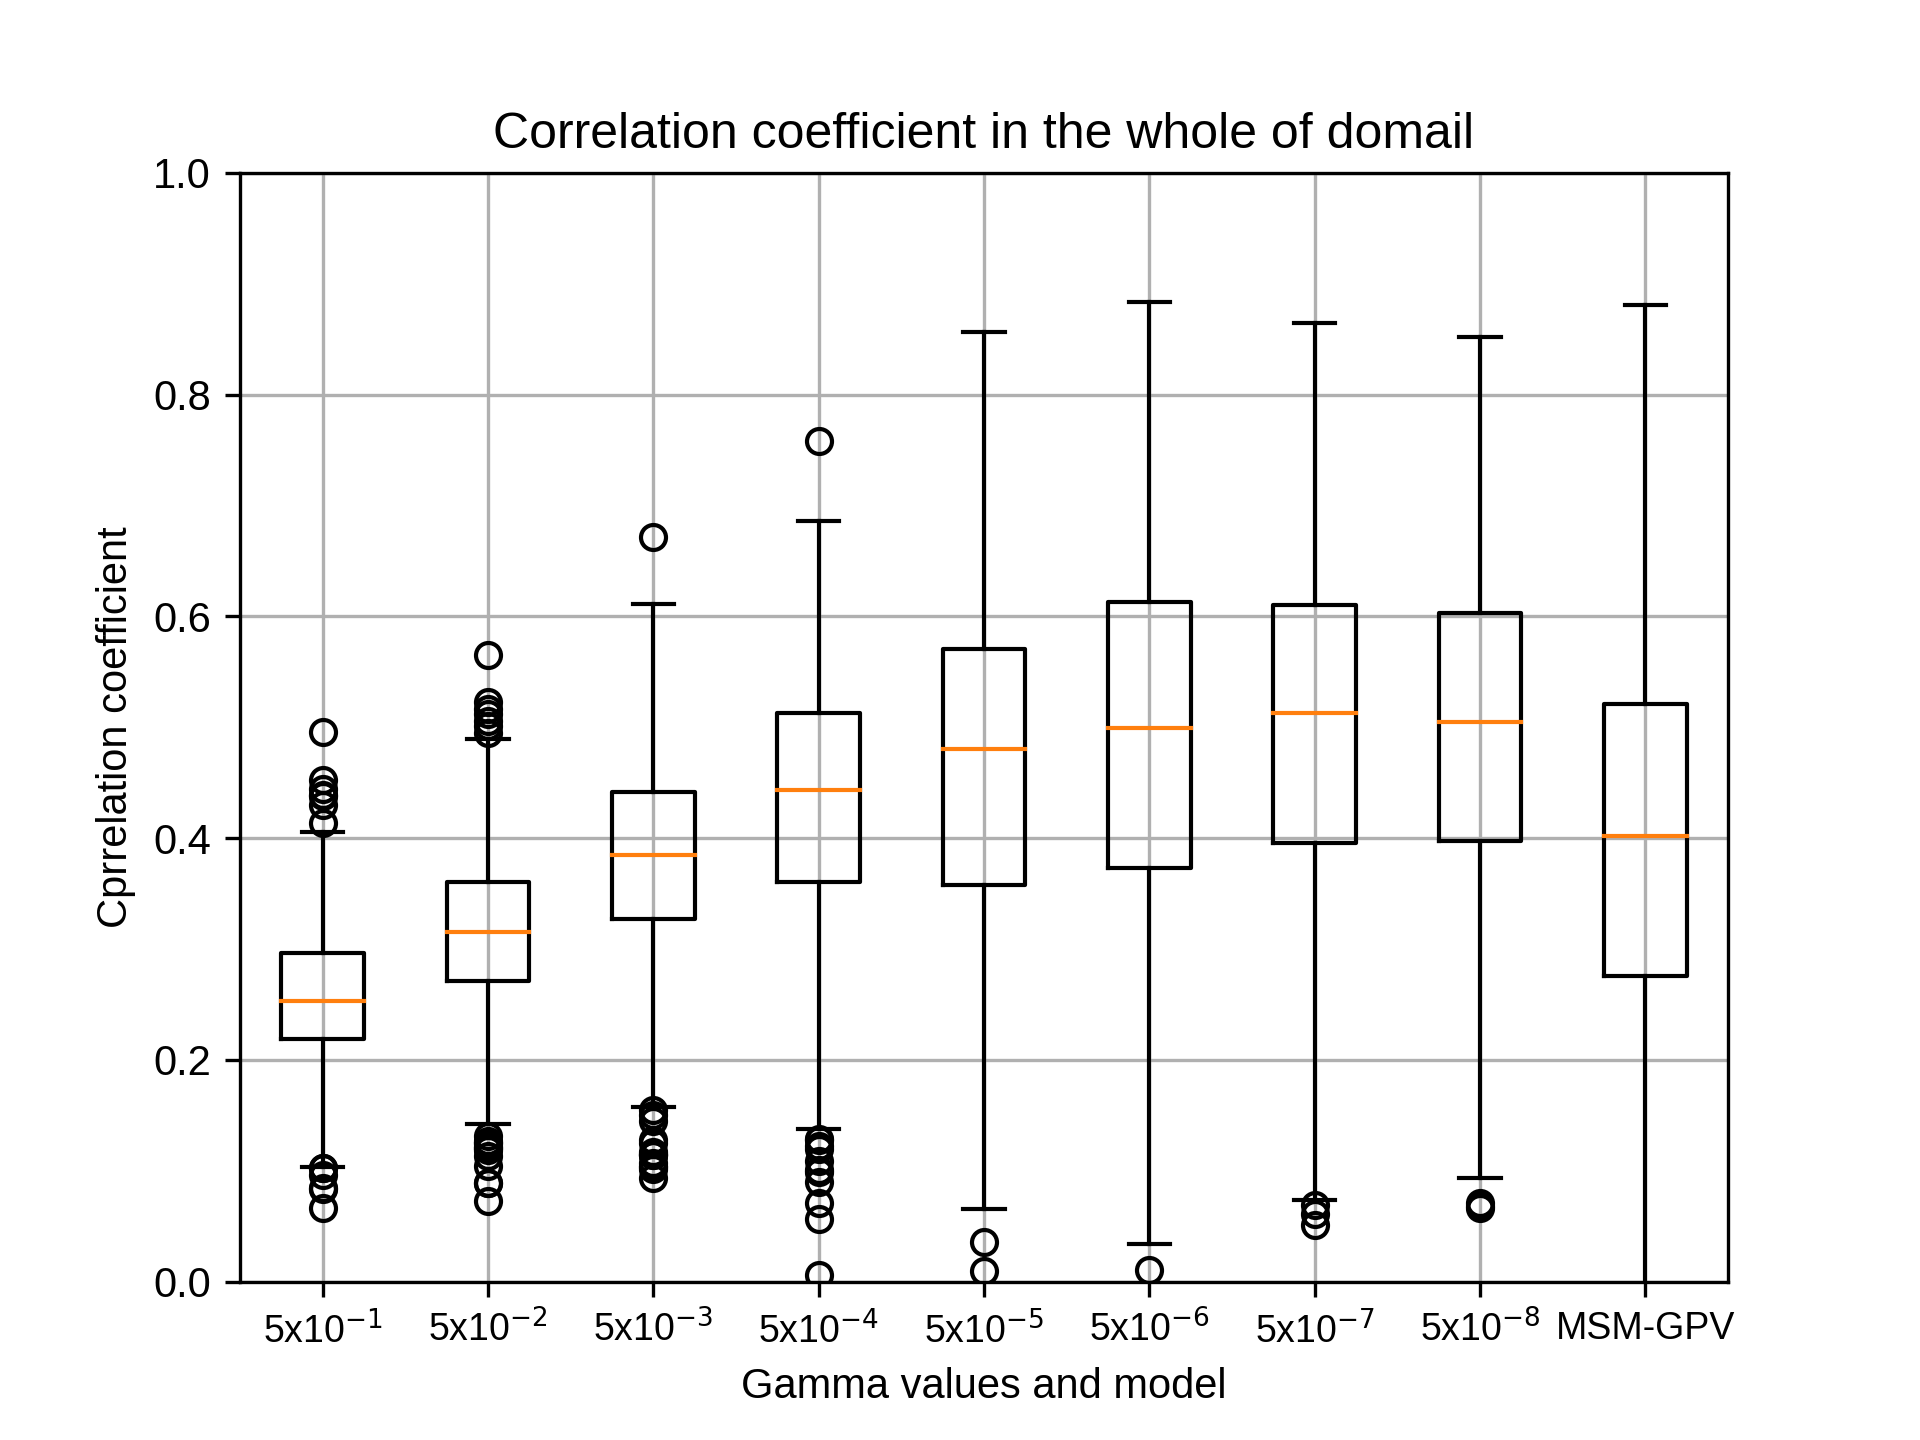
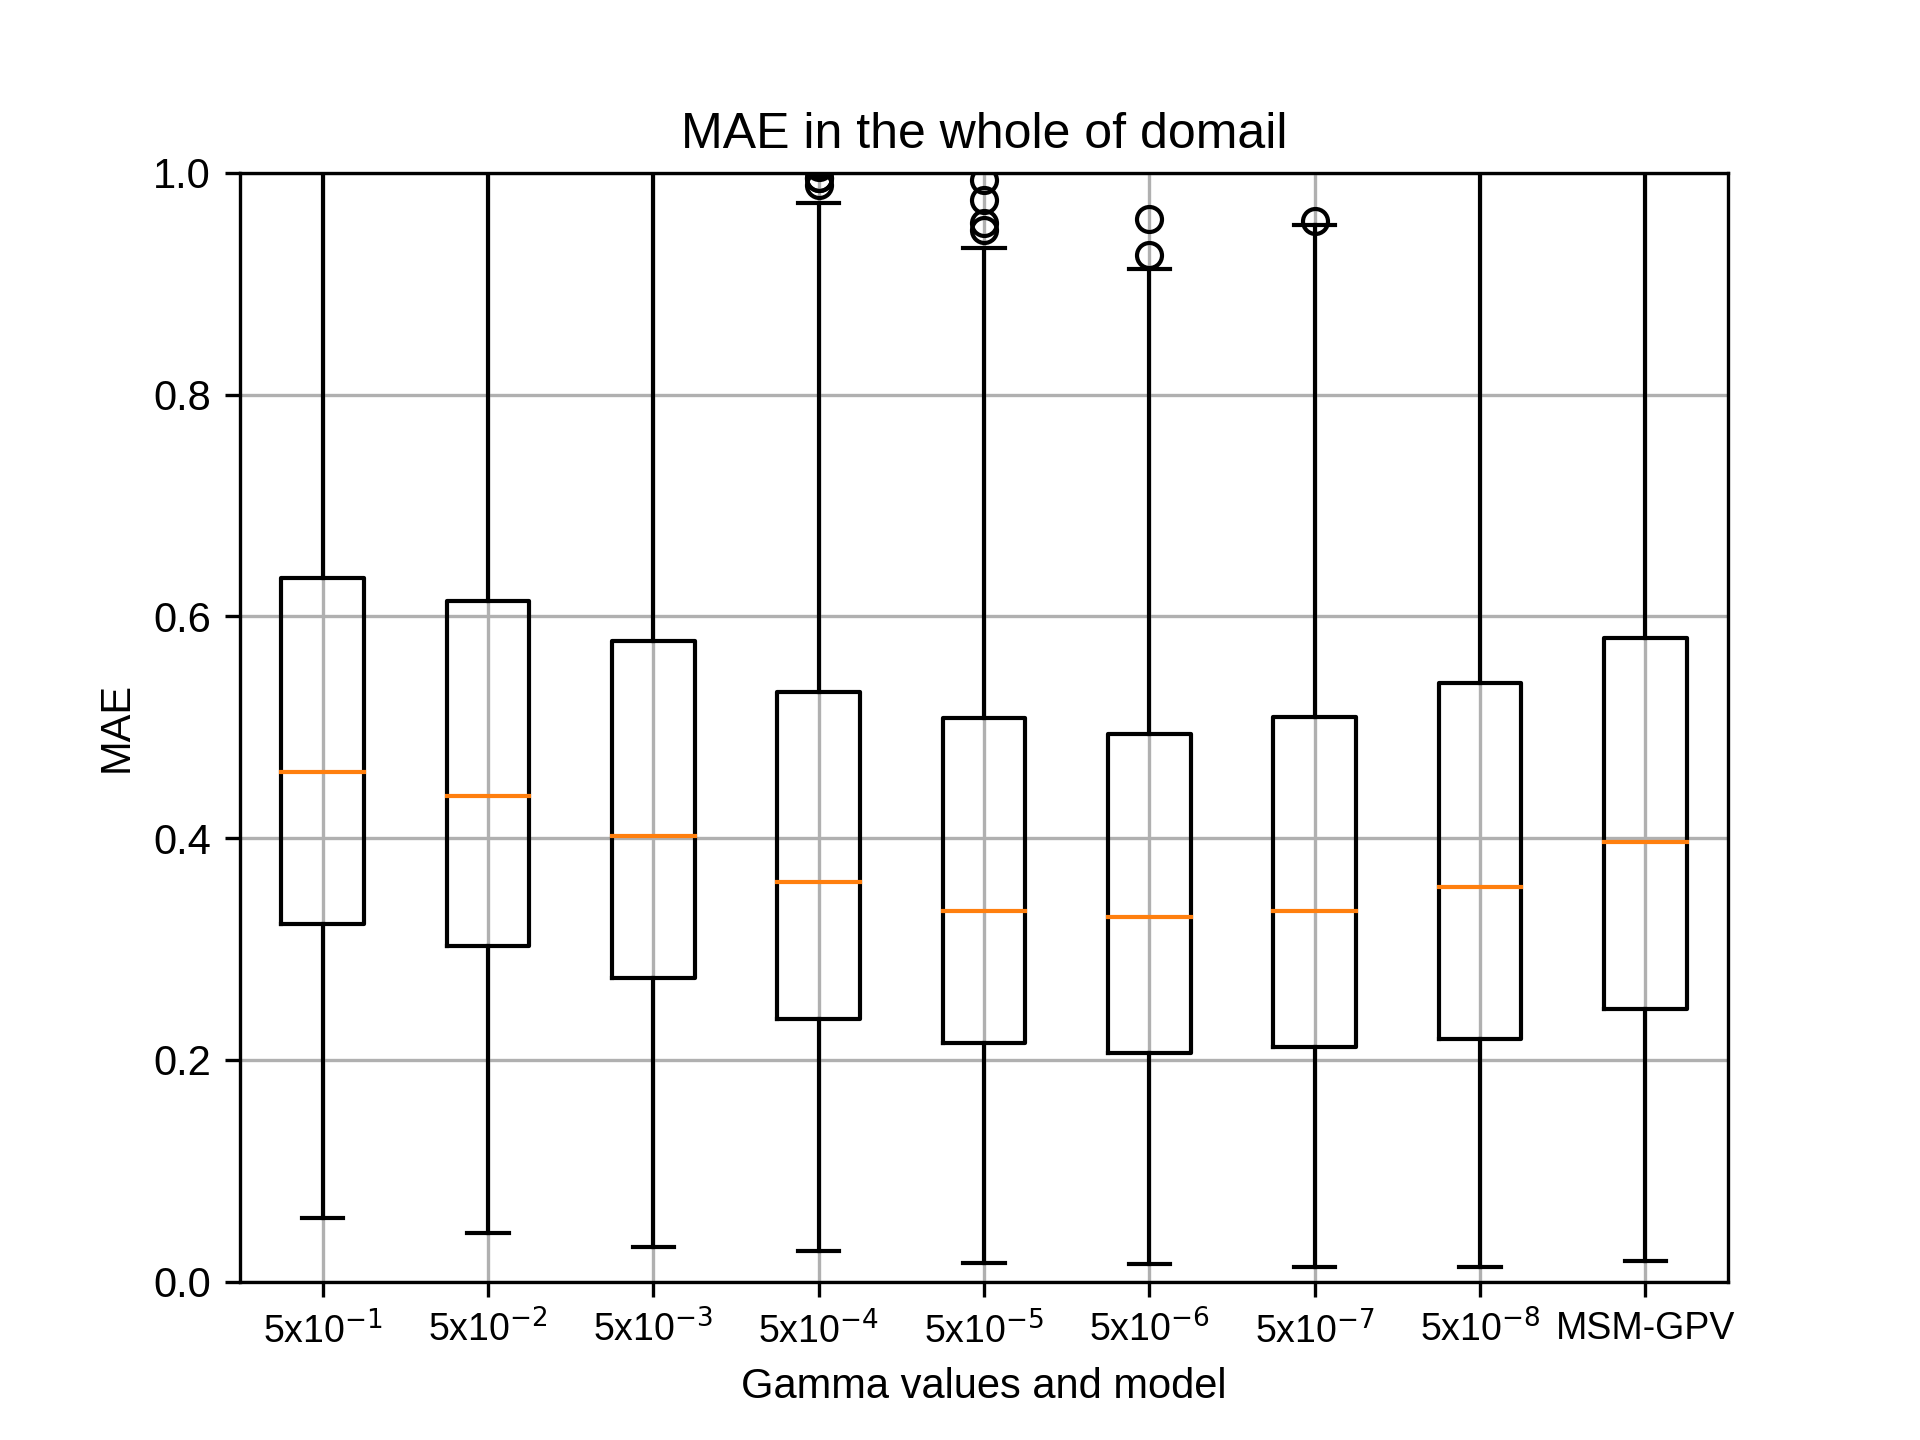
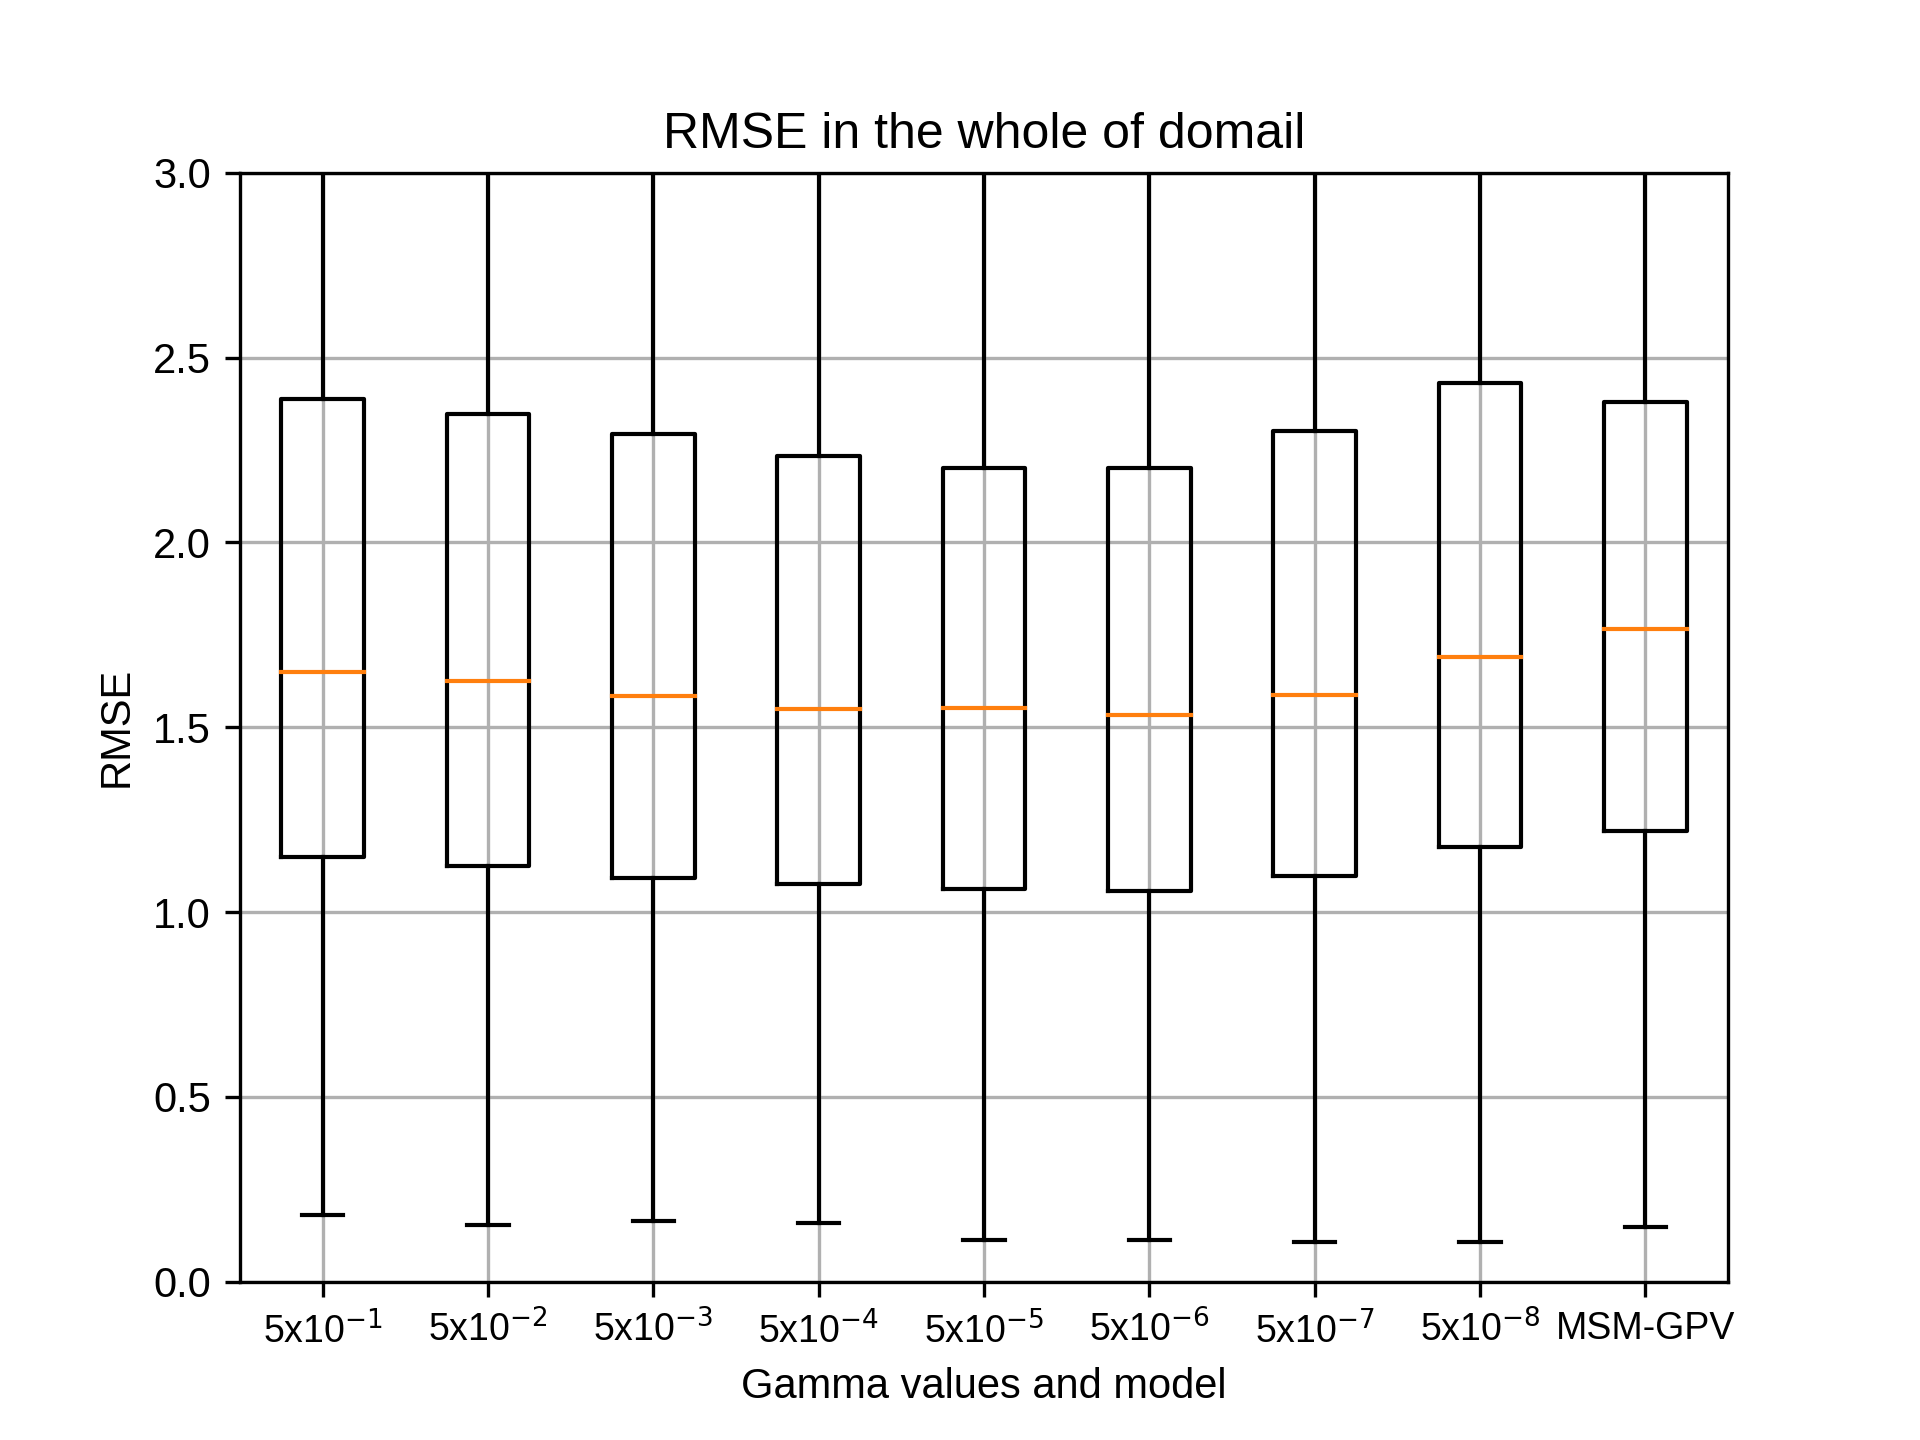
7月のsiteC,rg2=12の結果です。
7月のsiteCではrg2=10でgammaが5x10⁻⁷のとき、相関係数の中央値が最も高くなりました。
7月のsiteCではrg2=10でgammaが5x10⁻⁷のとき、相関係数の中央値が最も高くなりました。
kobayashi_yusukeThursday, October 22nd, 2020 at 4:34:31 PM GMT+09:00
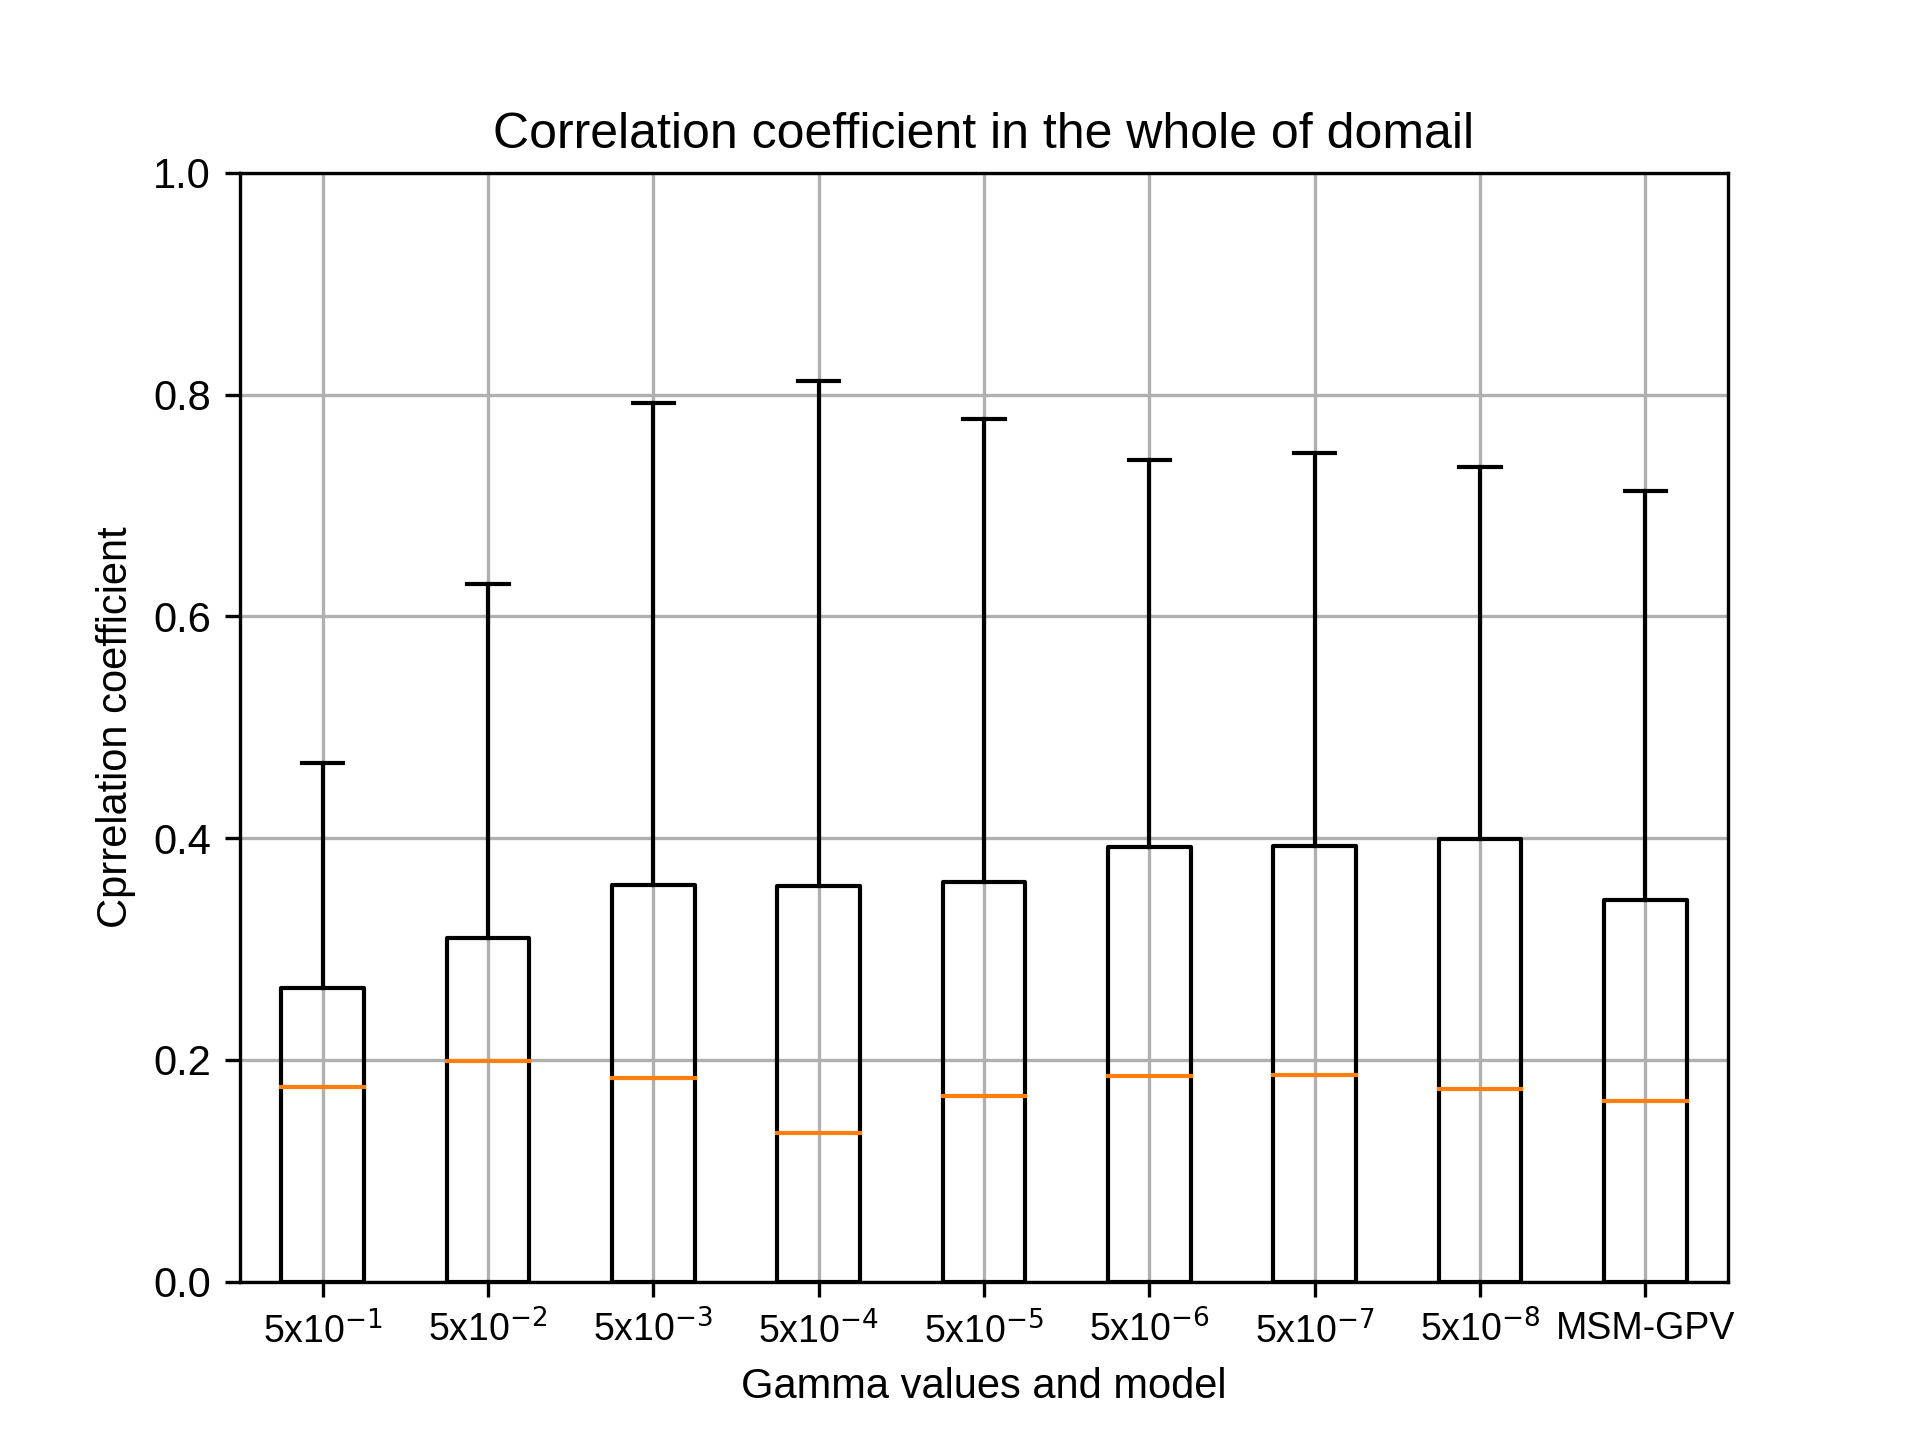
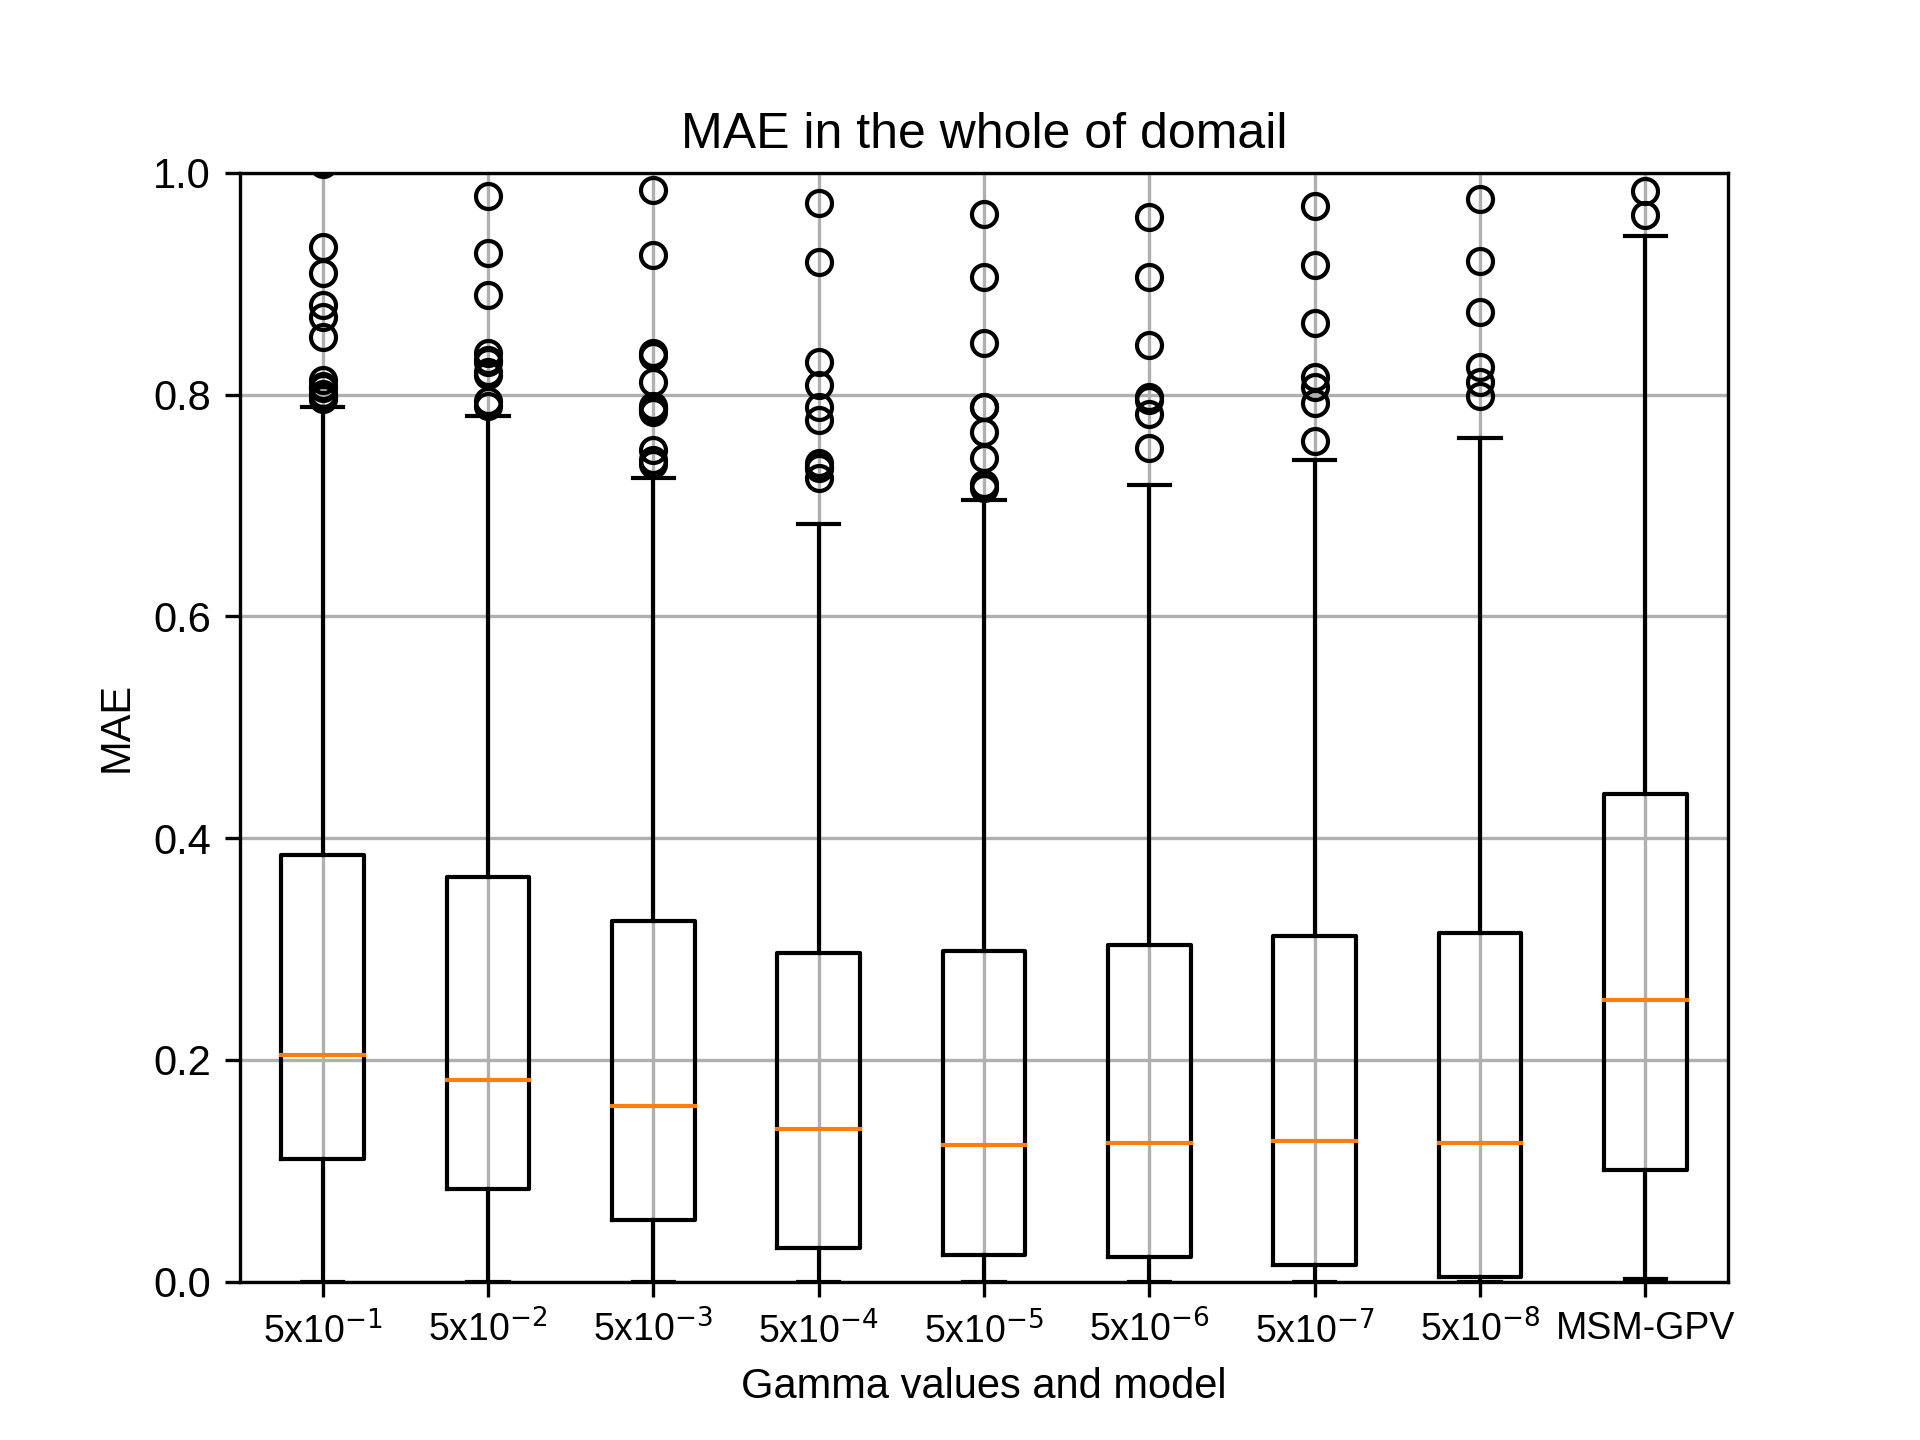
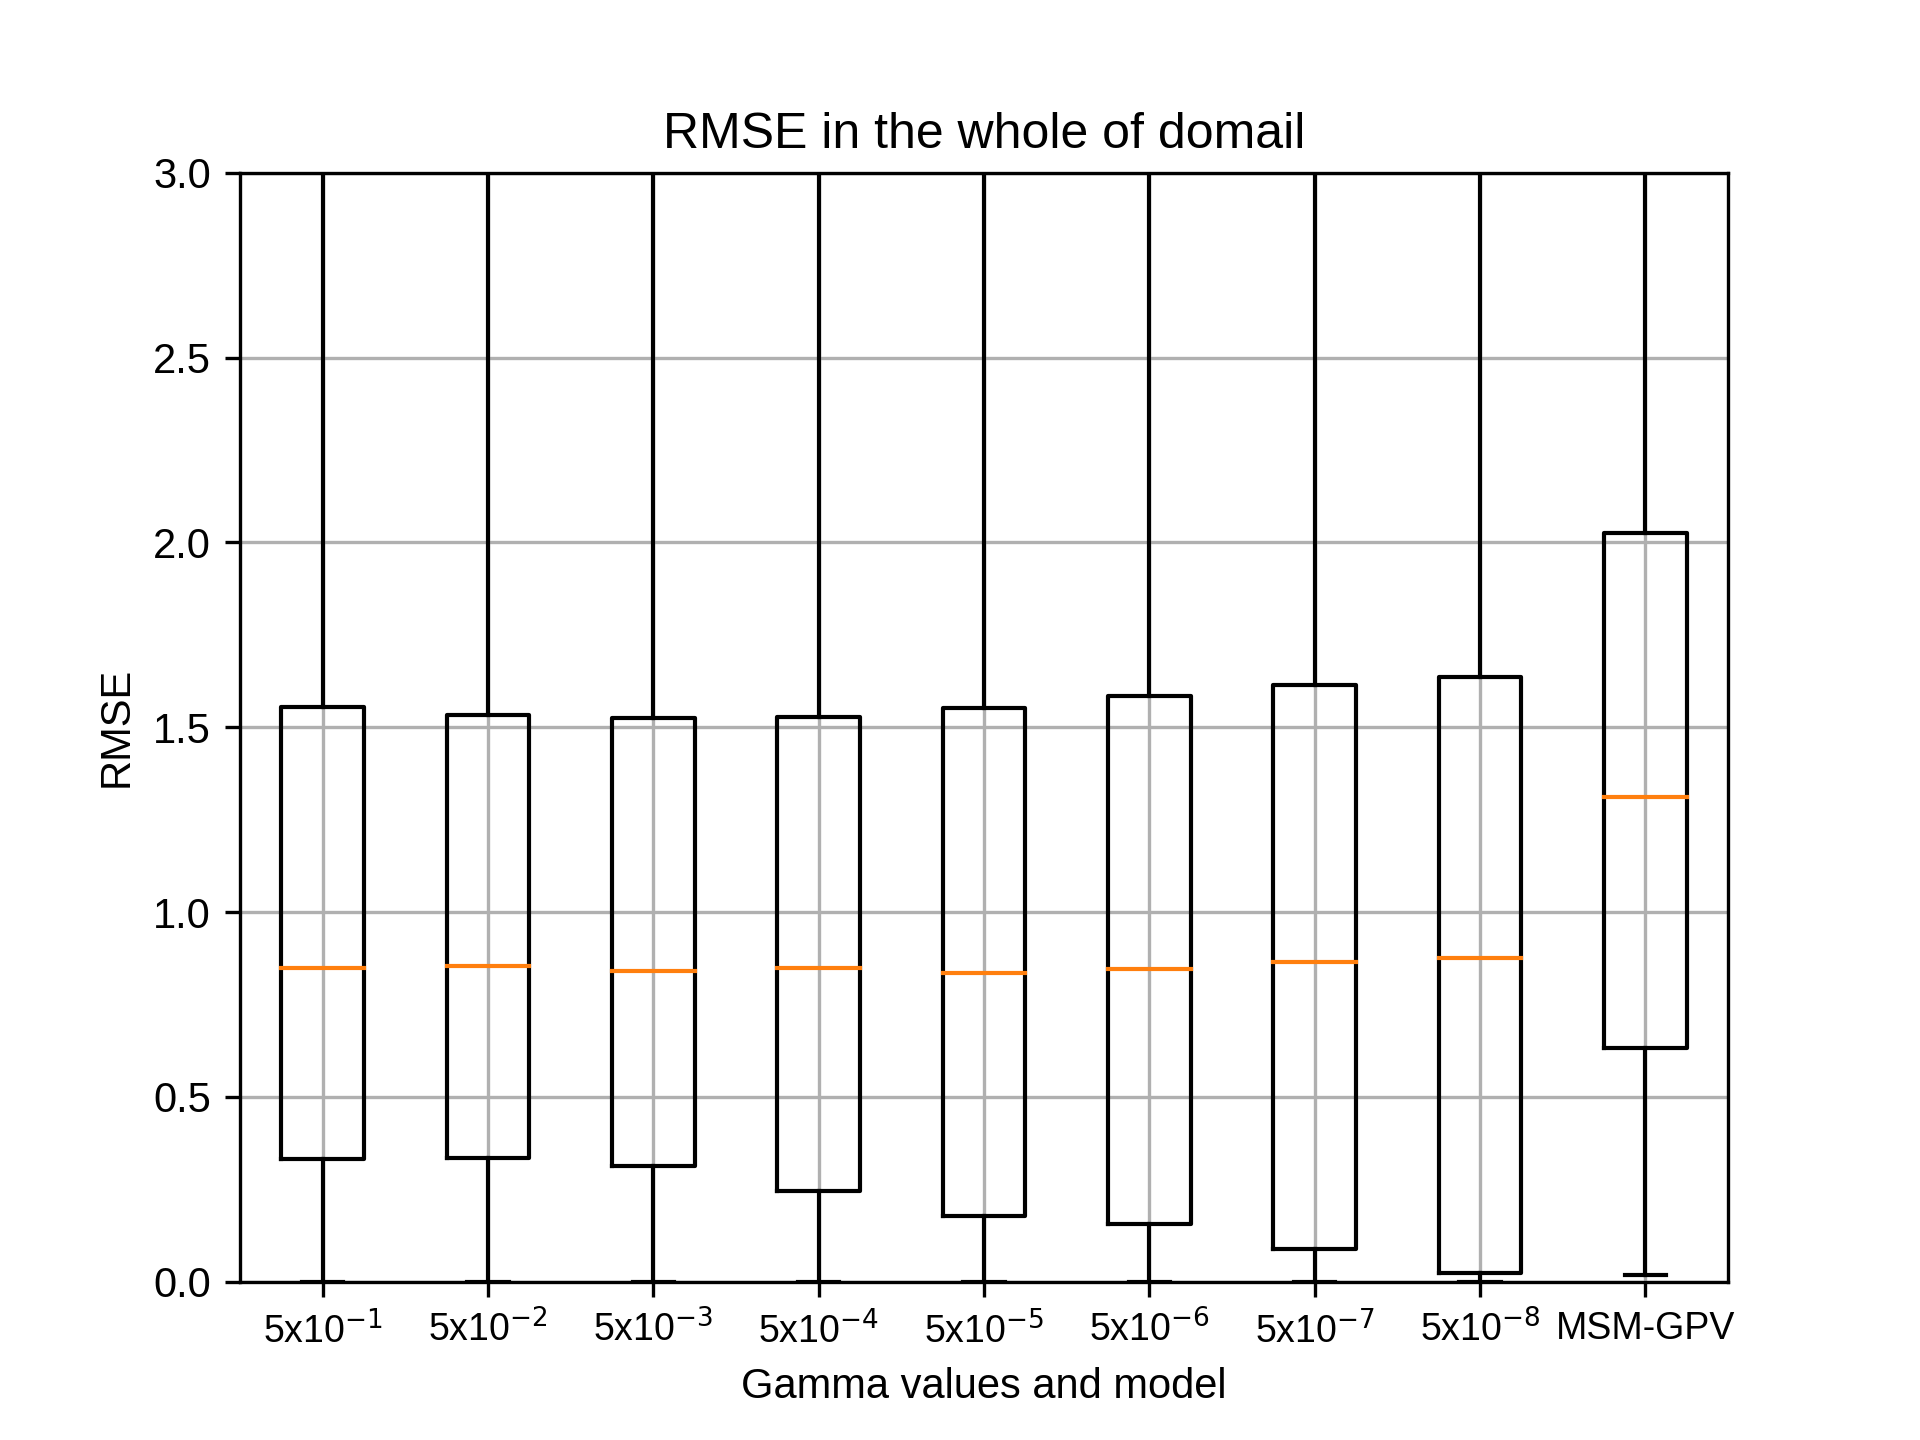
7月のsiteD,rg2=4の結果です。
kobayashi_yusukeThursday, October 22nd, 2020 at 4:34:53 PM GMT+09:00
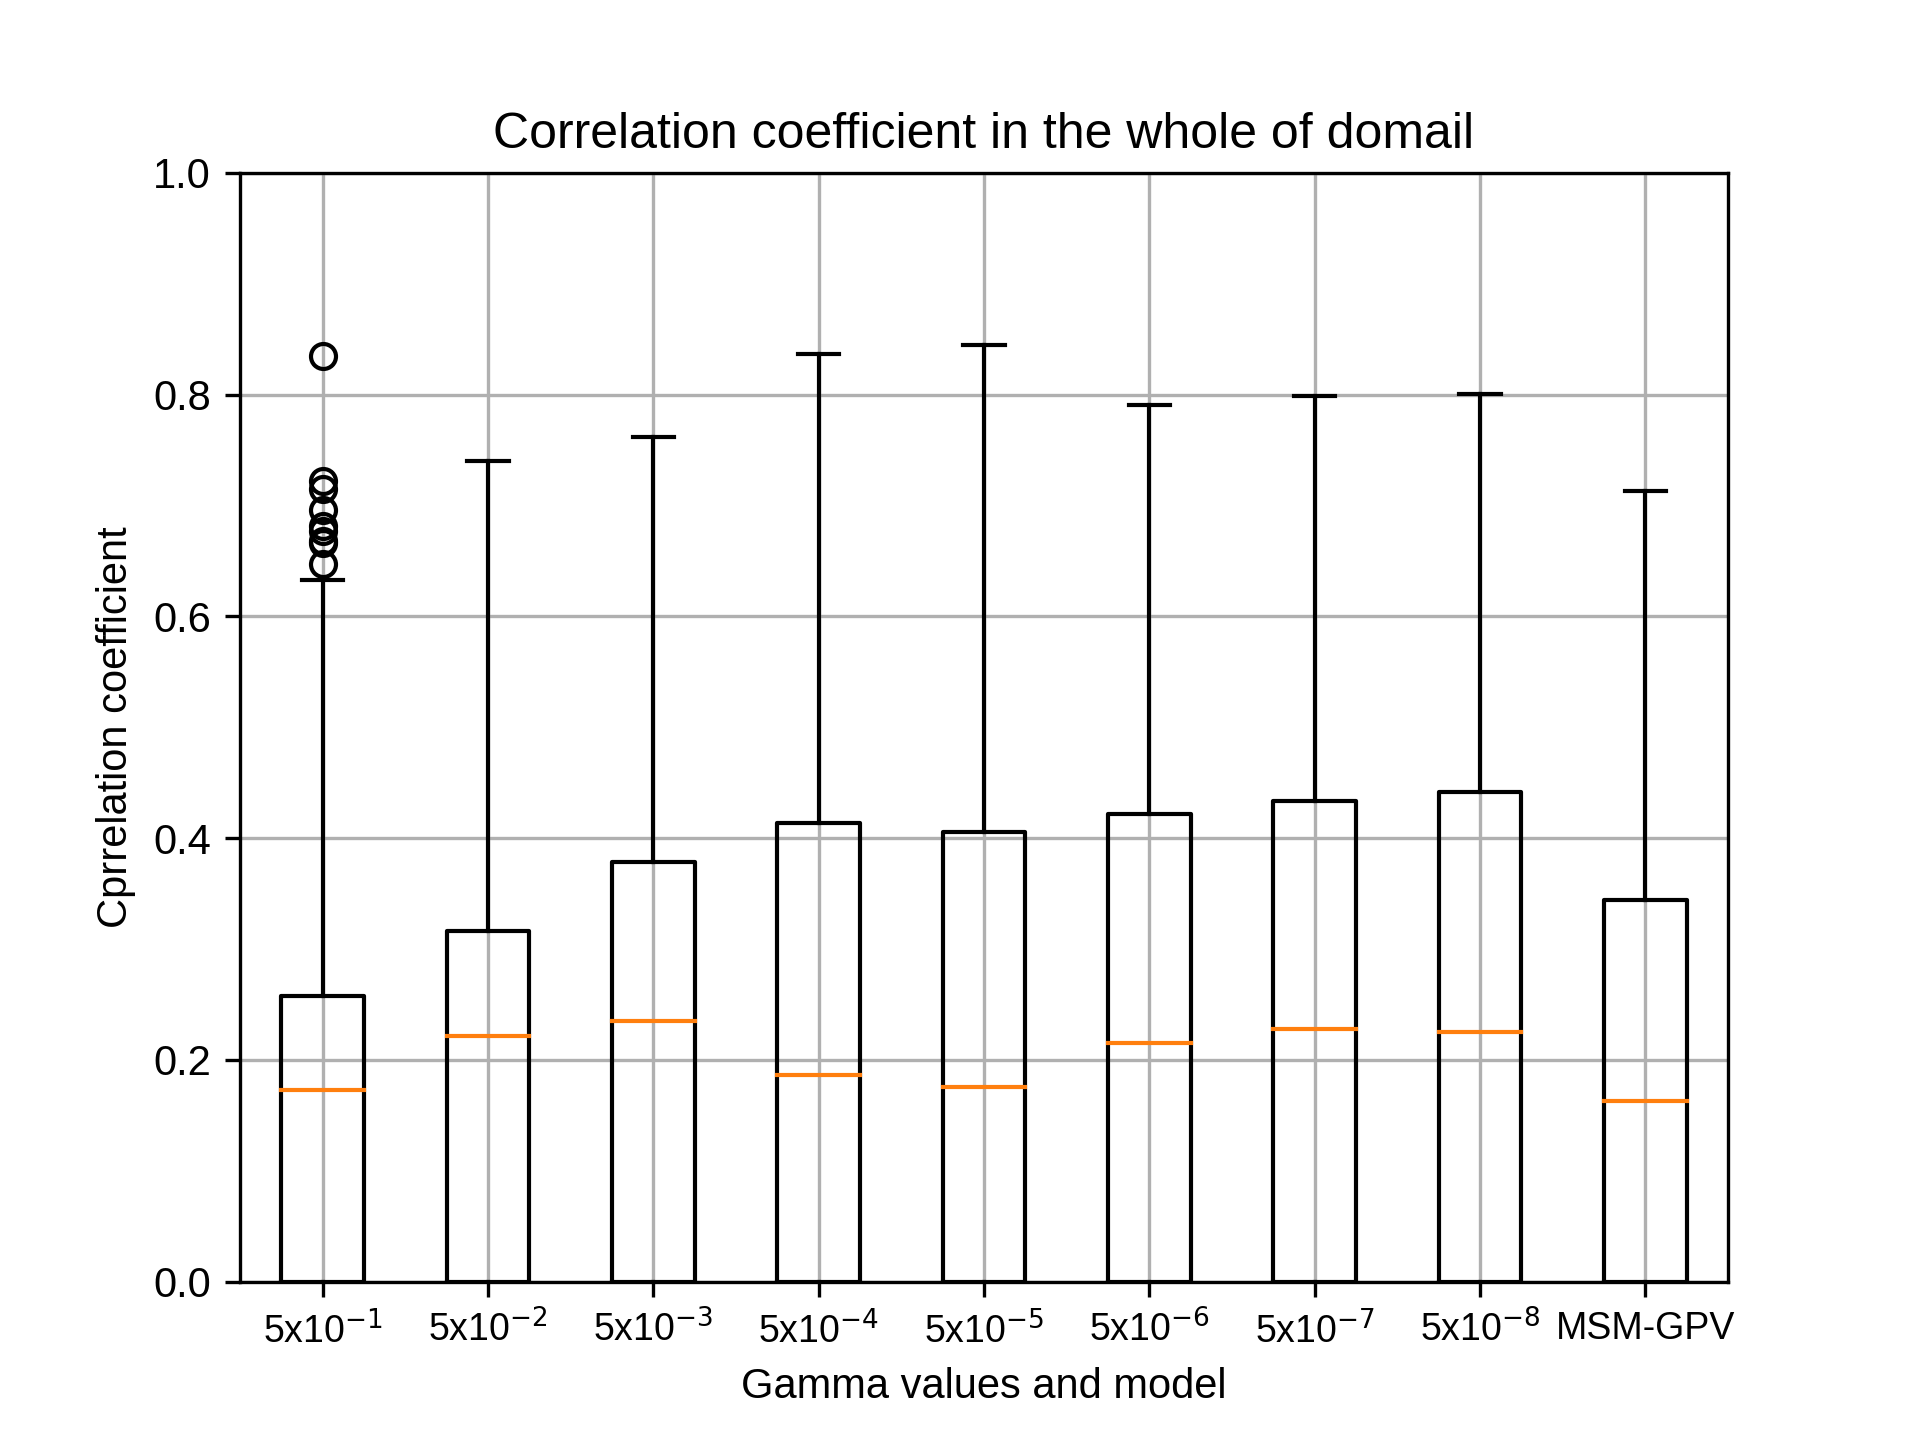
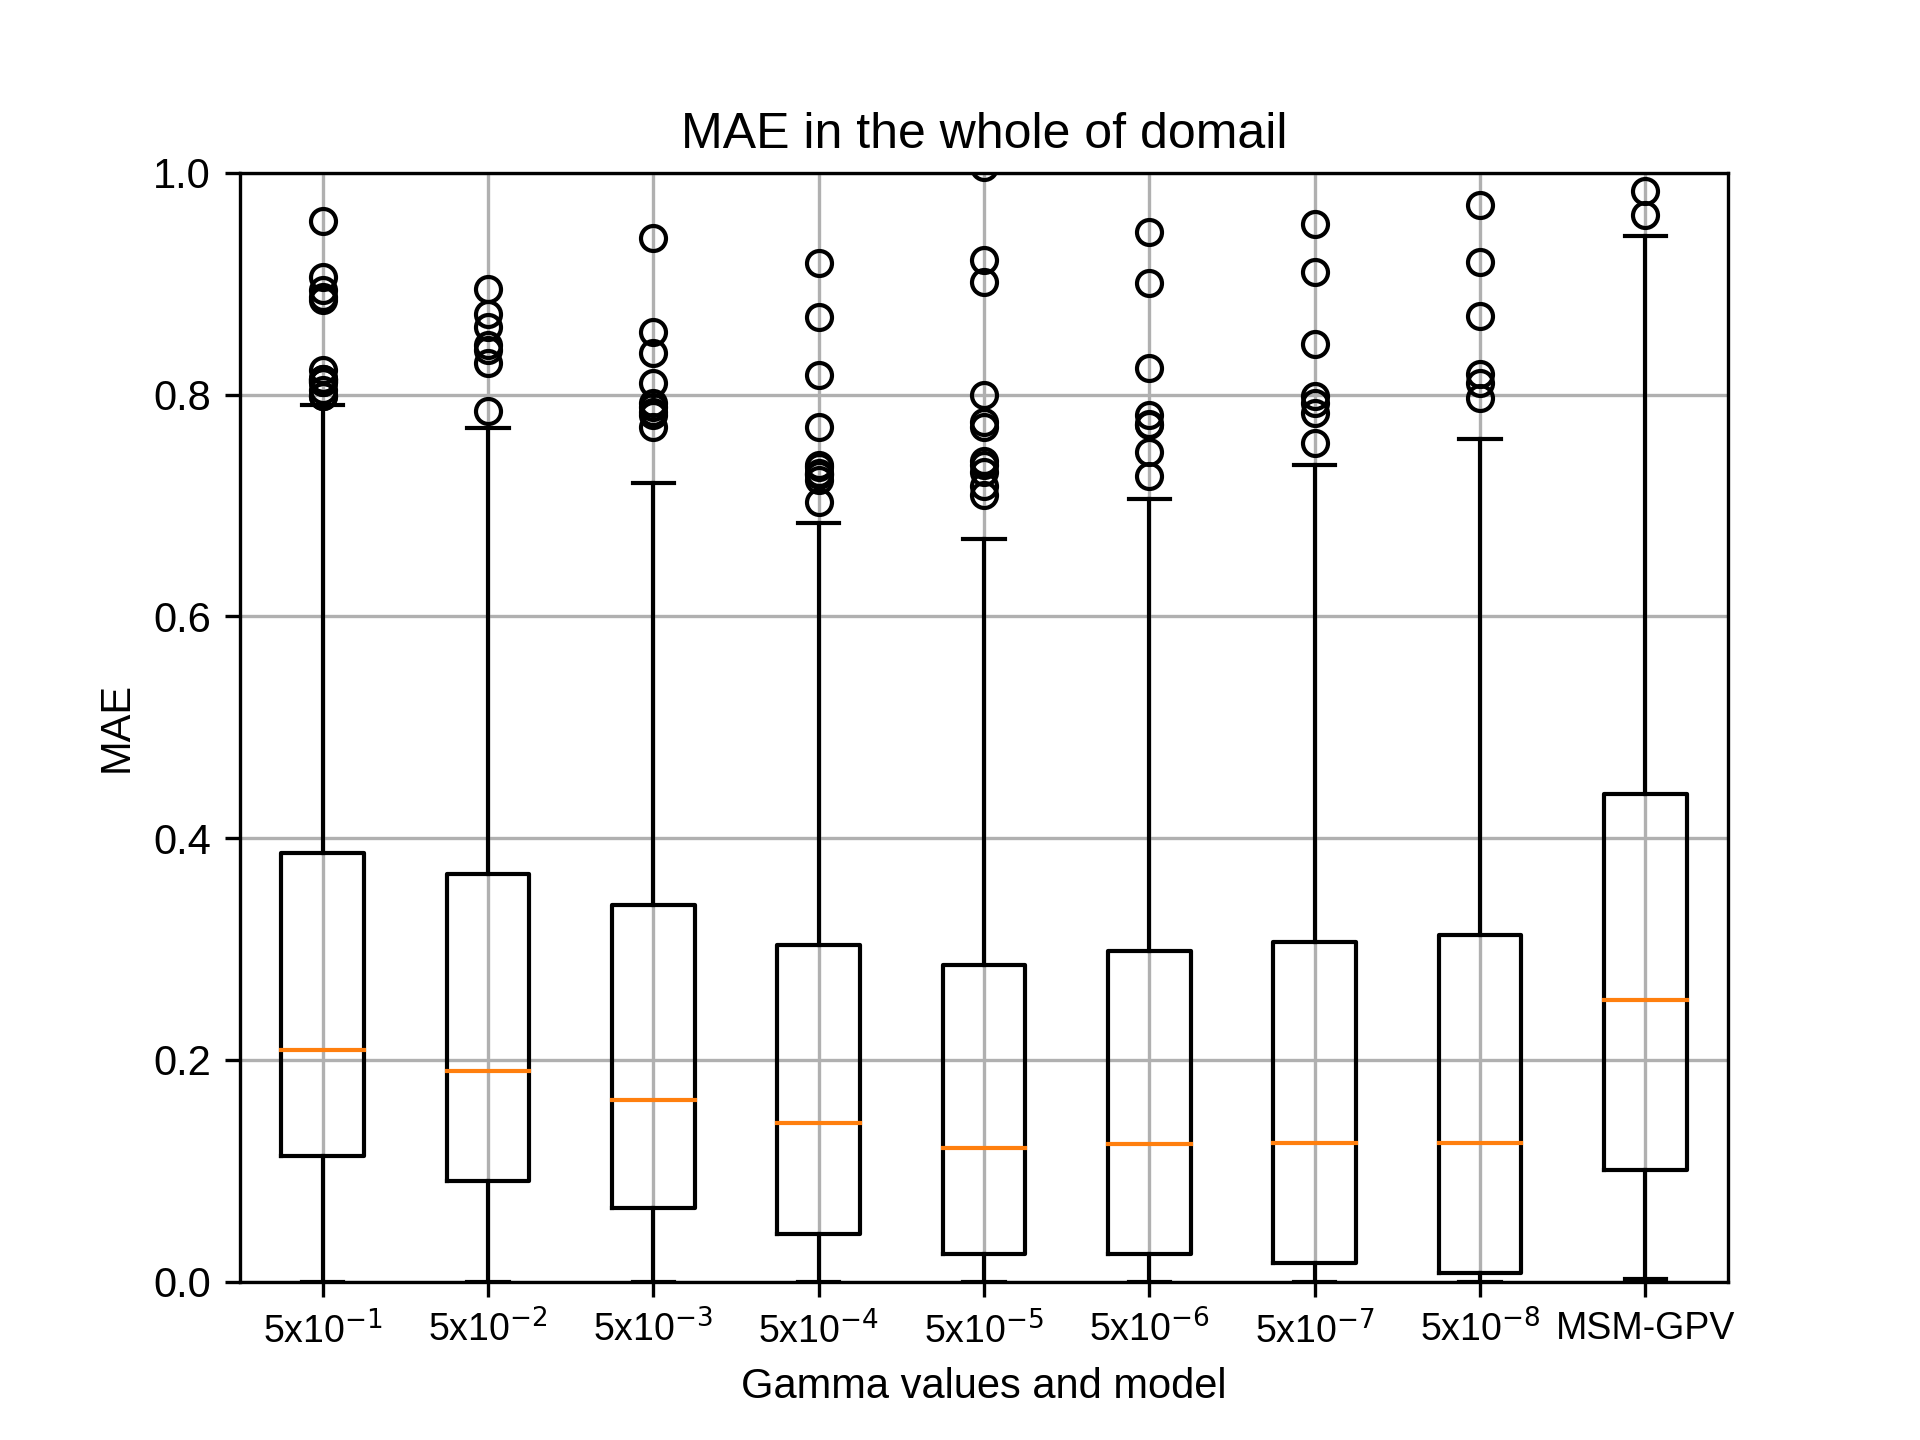
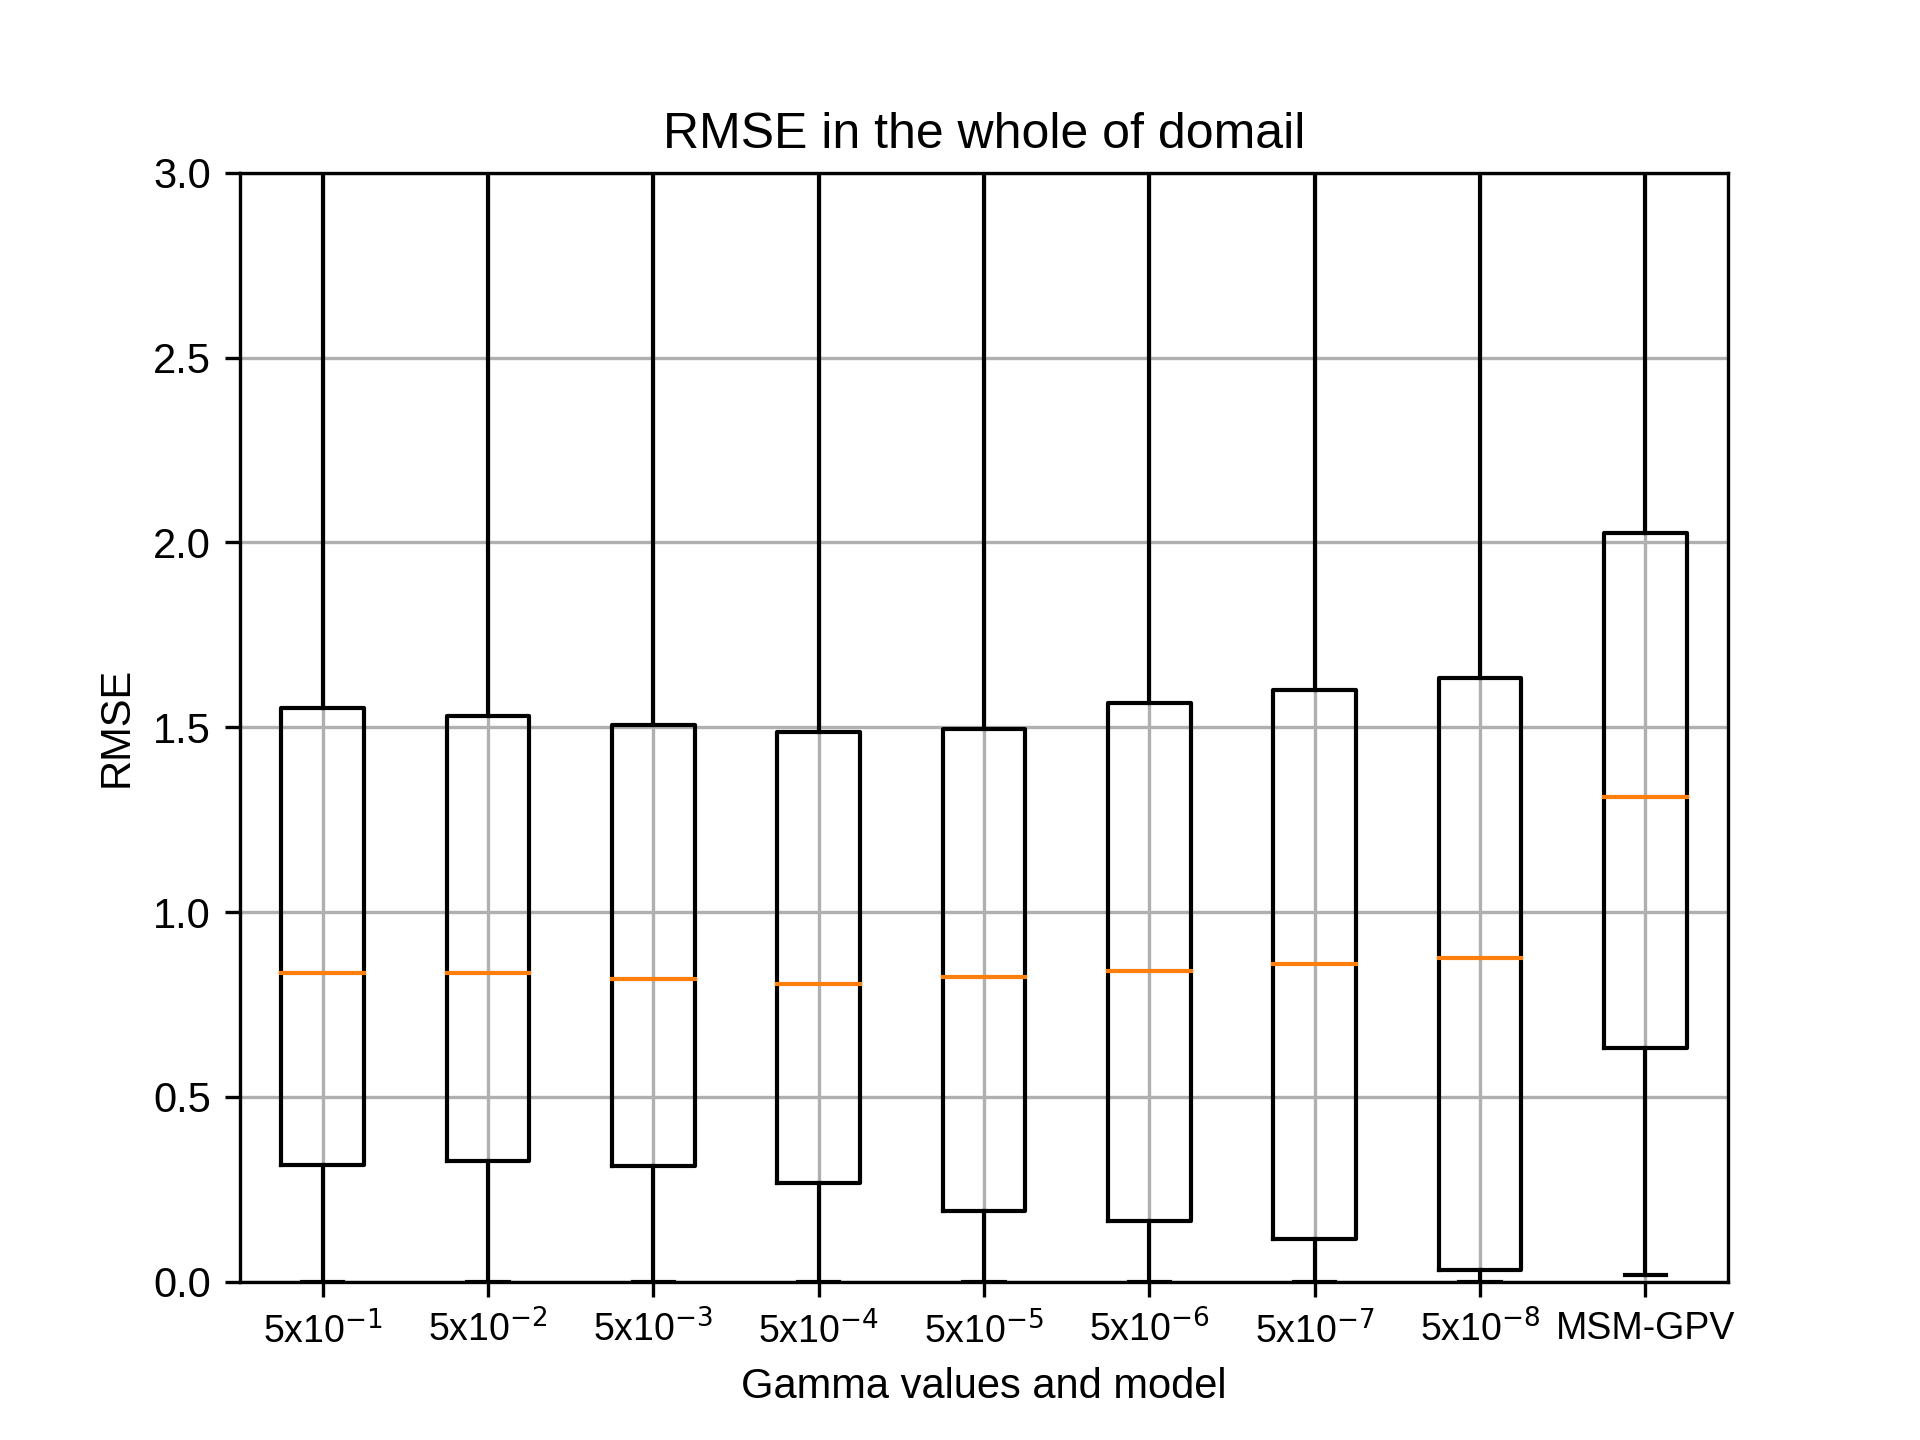
7月のsiteD,rg2=6の結果です。
kobayashi_yusukeThursday, October 22nd, 2020 at 4:35:00 PM GMT+09:00
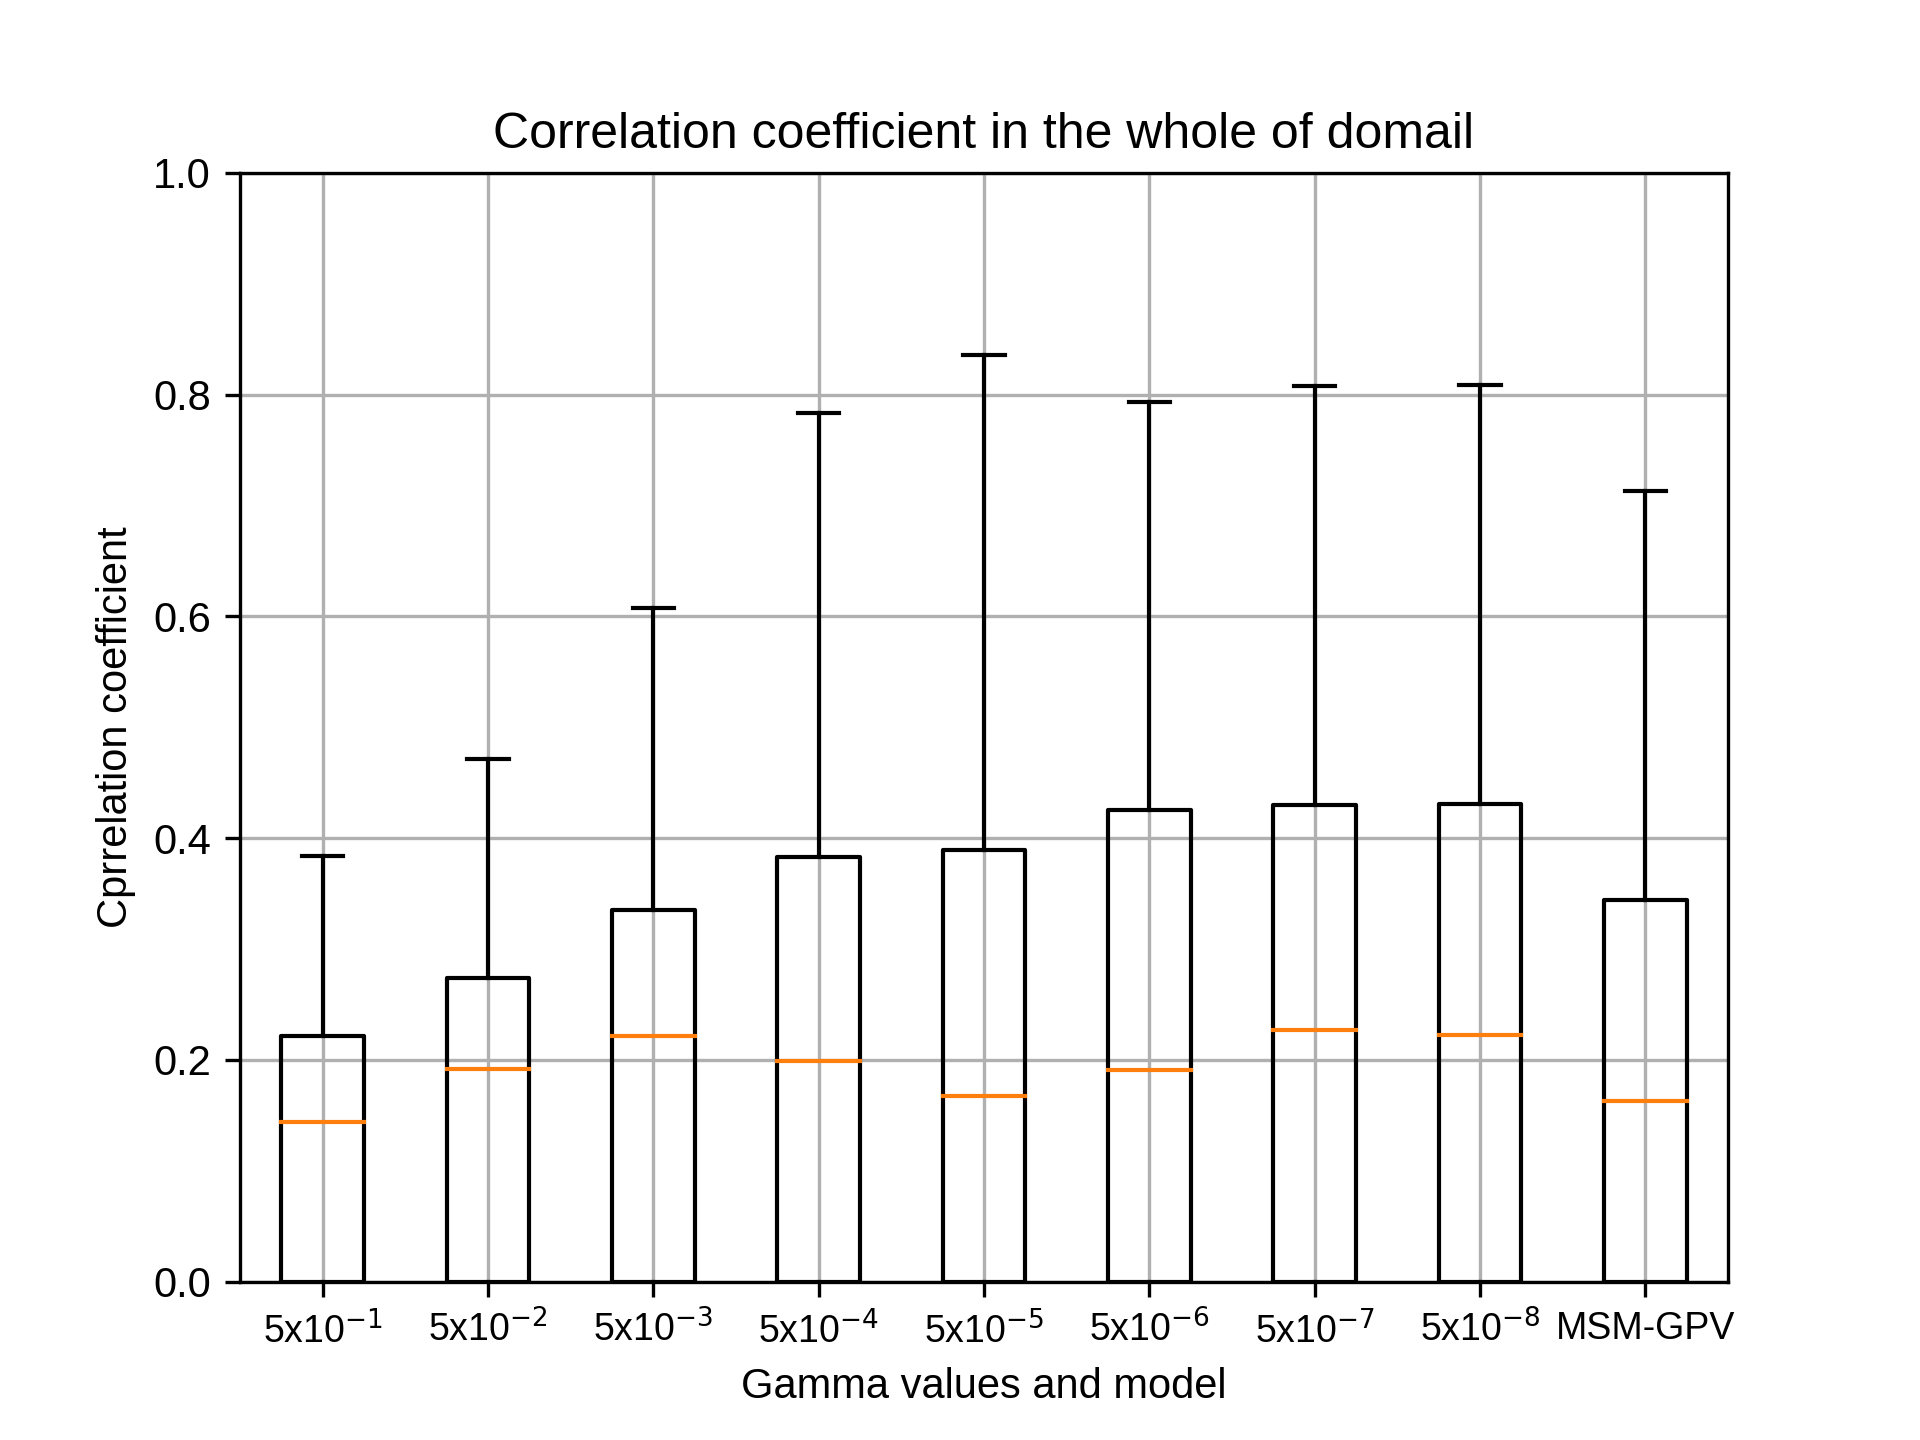
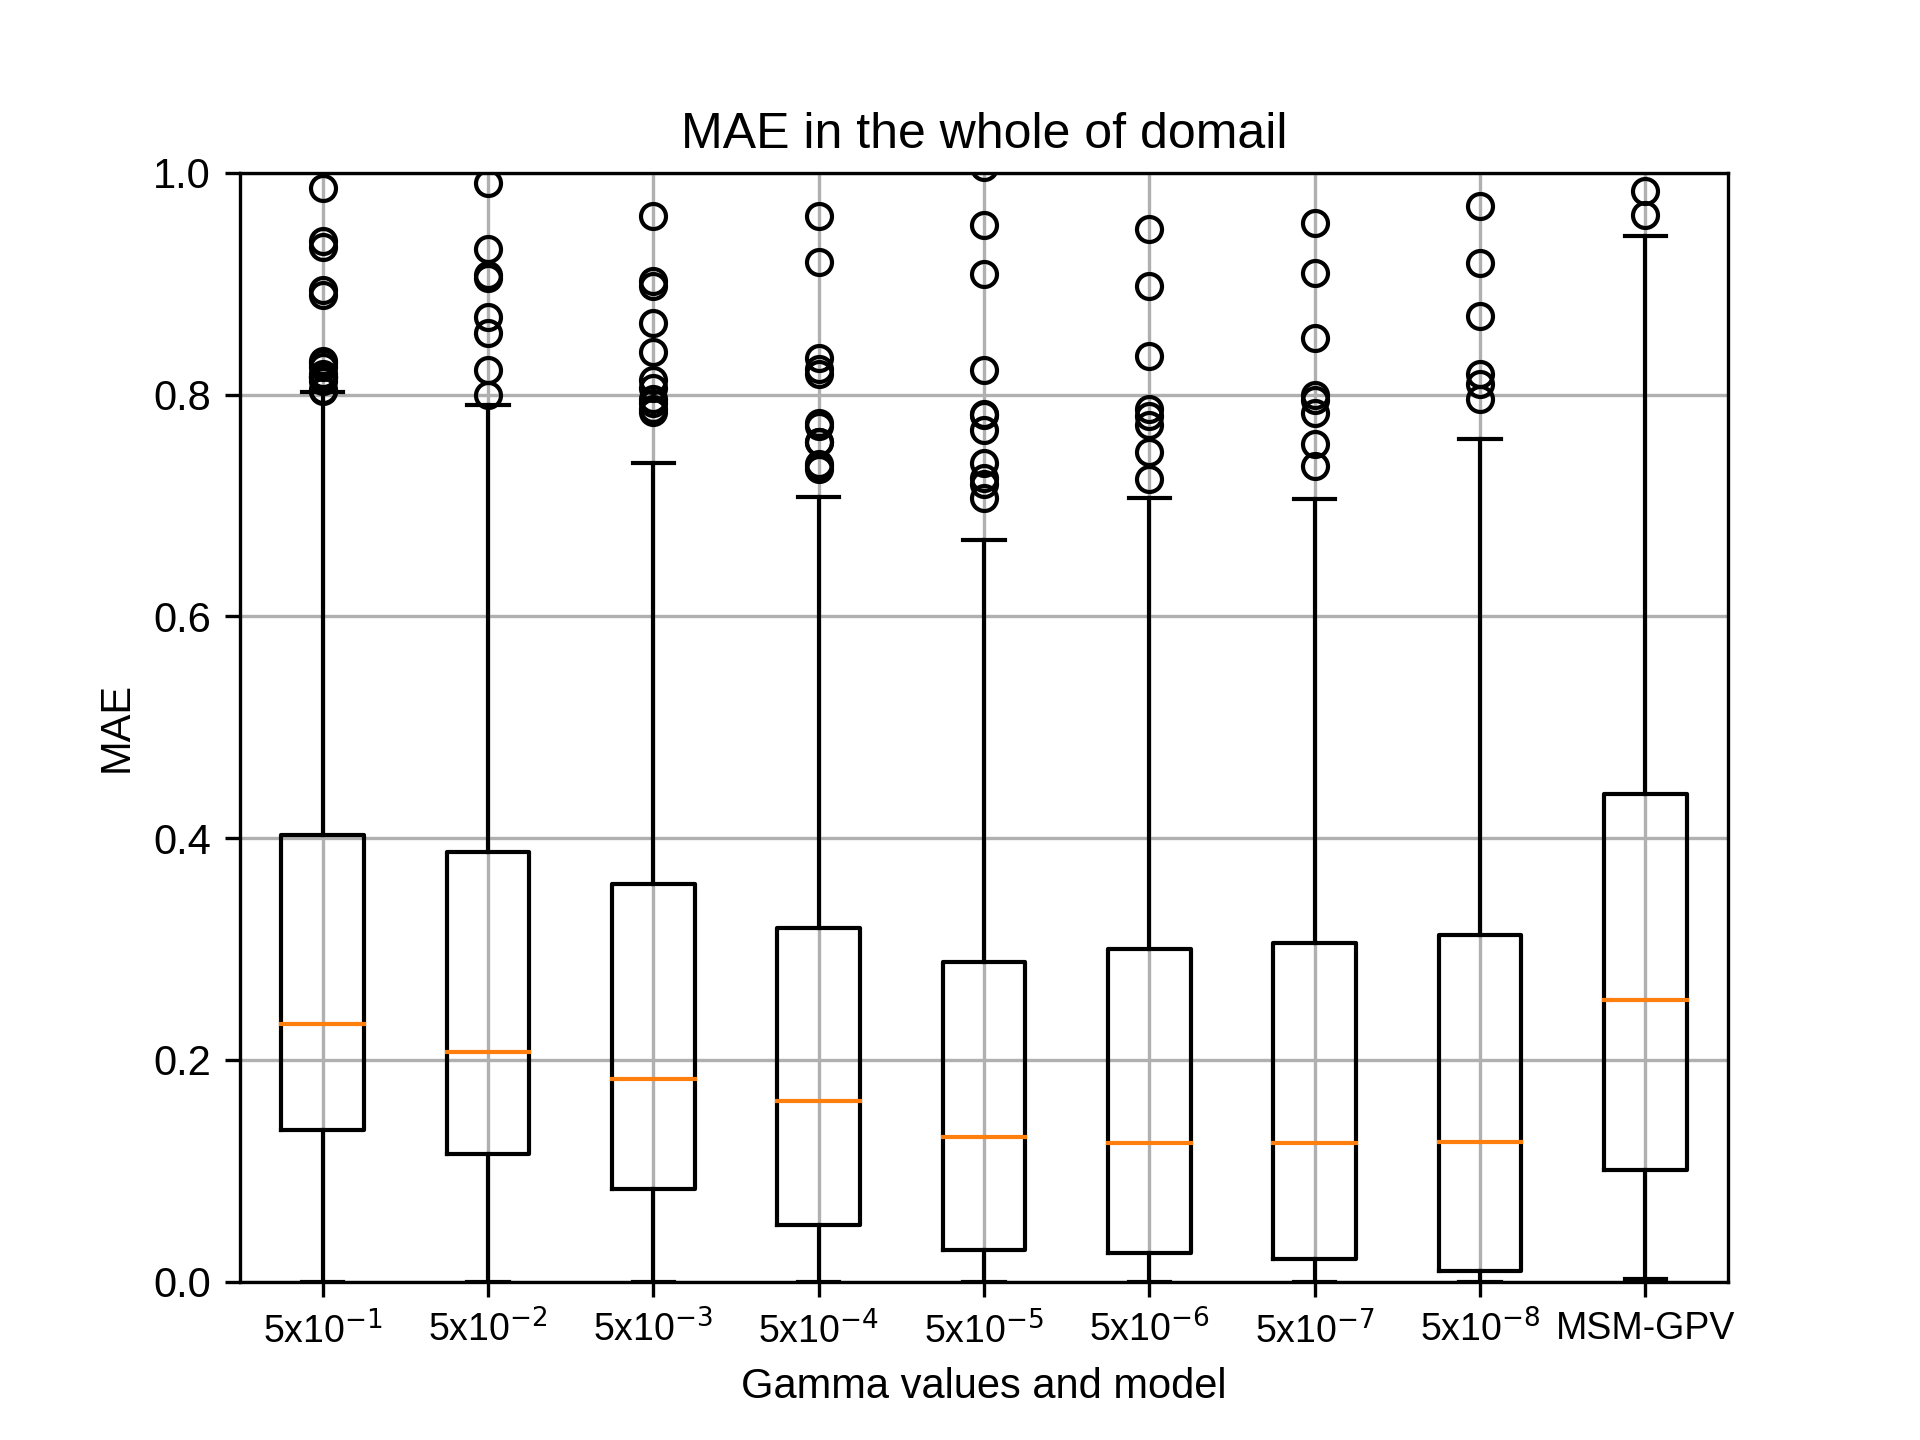
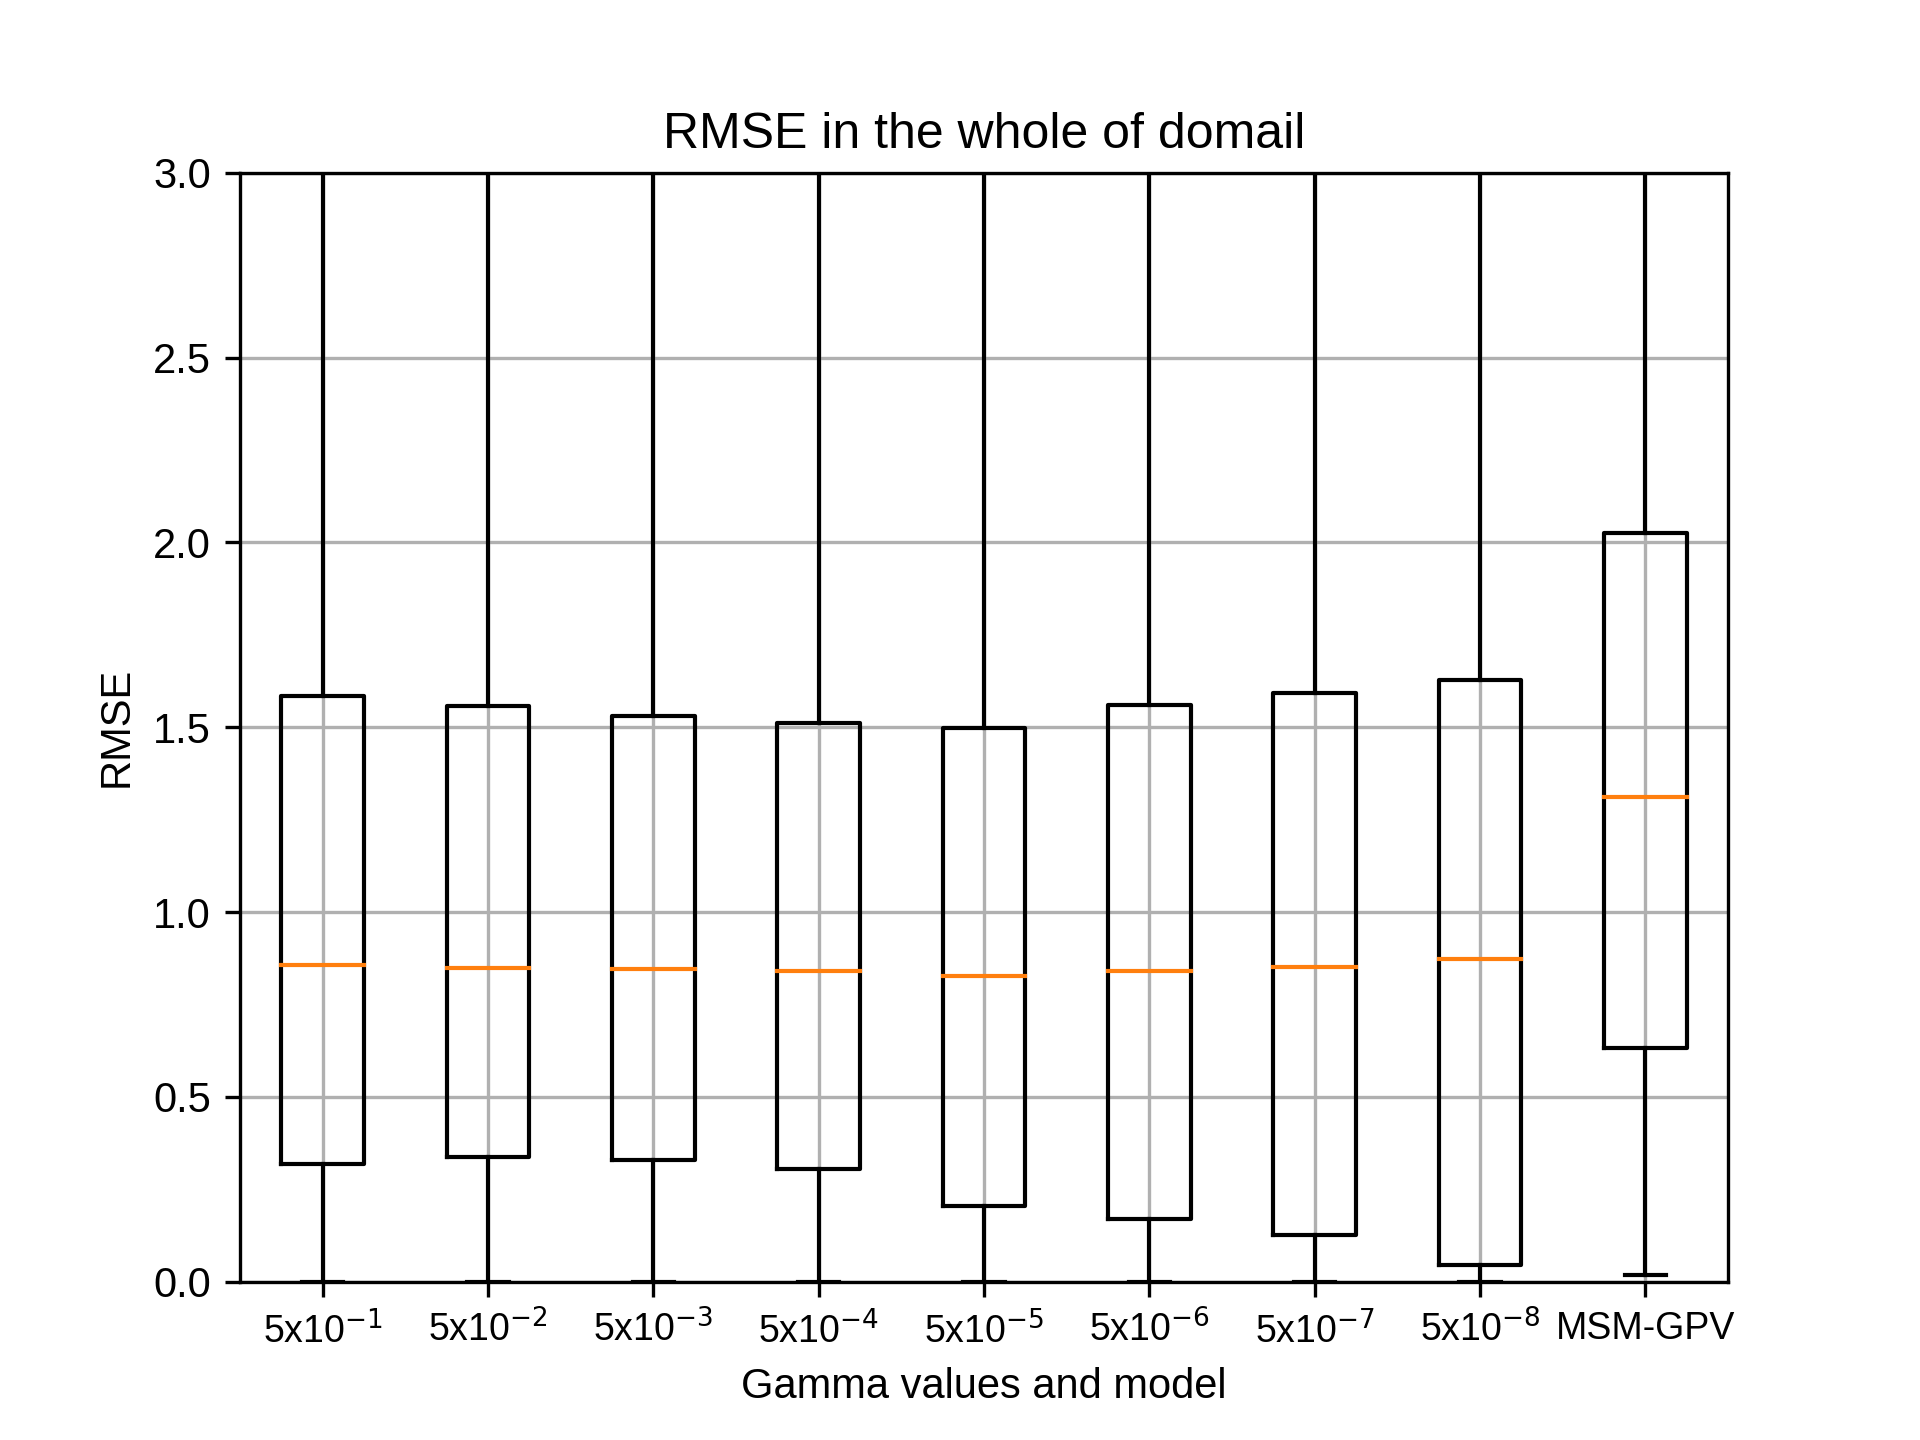
7月のsiteD,rg2=8の結果です。
kobayashi_yusukeThursday, October 22nd, 2020 at 4:35:20 PM GMT+09:00
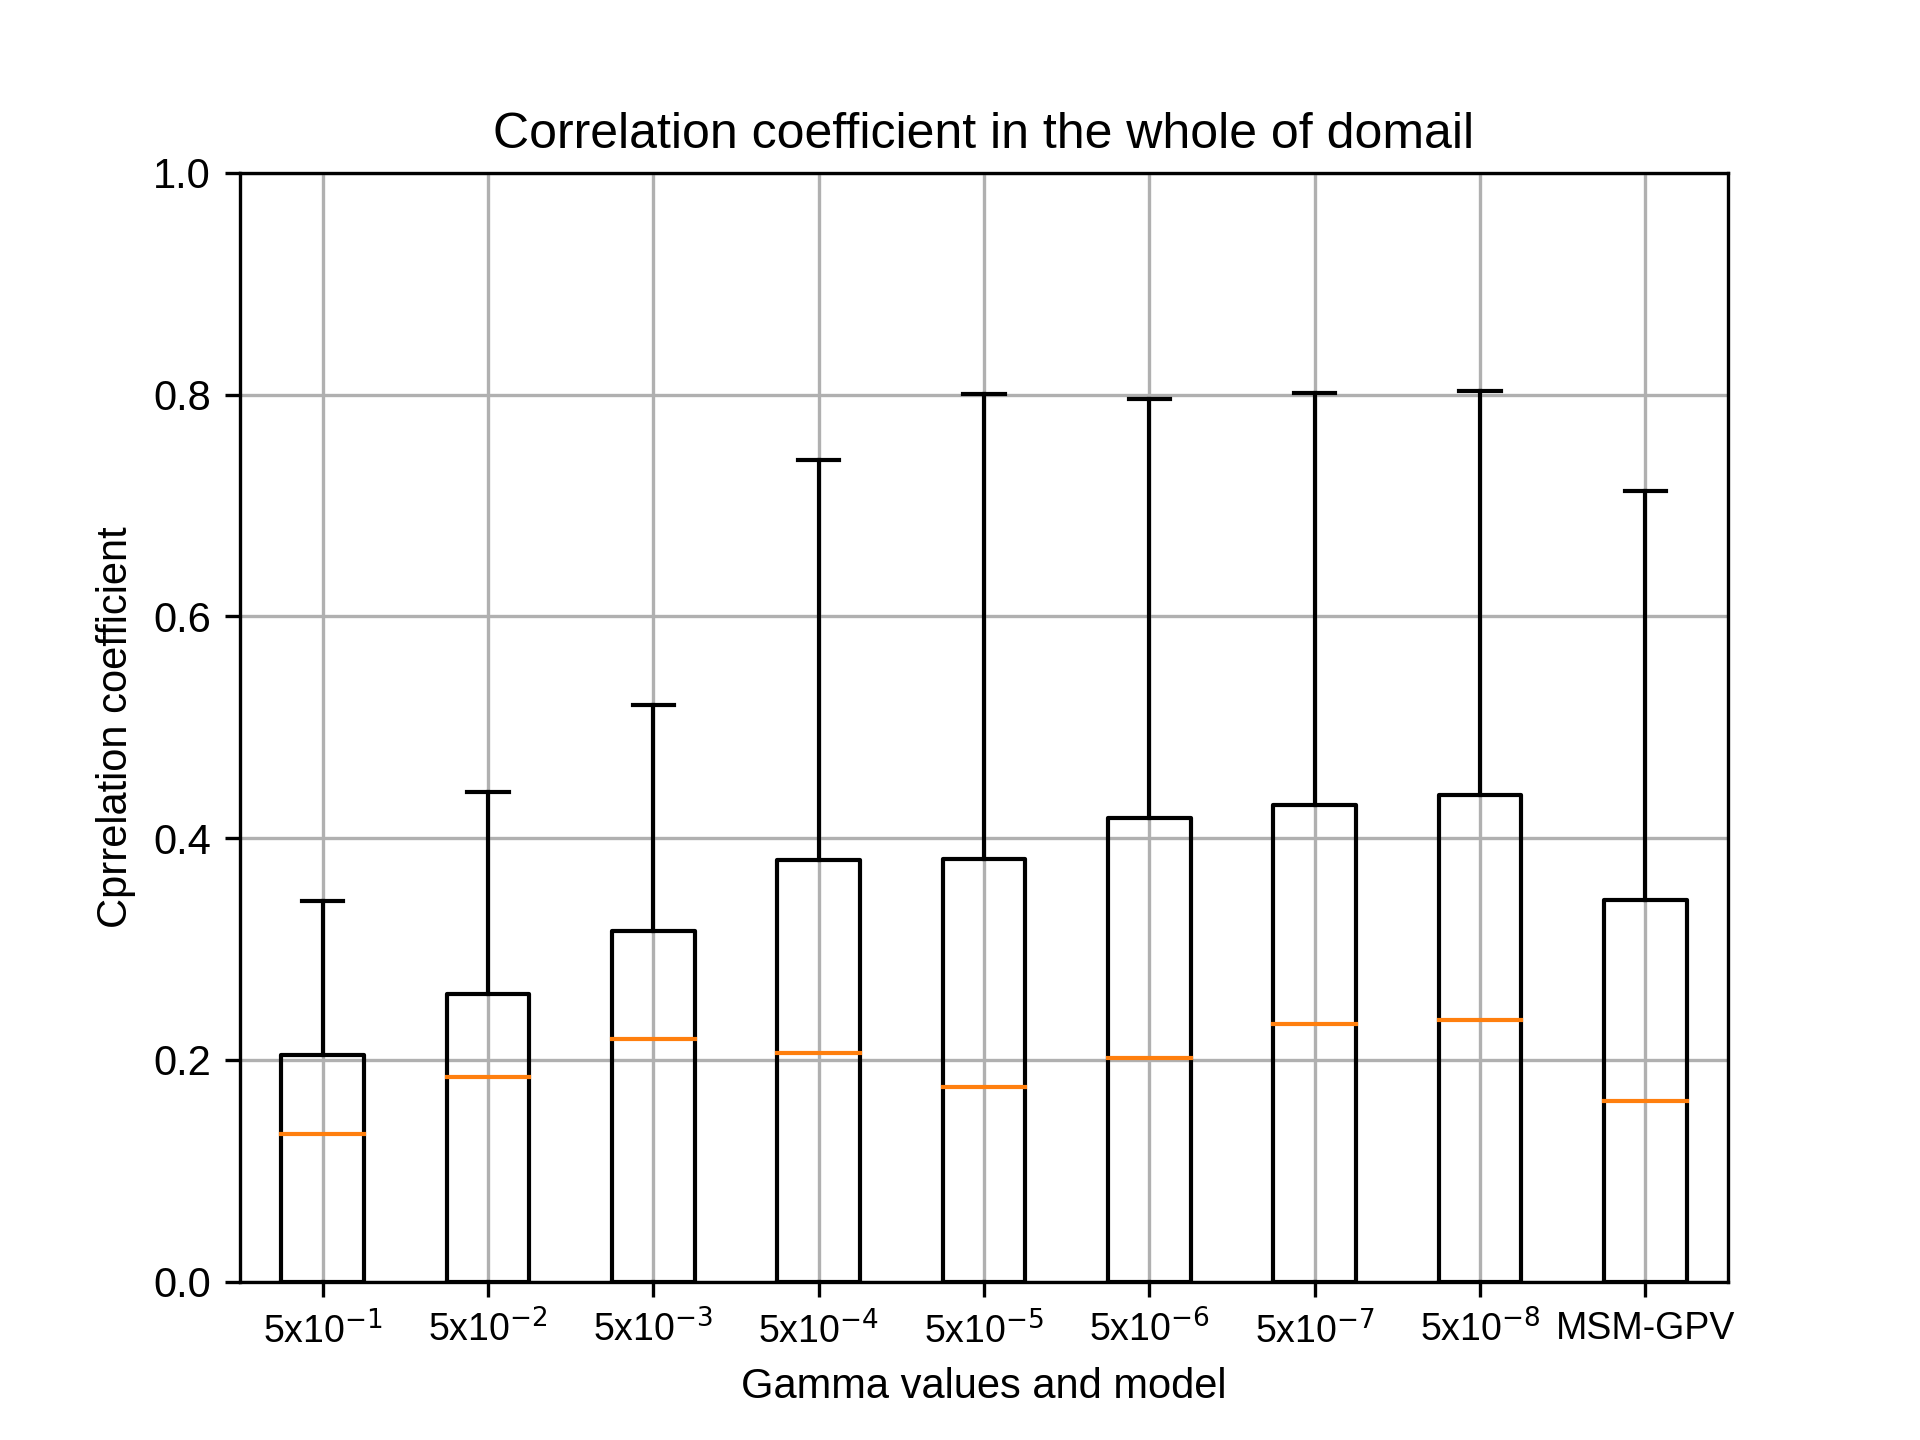


7月のsiteD,rg2=10の結果です。
kobayashi_yusukeThursday, October 22nd, 2020 at 4:35:40 PM GMT+09:00
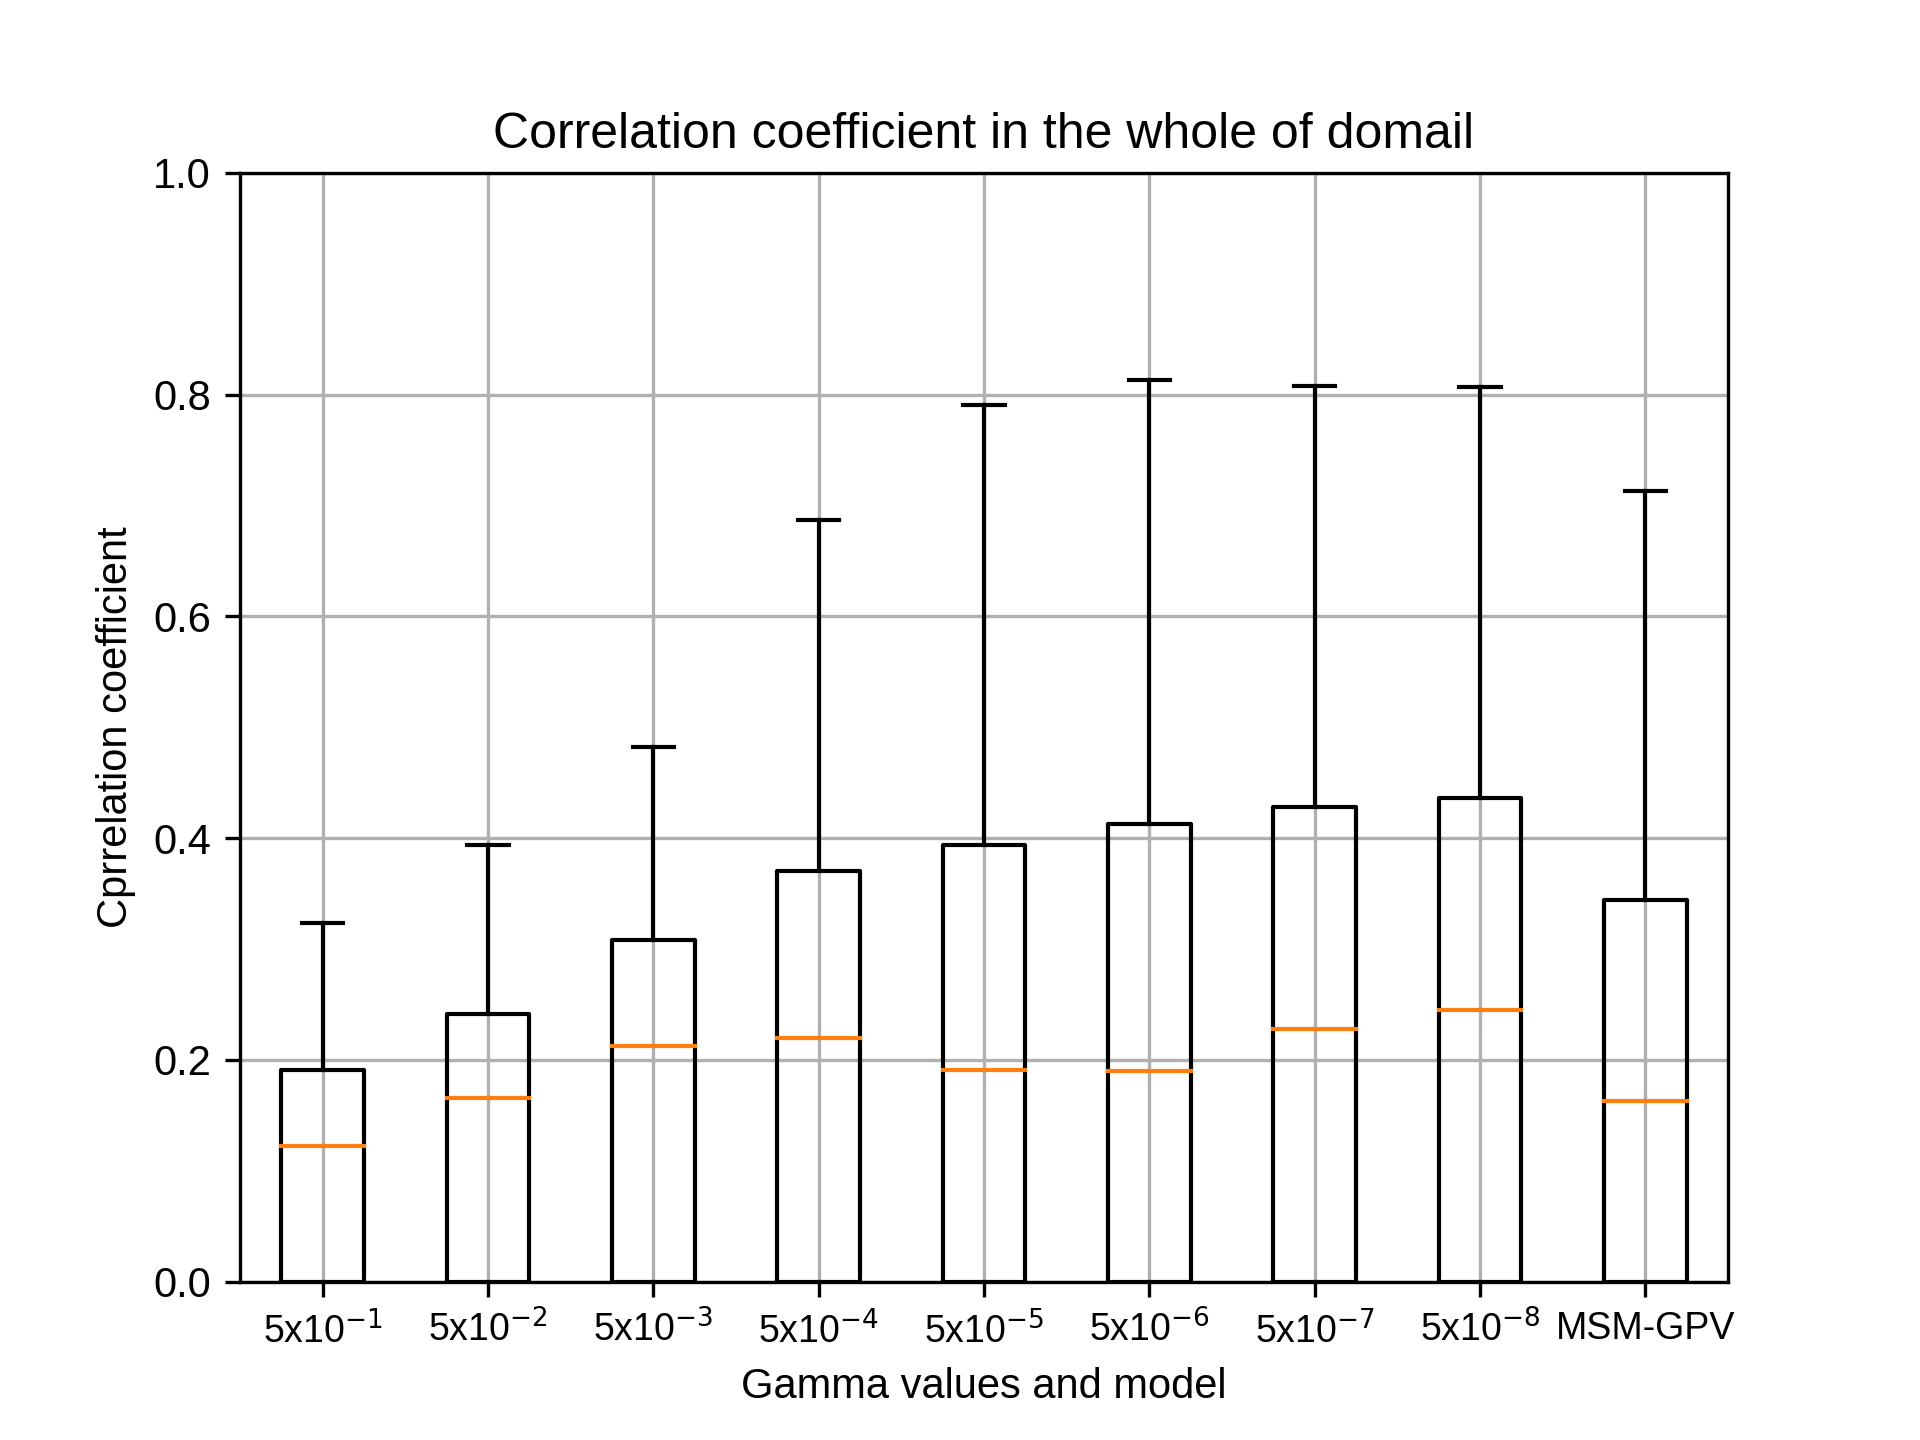
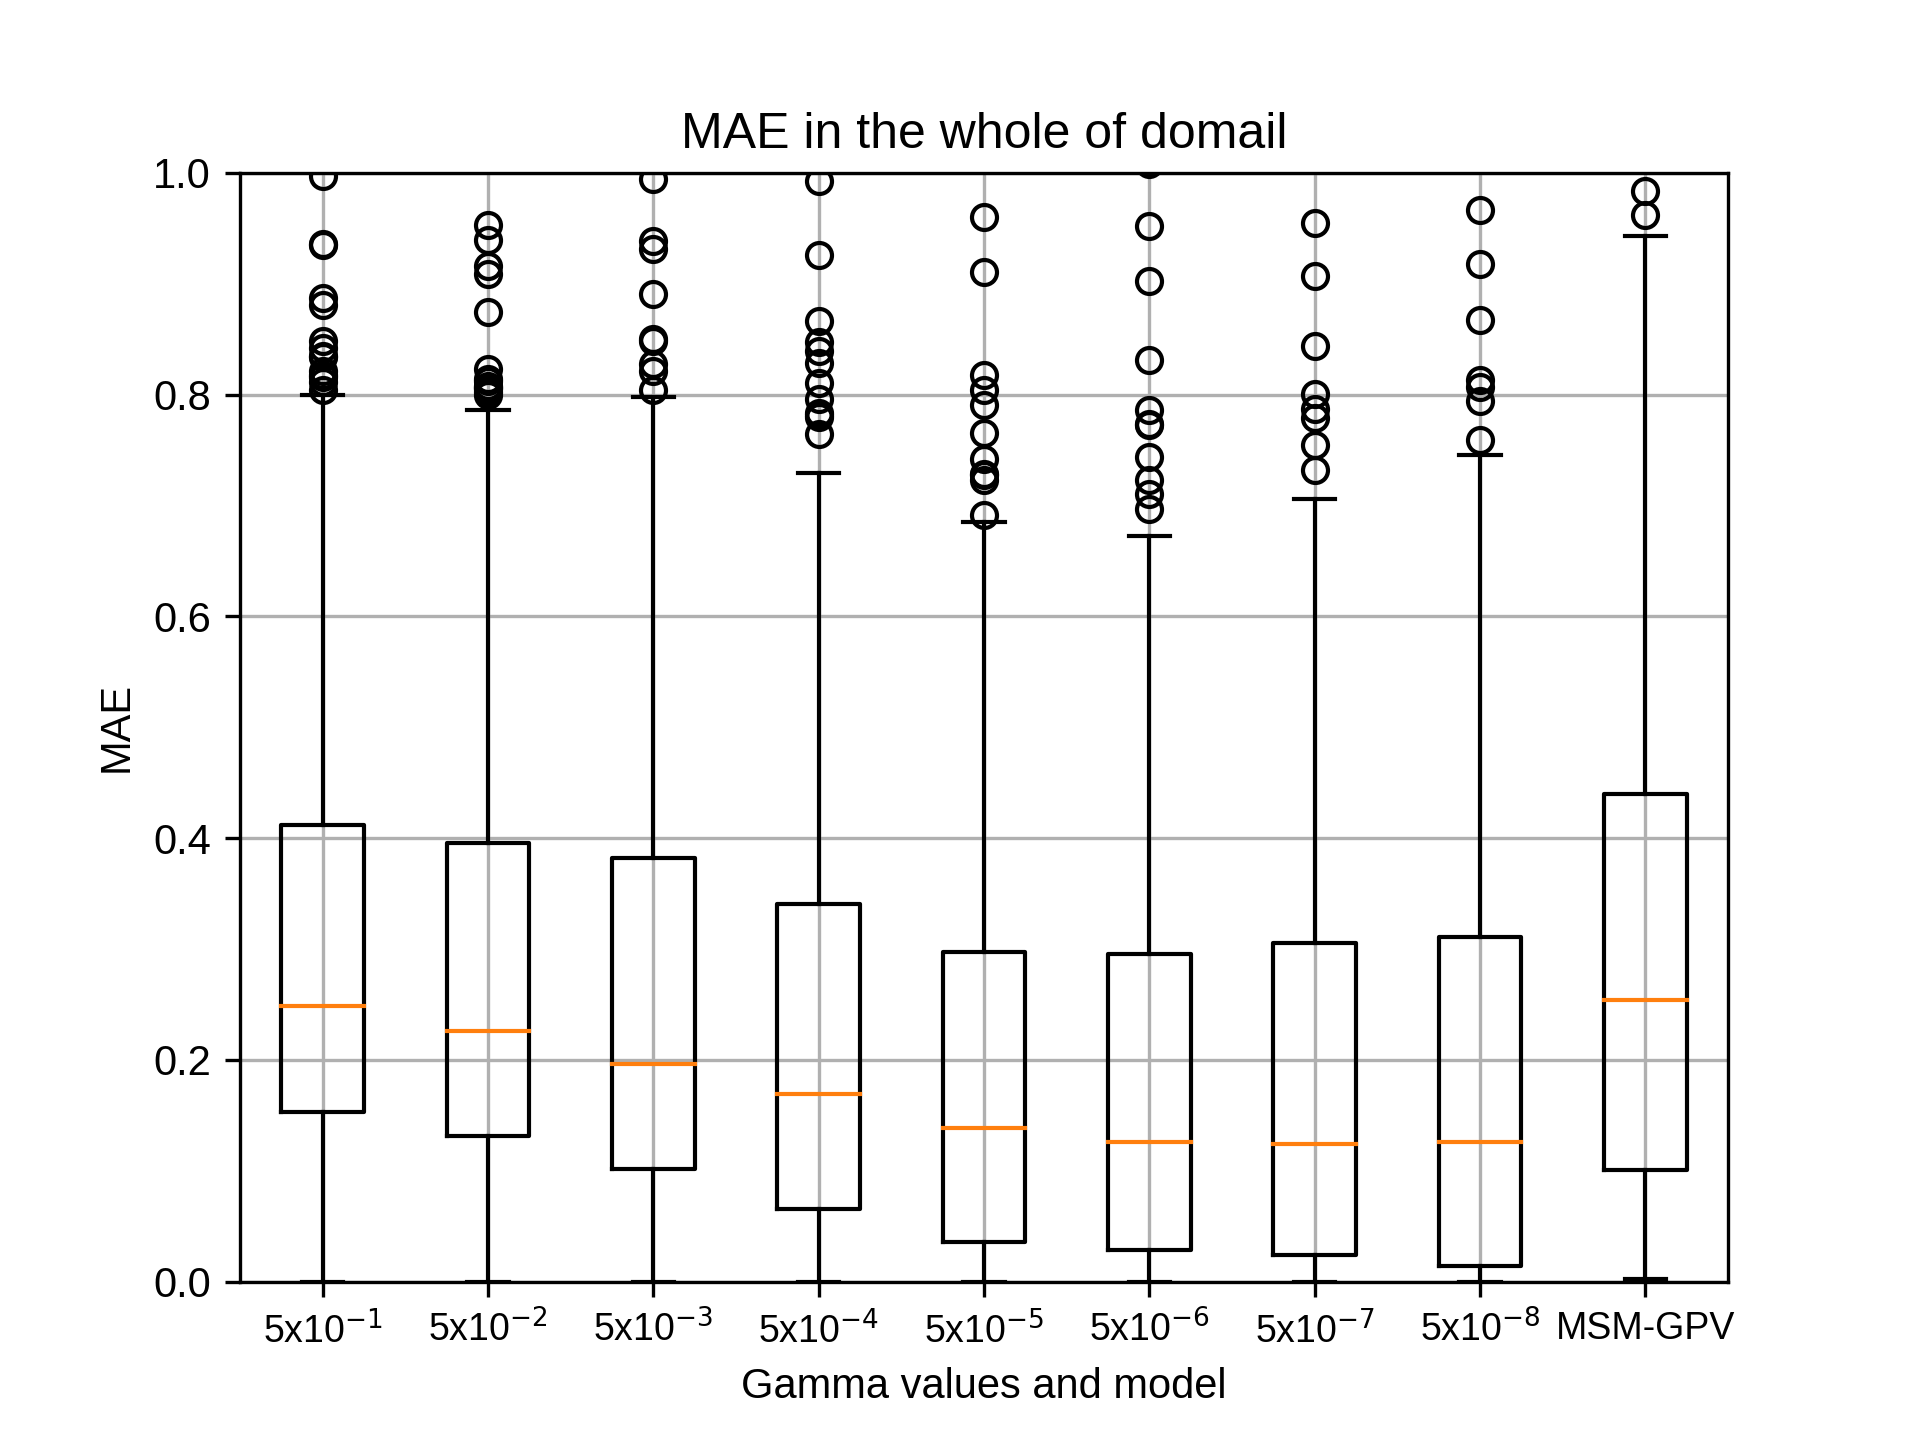

7月のsiteD,rg2=12の結果です。
7月のsiteDではrg2=12でgammaが5x10⁻⁸のとき、相関係数の中央値が最も高くなりました。
7月のsiteDではrg2=12でgammaが5x10⁻⁸のとき、相関係数の中央値が最も高くなりました。
kobayashi_yusukeThursday, October 22nd, 2020 at 4:36:24 PM GMT+09:00
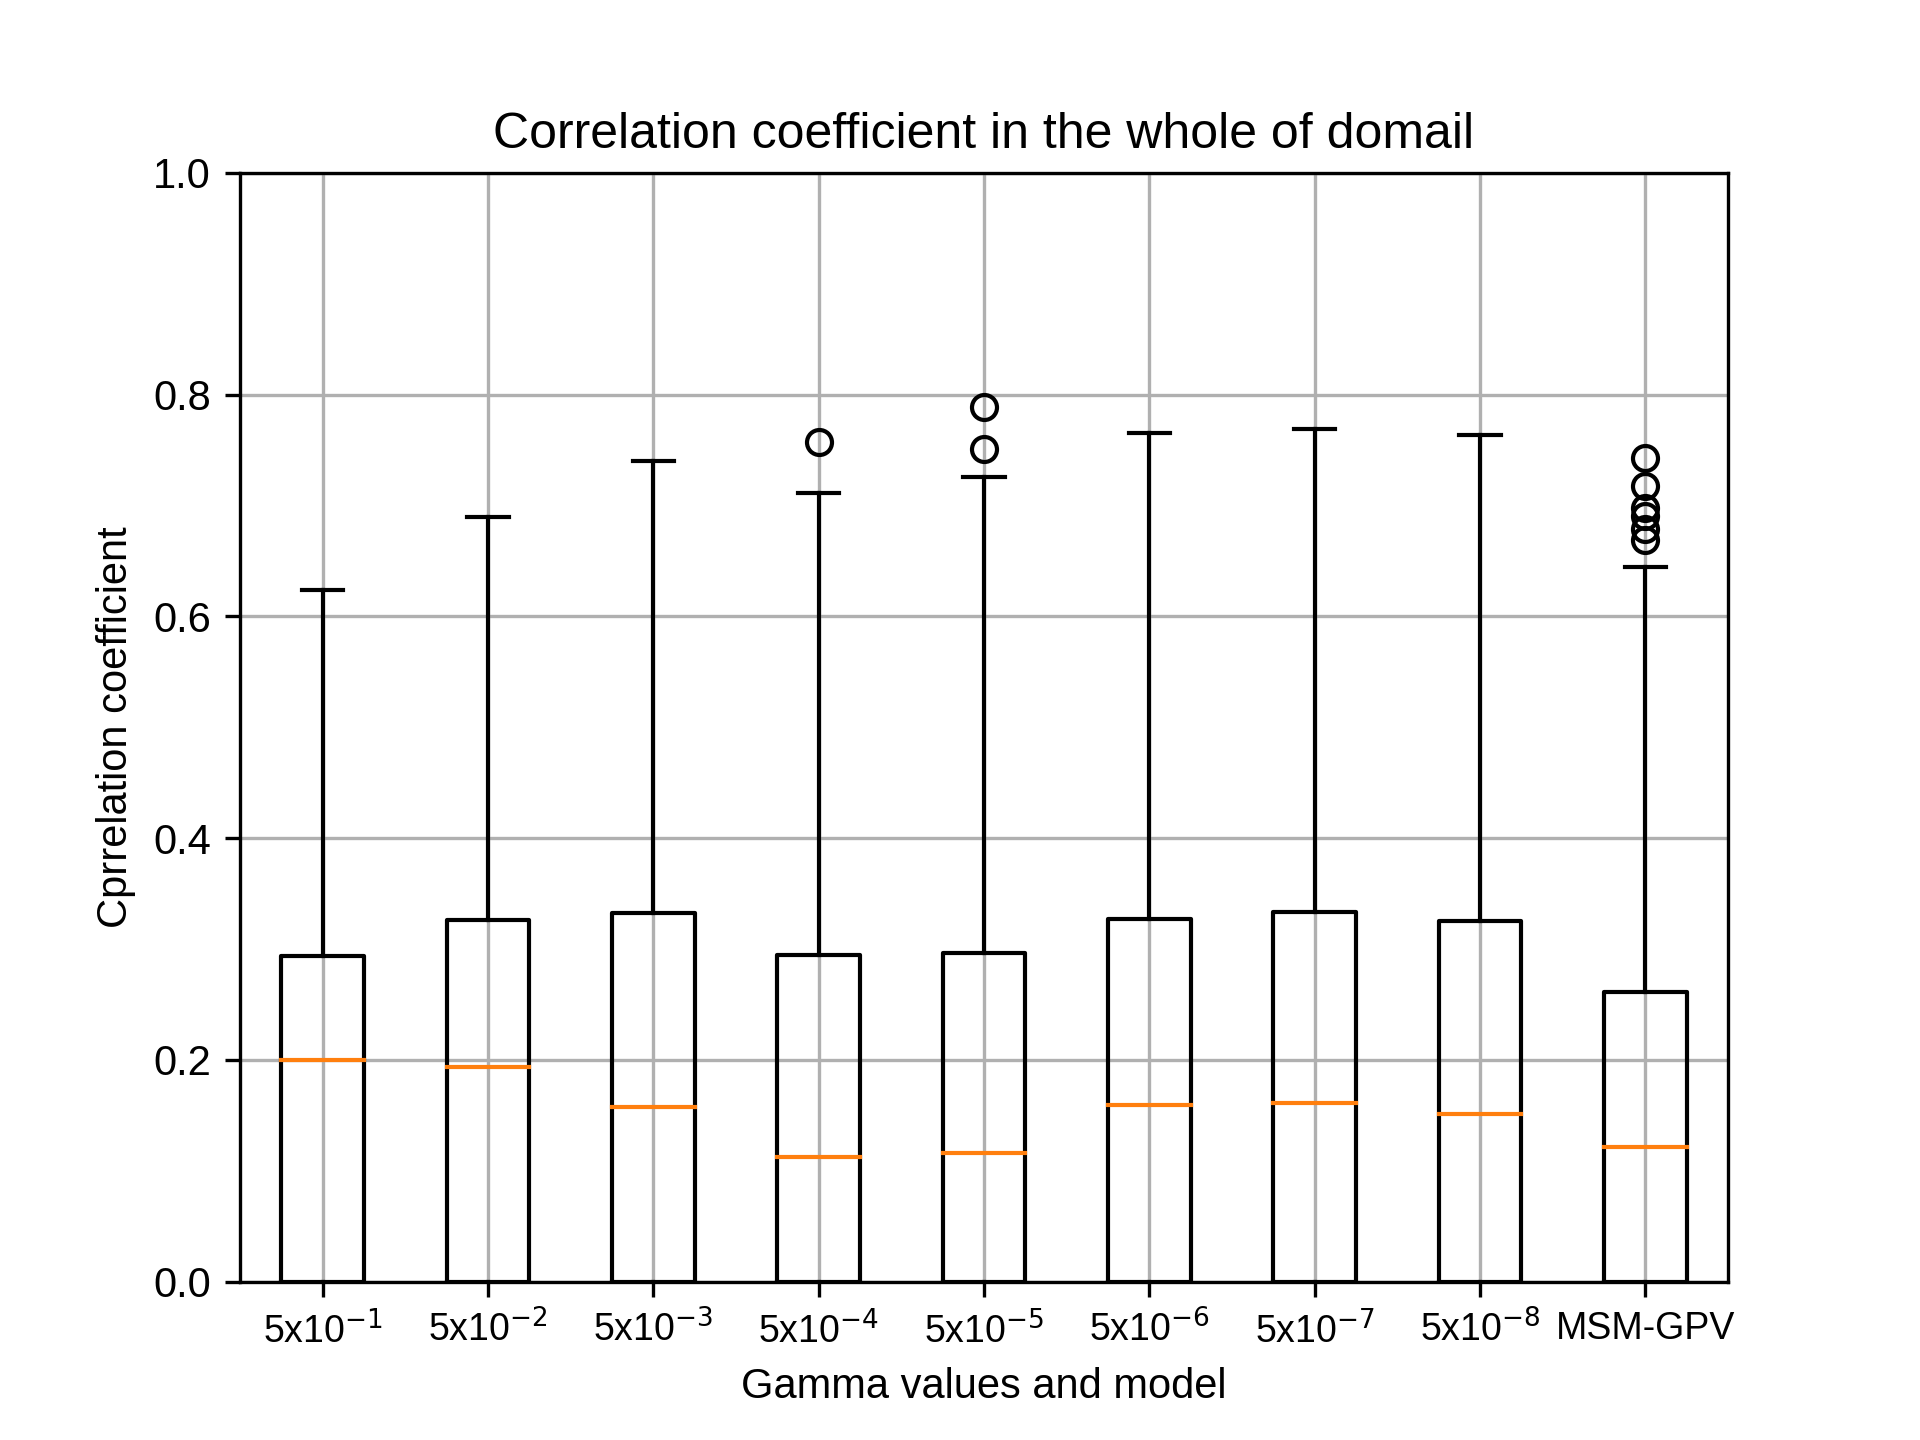
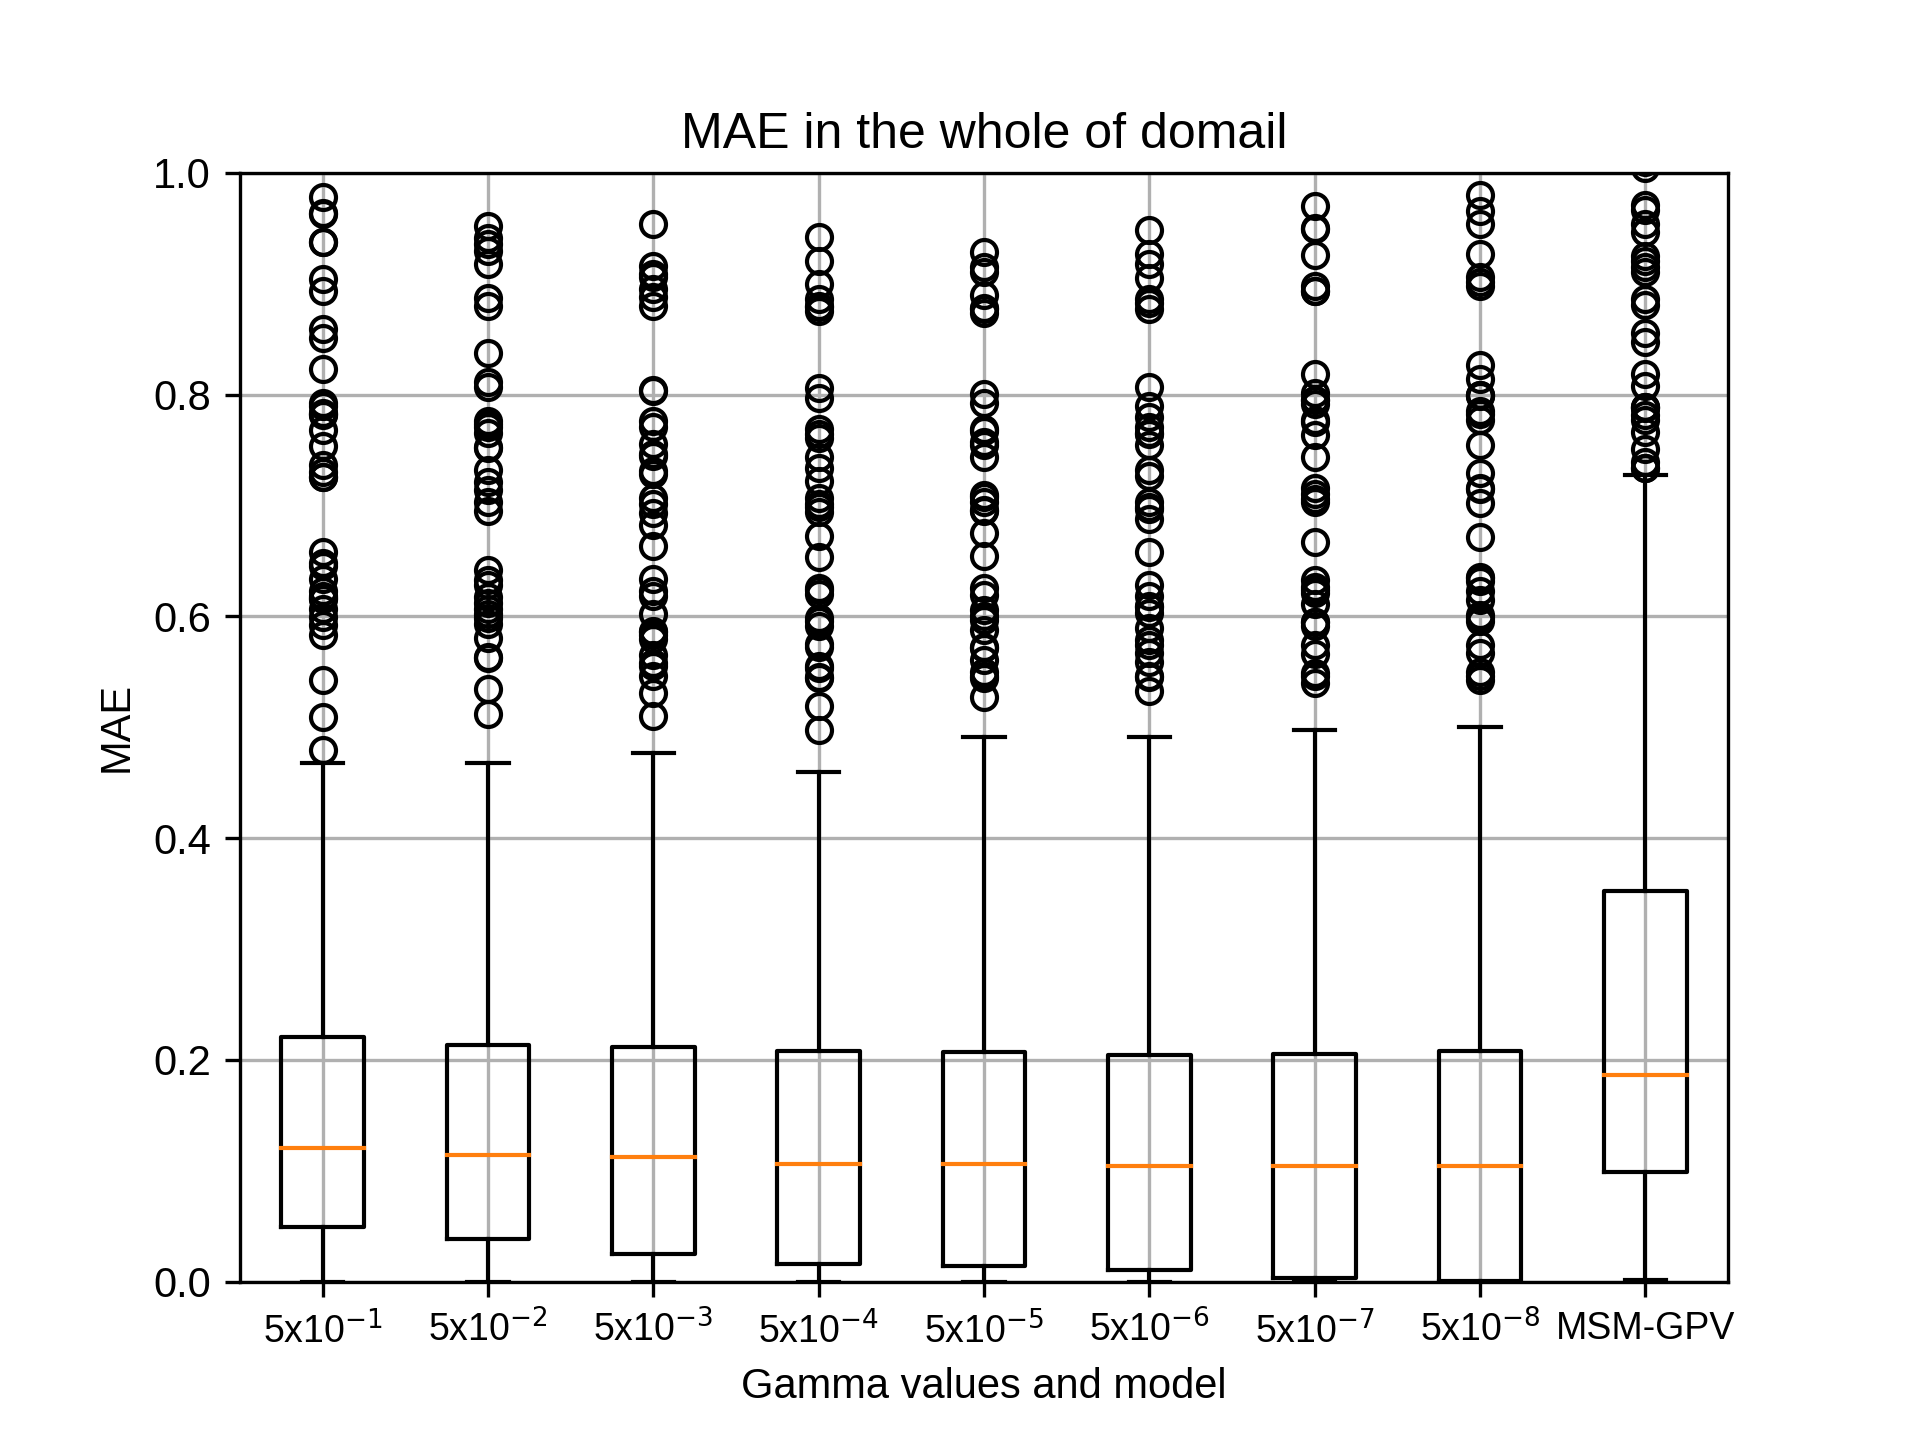

7月のsiteE,rg2=4の結果です。
kobayashi_yusukeThursday, October 22nd, 2020 at 4:36:38 PM GMT+09:00
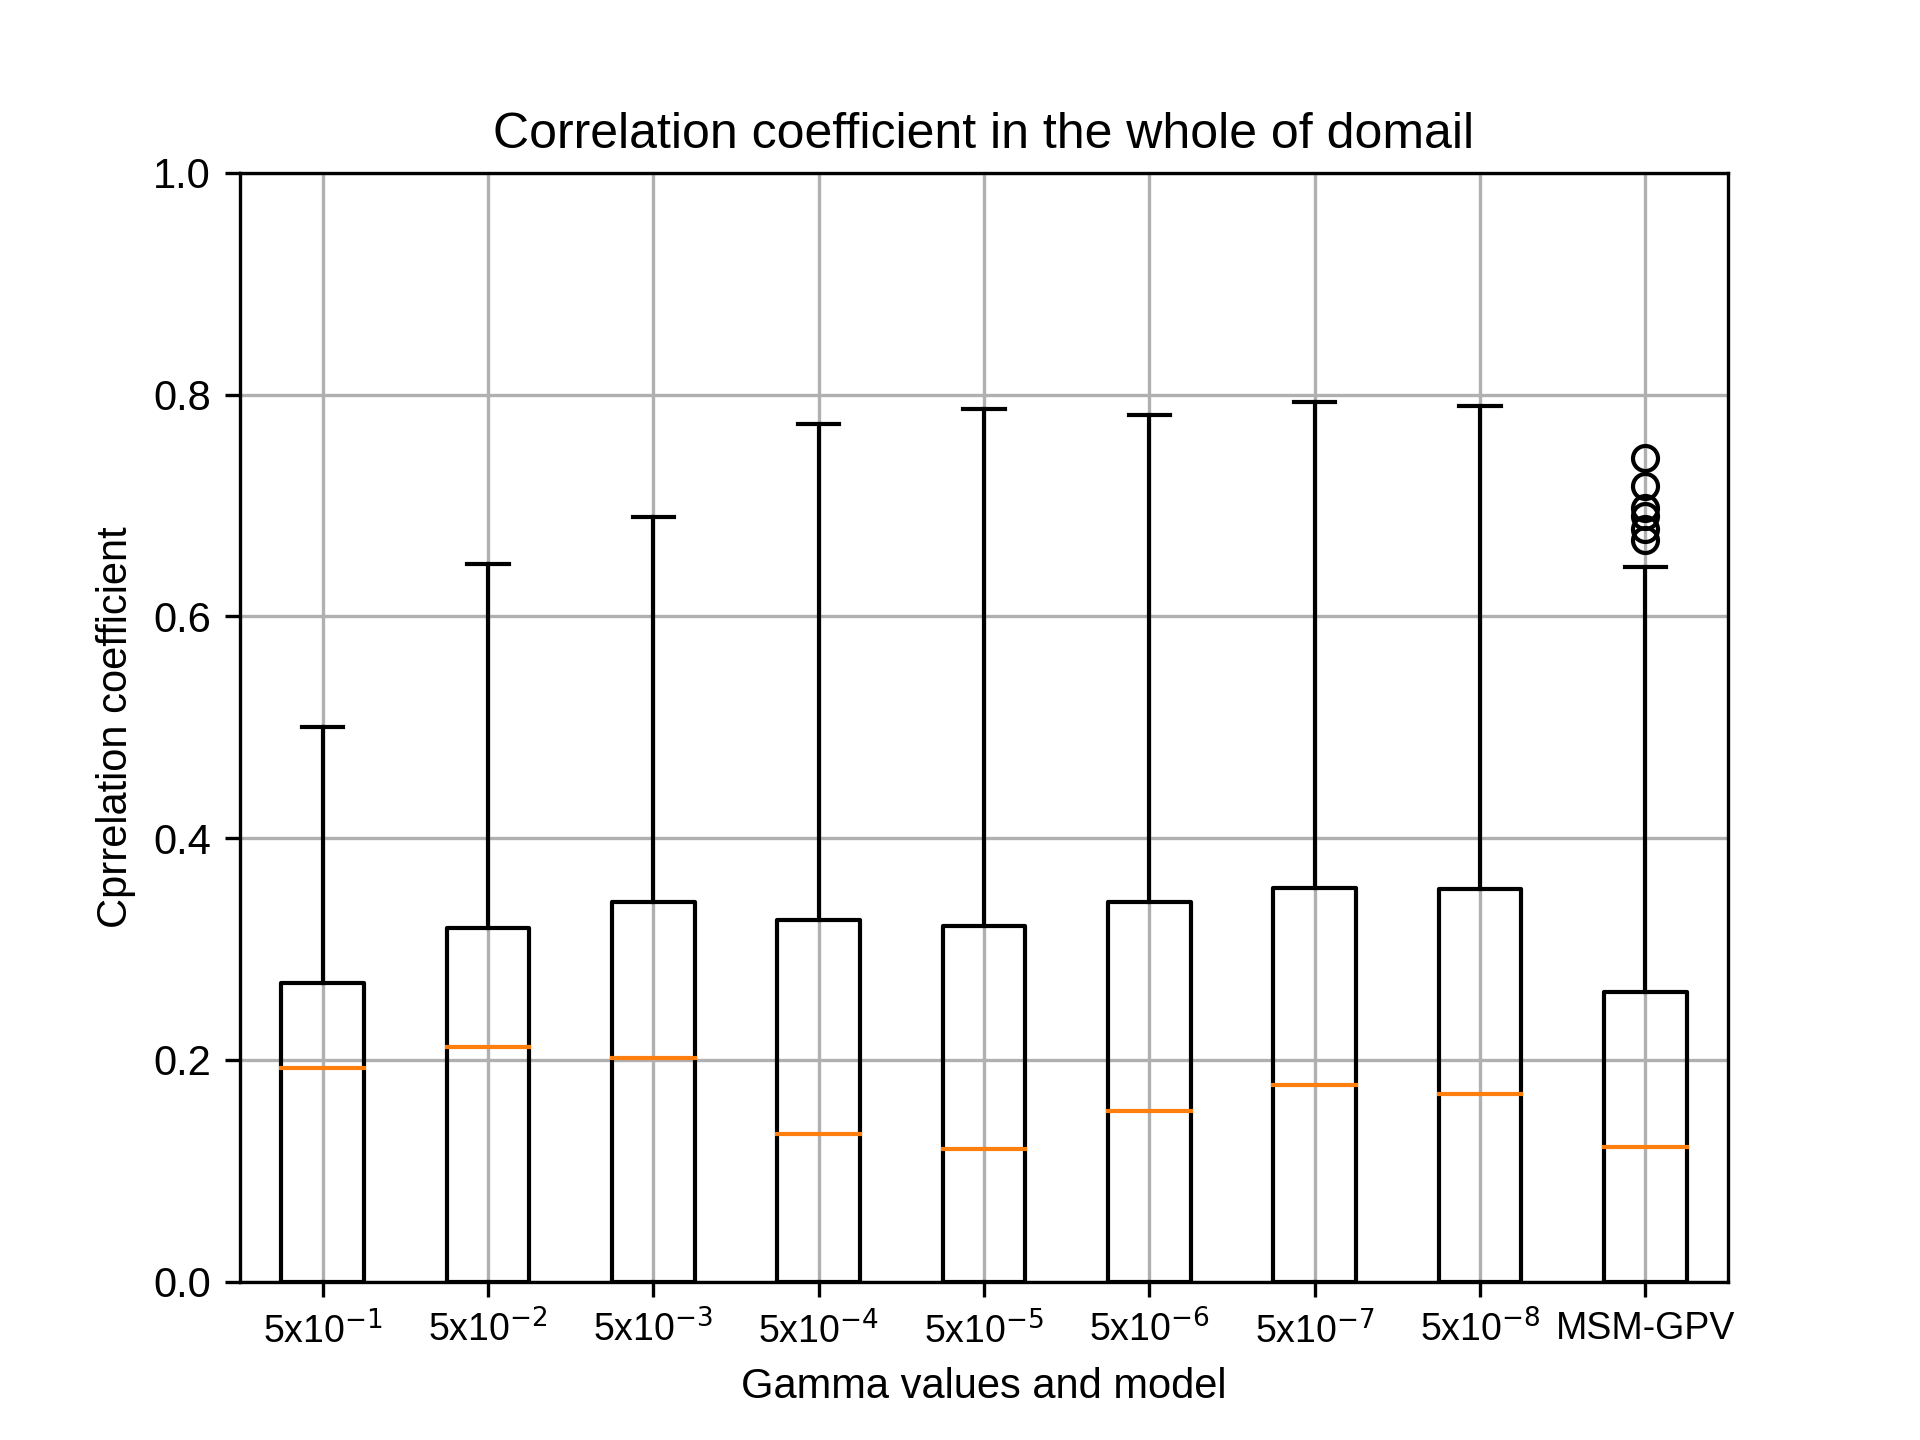
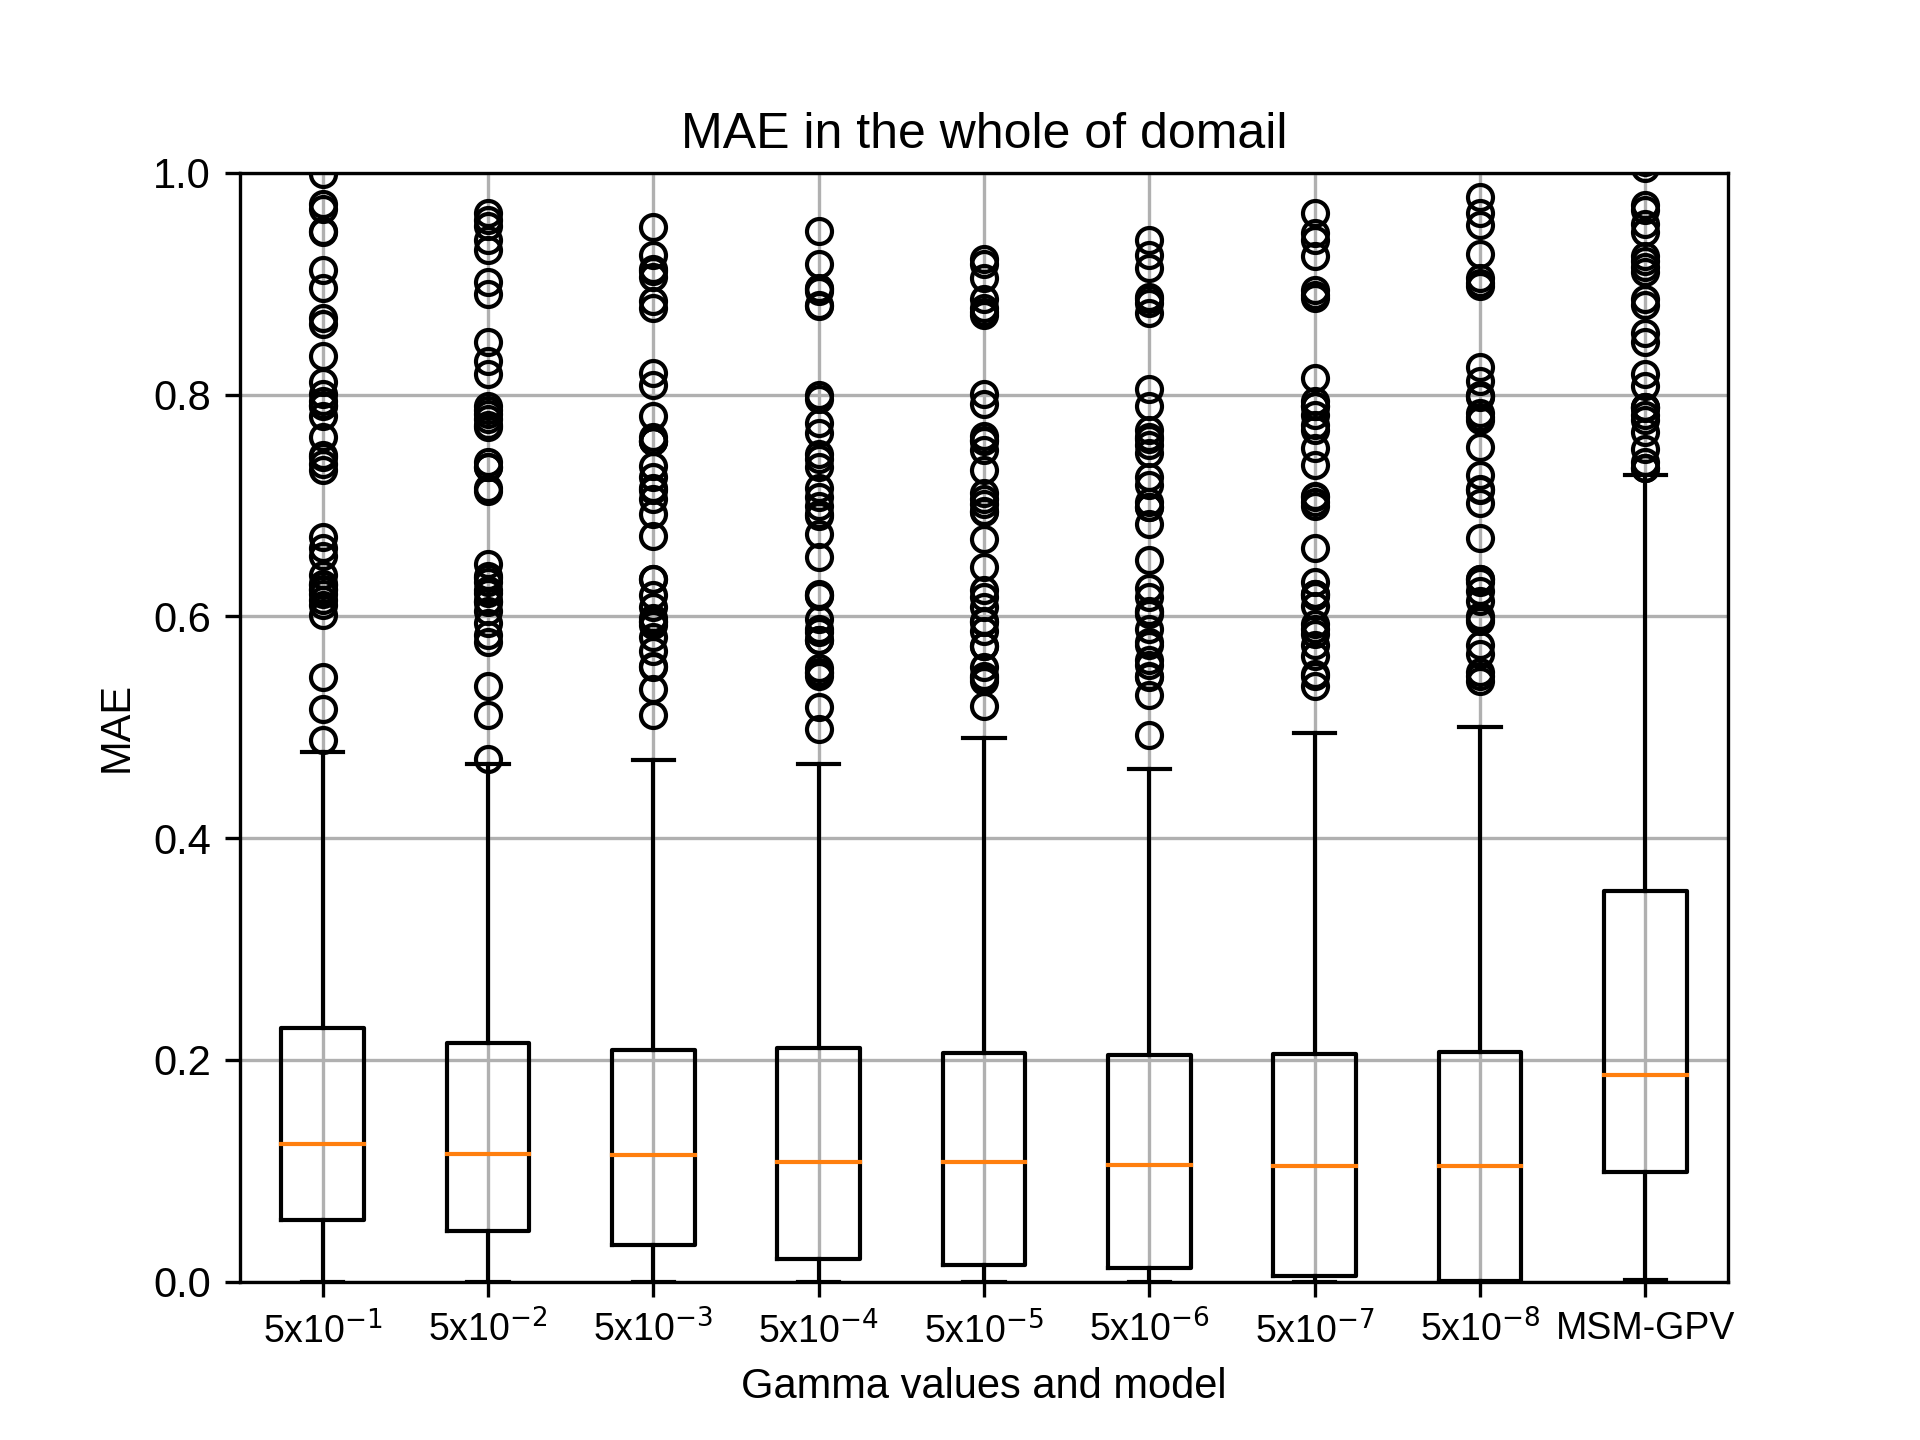
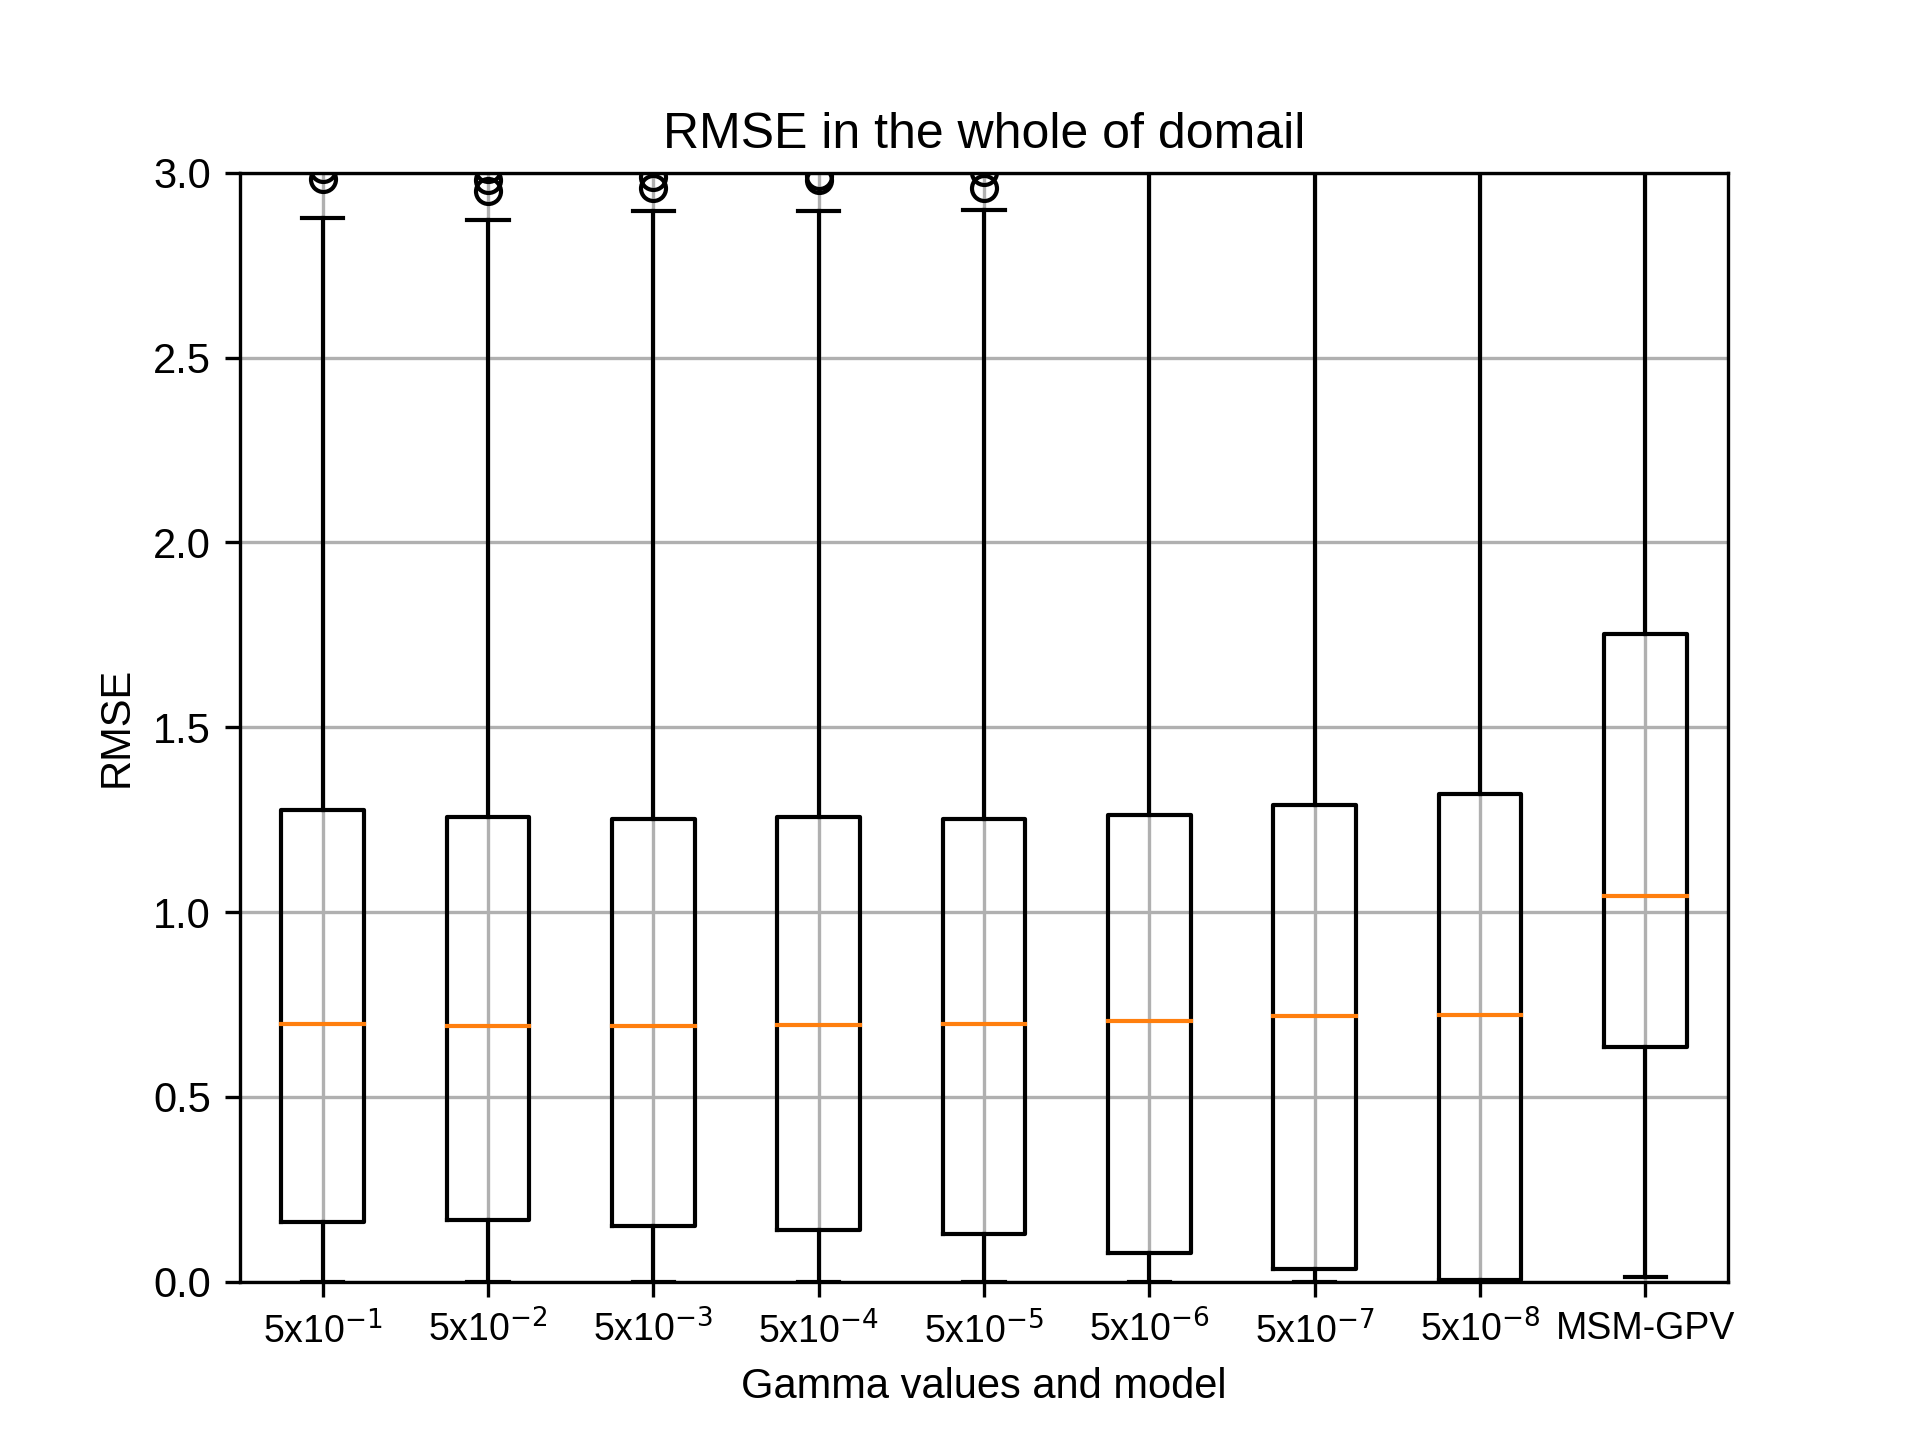
7月のsiteE,rg2=6の結果です。
kobayashi_yusukeThursday, October 22nd, 2020 at 4:37:02 PM GMT+09:00
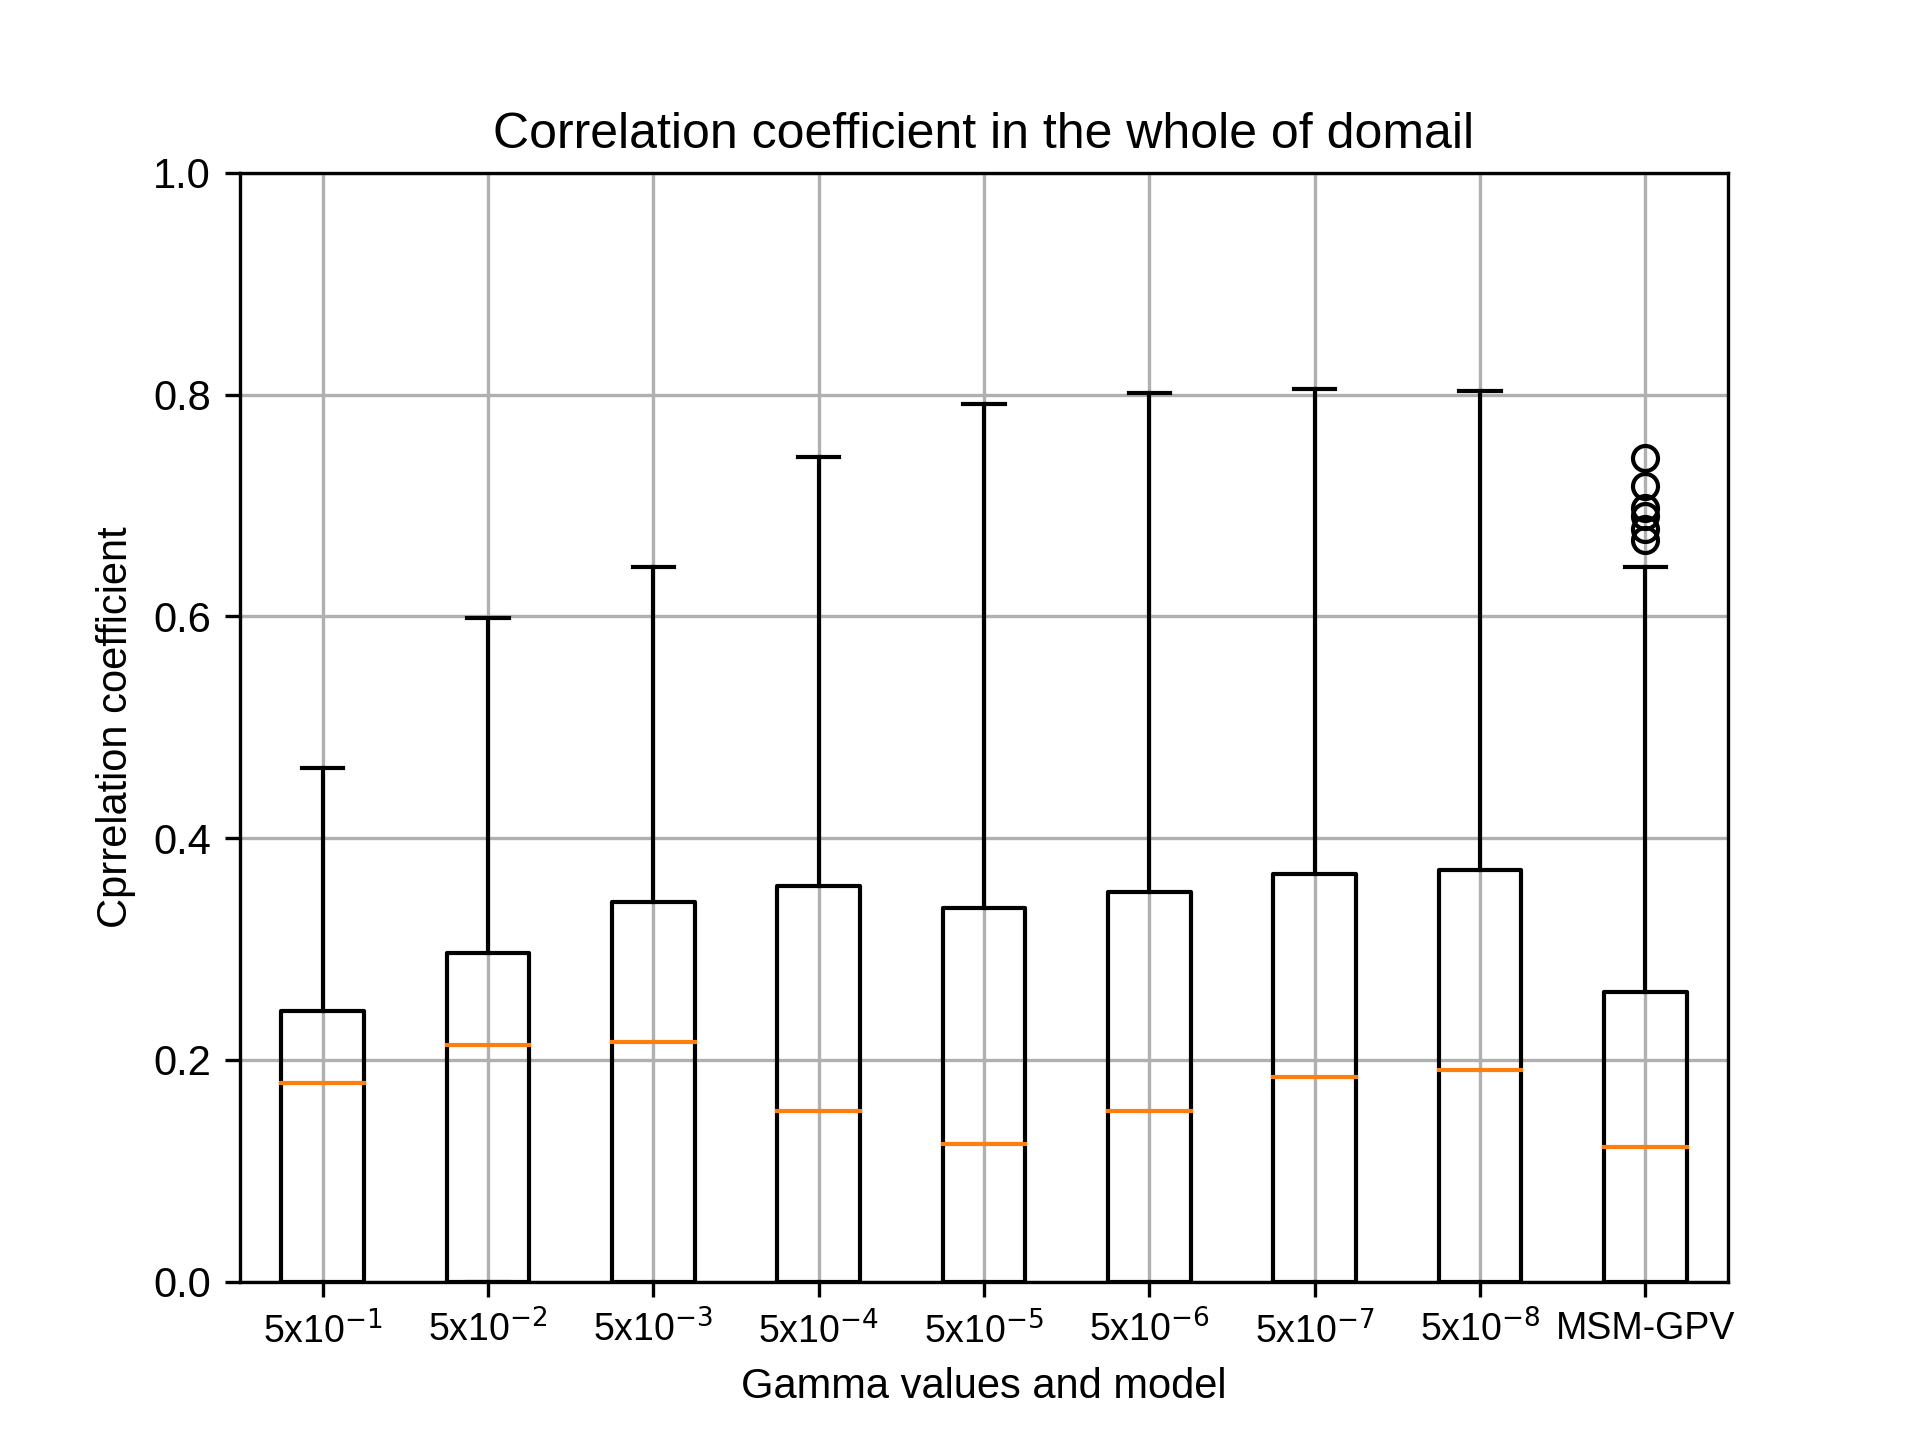
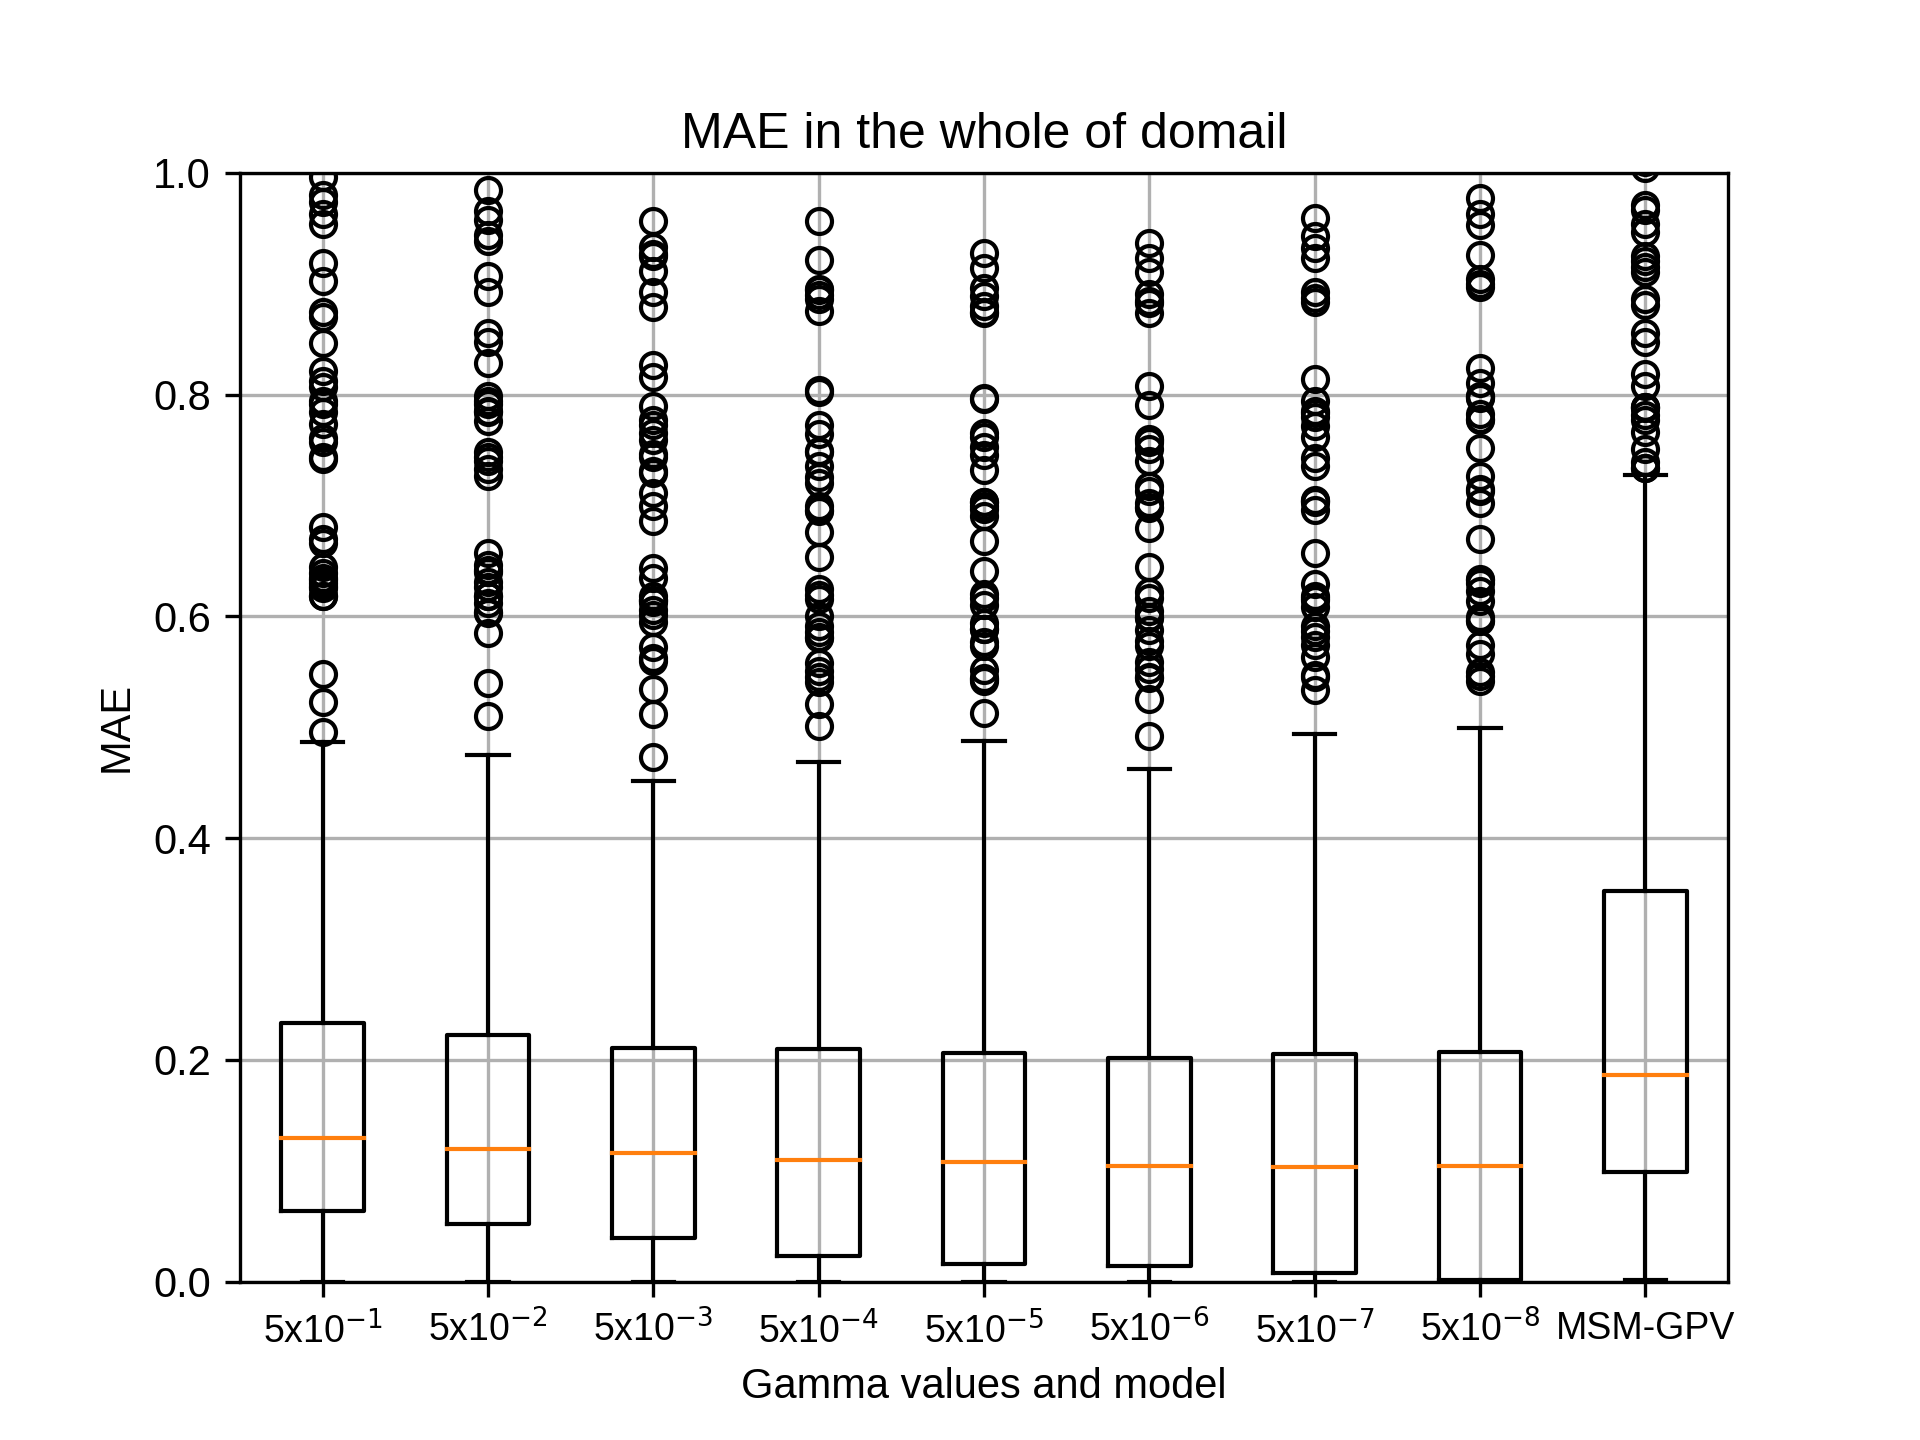
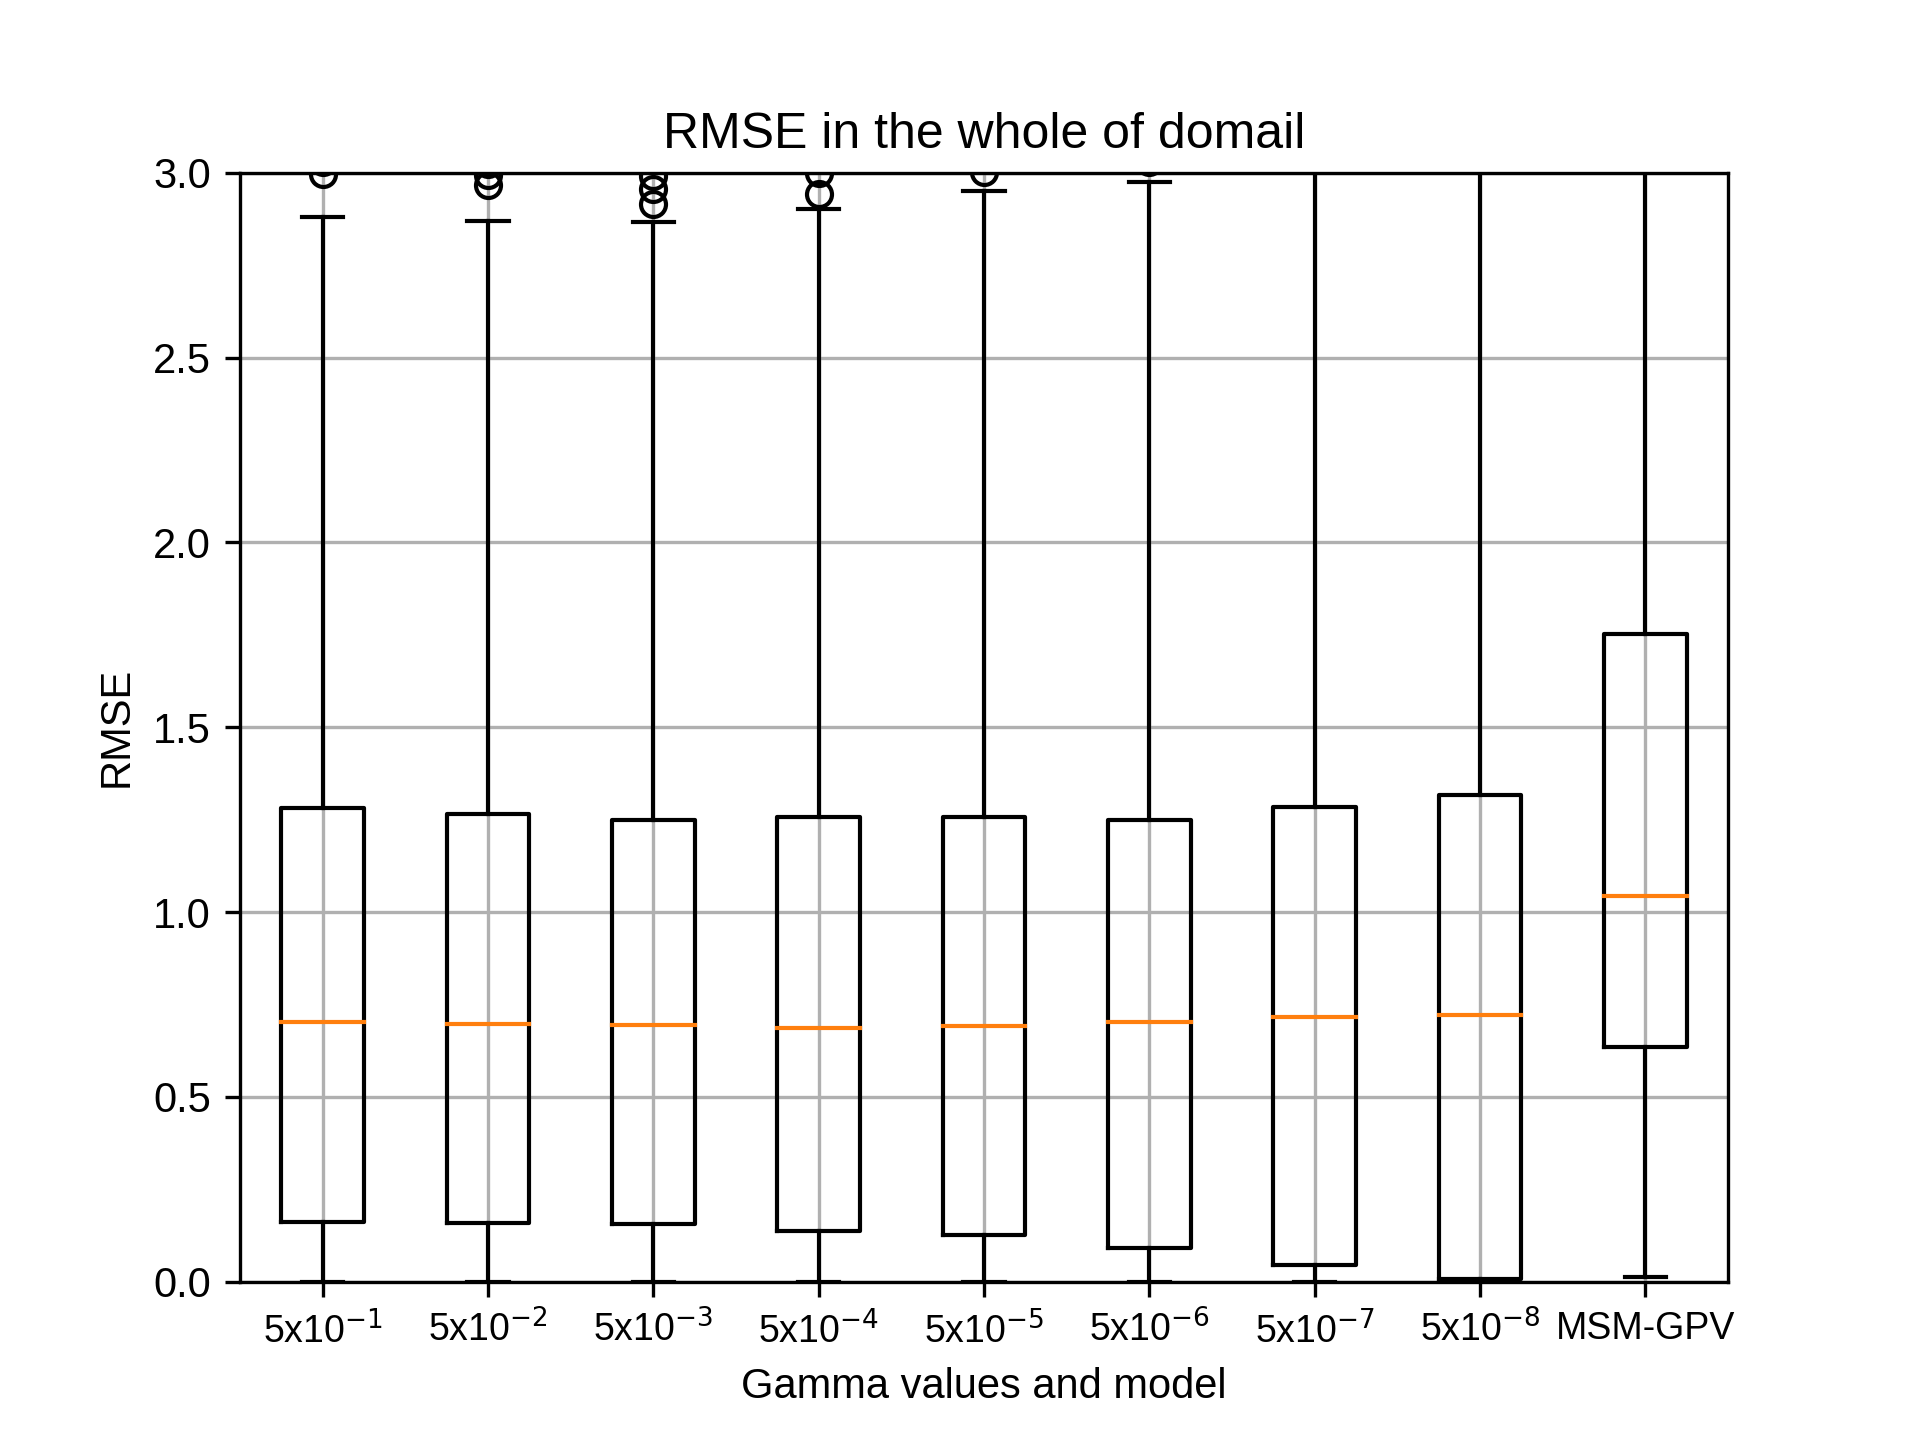
7月のsiteE,rg2=8の結果です。
kobayashi_yusukeThursday, October 22nd, 2020 at 4:37:36 PM GMT+09:00


7月のsiteE,rg2=10の結果です。
kobayashi_yusukeThursday, October 22nd, 2020 at 4:37:56 PM GMT+09:00
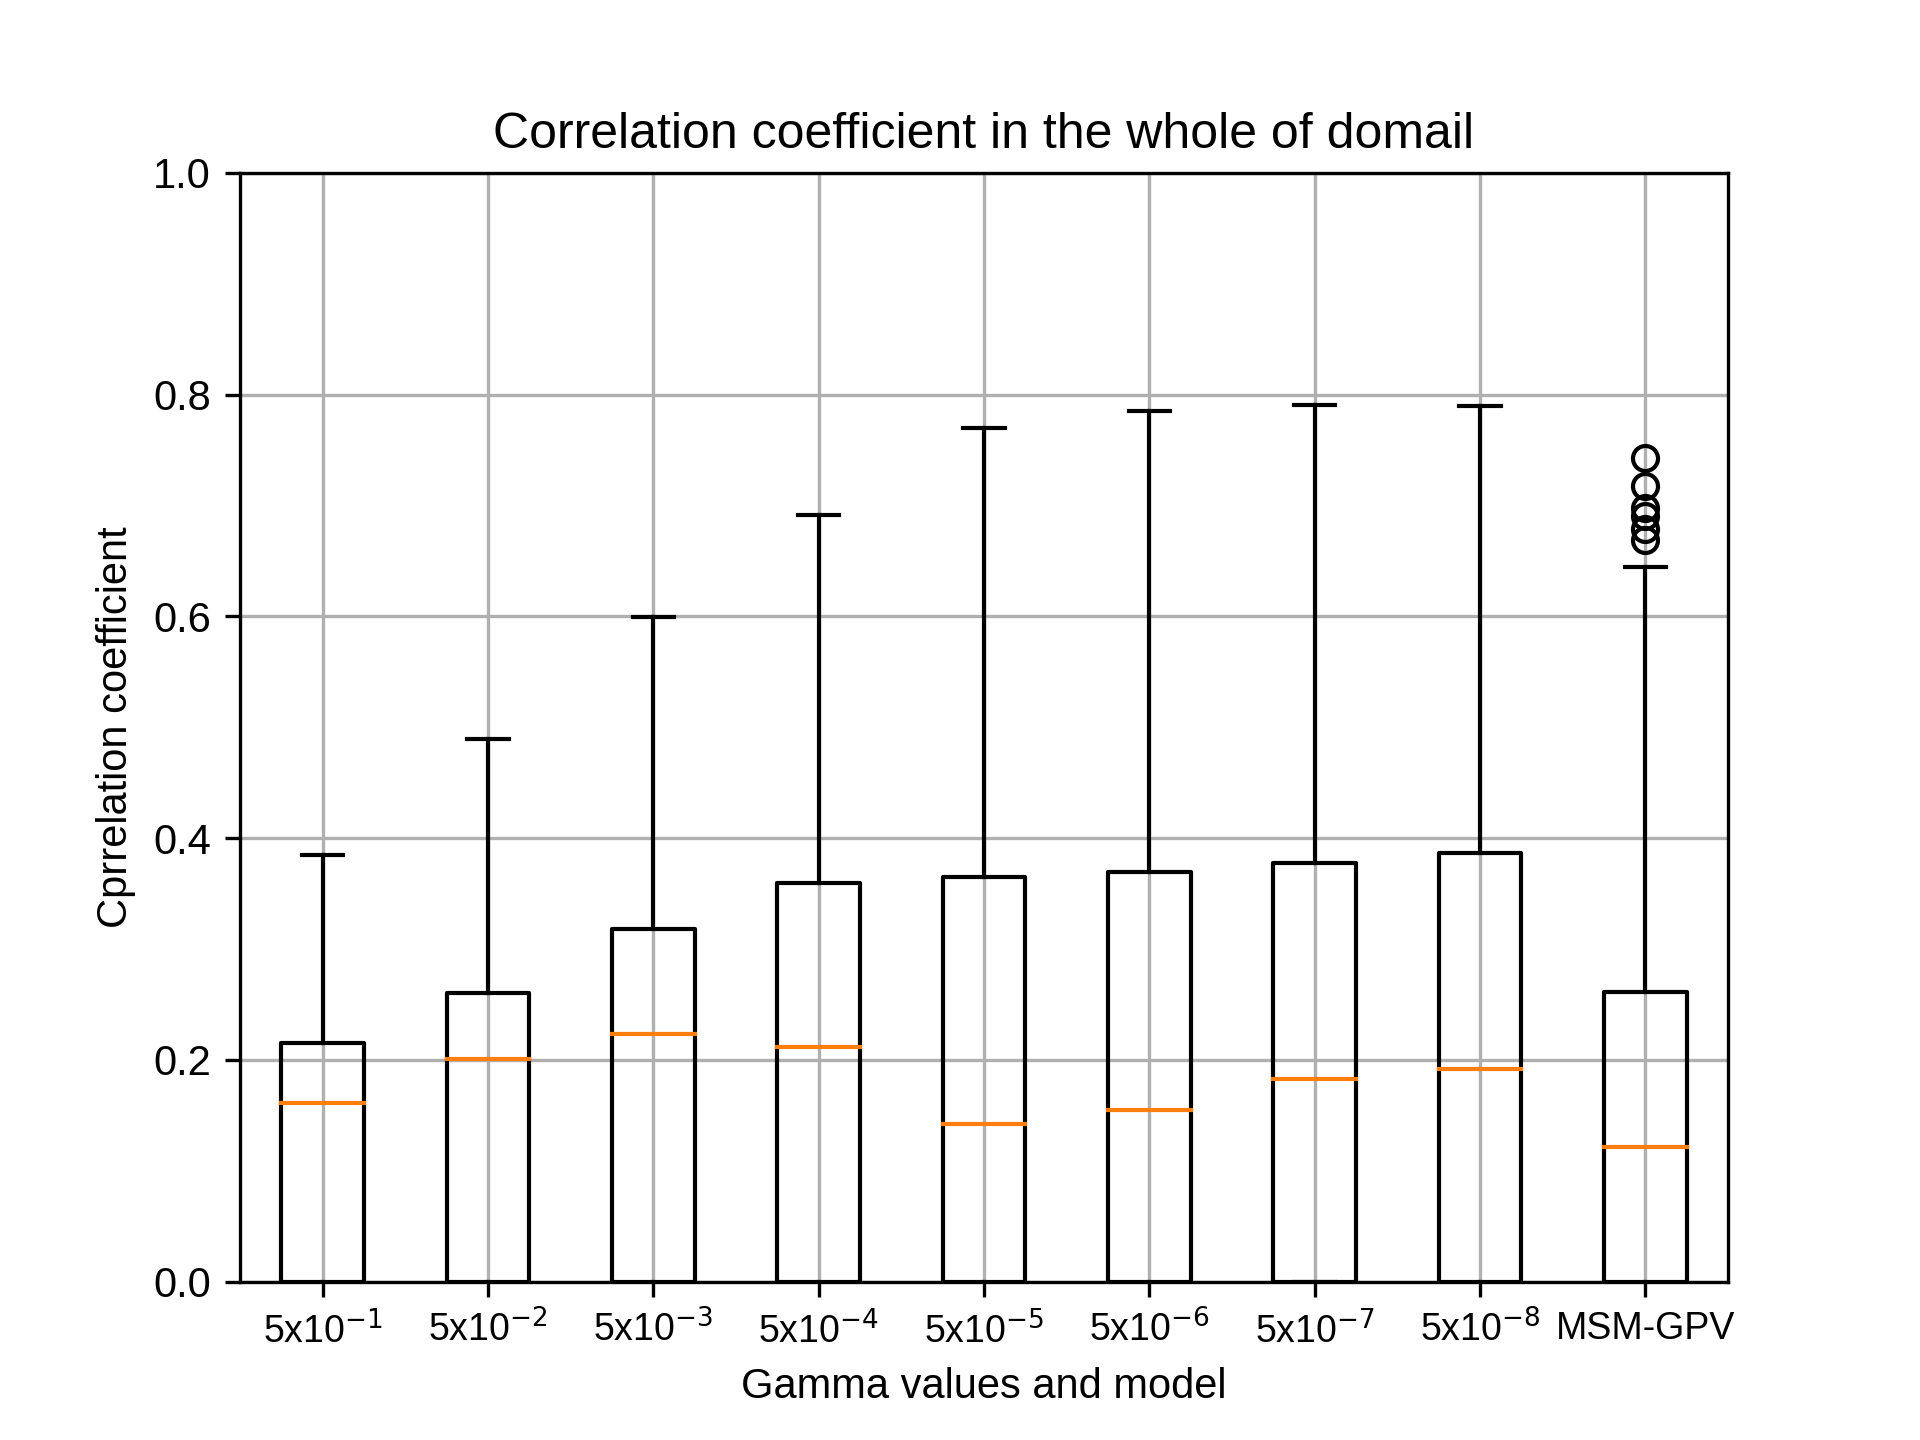
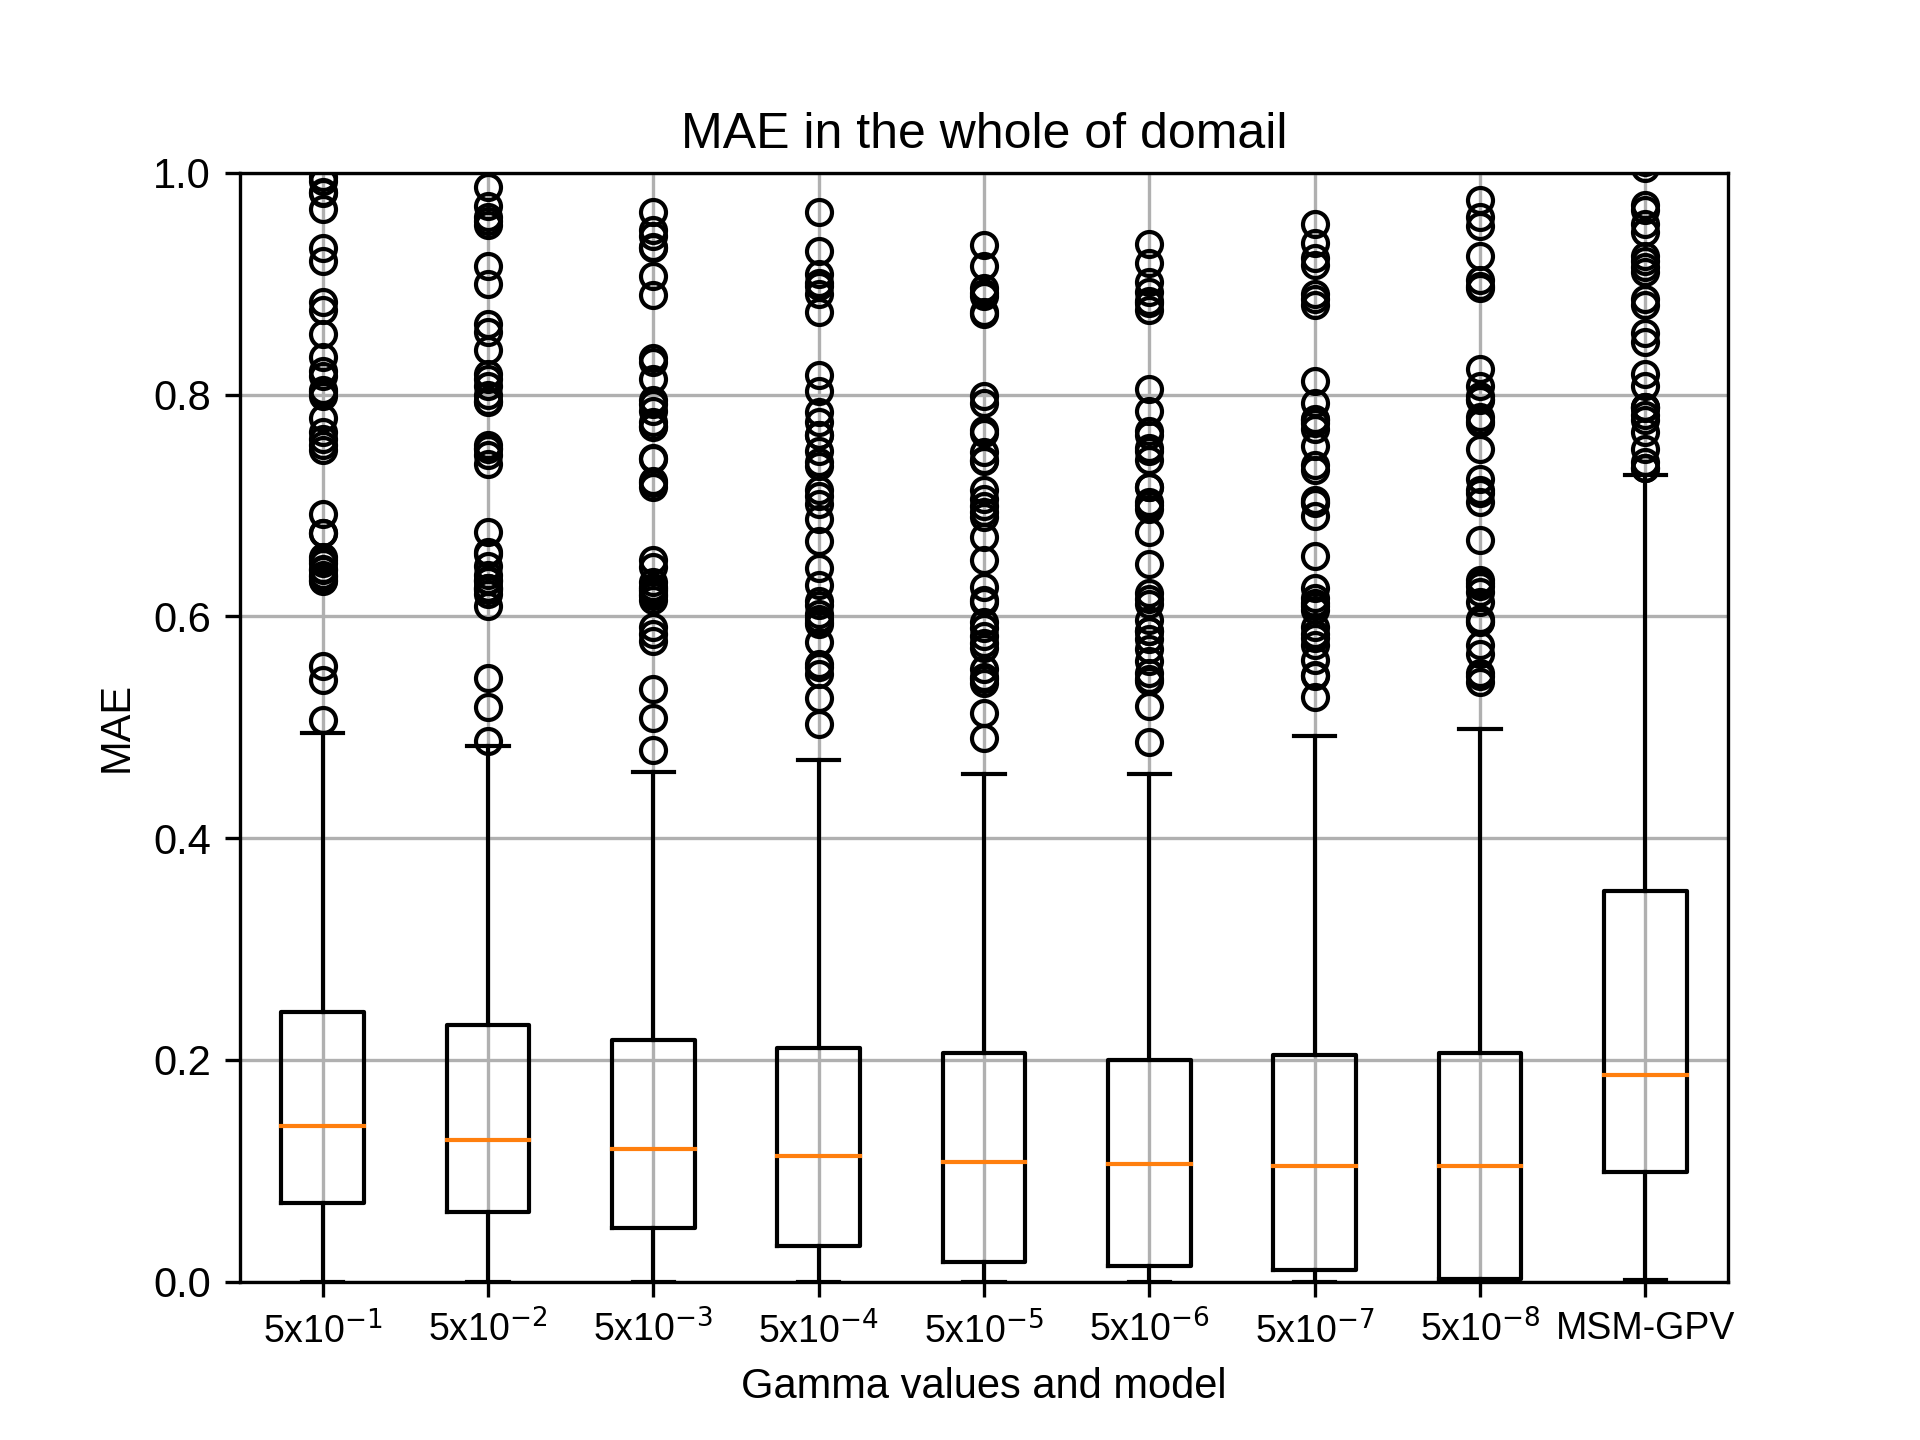
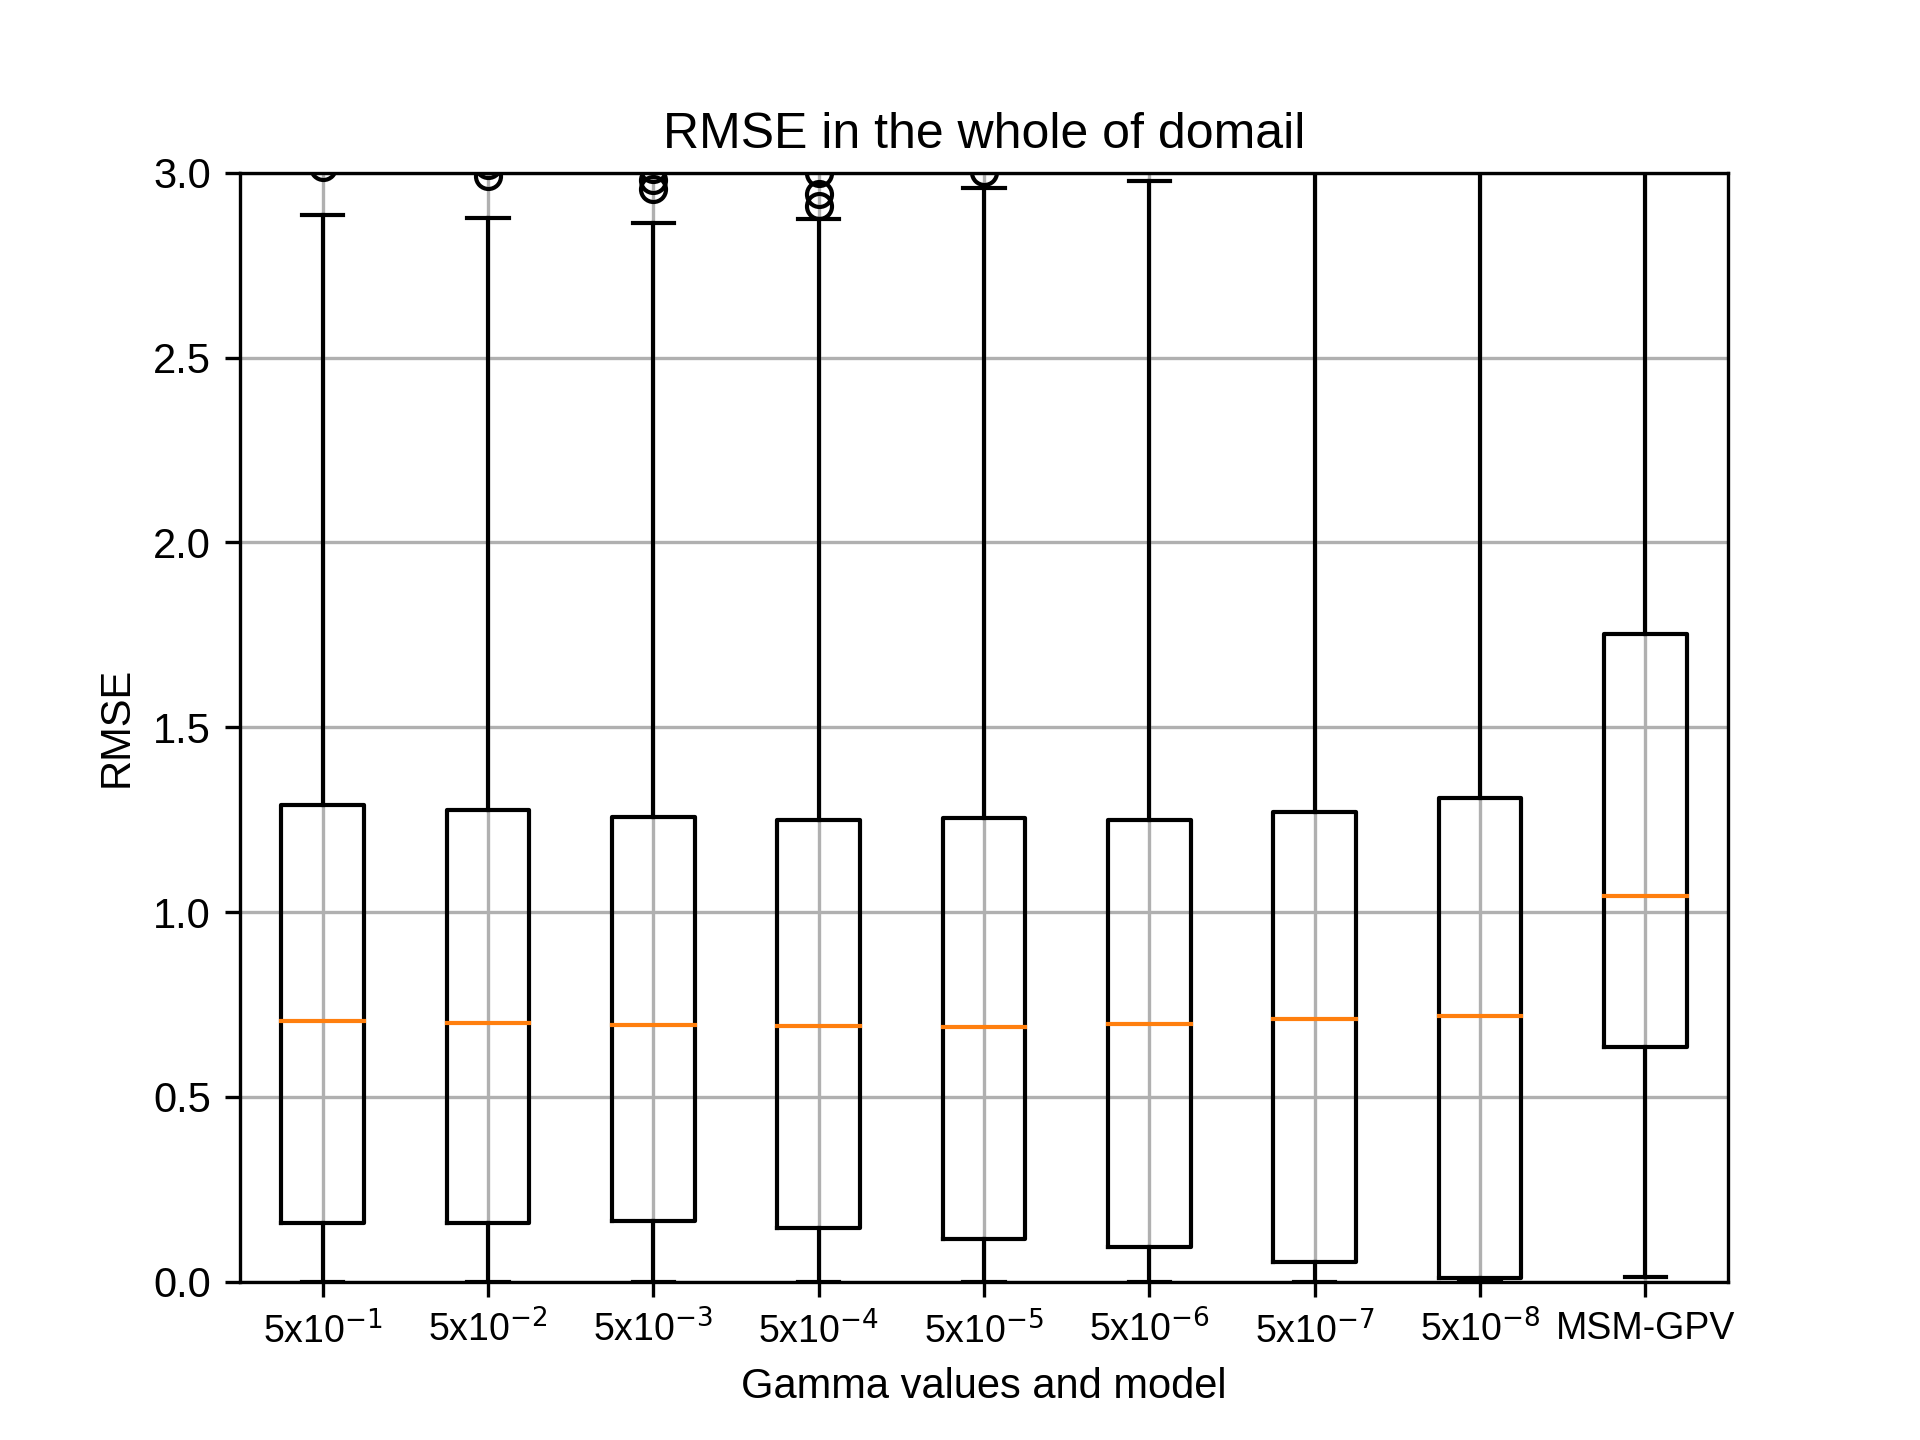
7月のsiteE,rg2=12の結果です。
7月のsiteEではrg2=12でgammaが5x10⁻³のとき、相関係数の中央値が最も高くなりました。
7月のsiteEではrg2=12でgammaが5x10⁻³のとき、相関係数の中央値が最も高くなりました。
kobayashi_yusukeThursday, October 22nd, 2020 at 4:38:16 PM GMT+09:00
1,4,7月をまとめますと、特徴量ベクトルは10もしくは12のときに相関係数の中央値が最も高くなりましたが。8,10,12でほとんど差はございませんでした。
gammaの値はすべて当初のgamma値と同じ値で最大になりました。
途中のエクセルファイルにまとめておりますのでご参照ください。
引き続き、10月の処理を行ってまいります。
以上、よろしくお願いいたします。
gammaの値はすべて当初のgamma値と同じ値で最大になりました。
途中のエクセルファイルにまとめておりますのでご参照ください。
引き続き、10月の処理を行ってまいります。
以上、よろしくお願いいたします。
kobayashi_yusukeThursday, October 22nd, 2020 at 5:08:52 PM GMT+09:00
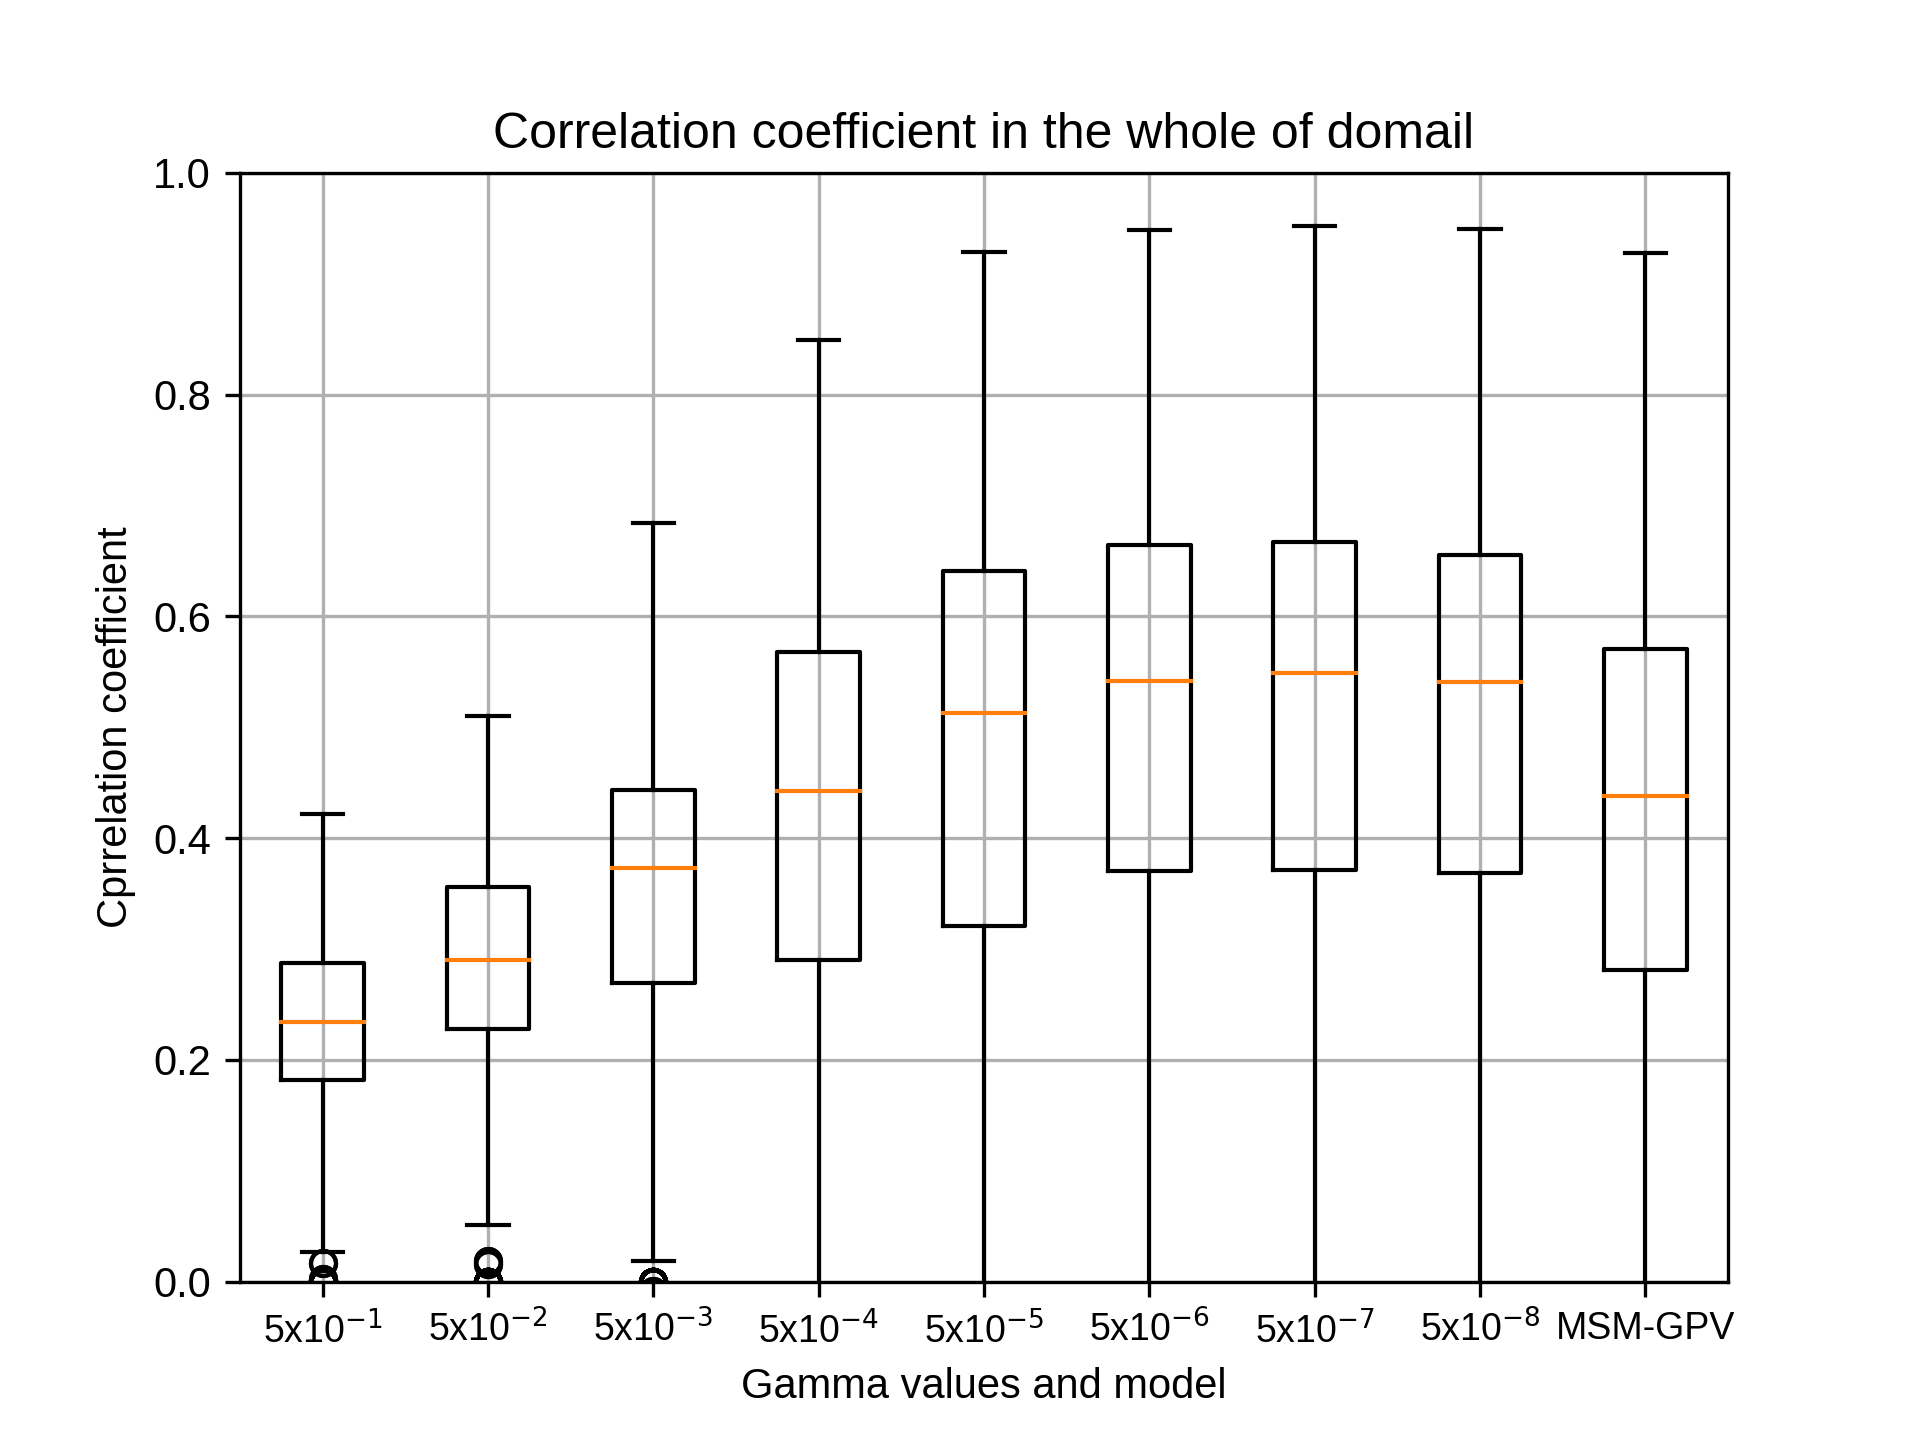

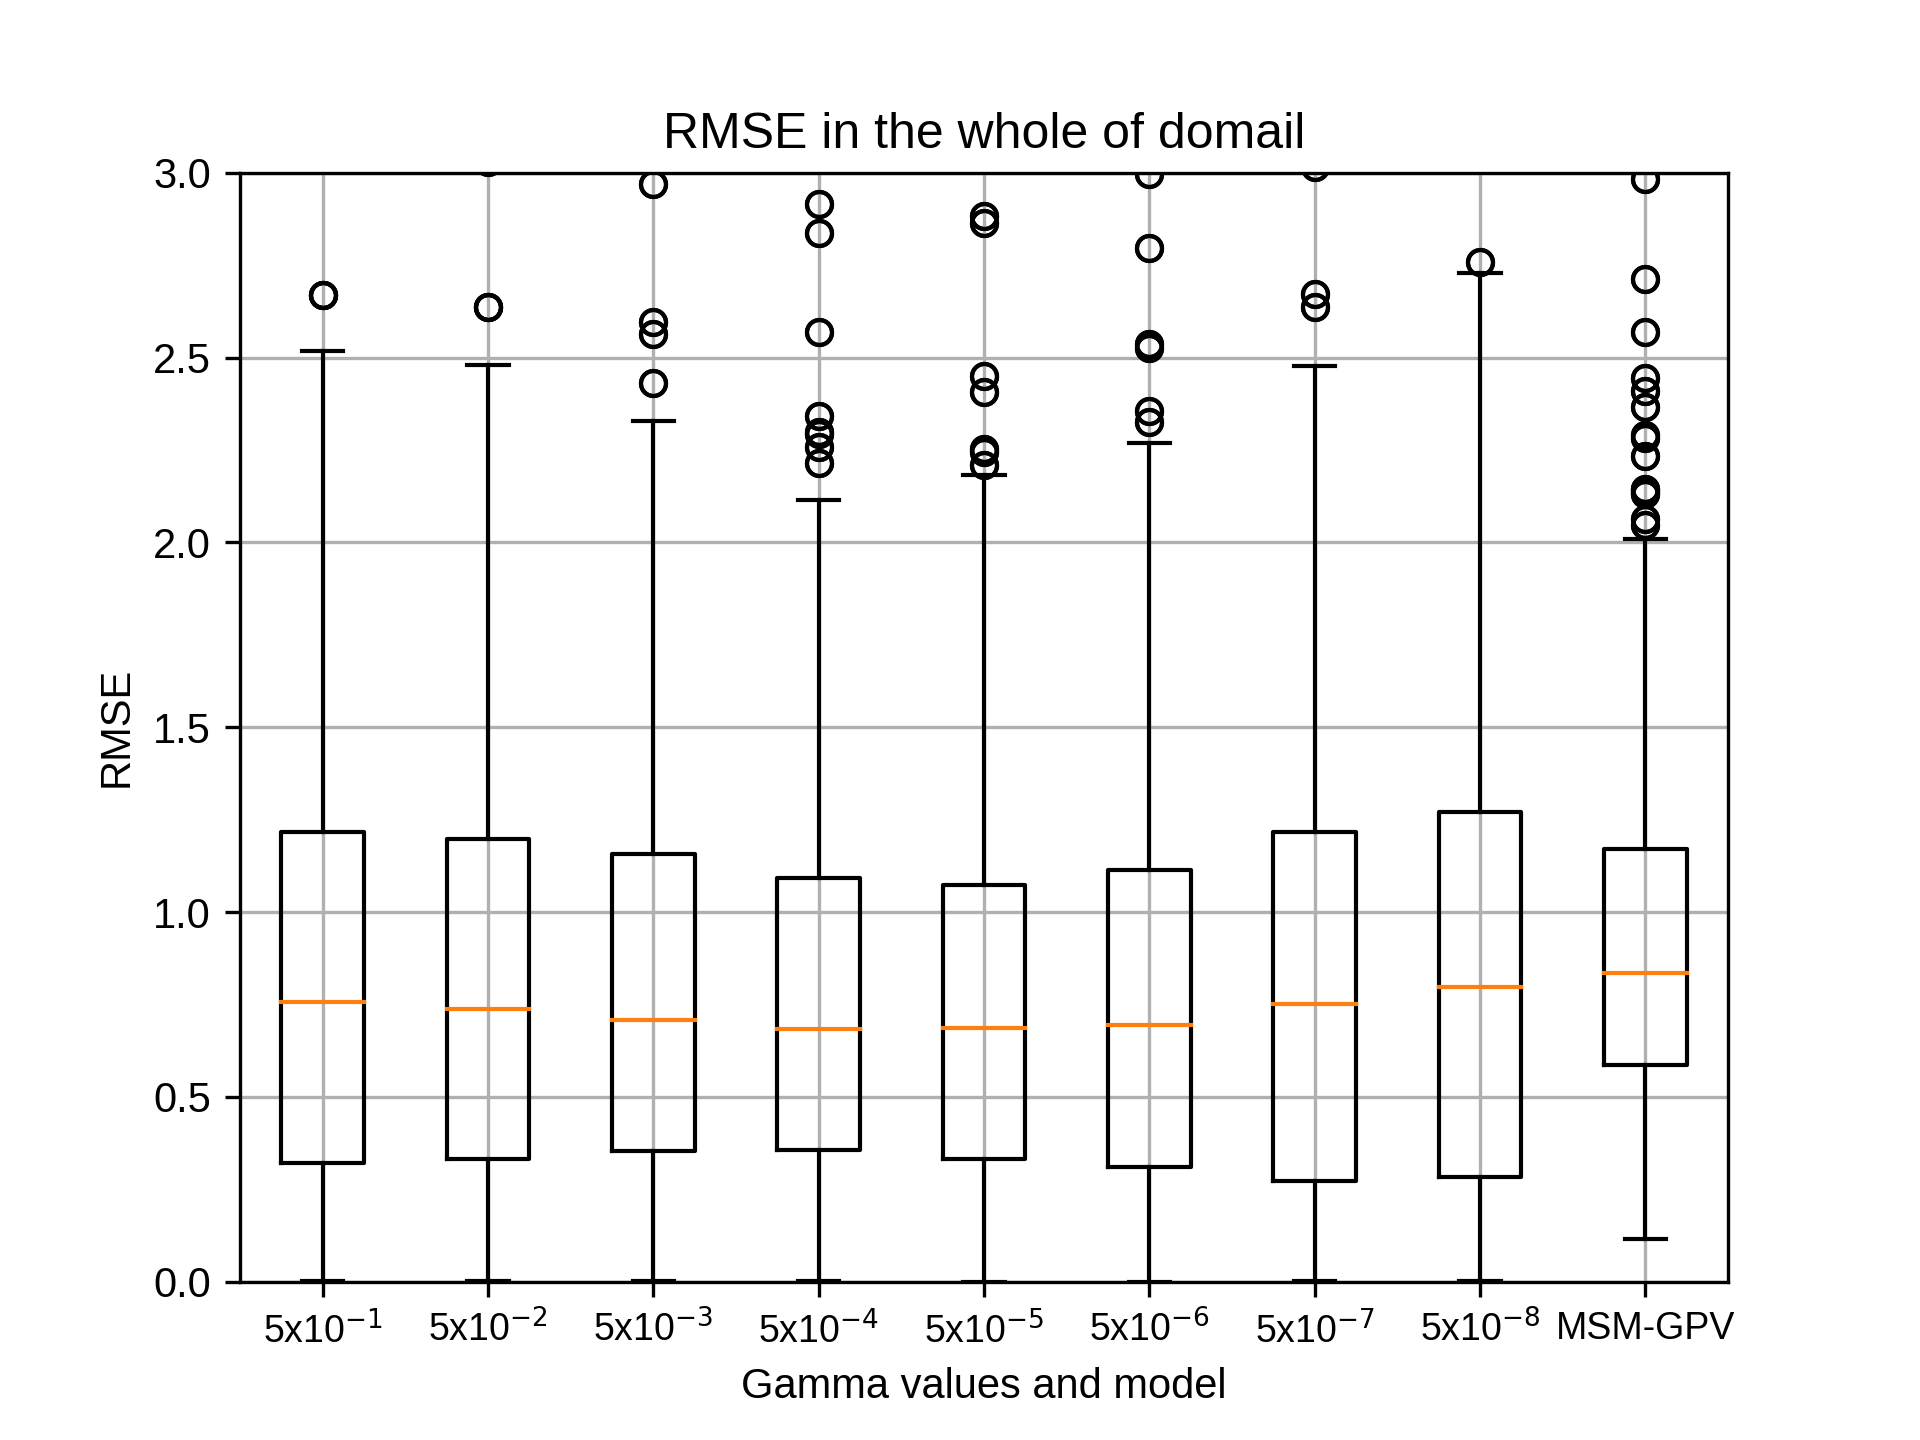
7月のsiteA,rg2=10の結果が誤ったグラフを載せておりましたのでこちらでアップロードします。失礼しました。
takao-yFriday, October 23rd, 2020 at 2:21:26 PM GMT+09:00
小林様。ありがとうございます。7月などは特に領域Cで梅雨前線による降水が多くなるため、領域を狭めた方がパフォーマンスが良いかと思ったのですが、必ずしもそうではなさそうですね。計算機のパフォーマンスも含めて考えた場合に、どの設定がベストでしょうか?
kobayashi_yusukeFriday, October 23rd, 2020 at 2:46:51 PM GMT+09:00
@takao-y
吉兼先生
ご連絡ありがとうございます。
パフォーマンスは10もしくは12がほぼ同じくらいで高くなっております。その際のsiteCでかかった時間は、
10のとき、8時間4分
12のとき、11時間39分
となりました。なお、ともに並列で複数計算しているため単純比較はできませんが、10より12のほうが多く時間がかかることは確かです。
まだ10月を計算中ですが、1月,4月,7月で計算機のパフォーマンスも含めて考えた場合には10がベストと考えております。
以上、よろしくお願いいたします。
吉兼先生
ご連絡ありがとうございます。
パフォーマンスは10もしくは12がほぼ同じくらいで高くなっております。その際のsiteCでかかった時間は、
10のとき、8時間4分
12のとき、11時間39分
となりました。なお、ともに並列で複数計算しているため単純比較はできませんが、10より12のほうが多く時間がかかることは確かです。
まだ10月を計算中ですが、1月,4月,7月で計算機のパフォーマンスも含めて考えた場合には10がベストと考えております。
以上、よろしくお願いいたします。
takao-yFriday, October 30th, 2020 at 8:56:46 AM GMT+09:00
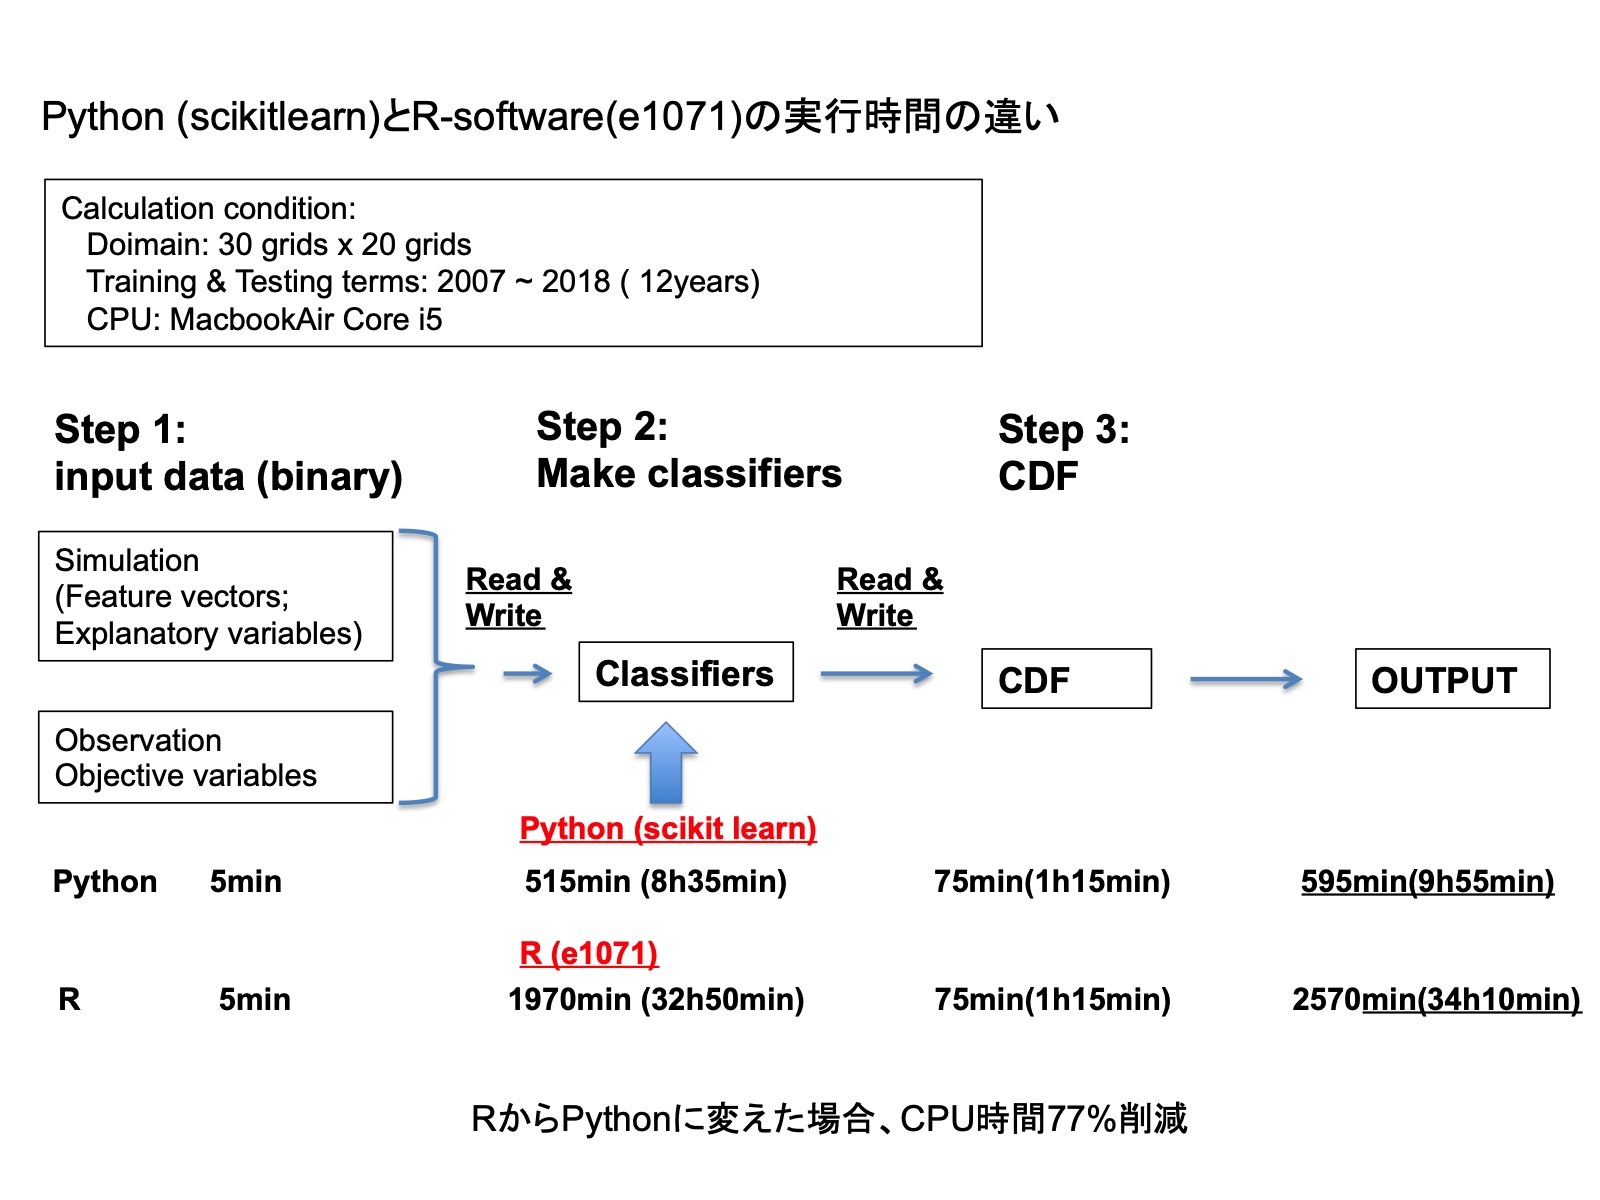
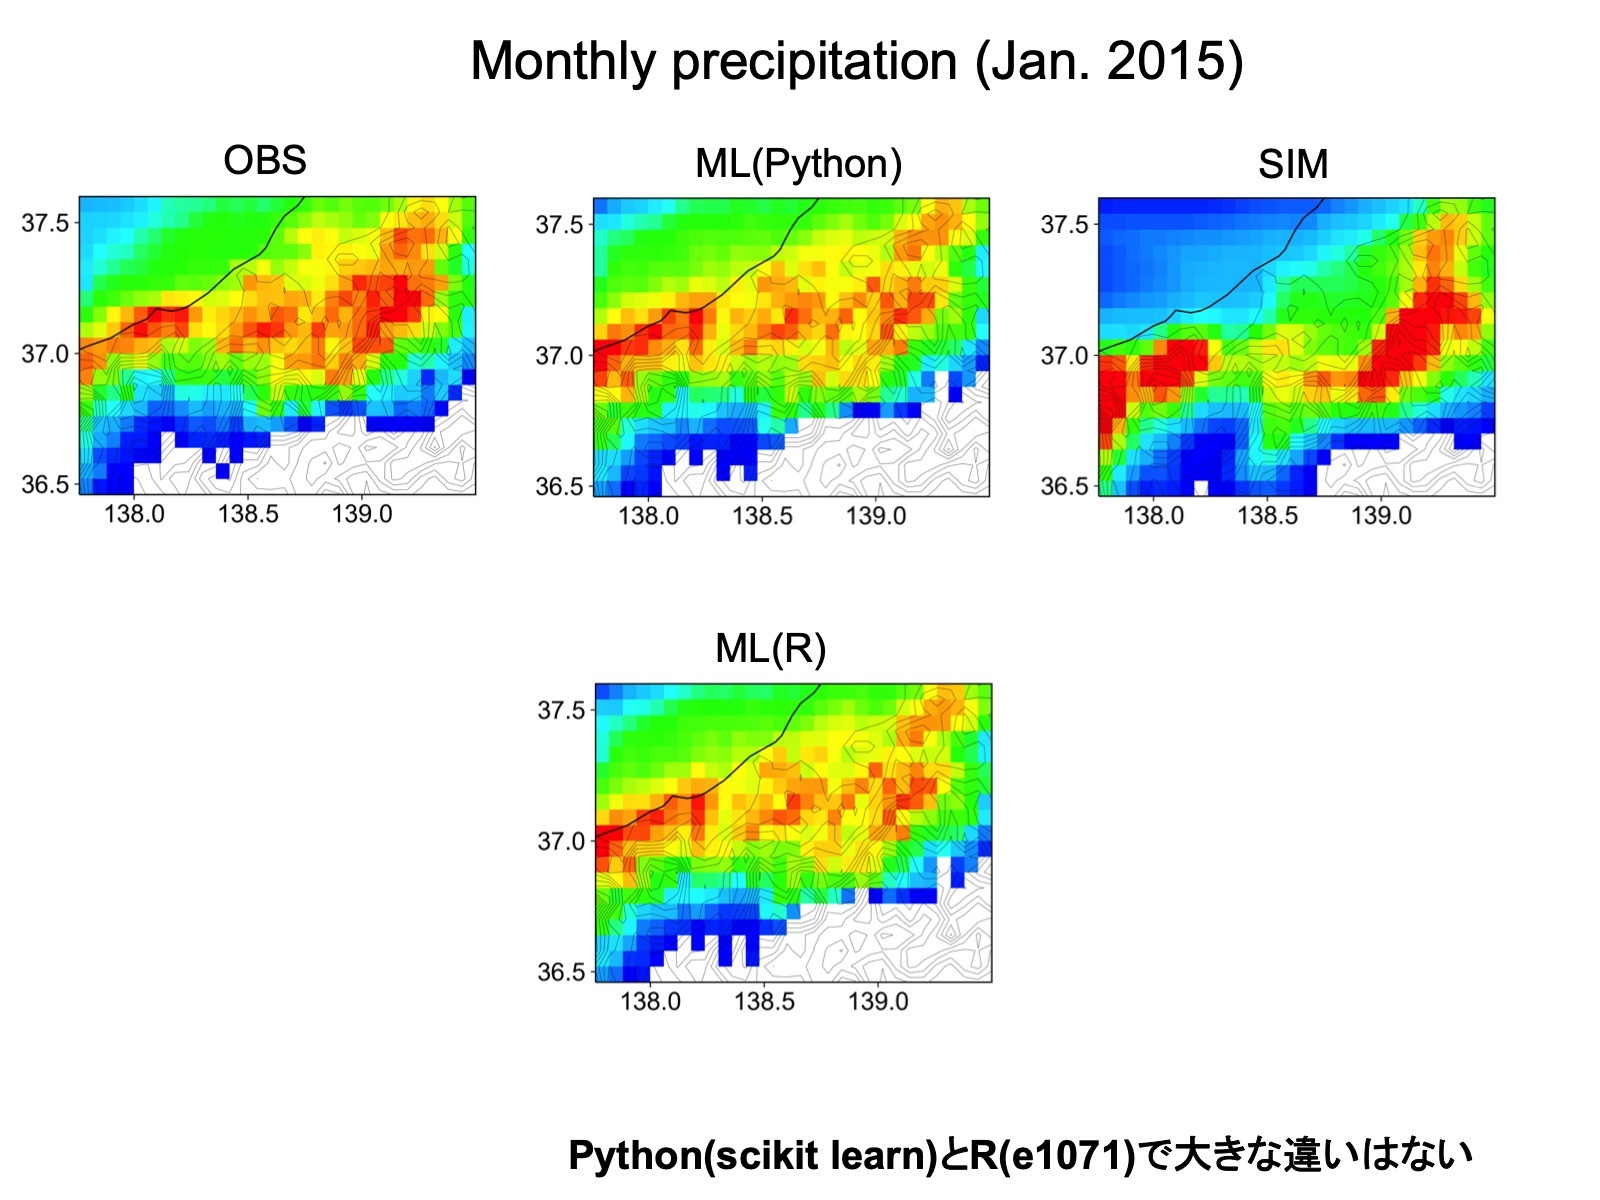
山本様、小林様
お世話になっております。吉兼です。
pythonバイナリ化版を作成しました。
https://www.dropbox.com/s/om2co27l0wadx64/ml-bin2.tar.gz?dl=0
よりダウンロードして動作確認をお願いできますでしょうか。
(以前は接続できたのですが、今回久しぶりに実行するとVPN: Pulse Secureの接続でエラーとなり、今の所解決できていません。私のPCに問題があるのかも。)
python化によって、Rを使っていたよりも大幅に(77%)計算時間が削減されました。結果も図で確認する限りほとんど同じです。(水曜日のY-labでの結果は図を間違えていました)
I/Oへの負担も大幅に軽減されていると思いますので、複数コア同時実行でも問題はないかなと思います。差し当たり12コア程度で試していただければと思います。
よろしくお願いいたします。
yamamoto.kosukeWednesday, November 4th, 2020 at 1:25:38 PM GMT+09:00
@takao-y さま
ご連絡ありがとうございます。次回打合せまでに間に合えば私の方で確認してみます。取り急ぎご連絡まで。
ご連絡ありがとうございます。次回打合せまでに間に合えば私の方で確認してみます。取り急ぎご連絡まで。
takao-yFriday, October 30th, 2020 at 9:40:43 AM GMT+09:00
Yin-san,
I think you are also going to work on JAXA’s server (lili?) from the next month. The system is different from that in isotope2/3. If you have any questions about JAXA’s server, please ask Yamamoto-san and Kobayashi-san. Kobayashi-san is a specialist of machine learning system.
----
You can use the machine learning system in the python virtual environment (python venv) on isotope3. (It does not work on isotope2 so far.) I put the system in the following directory. Please copy the system to your directory.
isotope3: /data28/yoshikane/pub/ml-bin.tar.gz
I think you can also use the system on your PC. If you have time, please try it.
The details (how to use and how to make the python venv) are written in README file.
Please refer to README-R.txt and README-python.txt.
If you have any questions, please let us know.
T. Yoshikane
gyinFriday, October 30th, 2020 at 3:19:13 PM GMT+09:00
Dear Yoshikane-sensei,
Thank you for your guidance! I have copied the system to my directory and I will start exploring it. I will let you know if I meet any problem.
As for the JAXA's server, am I supposed to have an account on it later?
Best regards,
Gaohong
Thank you for your guidance! I have copied the system to my directory and I will start exploring it. I will let you know if I meet any problem.
As for the JAXA's server, am I supposed to have an account on it later?
Best regards,
Gaohong
yamamoto.kosukeWednesday, November 4th, 2020 at 1:32:32 PM GMT+09:00
@gyin -san,
I will prepare your account in JAXA server and let you know when it is ready.
I will prepare your account in JAXA server and let you know when it is ready.
gyinWednesday, November 4th, 2020 at 1:38:02 PM GMT+09:00
Yamamoto-san,
Thank you very much for your help!
Best regards,
Gaohong
Thank you very much for your help!
Best regards,
Gaohong
yamamoto.kosukeWednesday, November 4th, 2020 at 5:44:30 PM GMT+09:00
@gyin -san,
Do you have a preferred account name? If you do, please let me know :-)
Do you have a preferred account name? If you do, please let me know :-)
gyinWednesday, November 4th, 2020 at 11:10:38 PM GMT+09:00
Yamamoto-san,
I am sorry for the late reply. If you have not yet created the account, can I use the name "gyin"? If you have already made it, I will just use the one you created for me. Thank you very much!
Best regards,
Gaohong
I am sorry for the late reply. If you have not yet created the account, can I use the name "gyin"? If you have already made it, I will just use the one you created for me. Thank you very much!
Best regards,
Gaohong
yamamoto.kosukeThursday, November 5th, 2020 at 7:50:43 PM GMT+09:00
@gyin -san,
Thank you for the reply! I have just sent the access information to your e-mail. Please check it!
Thank you for the reply! I have just sent the access information to your e-mail. Please check it!
takao-yWednesday, November 4th, 2020 at 12:04:31 PM GMT+09:00
Yin-san, Kobayashi-san,
I uploaded the PPT file of our research plans.
https://www.dropbox.com/s/etpjmji8agvewzc/20201104-yoshikane.pptx?dl=0
We are trying to investigate the applicability of the machine learning method in Japan area and will provide the estimated data to TE-Japan (Flood forecasting system) in this business year (by the end of March in 2021). For the time being, we want you to try to use the machine learning system include the simple evaluation method for parameter setting (hyper-parameters and range of feature vector). And we wish you could summarize the research (1) in PPT (verification of the method applying to the Japan area every season) as a scientific paper. I think you will take over a part of Kobayashi-san’s work in JAXA’s server. Kobayashi-san, please tell her how to use the system. I think your system is optimized in the server. (If possible, could you replace the system by the new one including binary data conversion?)
If you have any questions, please let me know.
T. Yoshikane
yamamoto.kosukeWednesday, November 4th, 2020 at 1:33:19 PM GMT+09:00
チャンネル名を「機械学習」から「machine-learning」に変更しました
takao-yMonday, November 9th, 2020 at 3:41:29 PM GMT+09:00
Yin-san,
Were you able to login to JAXA’s server?
By the way, I uploaded my presentation file about our study. If you would like, please check it.
https://www.dropbox.com/s/m66s004p96nalfd/20201005.pptx?dl=0
This presentation is written in Japanese but I added the explanations in English in note flame in PowerPoint.
If you have any questions, please let us know.
T. Yoshikane
gyinMonday, November 9th, 2020 at 5:28:19 PM GMT+09:00
Dear Yoshikane-sensei,
Yes, I can login to the JAXA's server now. I will go through the slides carefully and let you know if I have any questions!
Thank you!
Best regards,
Gaohong
Yes, I can login to the JAXA's server now. I will go through the slides carefully and let you know if I have any questions!
Thank you!
Best regards,
Gaohong
takao-yThursday, November 12th, 2020 at 11:48:20 AM GMT+09:00
吉兼です。現在までと今後のワークフローをまとめてみました。step 3はYinさんと私が担当いたします。JAXAのサーバでの実行環境の詳細について教えていただければ幸いです。もし可能であれば、一度引き継ぎの打ち合わせを作業担当者(小林さん、Yinさん、私、その他?)だけで行えればと考えていますが、いかがでしょうか。step 4(小林さん担当?)との関係もあると思いますので、細かい作業内容について確認ができればと思います。よろしくお願いいたします。
Workflow
Restec
1. Obtain the optimal values of hyper-parameters
We have to investigate the following four factors such as hyper-parameters and the size of feature vector (simulated precipitation distribution) before estimating the precipitation in all grids.
Hyper-prameters: Gamma (Gm), Cost (C), Epsilon (Ep)
The size of feature (Fv) initial 21x21 (rg2=10) rg2: the number of grid points from the center of FV
Initial valuese and assumed ranges are obtained from random search at some points.
Step 1: For hyper parameters
1.1 Gm (Change the values), C (Fixed), Ep (Fixed), Fv (Fixed)
If the minimum or maximum values are selected, please extend the range and try it again.
1.2 Gm (Fixed), C (Change), Ep (Fixed), Fv (Fixed)
If the minimum or maximum values are selected, please extend the range and try it again.
1.3 Gm (Fixed), C (Fixed), Ep (Change), Fv (Fixed)
If the minimum or maximum values are selected, please extend the range and try it again.
1.4 Gm (Change), C (Fixed), Ep (Fixed), Fv (Fixed)
If the Gm values are not largely different from the values of 1.1, the oprtimal values are determined.
If not, please repeat the cycle from 1.2 to 1.4
We confirm the sensitivity of C and Ep is not large.
For the reason, we fixed the C and Ep by optimal values obtained in the step1.
Step 2: For the size of FV
2.1 Gm (Change the values), C (Fixed by Optimal values), Ep (Fixed by Optimal values), Fv (rg2=4)
If the minimum or maximum values are selected, please extend the range and try it again.
2.2 Gm (Change the values), C (Fixed), Ep (Fixed), Fv (rg2=6)
If the minimum or maximum values are selected, please extend the range and try it again.
2.3 Gm (Change the values), C (Fixed), Ep (Fixed), Fv (rg2=8)
If the minimum or maximum values are selected, please extend the range and try it again.
2.4 Gm (Change the values), C (Fixed), Ep (Fixed), Fv (rg2=12)
If the minimum or maximum values are selected, please extend the range and try it again.
If the performance does not largely improved, the size of FV (rg2=10) is determined.
2.5 Gm (Change the values), C (Fixed), Ep (Fixed), Fv (rg2=14)
If the minimum or maximum values are selected, please extend the range and try it again.
If the performance does not largely improved, the size of FV (rg2=12) is determined.
We confirmed the performance in the case of rg2=12 does not largely change as those of rg2=10 in all cases.
For the reason, we determined the rg2 as 10.
It is necessary to obtain the optimal values in January, April, July, and October in all regions (A,B,C,D, and E).
----- Almost finished? (2020.11.12)
Step 3 Estimate the precipitation in all grid points by ML + CDF (transform?) using optimal values
( Yin-san and I are in charge.)
This process will be conducted on the JAXA’s server.
We’d appreciate it if you could tell us about the environmental setting on JAXA’s server.
3.1 Need to modify the “ml-bin” according to the environment of JAXA’s server.
How can we get the Input data and adjust the domains?
3.2 Check the server performance.
Is the concurrent execution (e.g. using 10 cores) of the machine learning system possible?
3.3 Execute the ML system using analysis data of MSM-GPV from 2007 to 2018.
Estimation of precipitation in all months
From December to February using optimal parameters in January.
From March to May using optimal parameters in April.
From June to August using optimal parameters in July.
From September to November using optimal parameters in October.
3.4 Execute the ML system using forecast data of MSM-GPV in 2019?
Estimation of precipitation in all months by ML with the classifiers produced by the training form 2007 to 2018.
(CDF-transform method would be applied.)
From December to February using optimal parameters in January.
From March to May using optimal parameters in April.
From June to August using optimal parameters in July.
From September to November using optimal parameters in October.
3.5 Check the performance
Advantages and disadvantages of this method
Which month is the best? And why?
How can we improve the problems?
3.6 Submit a paper to a scientific journal (Yin-san).
Step 4 Construction of ML system for TE-Japan
( Kobayashi-san is in charge?)
4.1 Construction of ML system using the classifiers of old version.
4.2 ML system is improved using the classifiers produced by step 3.4.
The classifiers are produced by using the data of MSMGPV and Radar_AMeDAS from 2007 to 2018.
4.3 ML system is improved by applying the CDF-transform method?
kobayashi_yusukeThursday, November 12th, 2020 at 7:48:22 PM GMT+09:00
吉兼先生
小林です。お世話になっております。
打合せにつきまして承知しました。可能ならJAXAの山本様にもご参加いただいたほうがよろしいかと考えております。山本様を含めた形で日程調整させていただけると幸いです。
Step4につきましては弊財団で担当しますが、詳細は私からですとご説明が難しいため、
Step2からStep3の引継ぎのみ打合せさせていただけると幸いです。
なお、Step2につきまして10月が残っておりますが、解析は完了しましたが整理できておらず、
ご報告できておりません。
整理が完了し、ご報告できるかたちになりましたらこちらでご報告いたします。
以上、よろしくお願いいたします。
小林です。お世話になっております。
打合せにつきまして承知しました。可能ならJAXAの山本様にもご参加いただいたほうがよろしいかと考えております。山本様を含めた形で日程調整させていただけると幸いです。
Step4につきましては弊財団で担当しますが、詳細は私からですとご説明が難しいため、
Step2からStep3の引継ぎのみ打合せさせていただけると幸いです。
なお、Step2につきまして10月が残っておりますが、解析は完了しましたが整理できておらず、
ご報告できておりません。
整理が完了し、ご報告できるかたちになりましたらこちらでご報告いたします。
以上、よろしくお願いいたします。
takao-ySaturday, November 14th, 2020 at 8:27:19 AM GMT+09:00
小林様
吉兼です。ご連絡ありがとうございます。承知いたしました。Step4については別の機会に打ち合わせができればと思います。(基本的には、Step3で作成した識別器をStep4で用いることを想定して進めていきたいと考えています。)よろしくお願いいたします。
吉兼です。ご連絡ありがとうございます。承知いたしました。Step4については別の機会に打ち合わせができればと思います。(基本的には、Step3で作成した識別器をStep4で用いることを想定して進めていきたいと考えています。)よろしくお願いいたします。
takao-ySaturday, November 14th, 2020 at 9:24:55 AM GMT+09:00
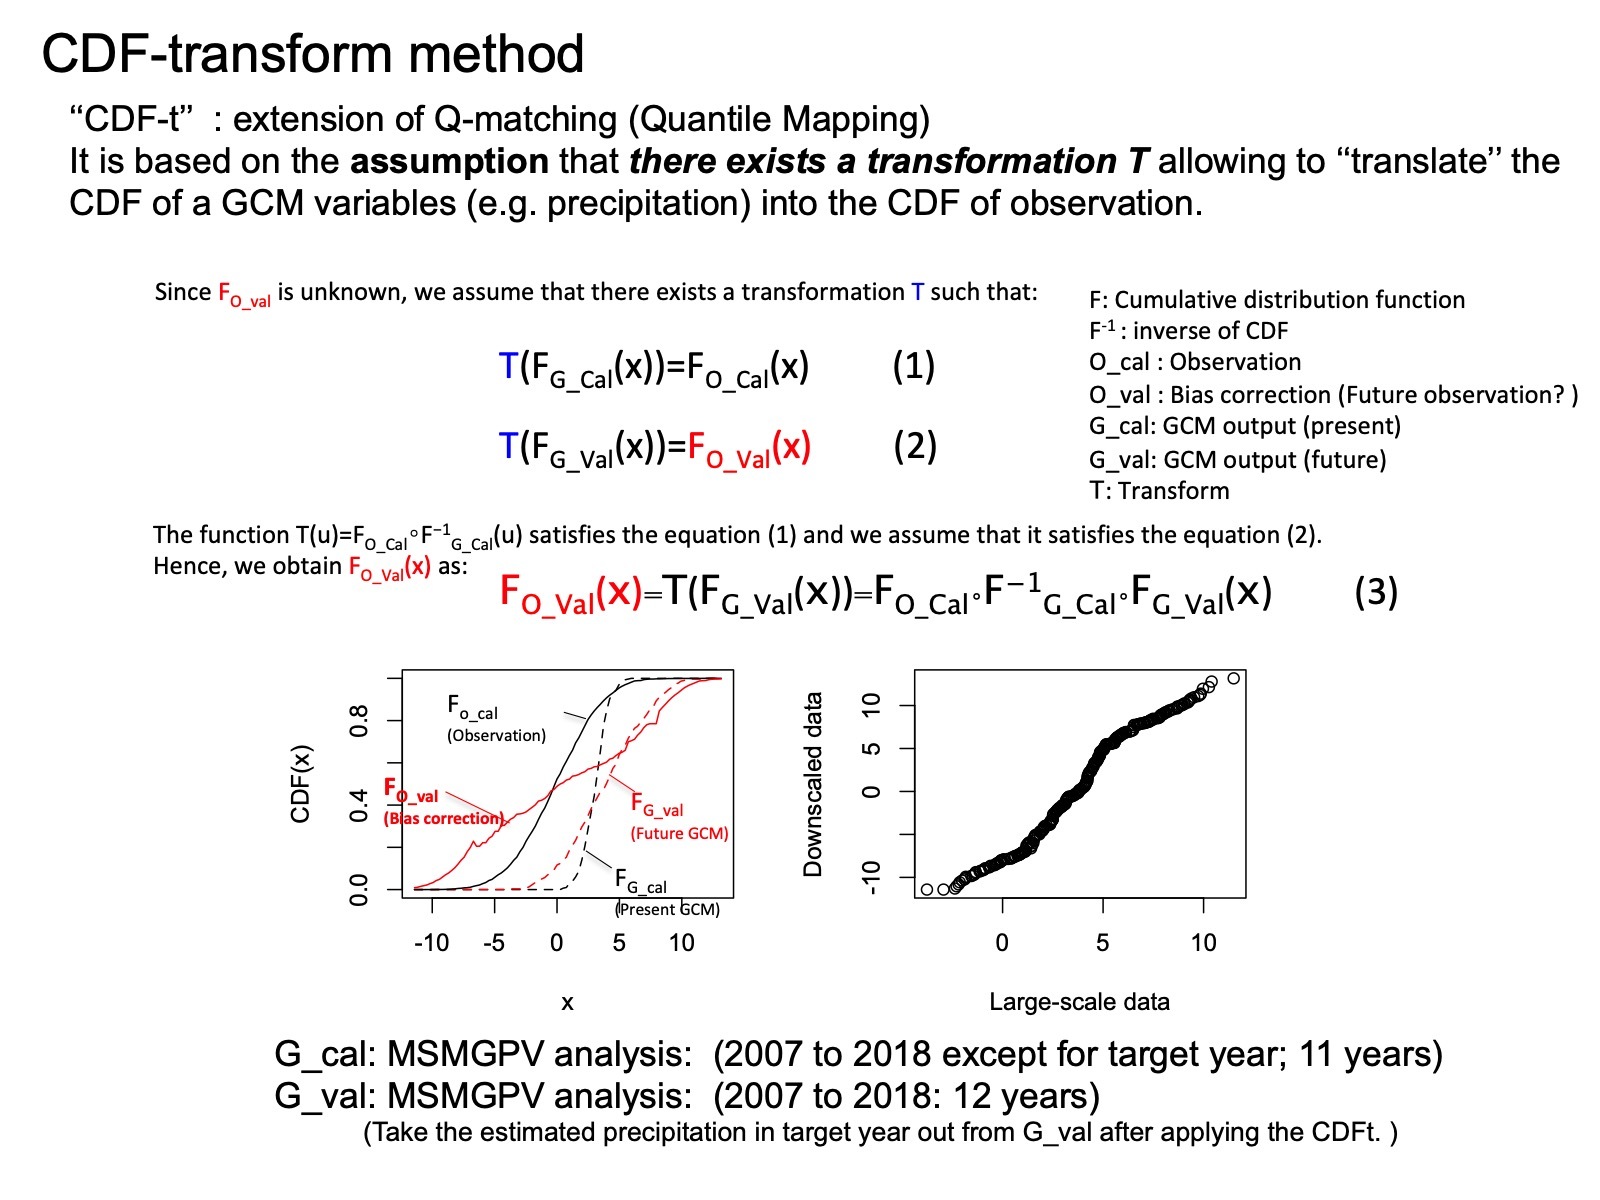
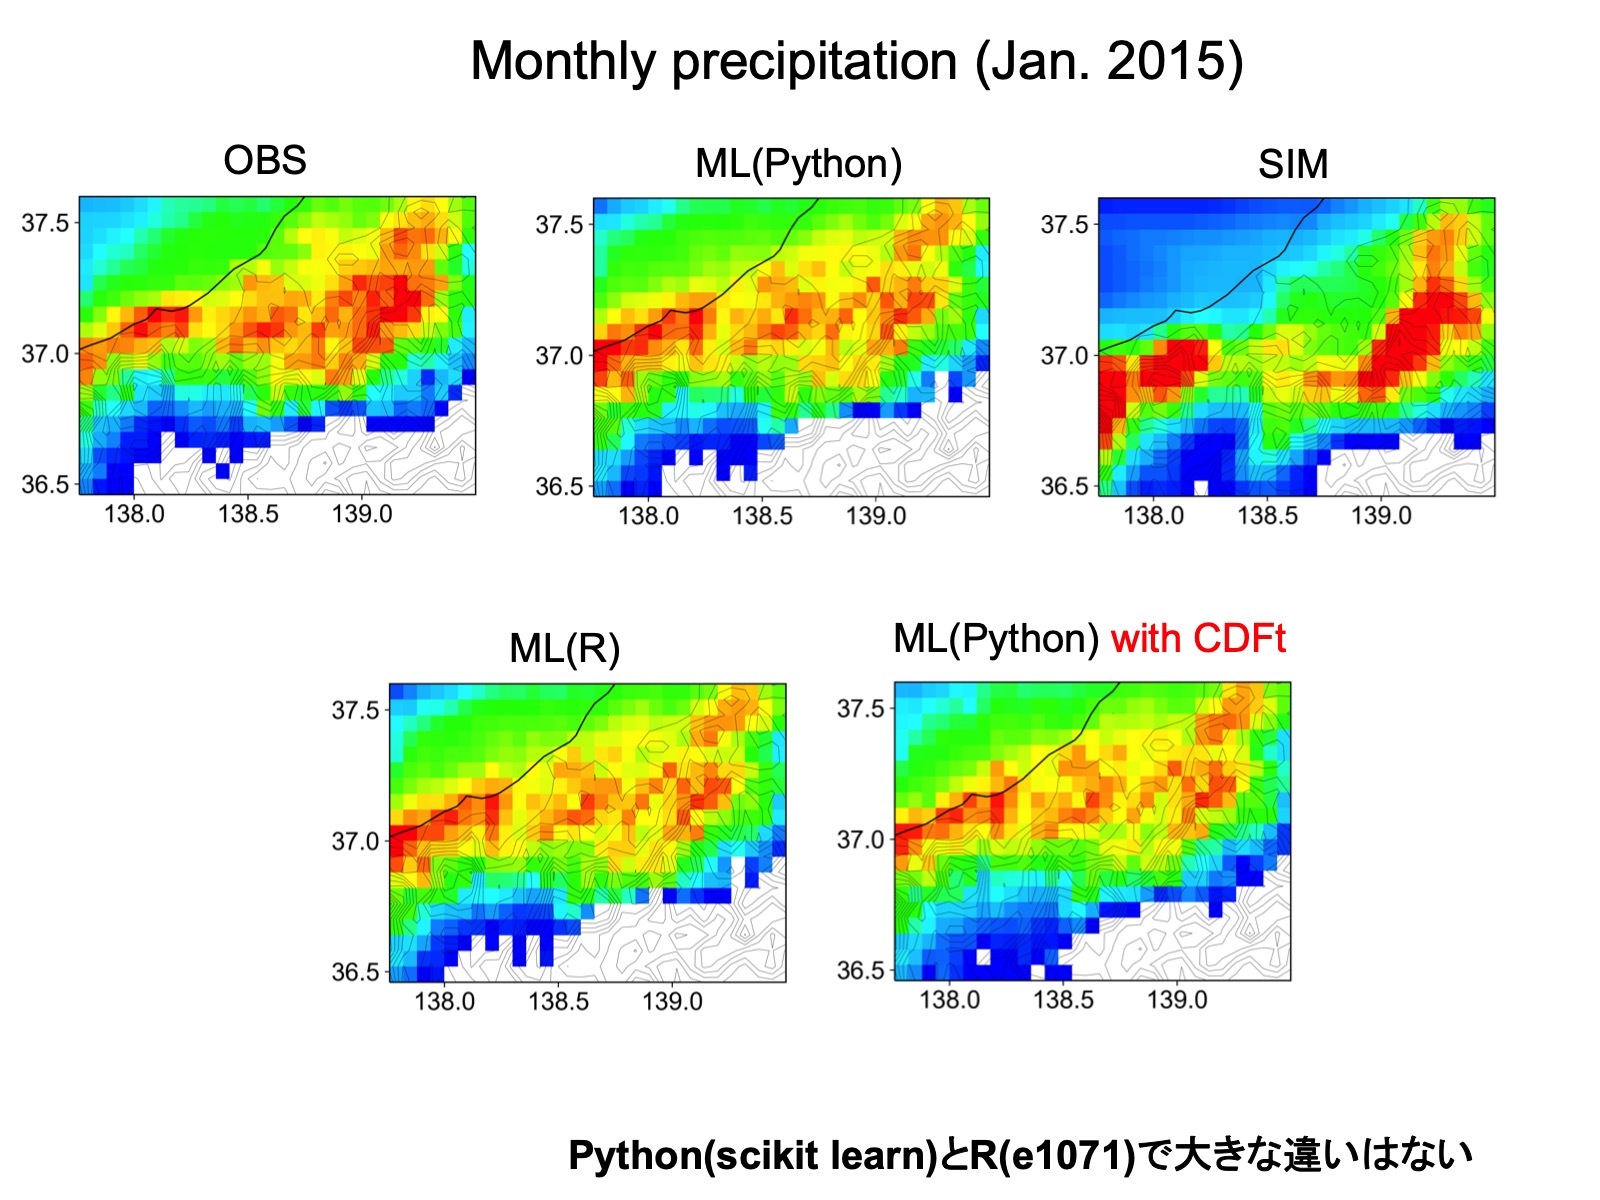
吉兼です。
バイナリ化版のCDF-transform法適用版を以下に置きました。
https://www.dropbox.com/s/wkfq13qeh44utkz/mlcdft-bin.tar.gz?dl=0
これにより、観測最大値で頭打ちになる問題に対応できると考えています。(例えば、昨年の台風19号のケースなどで降水量ピークが頭打ちとなる問題の改善を確認)これにより、山本さんの結果にもみられた2018年7月の西日本豪雨での河川流量の過小評価についてもある程度改善できるのではないかと考えています。CDF-transformの概要図と2015年1月の降水量推定値の結果を添付します。観測とシミュレーションの現在のCDFを評価対象年を除く11年間として、将来CDFに相当するものを評価対象年を含む12年間で与えています。(これにより、CDFでは評価が難しかった年々変動の議論もできるのではないかと期待しています。)このケースでは問題なさそうですが、他の数事例に適用して問題ないことを確認した後で、正式に採用できればと考えています。よろしくお願いいたします。
Yin-san, I produced another version of the ML system. You can get the system from the following site. This works on Mac. If you have time, please try it on your Mac.
https://www.dropbox.com/s/wkfq13qeh44utkz/mlcdft-bin.tar.gz?dl=0
I used the CDF-transform method in this version. Usually, CDF-transform method is used to estimate the values for the future climate change. I will attach the figure of the concept of method and the results (estimated monthly precipitation distribution in January 2015). I think we can solve the problem of the limitation of peak value by the observed maximum value. In the CDF-transform, the present CDFs of observation and simulation were produced by the 11 years data from 2007 to 2018 excluding the target year and the assumed future CDFs of simulation were produced by the 12 years data including the target year. And then, I took the estimated precipitation in the target year out from the estimated precipitation in the assumed future observation data. It is expected that we can discuss the inter-annual variation of estimated precipitation, which was difficult in the CDF method. After checking the performance, I hope this method is applied formally. If you have any questions, please let me know.
yamamoto.kosukeMonday, November 23rd, 2020 at 4:55:58 PM GMT+09:00
@takao-y さま
Step3の実施を目指して、新しくご提供いただいたmlcdft-binを確認しています。step02.shまでの動作確認はできましたが、step03のcdf補正がRスクリプトになっているようでした。こちらは定常運用でもRを使うことを想定されているものでしょうか。
Step3の実施を目指して、新しくご提供いただいたmlcdft-binを確認しています。step02.shまでの動作確認はできましたが、step03のcdf補正がRスクリプトになっているようでした。こちらは定常運用でもRを使うことを想定されているものでしょうか。
takao-yTuesday, November 24th, 2020 at 1:35:08 PM GMT+09:00
@kobayashi_yusuke @yamamoto.kosuke
山本様
吉兼です。CDFに関してはRで作動していたと思われますが、pythonで実施されているのでしょうか。
山本様
吉兼です。CDFに関してはRで作動していたと思われますが、pythonで実施されているのでしょうか。
kobayashi_yusukeTuesday, November 24th, 2020 at 2:39:17 PM GMT+09:00
@takao-y
吉兼先生
昨年度のCDFはRで行っておりました。CDFのような処理をするモジュールがPythonに無いためにPythonへの書き換えは行っておりませんでした。以上、よろしくお願いいたします。
吉兼先生
昨年度のCDFはRで行っておりました。CDFのような処理をするモジュールがPythonに無いためにPythonへの書き換えは行っておりませんでした。以上、よろしくお願いいたします。
yamamoto.kosukeWednesday, November 25th, 2020 at 2:03:53 PM GMT+09:00
@takao-y さま、@kobayashi_yusuke さま
お返事ありがとうございます。当方にCDF部分のコードの認識がなかったので念のため確認させていただきました。昨年度の経験から定常処理に問題がないようであればRのままでよいと思っています。このあたり含め本日お話しできればと思います。よろしくお願いいたします。
お返事ありがとうございます。当方にCDF部分のコードの認識がなかったので念のため確認させていただきました。昨年度の経験から定常処理に問題がないようであればRのままでよいと思っています。このあたり含め本日お話しできればと思います。よろしくお願いいたします。
kobayashi_yusukeMonday, November 16th, 2020 at 5:22:05 PM GMT+09:00

@takao-y
吉兼先生特徴量ベクトルのうち、残っておりました10月の結果を整理しましたのでお伝えいたします。
cost,epsilonはそれぞれこれまでのハイパーパラメータ決定で相関係数の中央値が最大のものを採用しました。詳細は添付のエクセルをご参照ください。結果は表の右2列となります。特徴量ベクトルは8もしくは12で最大、gammaは当初の結果と同じになりました。ただ、特徴量ベクトルはrg2=8,10,12で大きな差はございませんでした。
吉兼先生特徴量ベクトルのうち、残っておりました10月の結果を整理しましたのでお伝えいたします。
cost,epsilonはそれぞれこれまでのハイパーパラメータ決定で相関係数の中央値が最大のものを採用しました。詳細は添付のエクセルをご参照ください。結果は表の右2列となります。特徴量ベクトルは8もしくは12で最大、gammaは当初の結果と同じになりました。ただ、特徴量ベクトルはrg2=8,10,12で大きな差はございませんでした。
kobayashi_yusukeMonday, November 16th, 2020 at 5:22:33 PM GMT+09:00
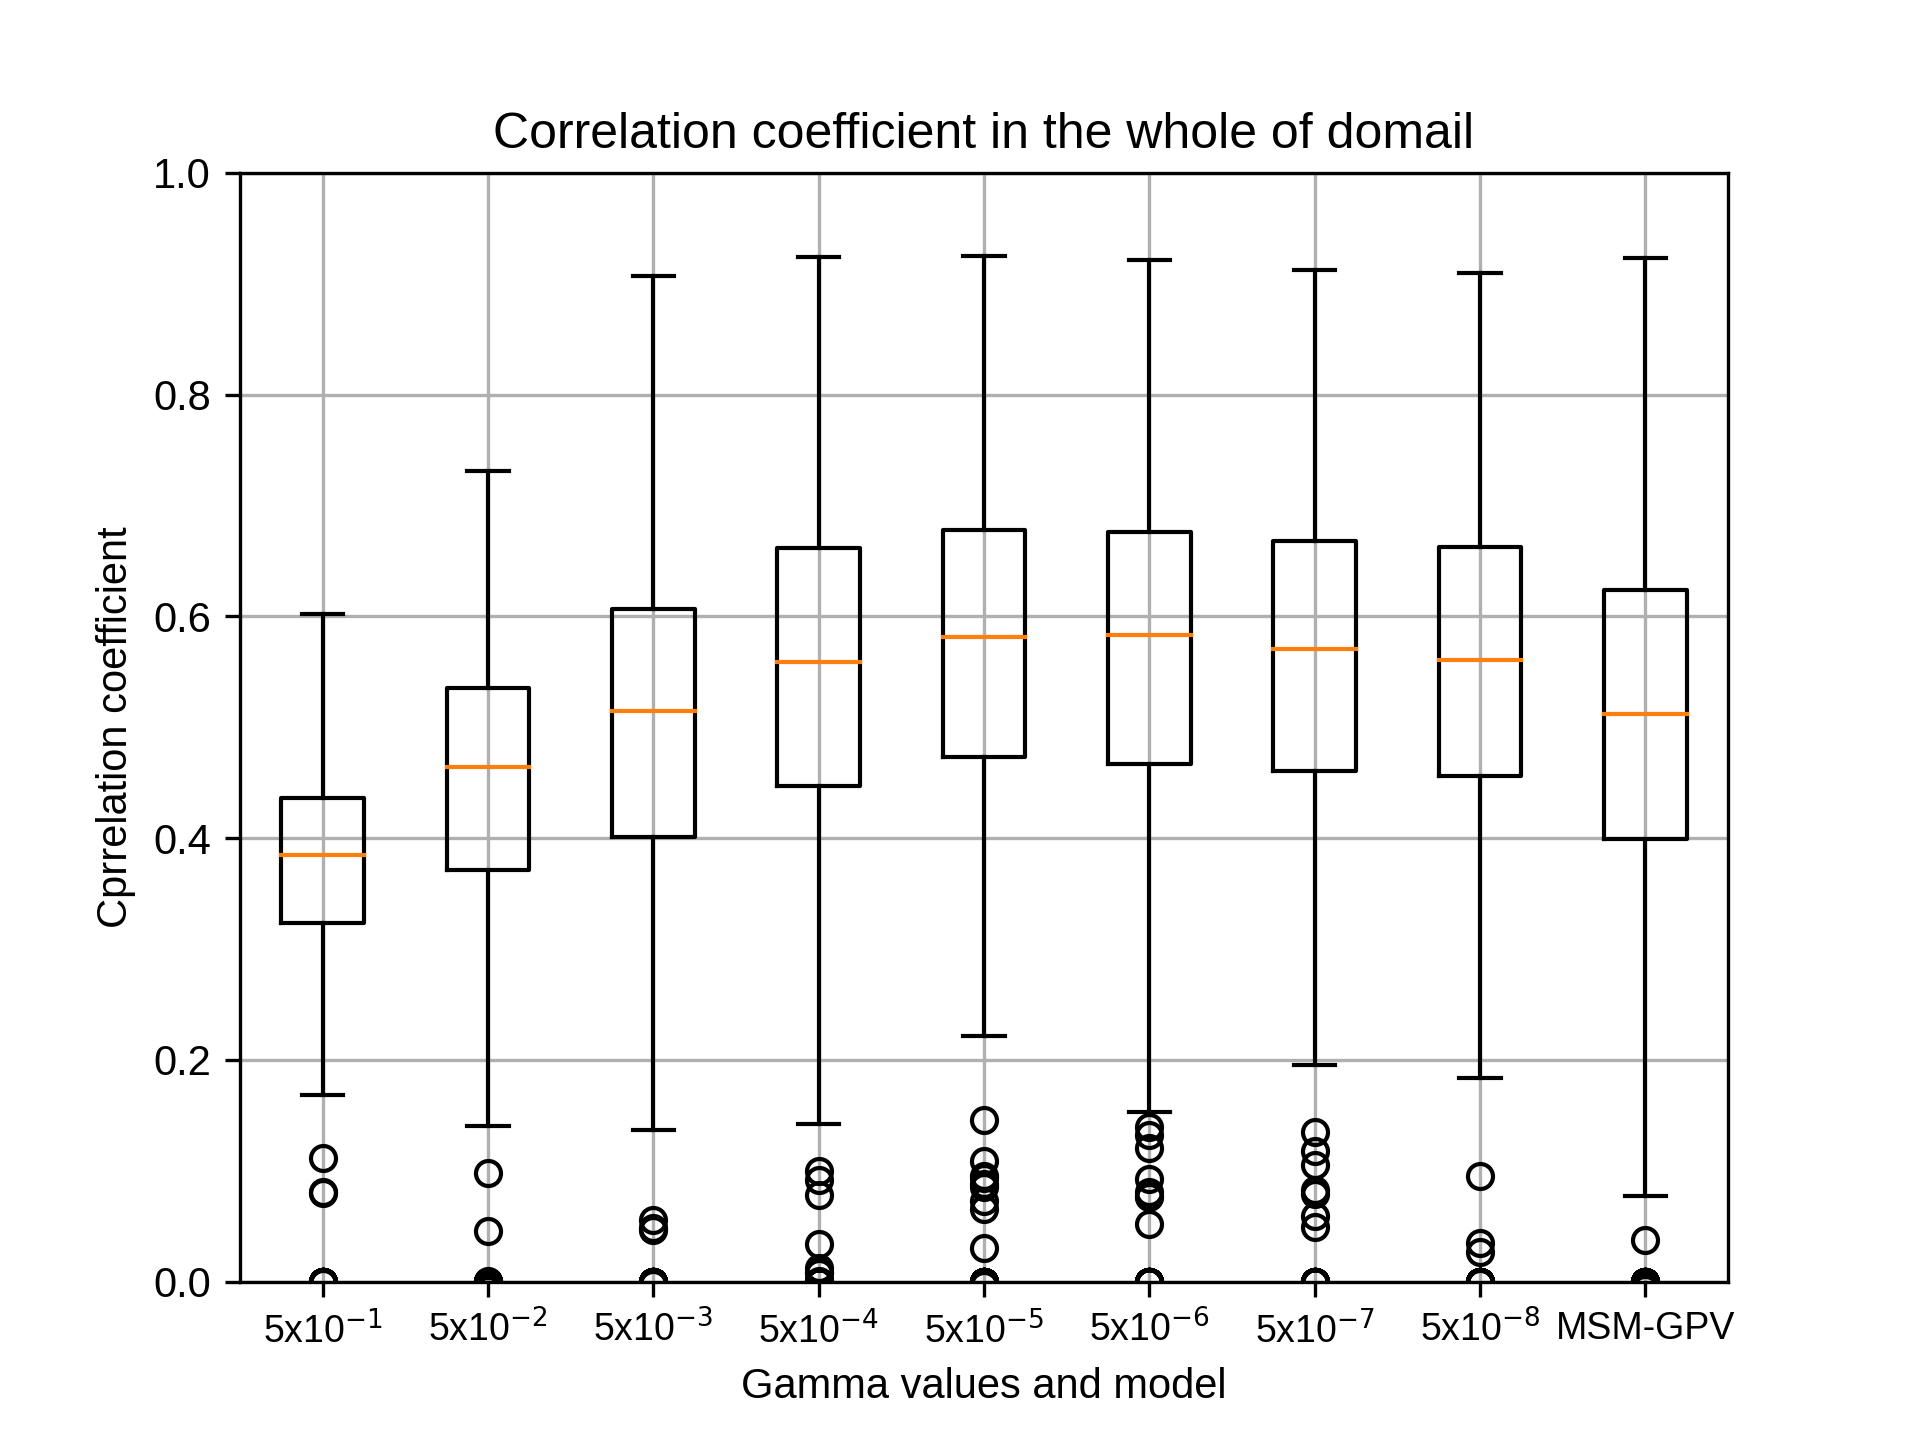
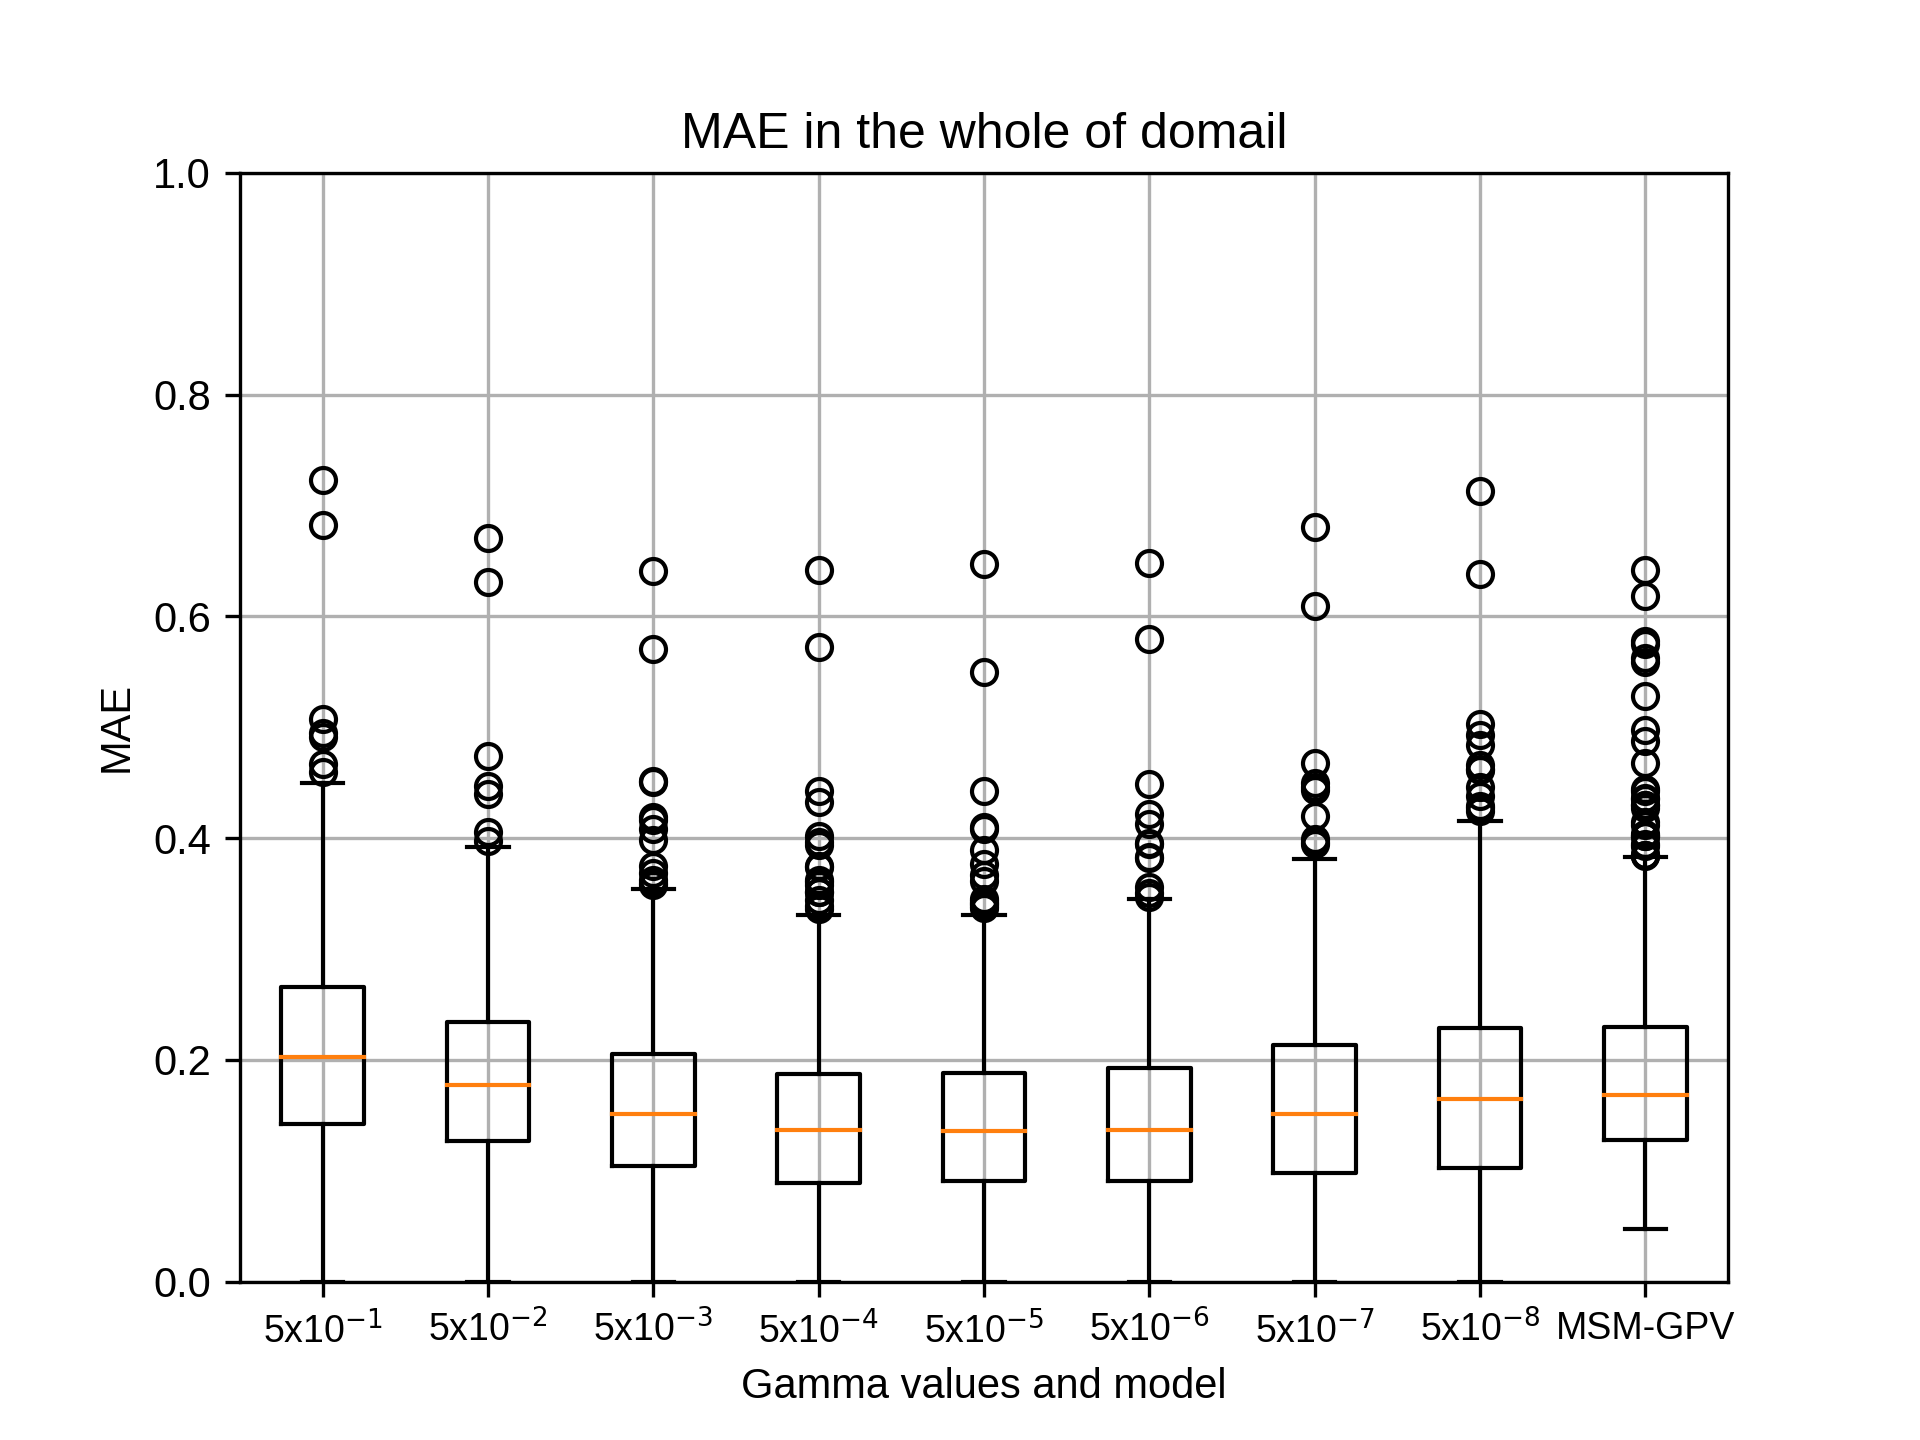
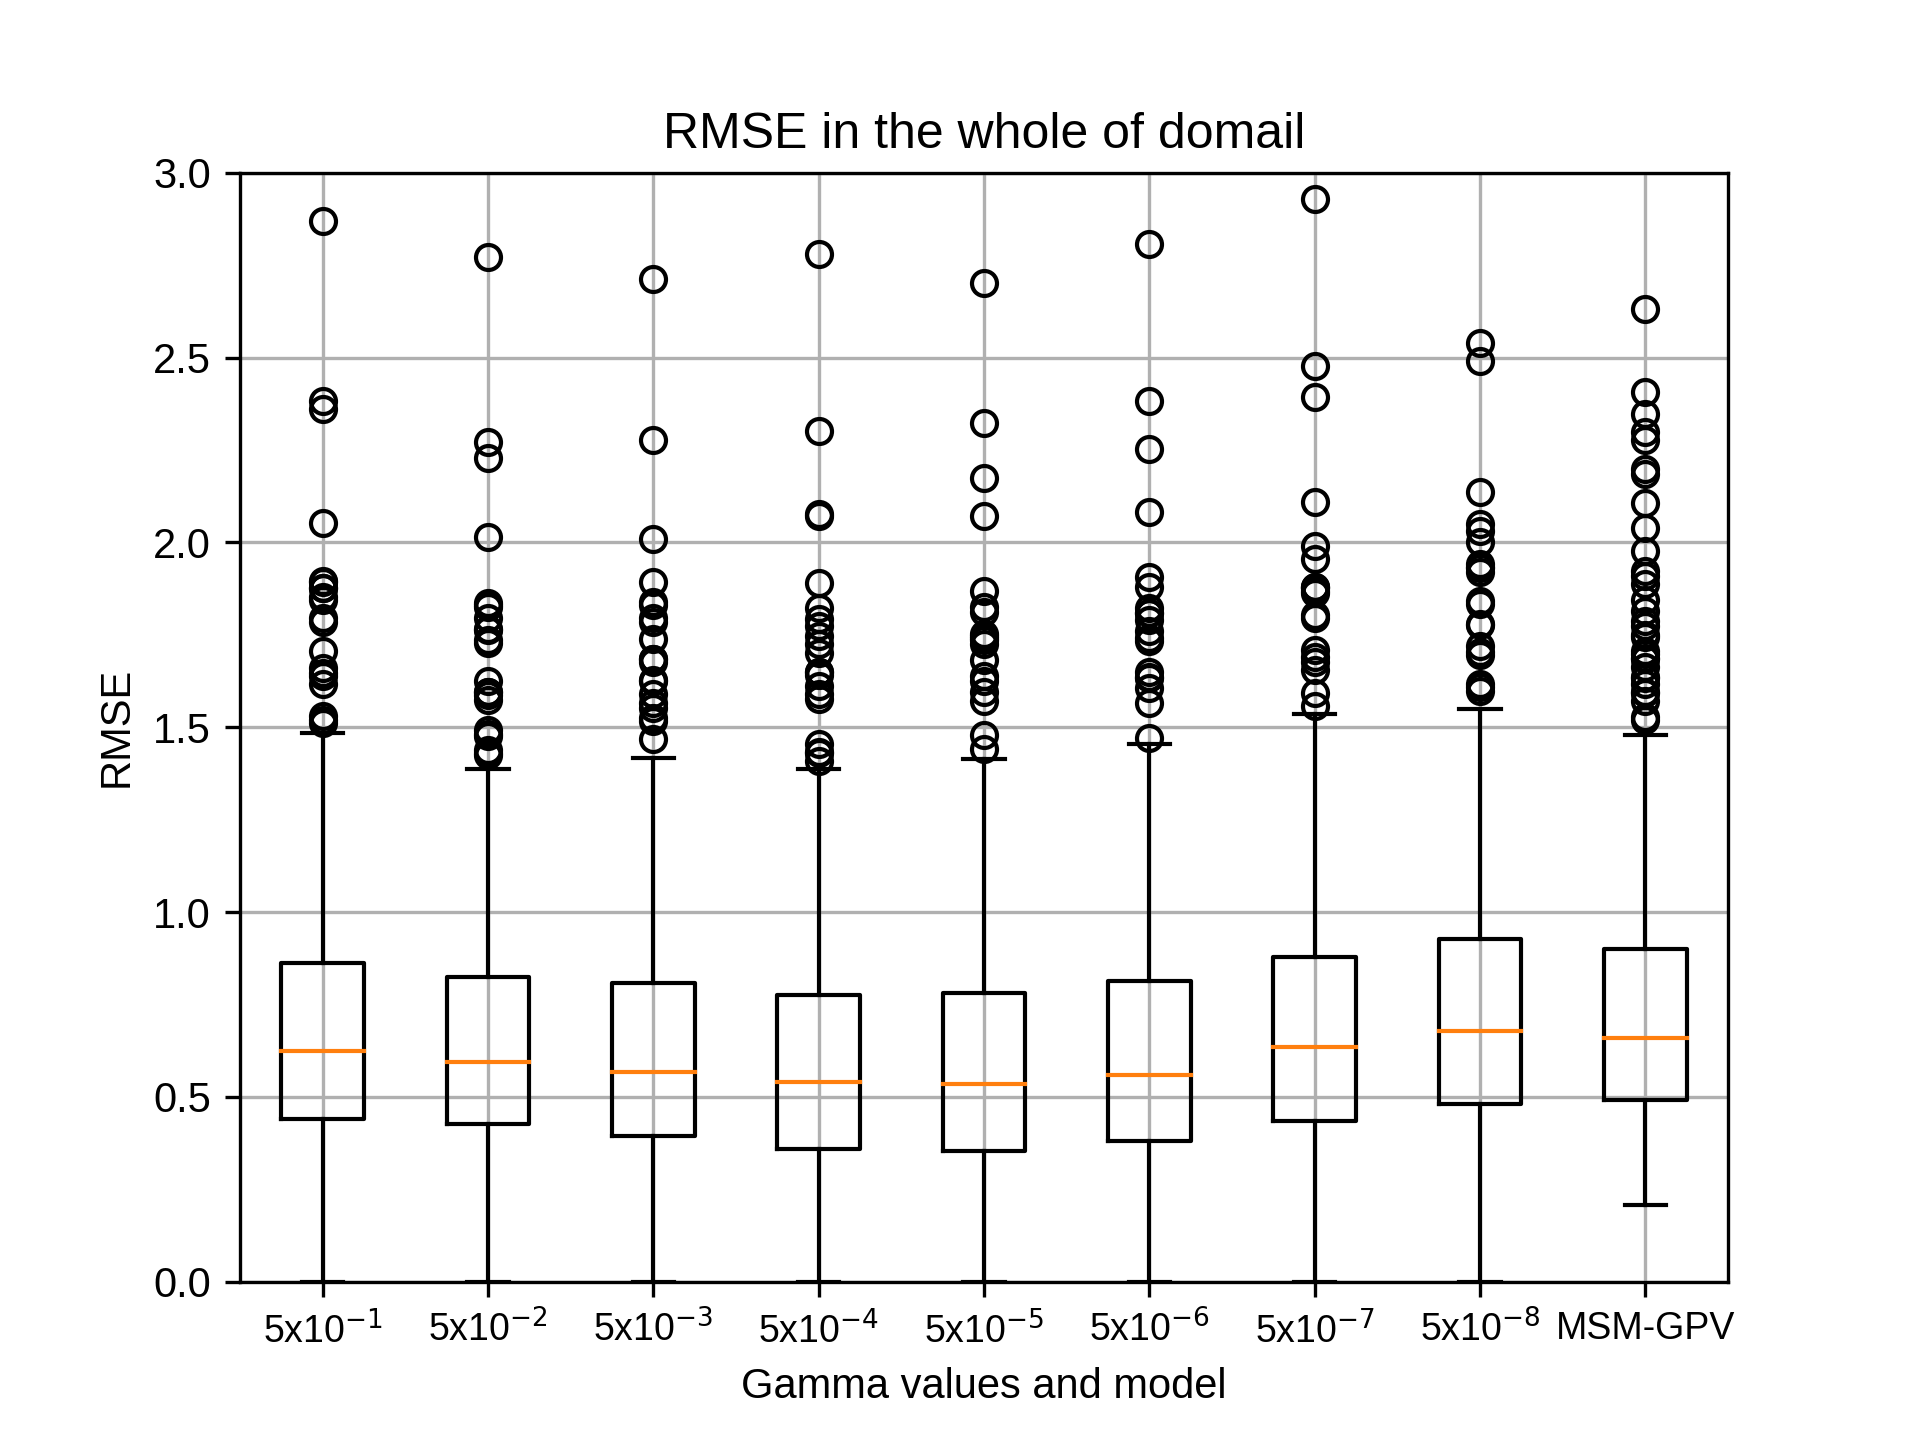
まずは10月のsiteA,rg2=4の結果です。
kobayashi_yusukeMonday, November 16th, 2020 at 5:22:59 PM GMT+09:00
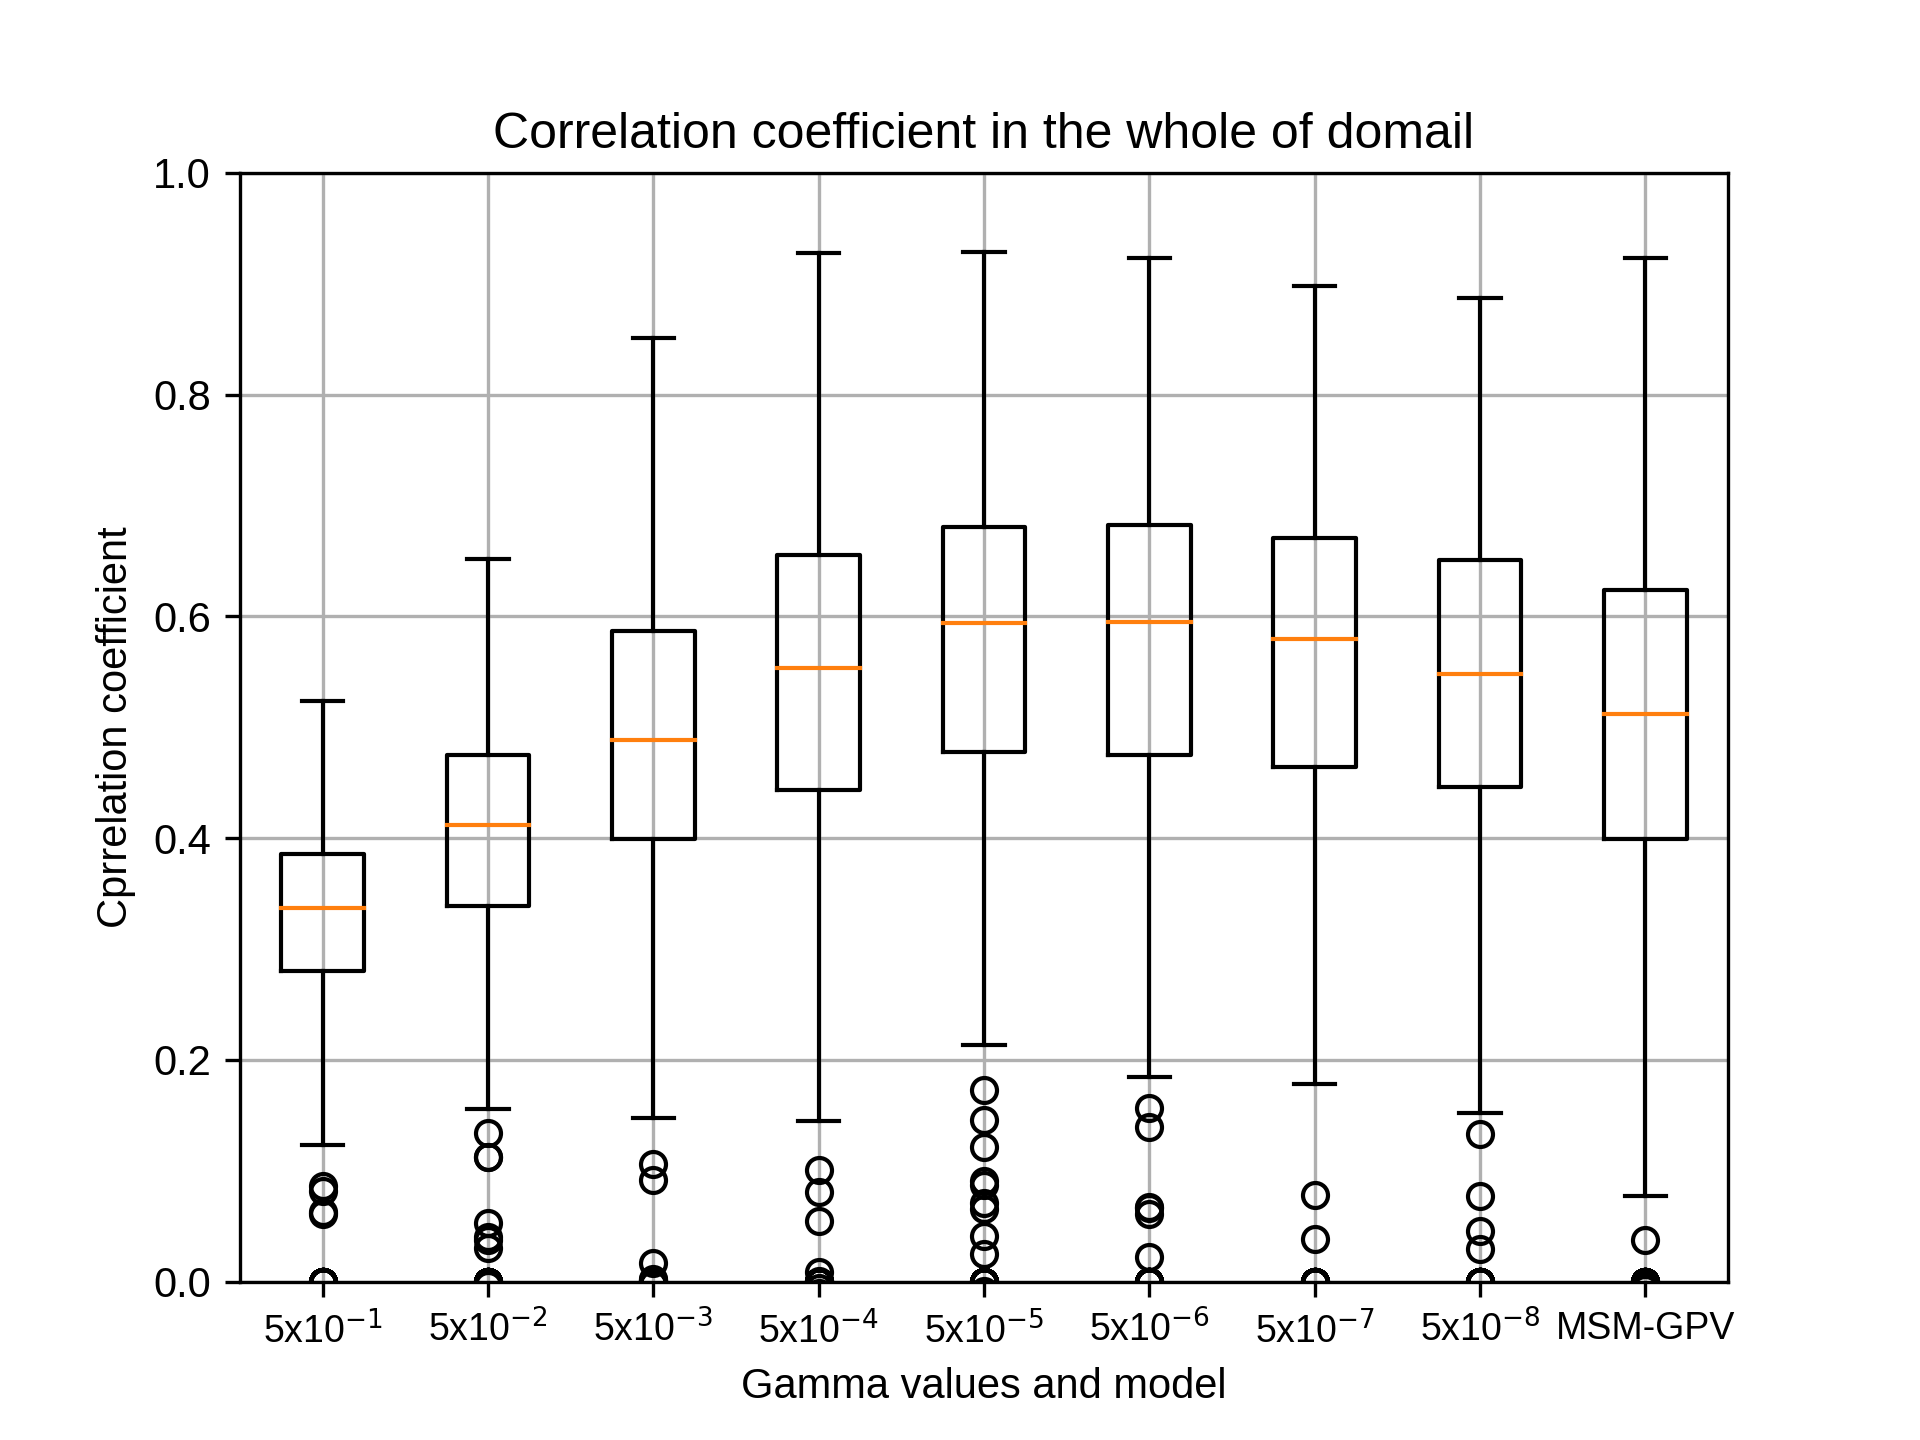
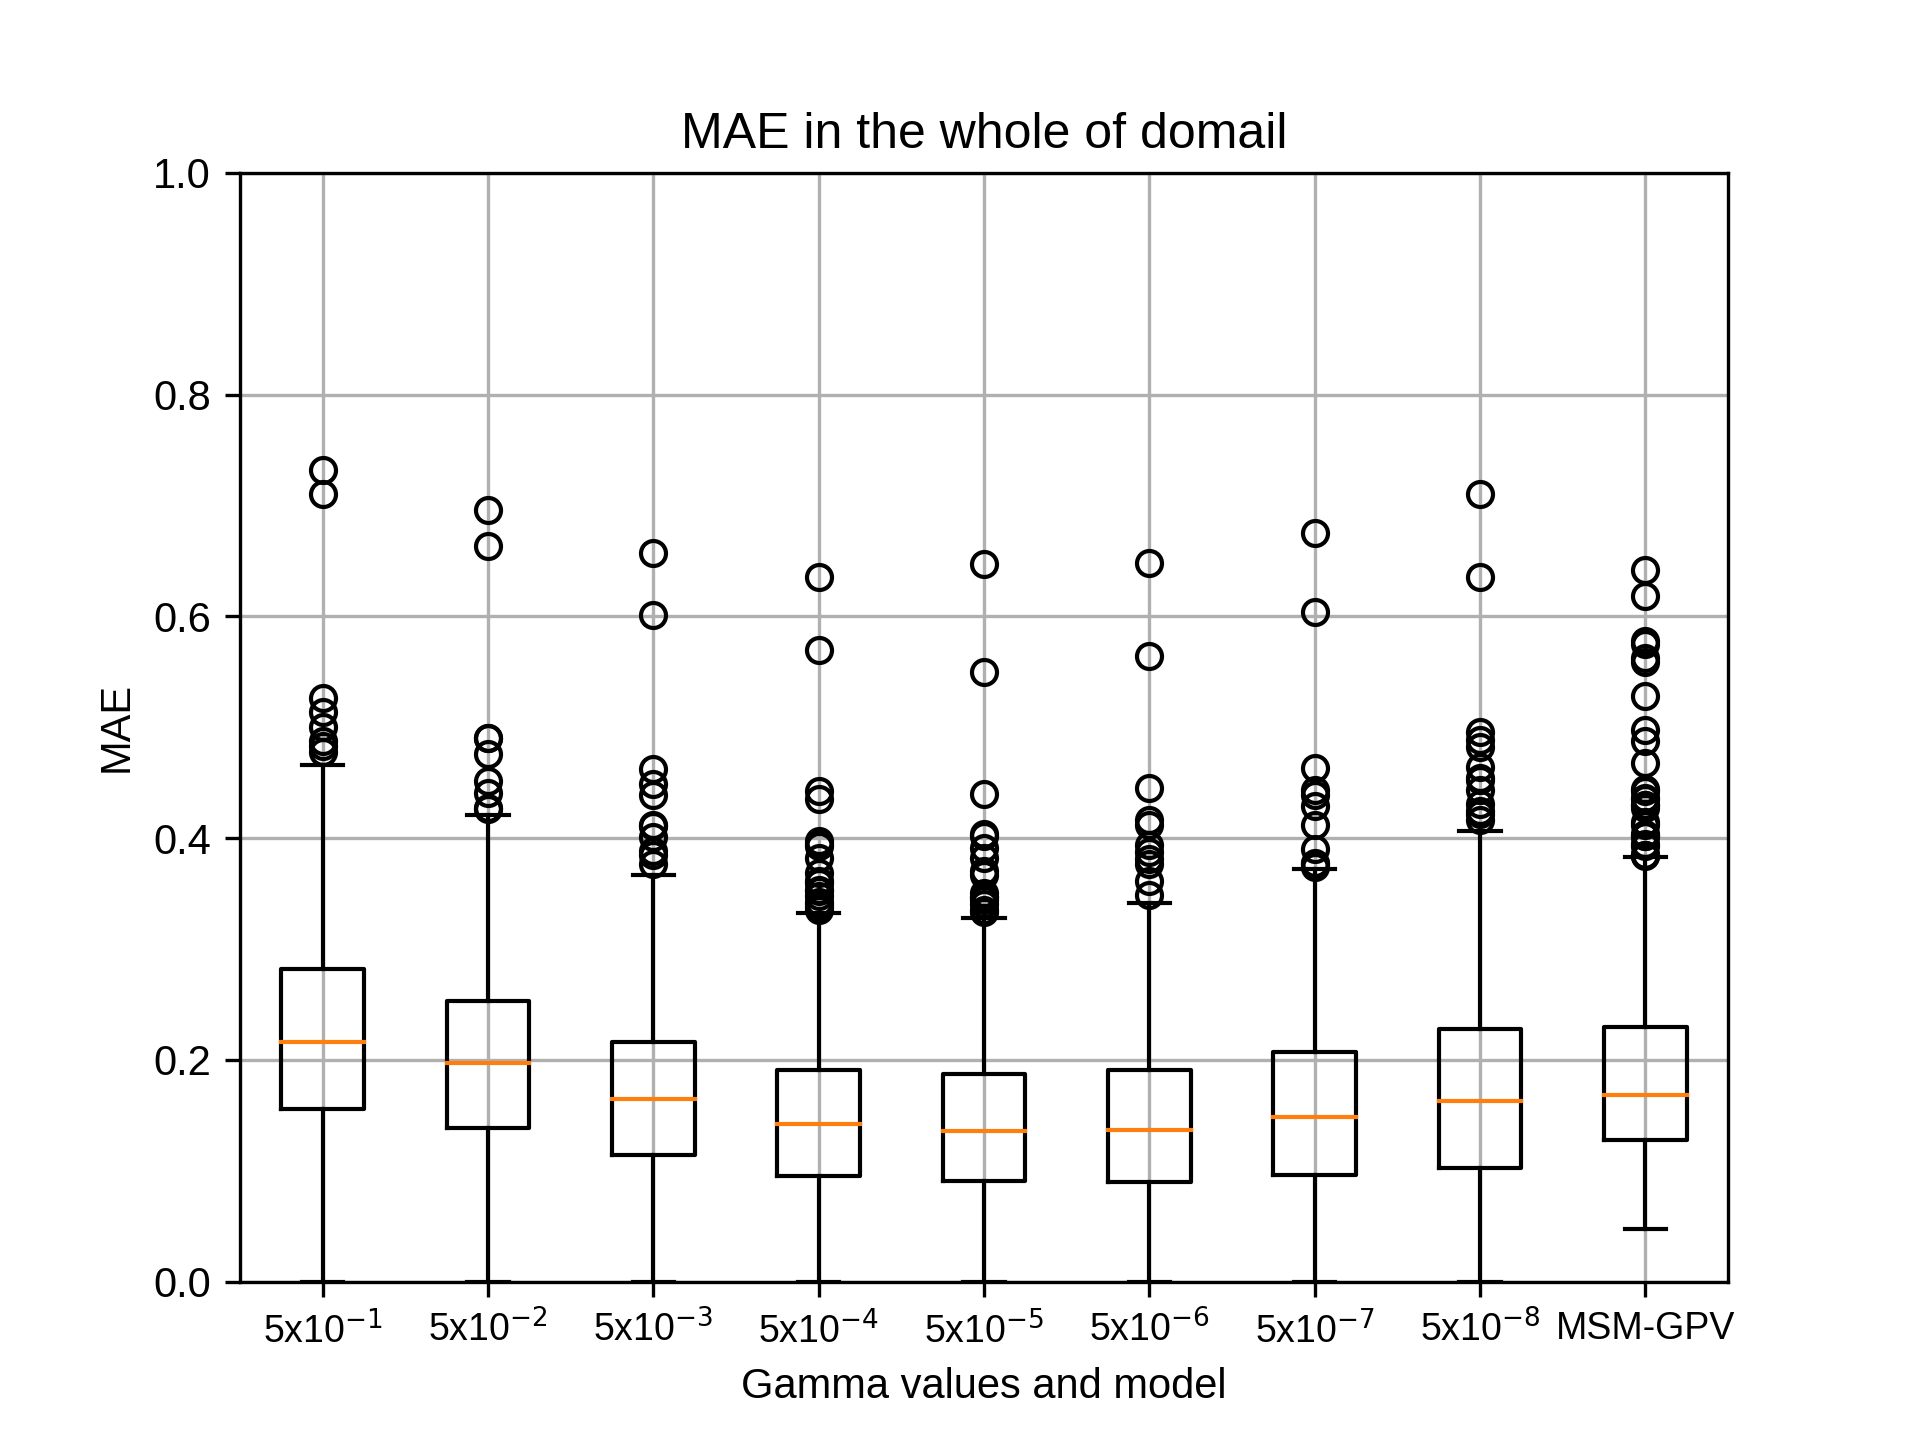
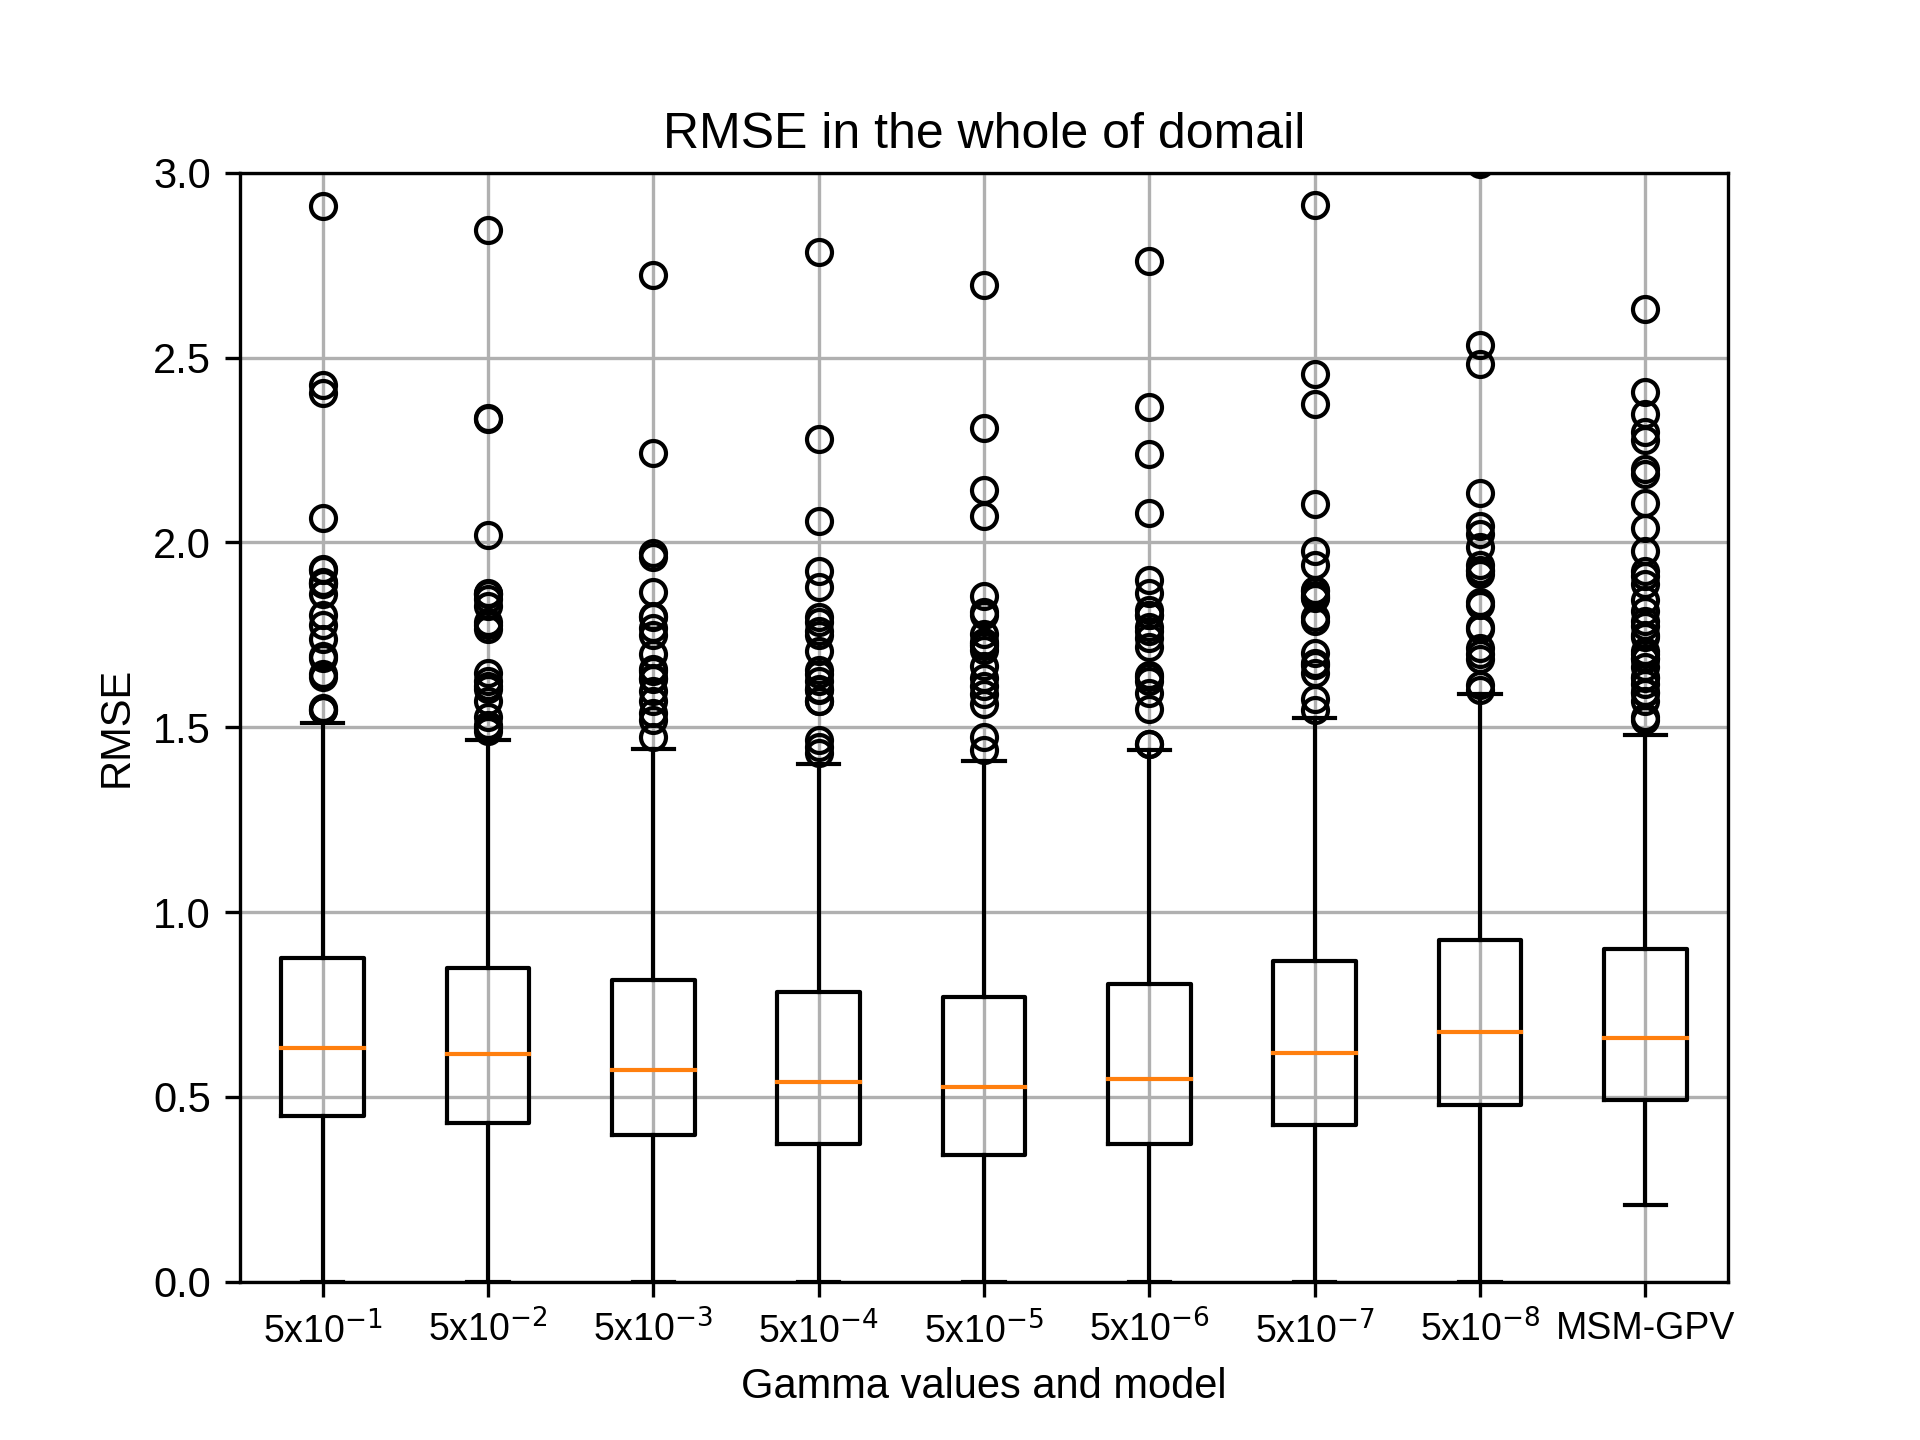
10月のsiteA,rg2=6の結果です。
kobayashi_yusukeMonday, November 16th, 2020 at 5:23:22 PM GMT+09:00
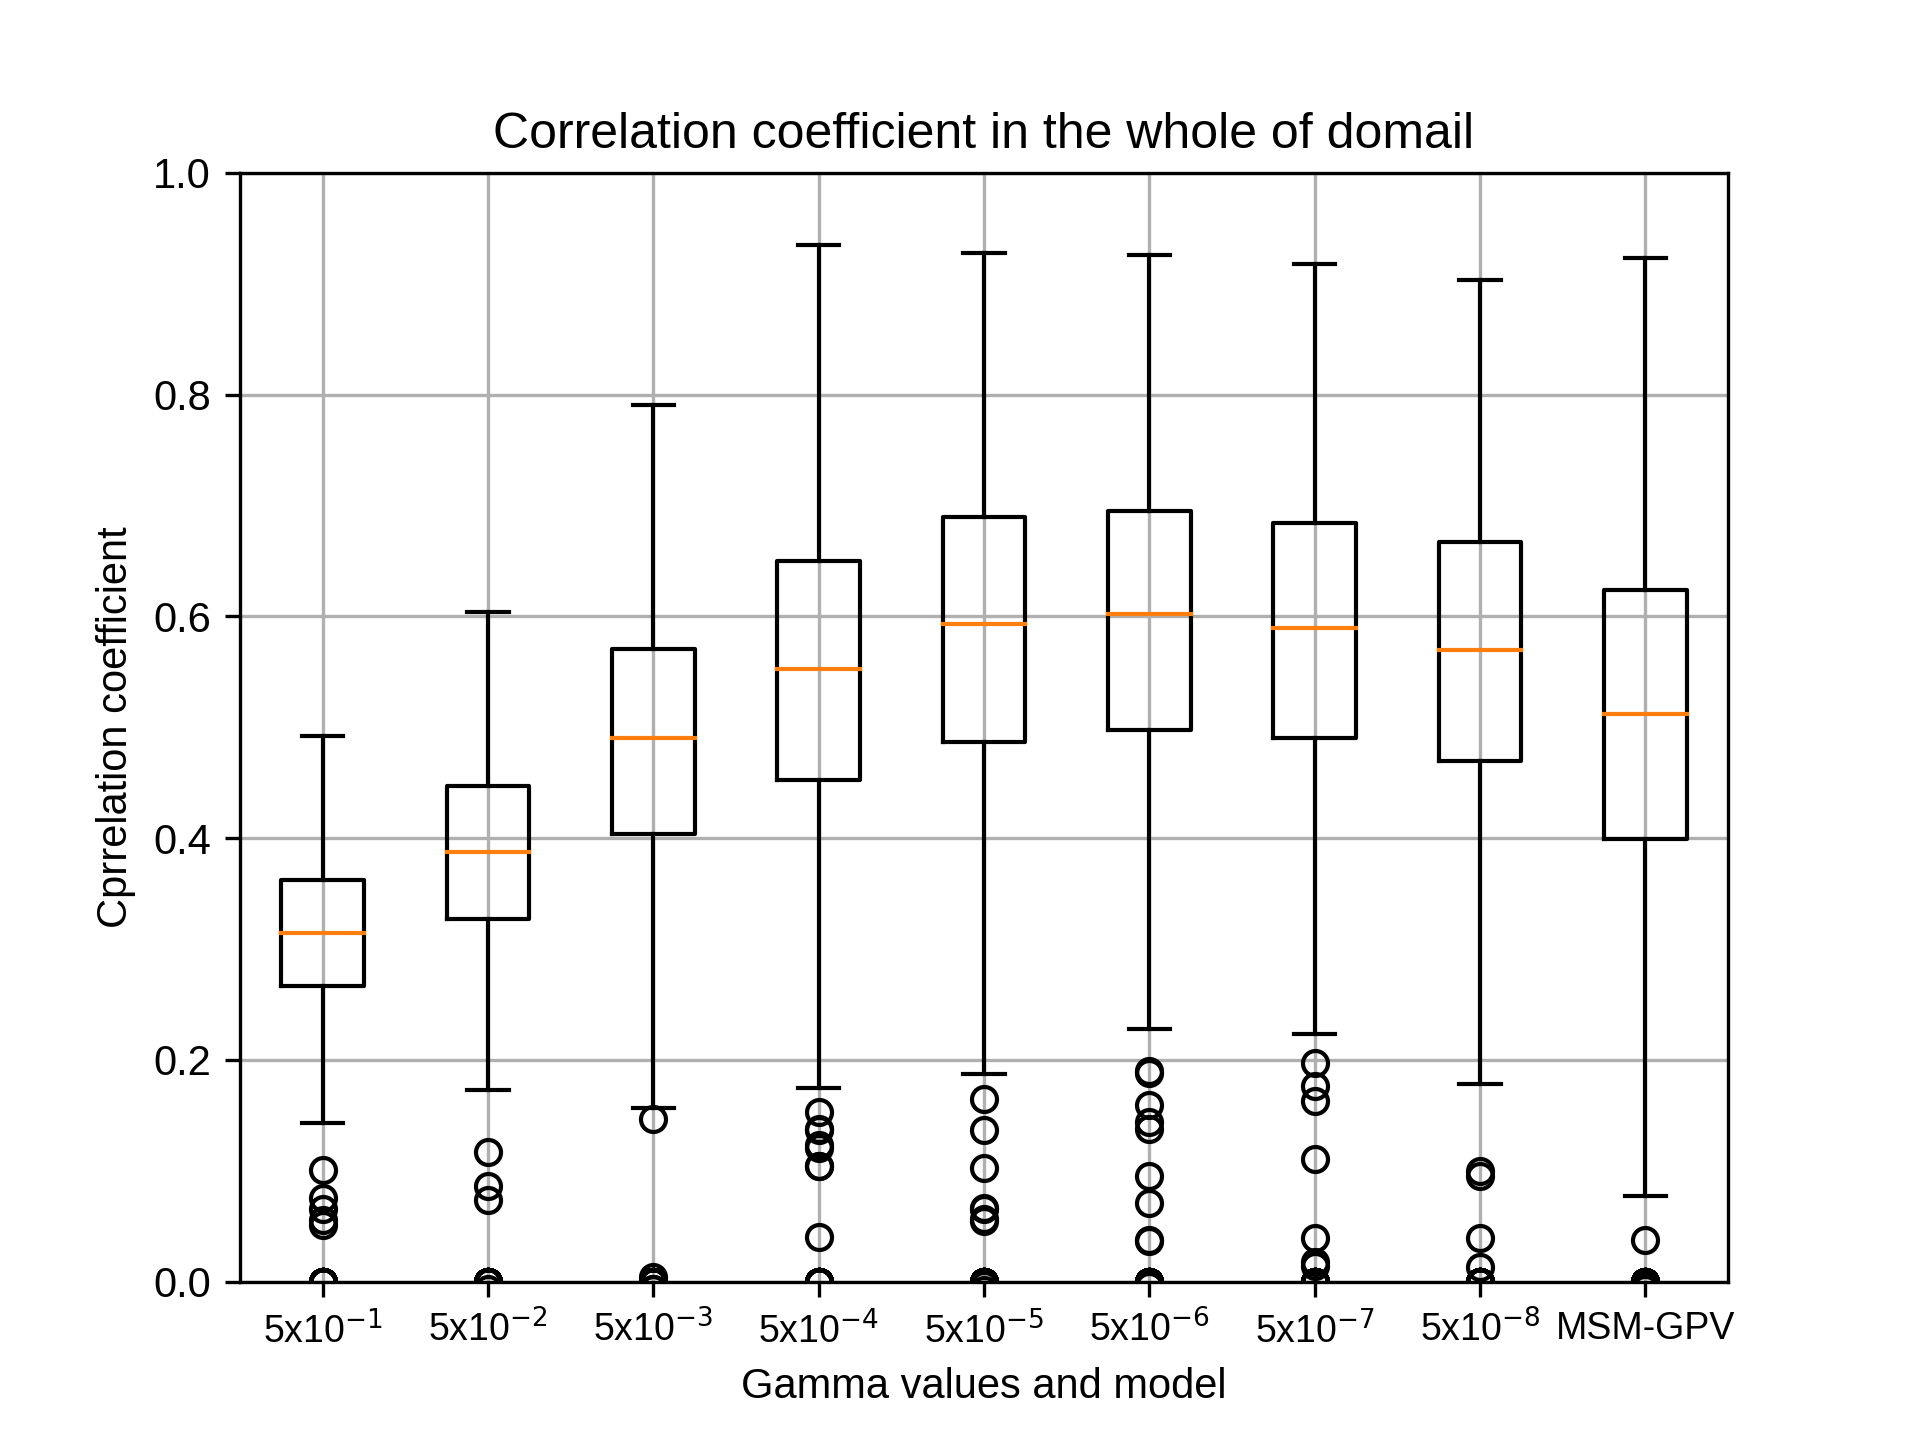
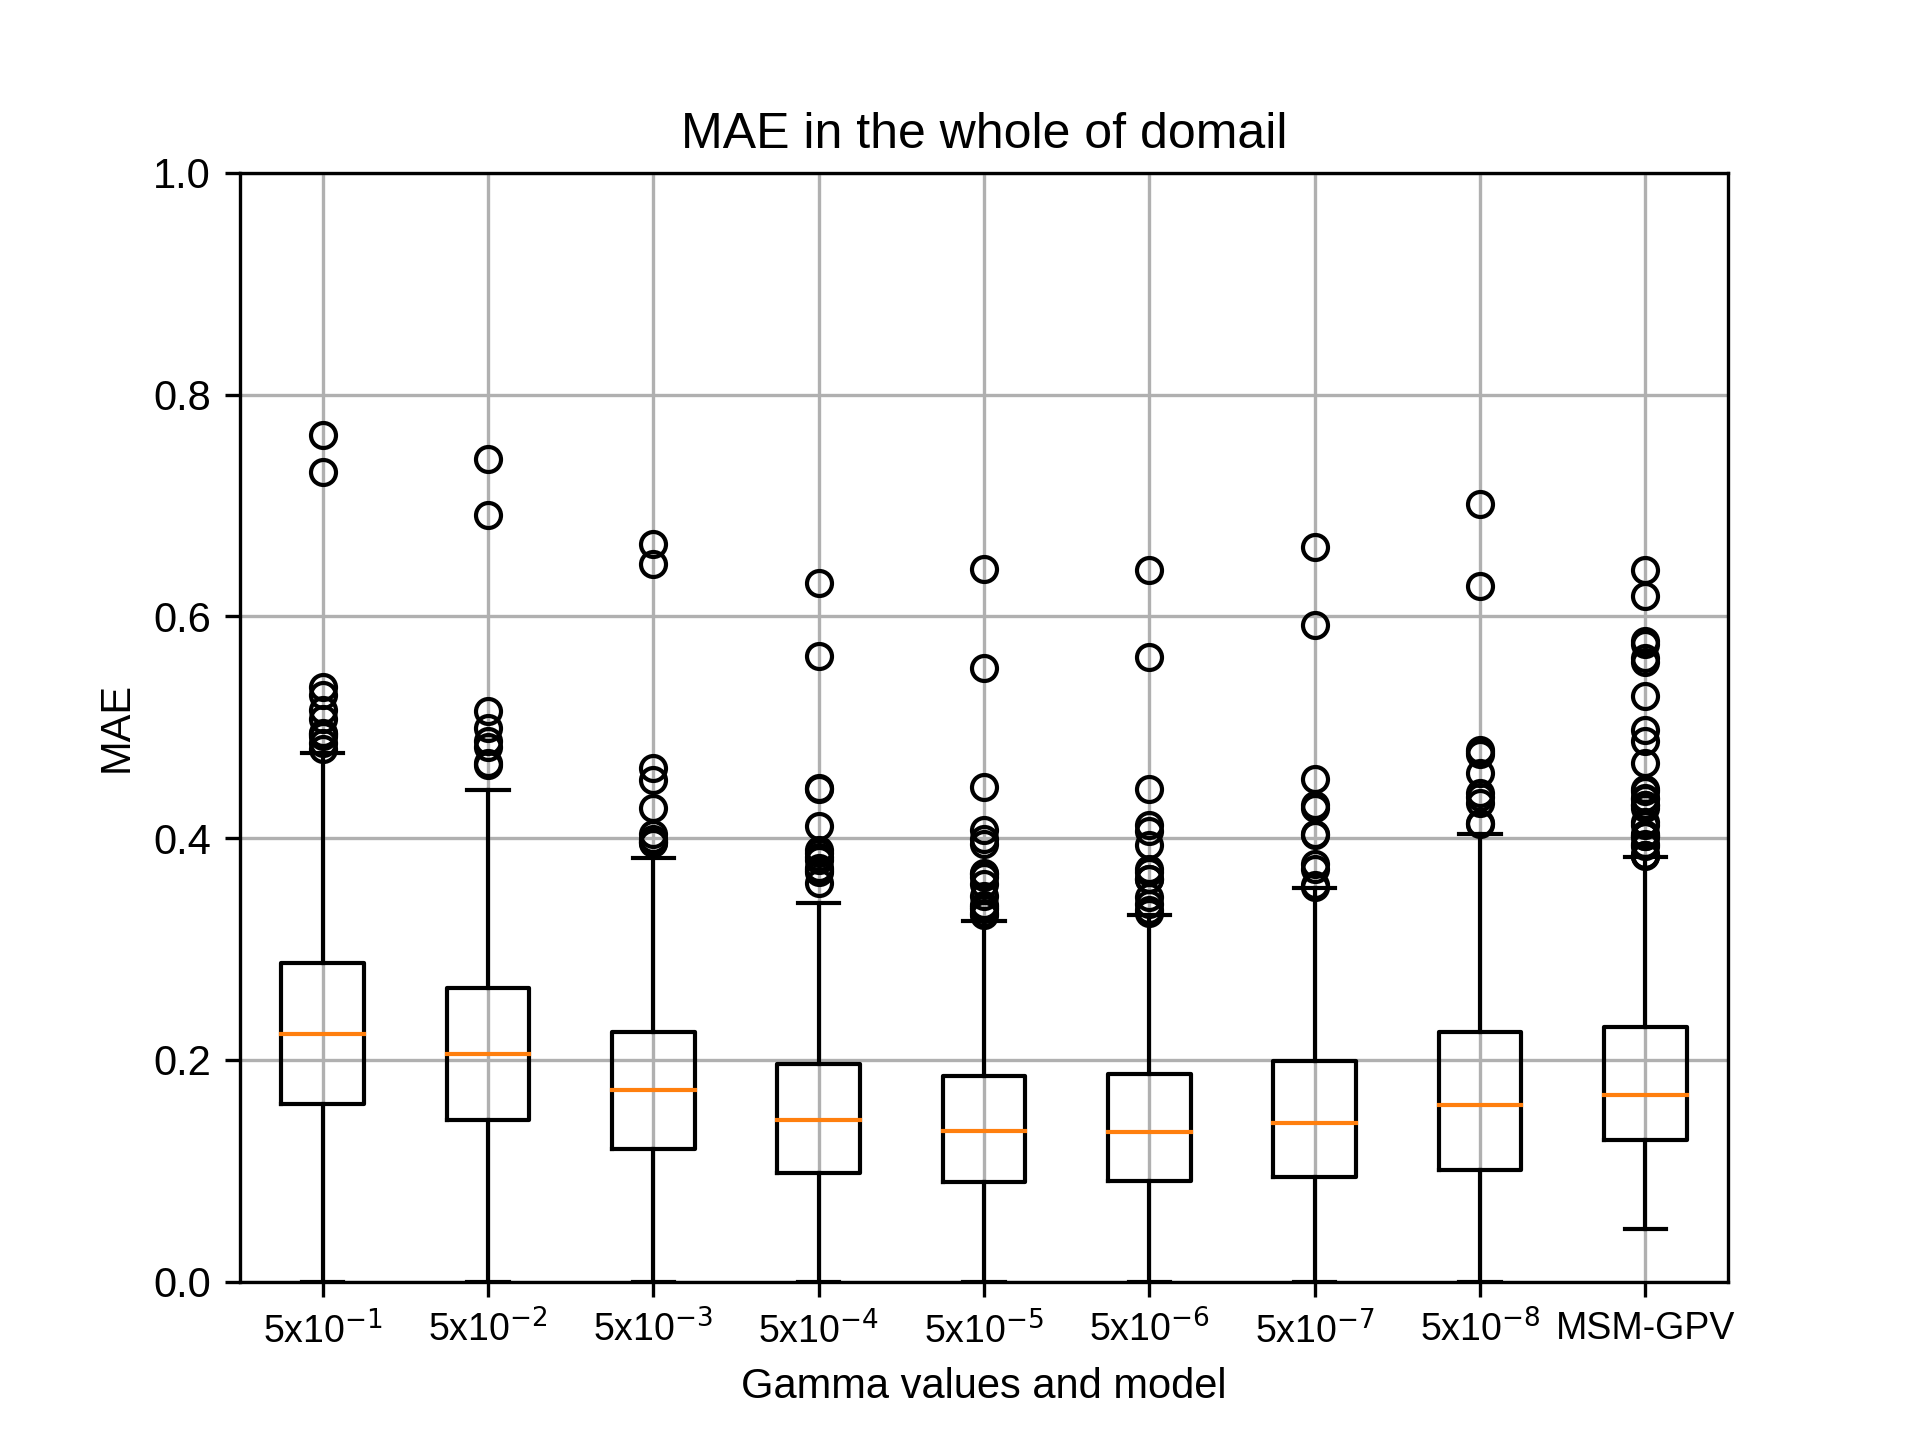

10月のsiteA,rg2=8の結果です。
kobayashi_yusukeMonday, November 16th, 2020 at 5:23:38 PM GMT+09:00
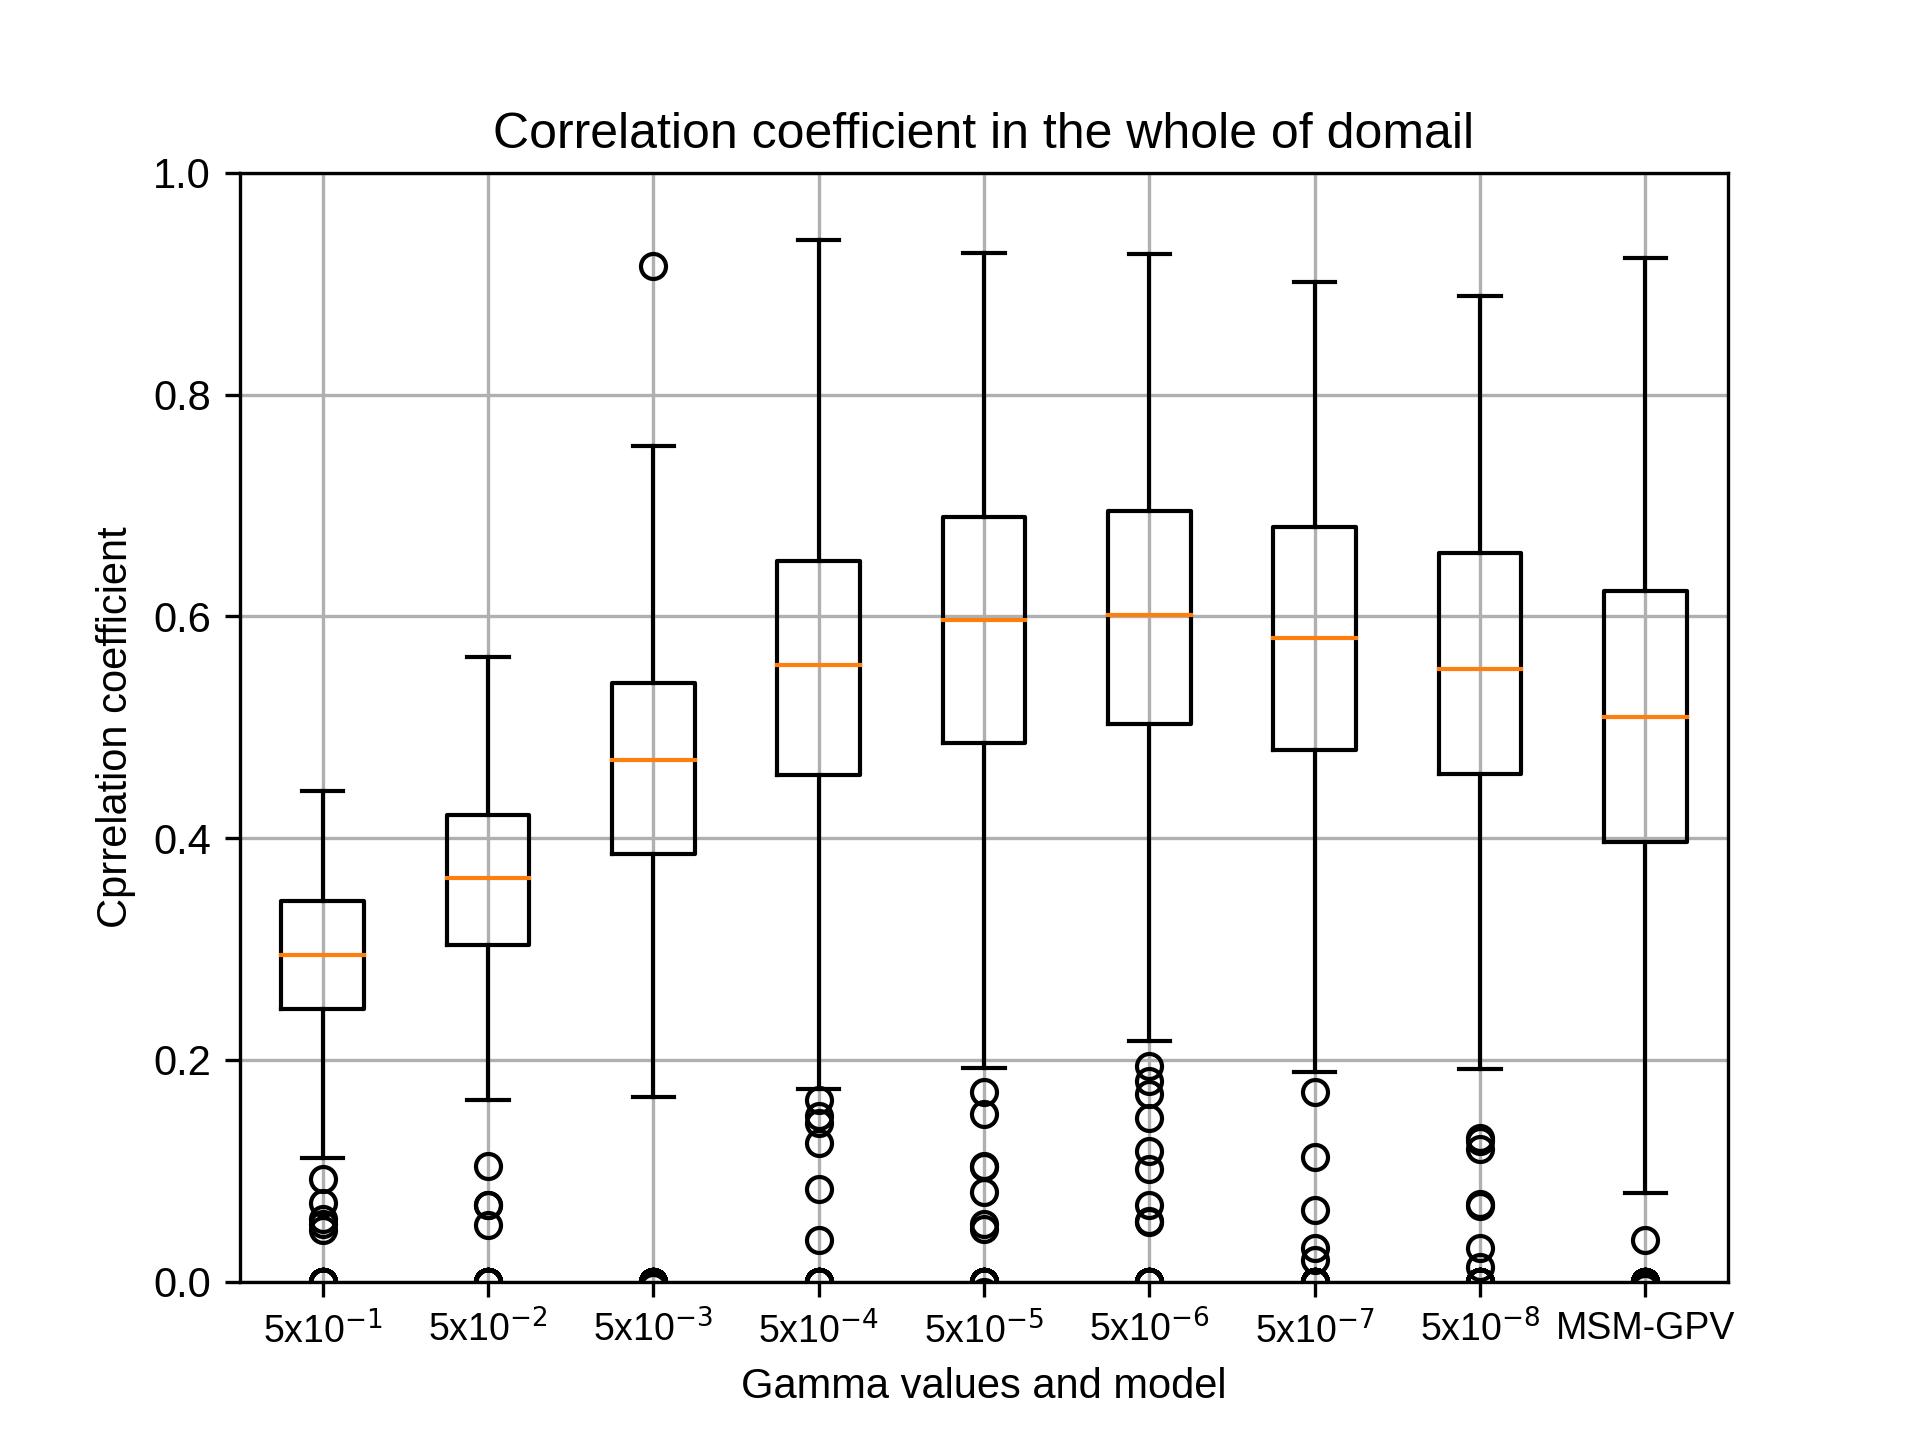
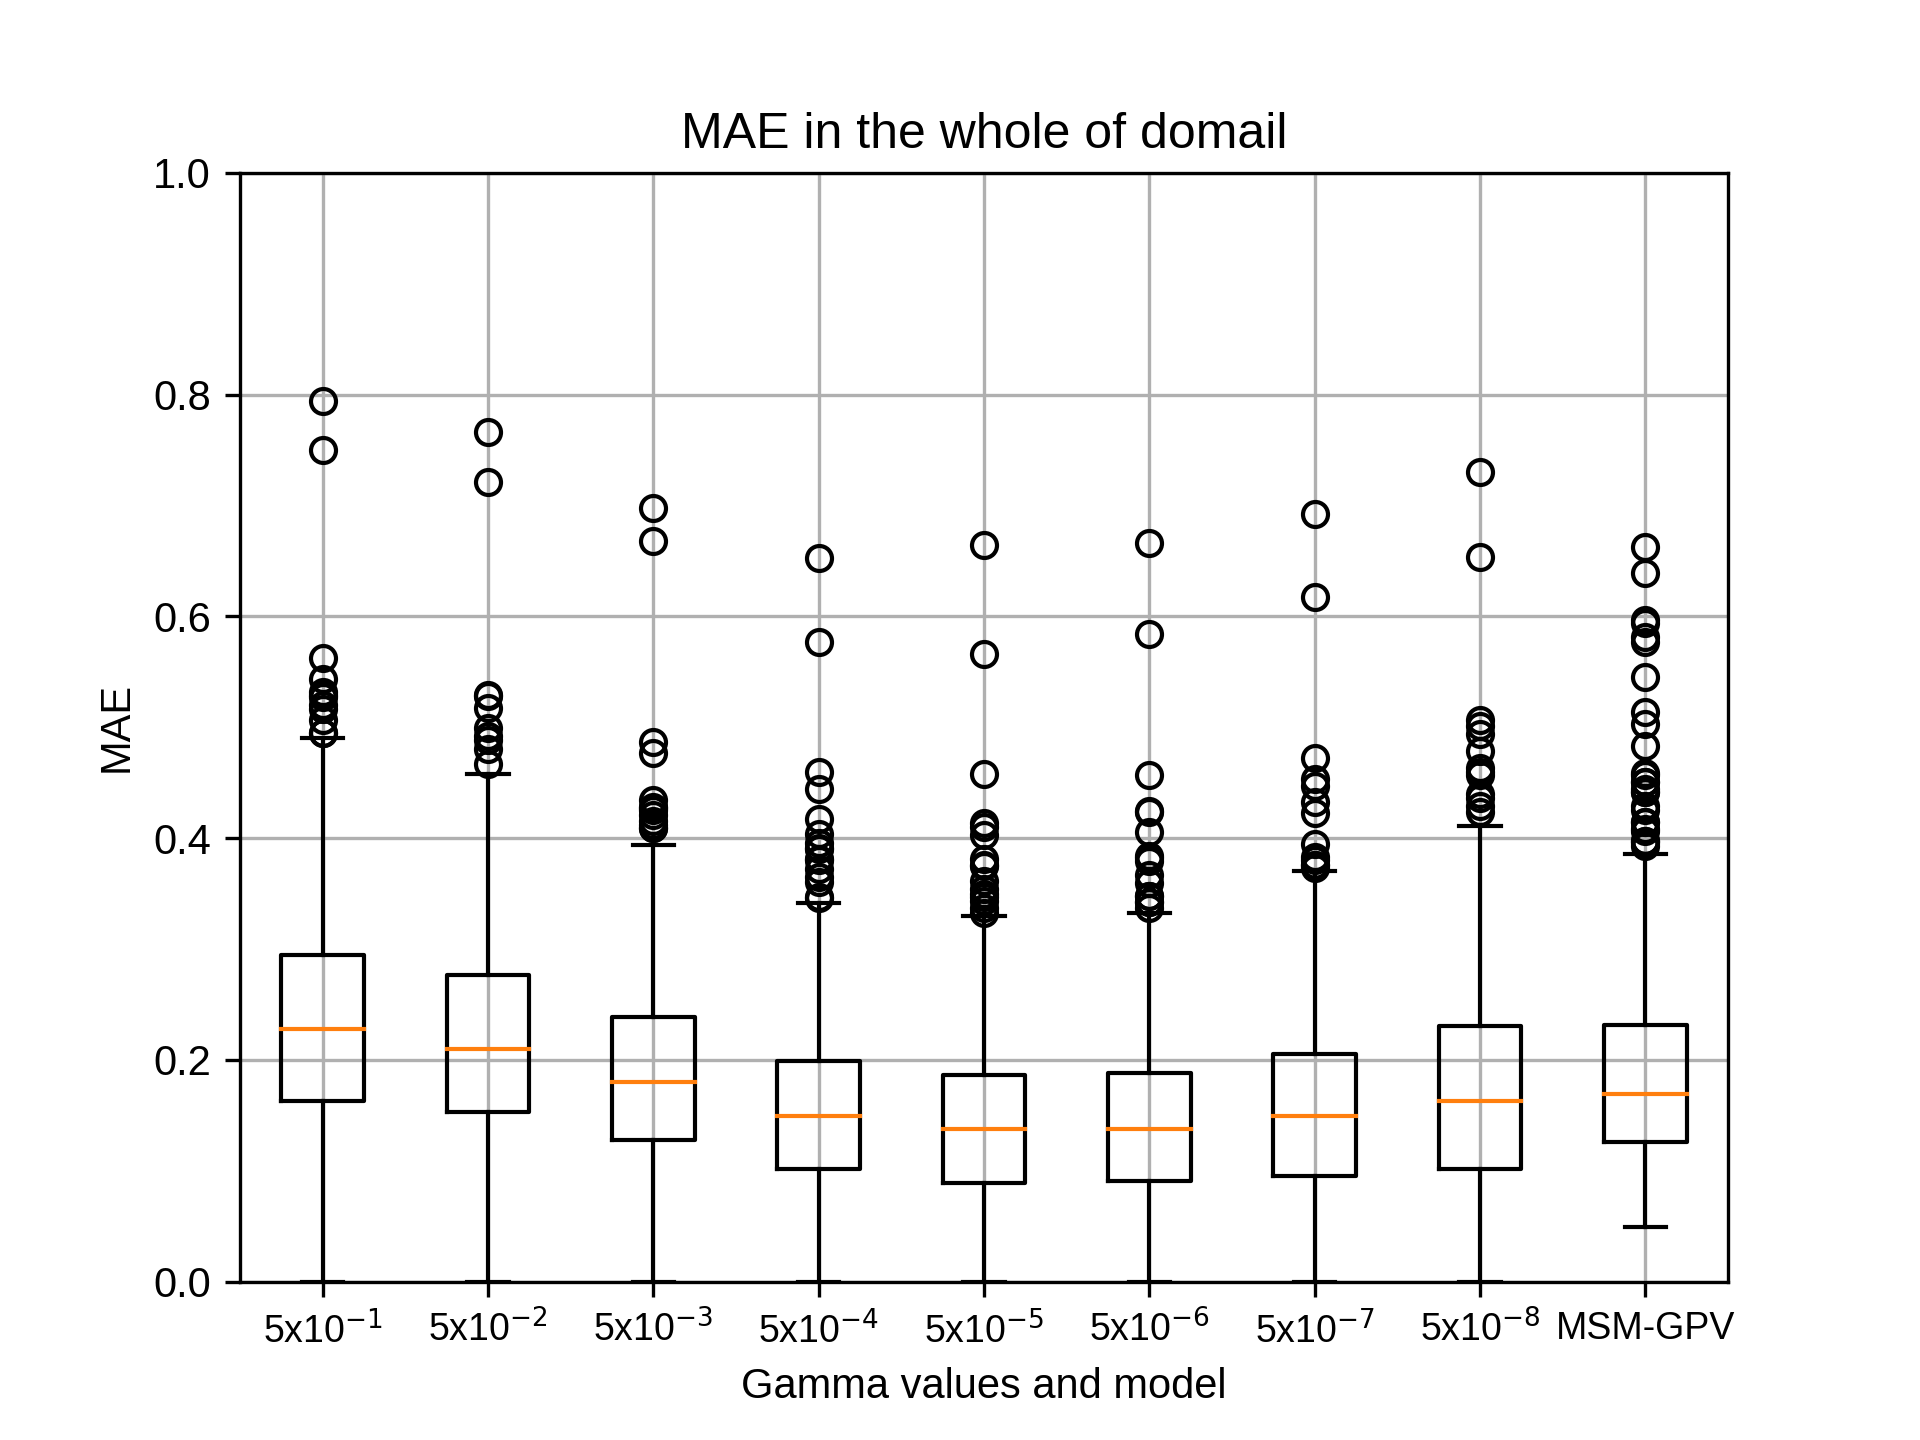

10月のsiteA,rg2=10の結果です。
kobayashi_yusukeMonday, November 16th, 2020 at 5:24:02 PM GMT+09:00
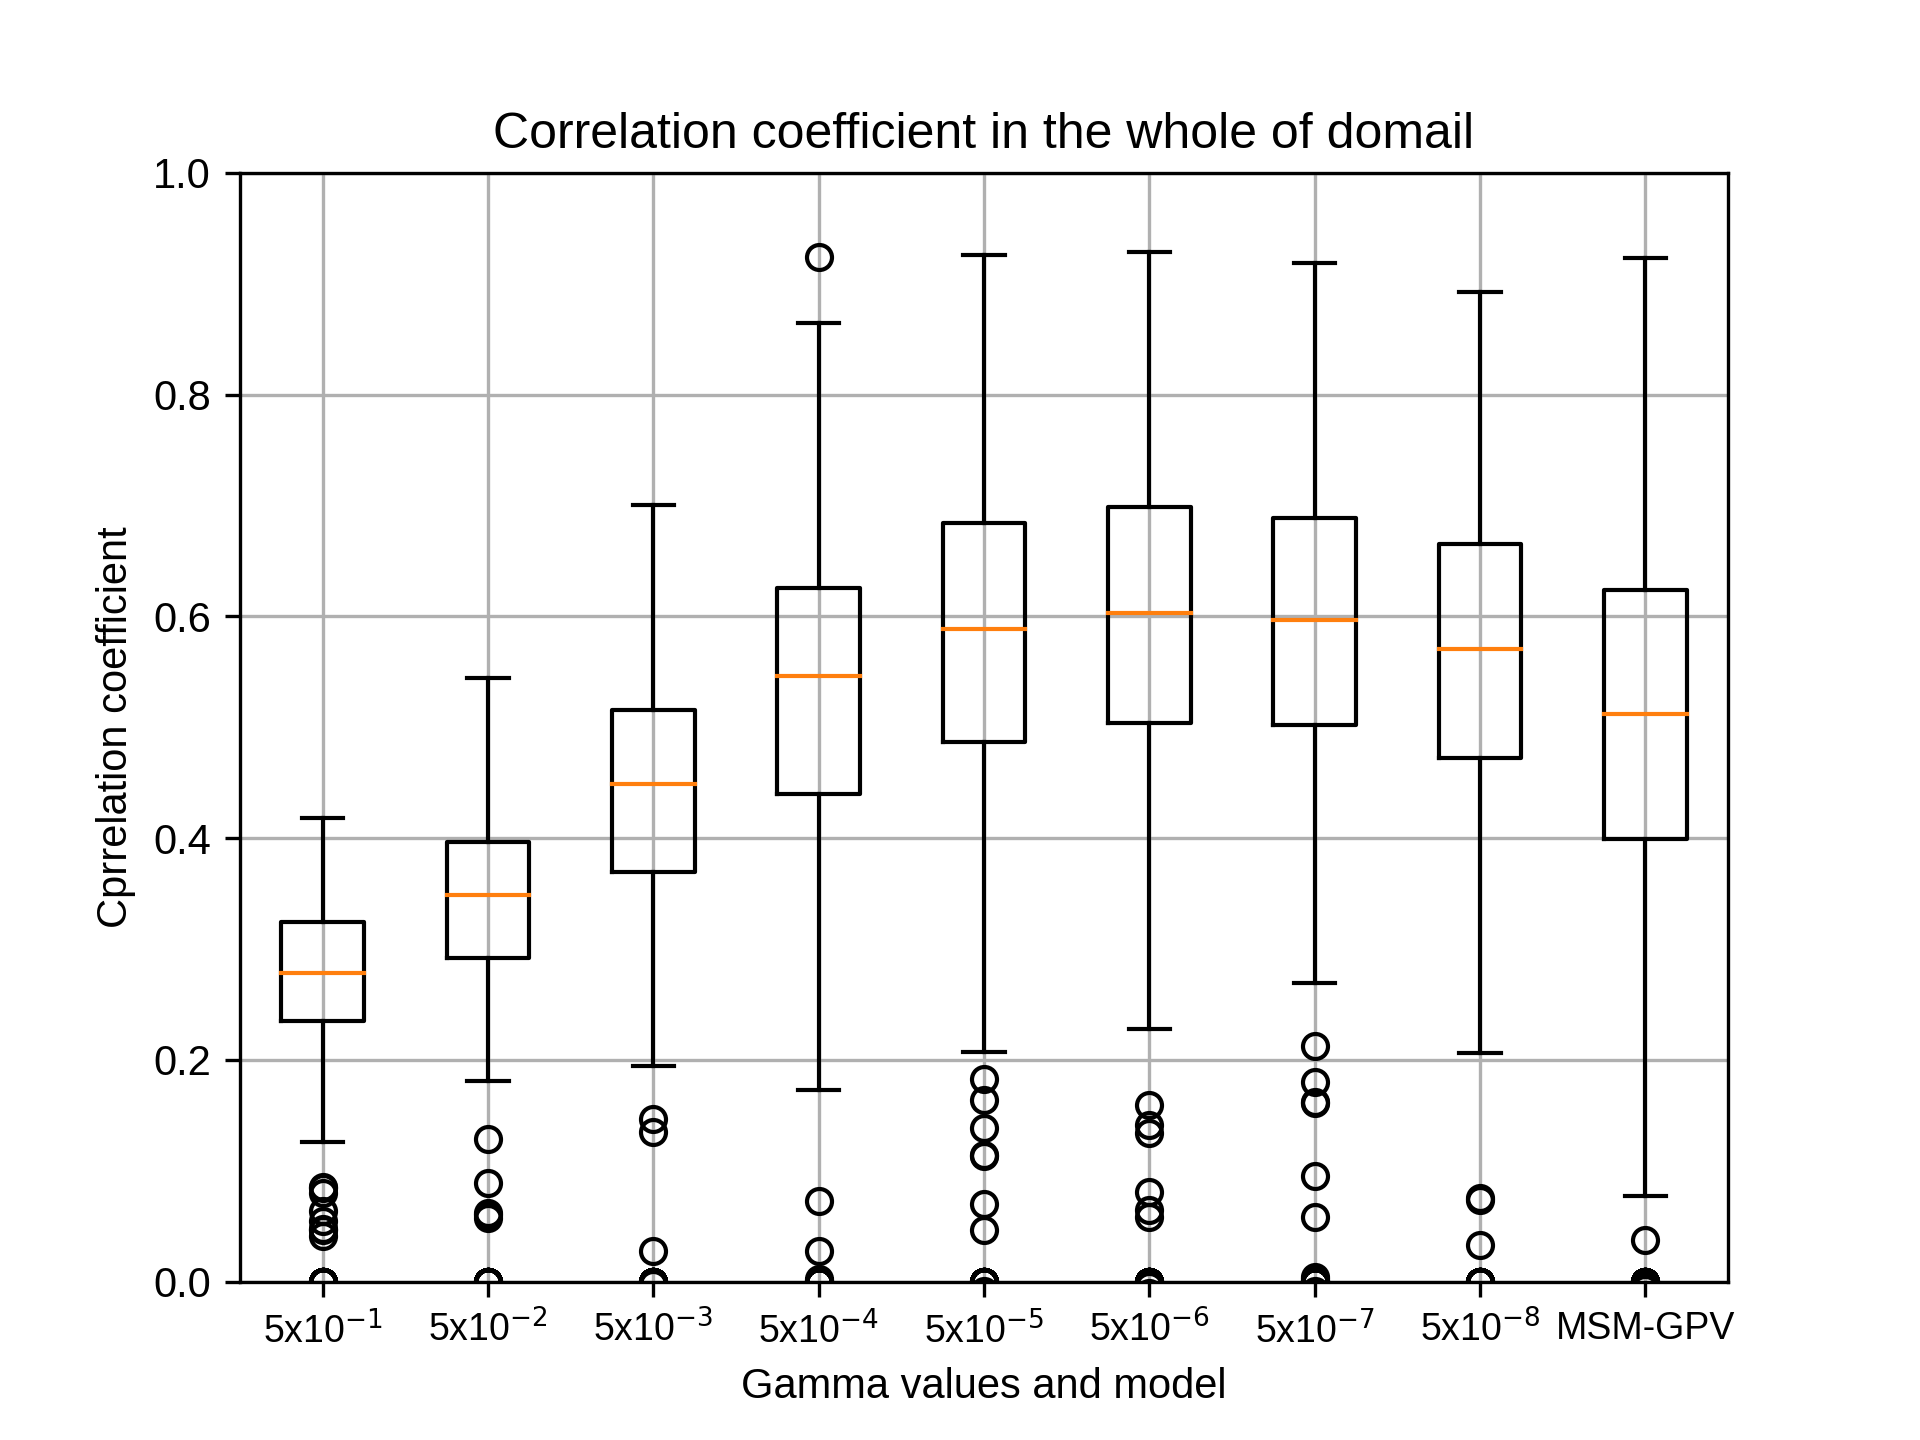
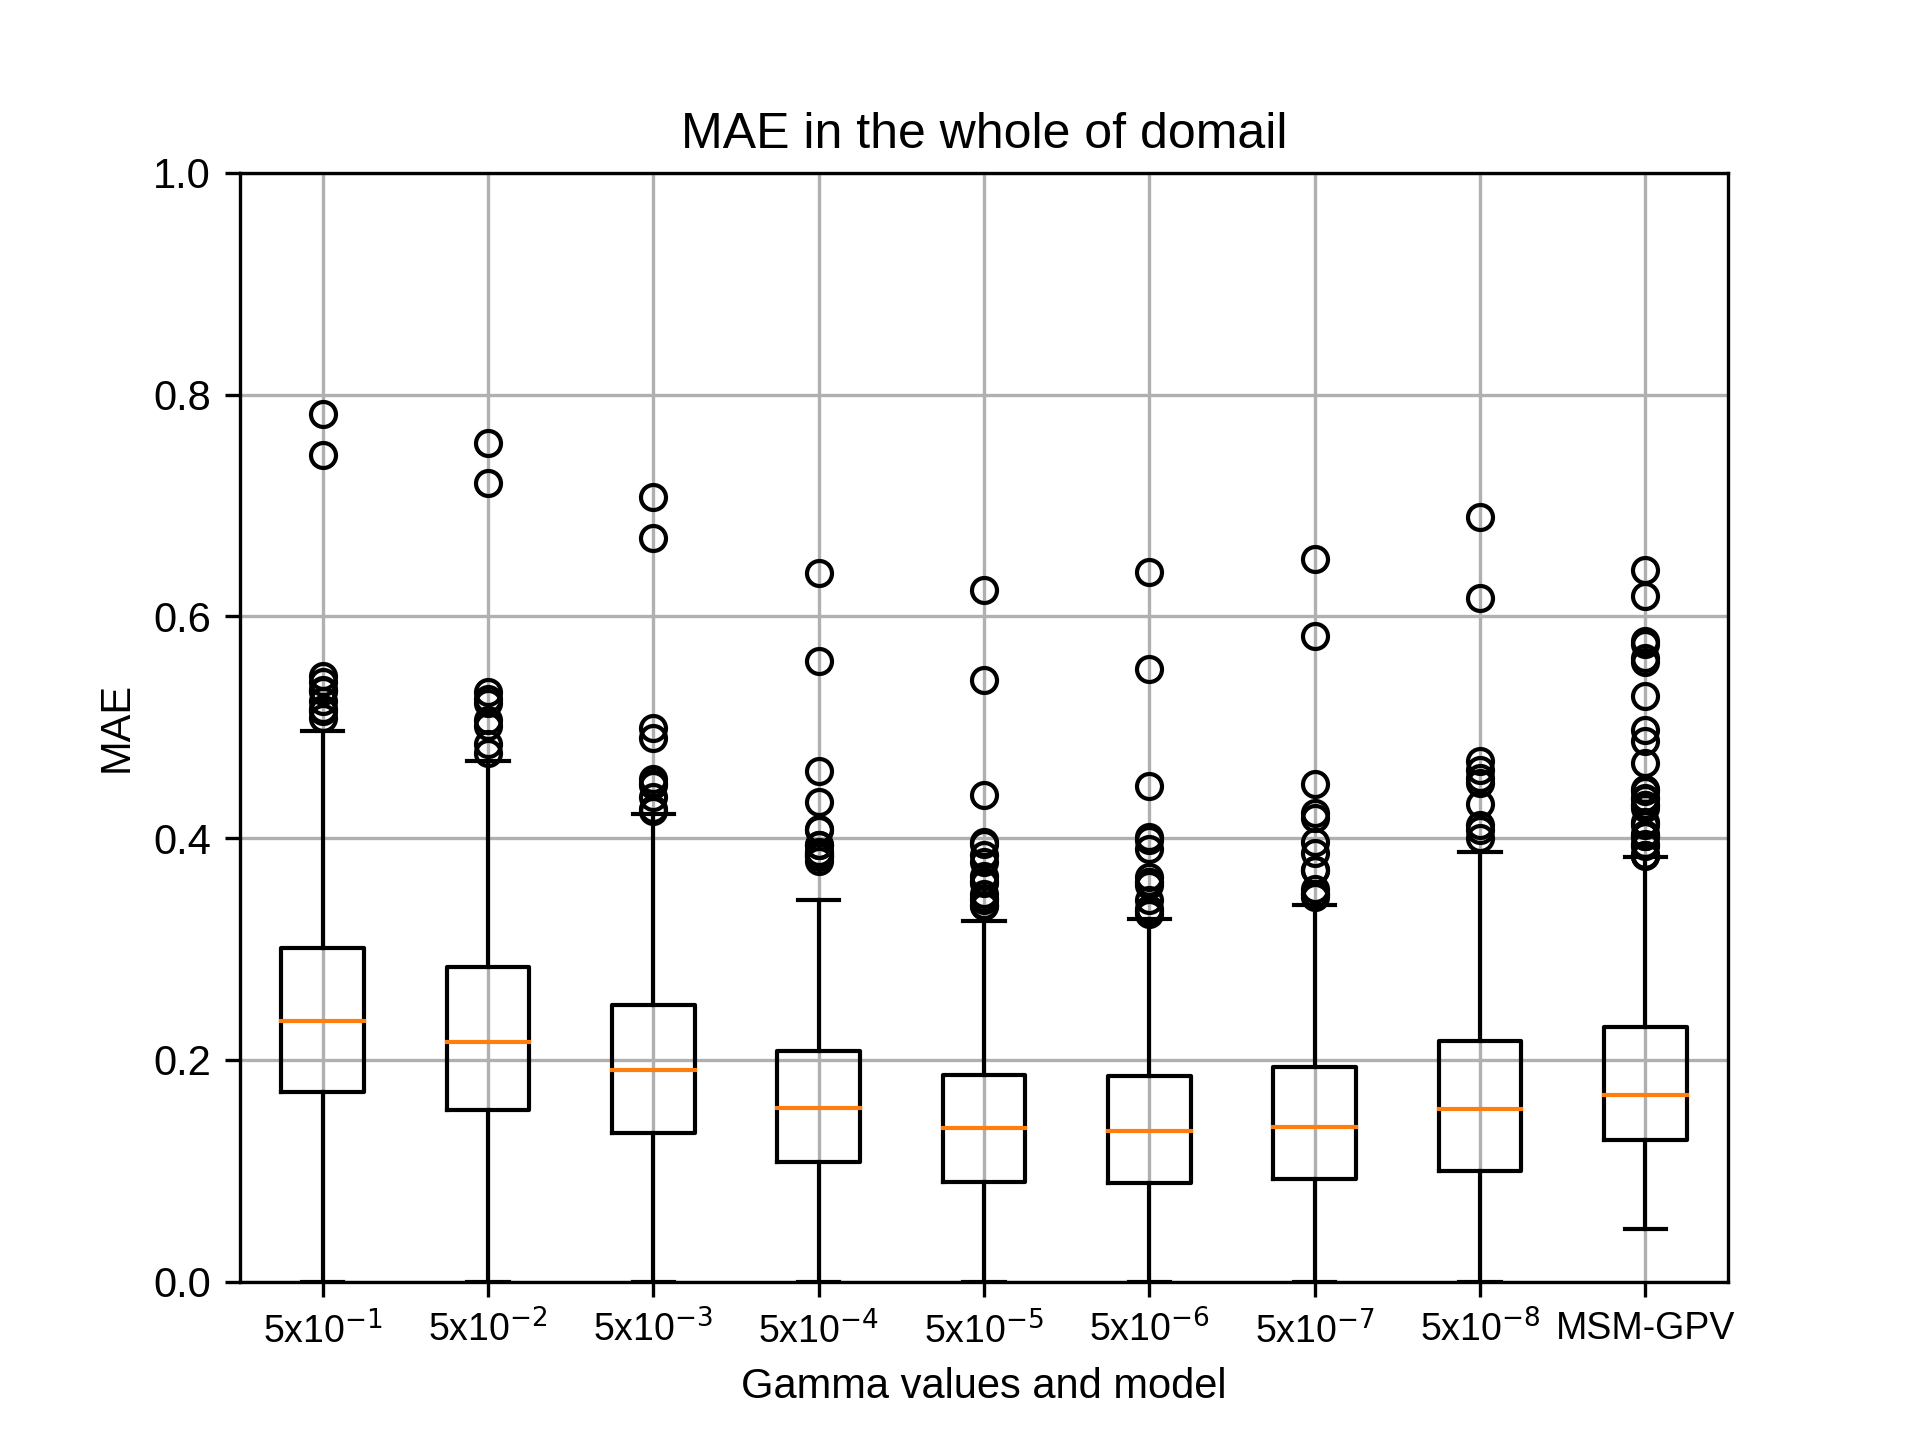
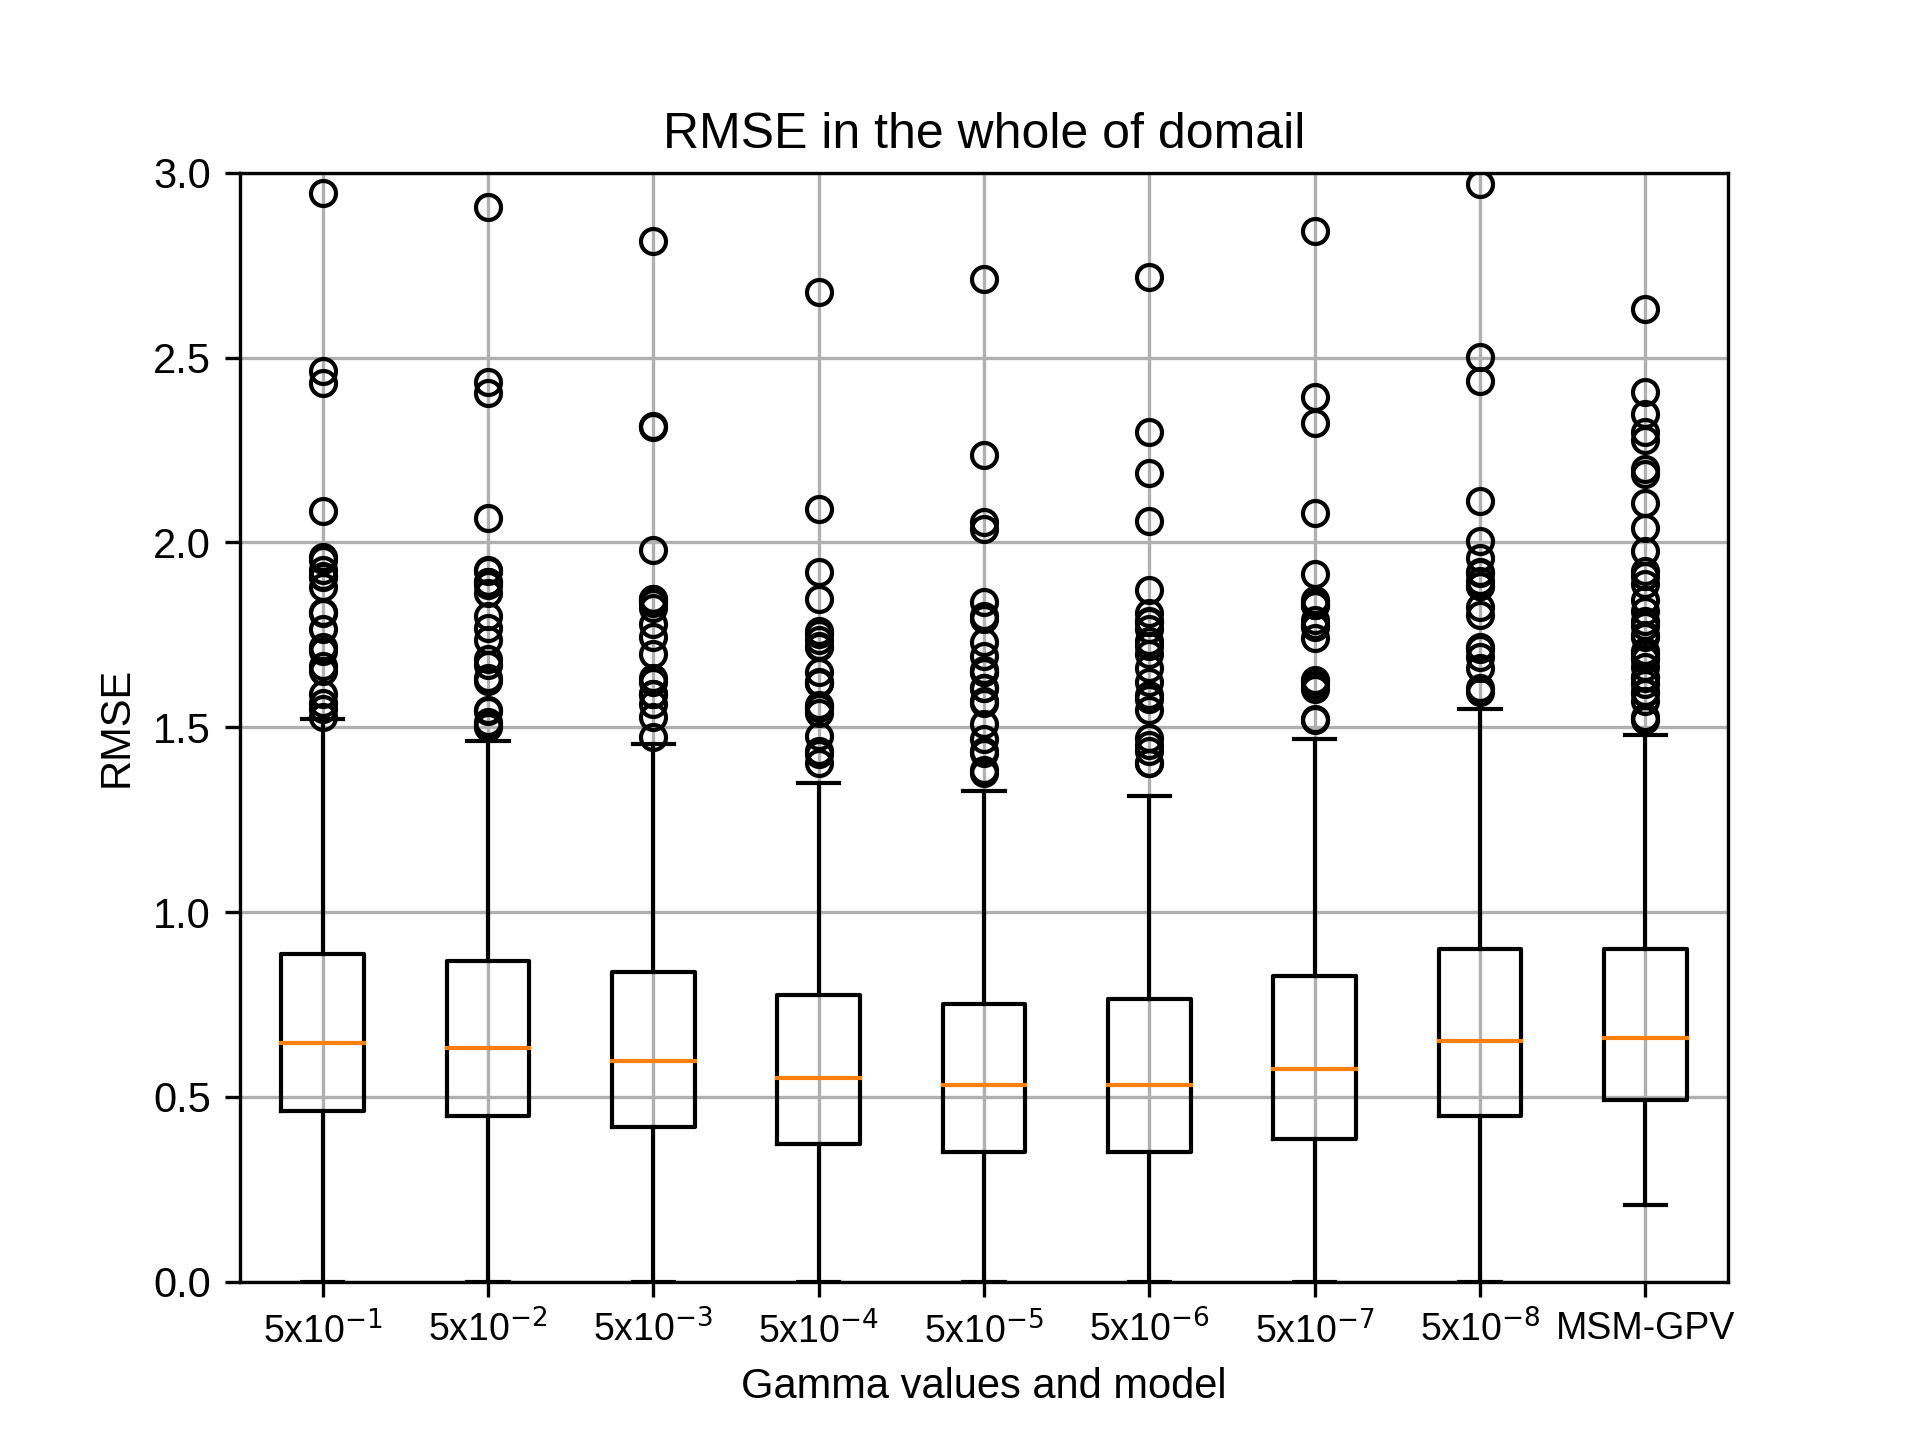
10月のsiteA,rg2=12の結果です。
10月のsiteAではrg2=12でgammaが5x10⁻⁶のとき、相関係数の中央値が最も高くなりました。
10月のsiteAではrg2=12でgammaが5x10⁻⁶のとき、相関係数の中央値が最も高くなりました。
kobayashi_yusukeMonday, November 16th, 2020 at 5:24:25 PM GMT+09:00
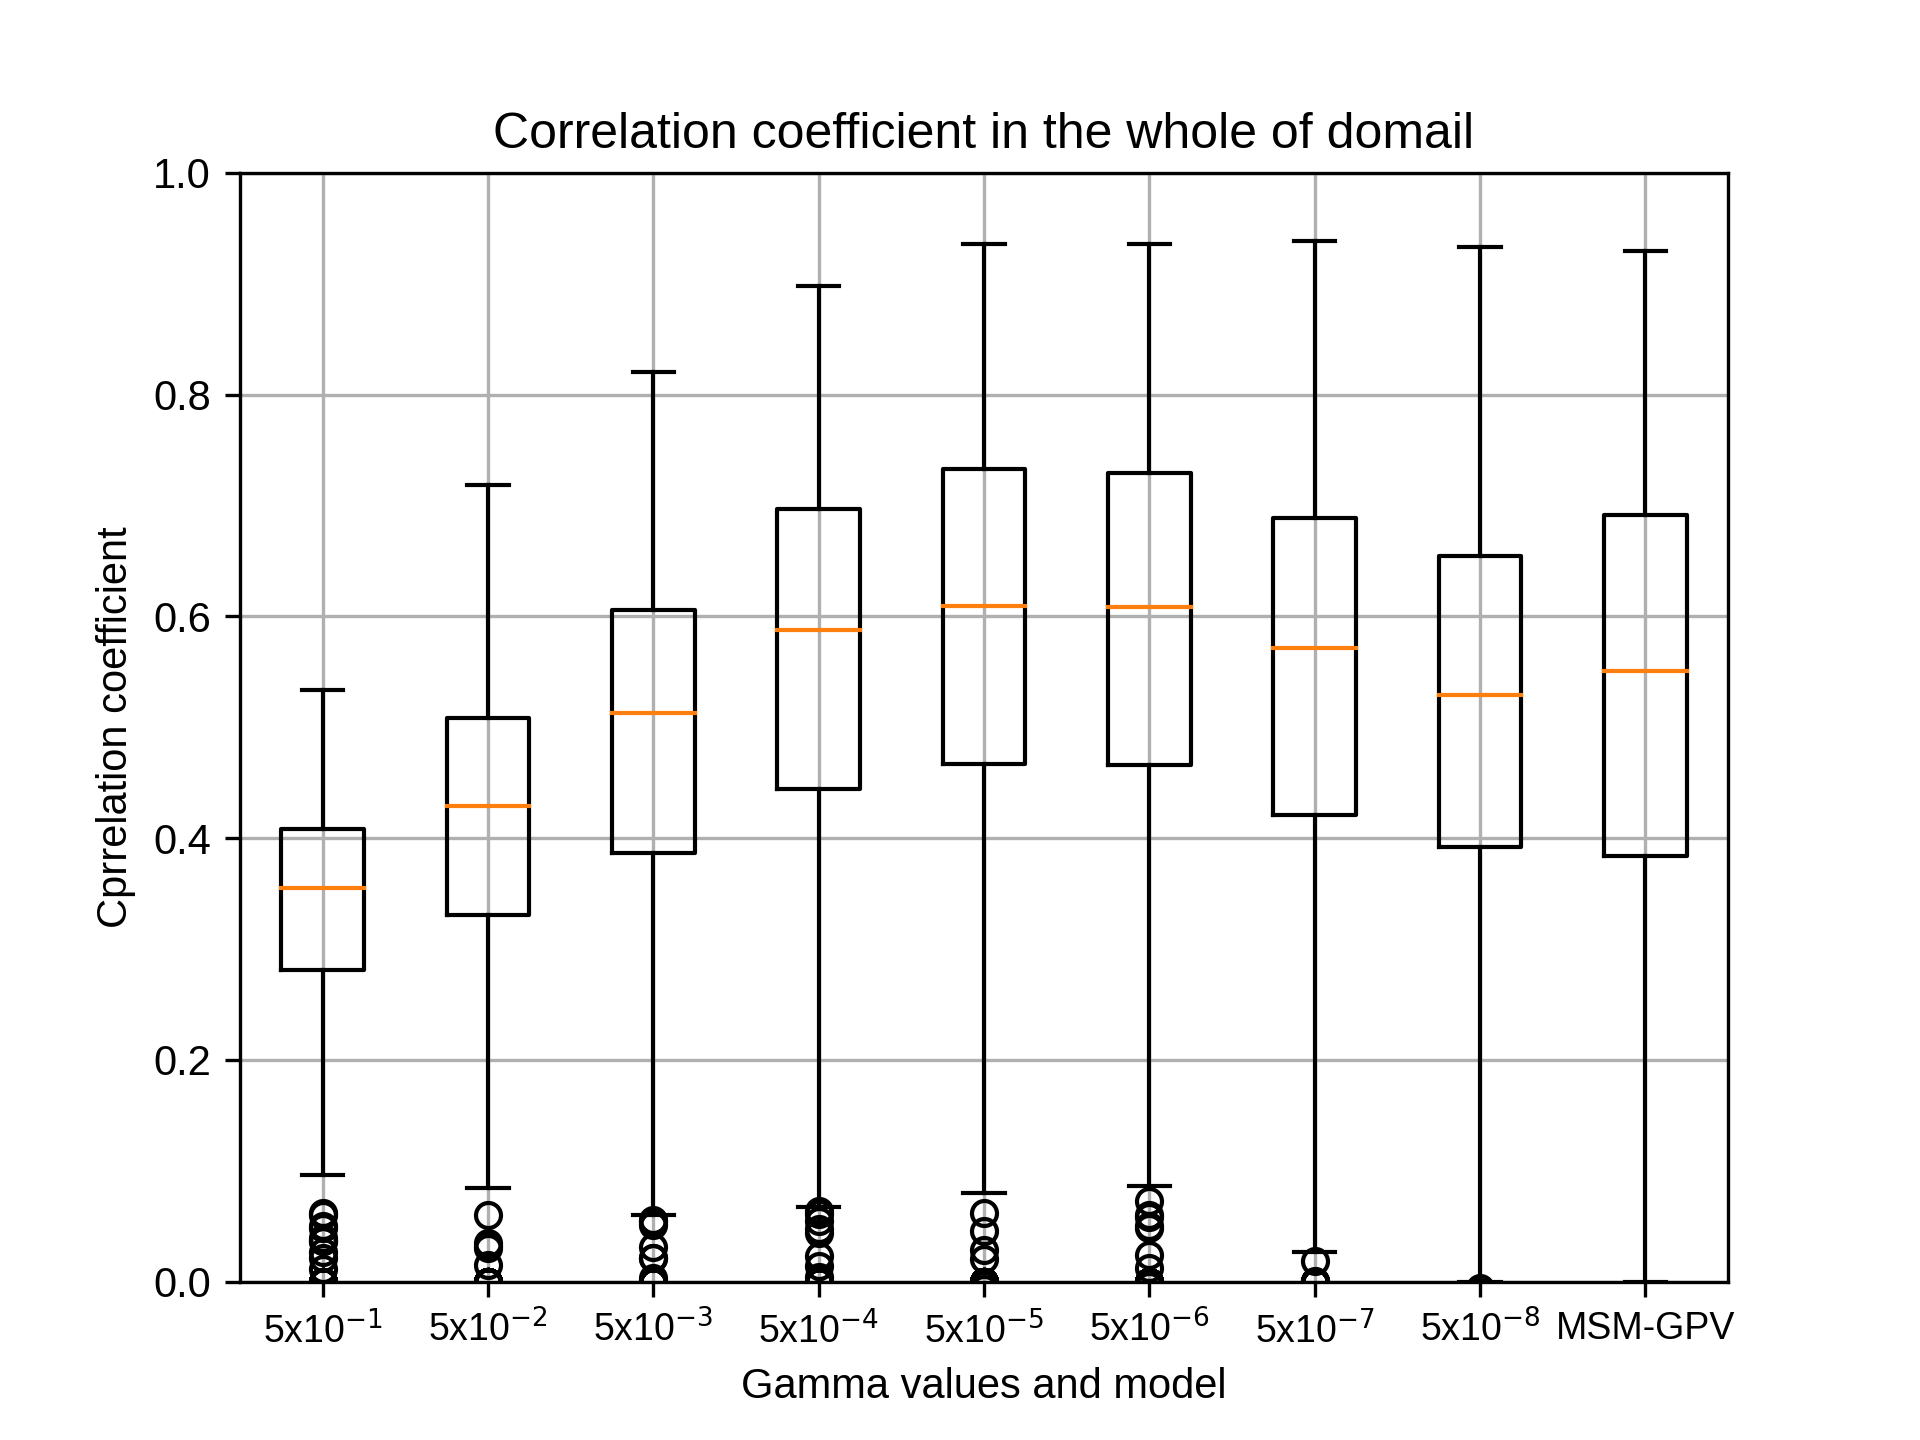

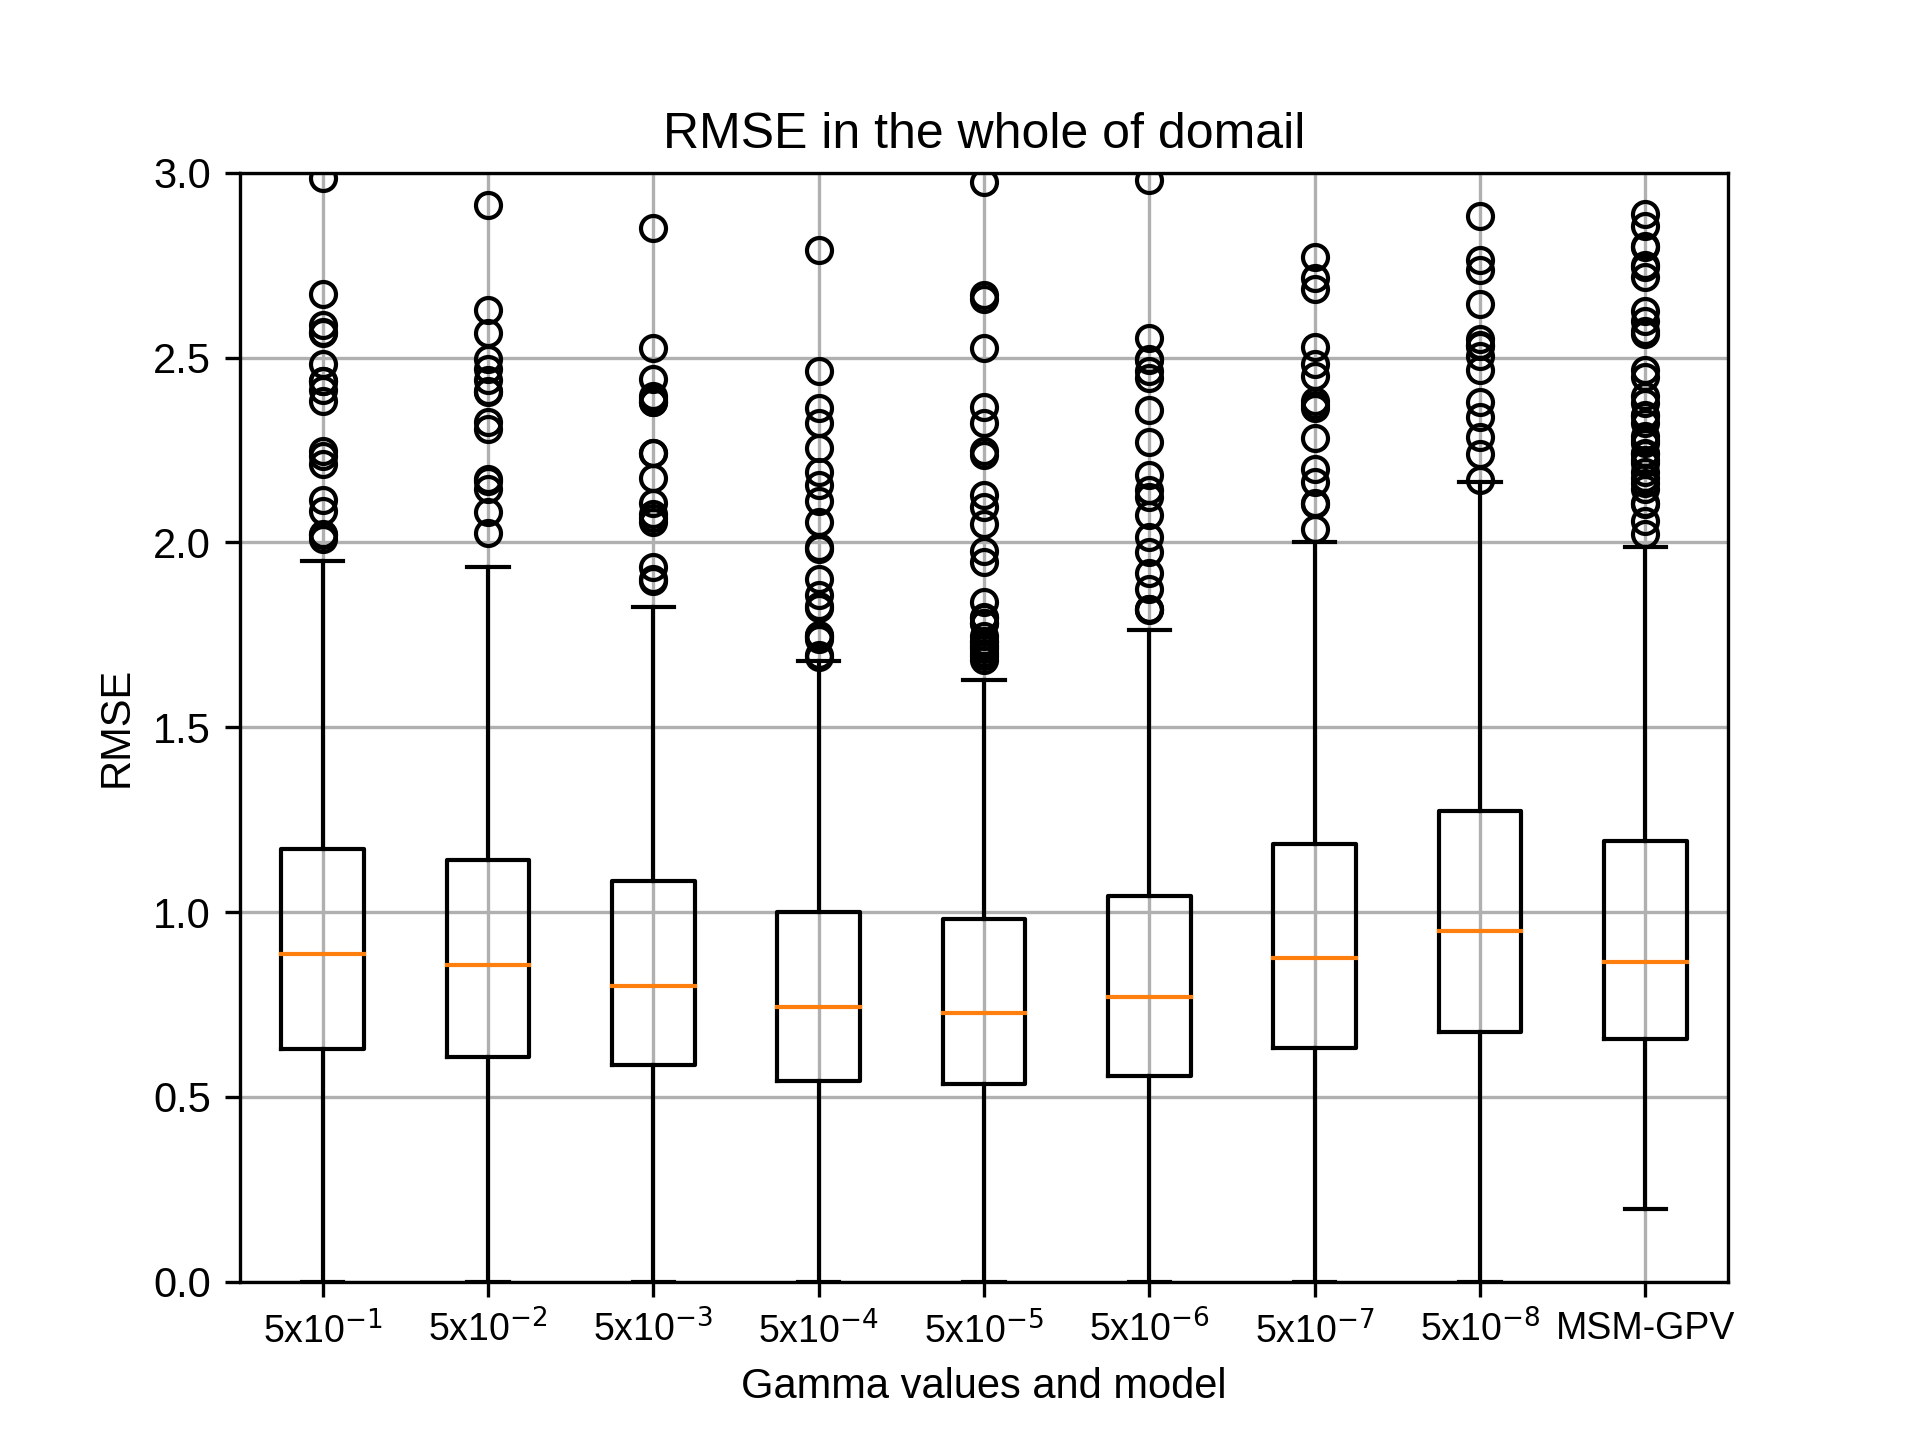
次に、10月のsiteB,rg2=4の結果です。
kobayashi_yusukeMonday, November 16th, 2020 at 5:24:40 PM GMT+09:00
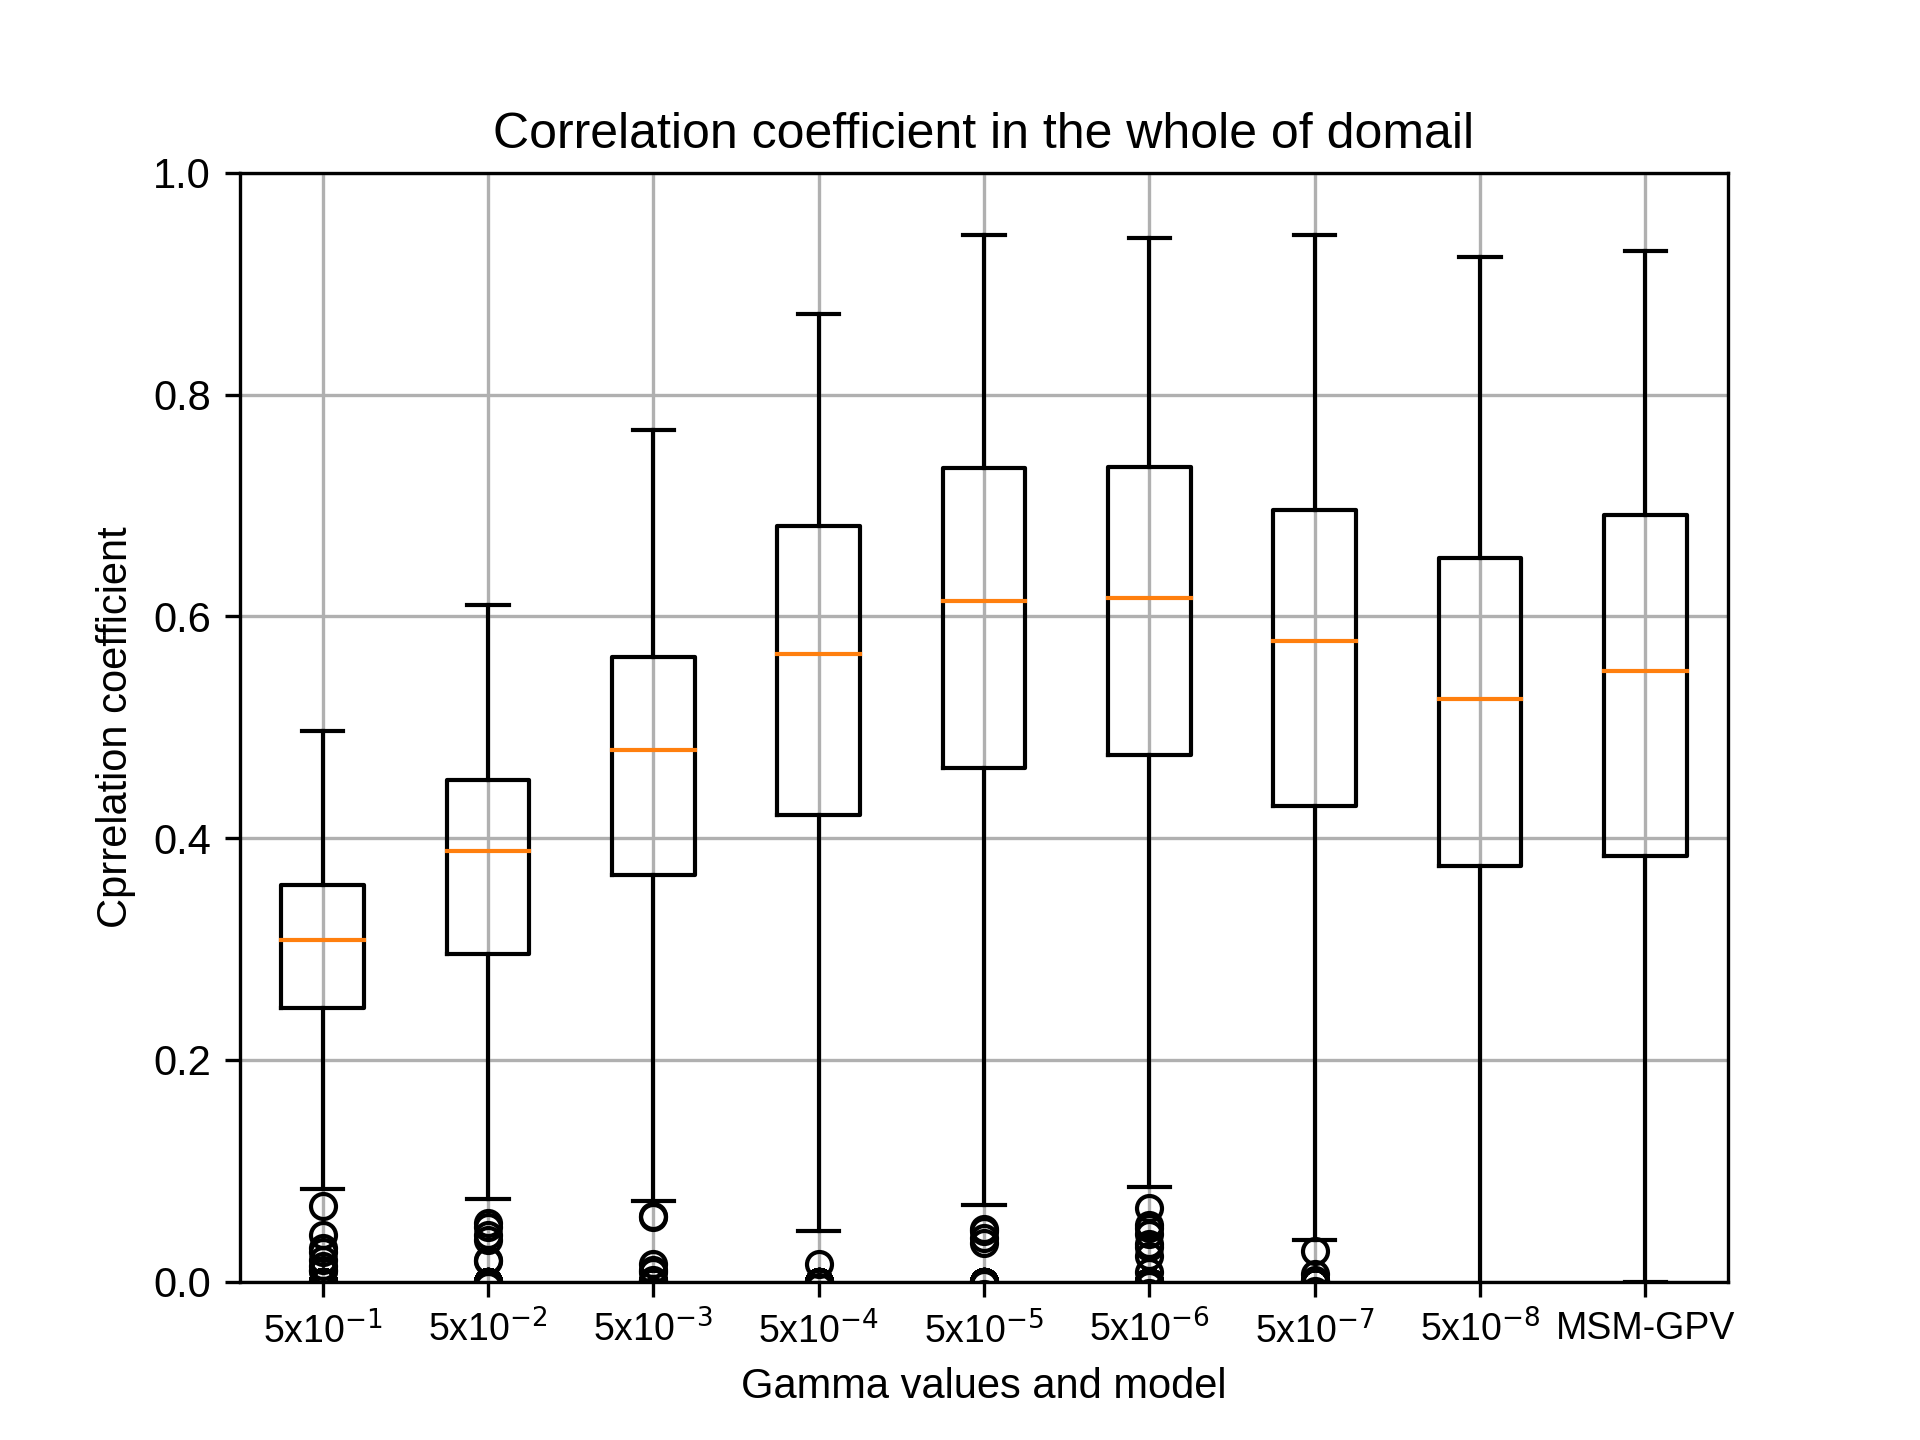
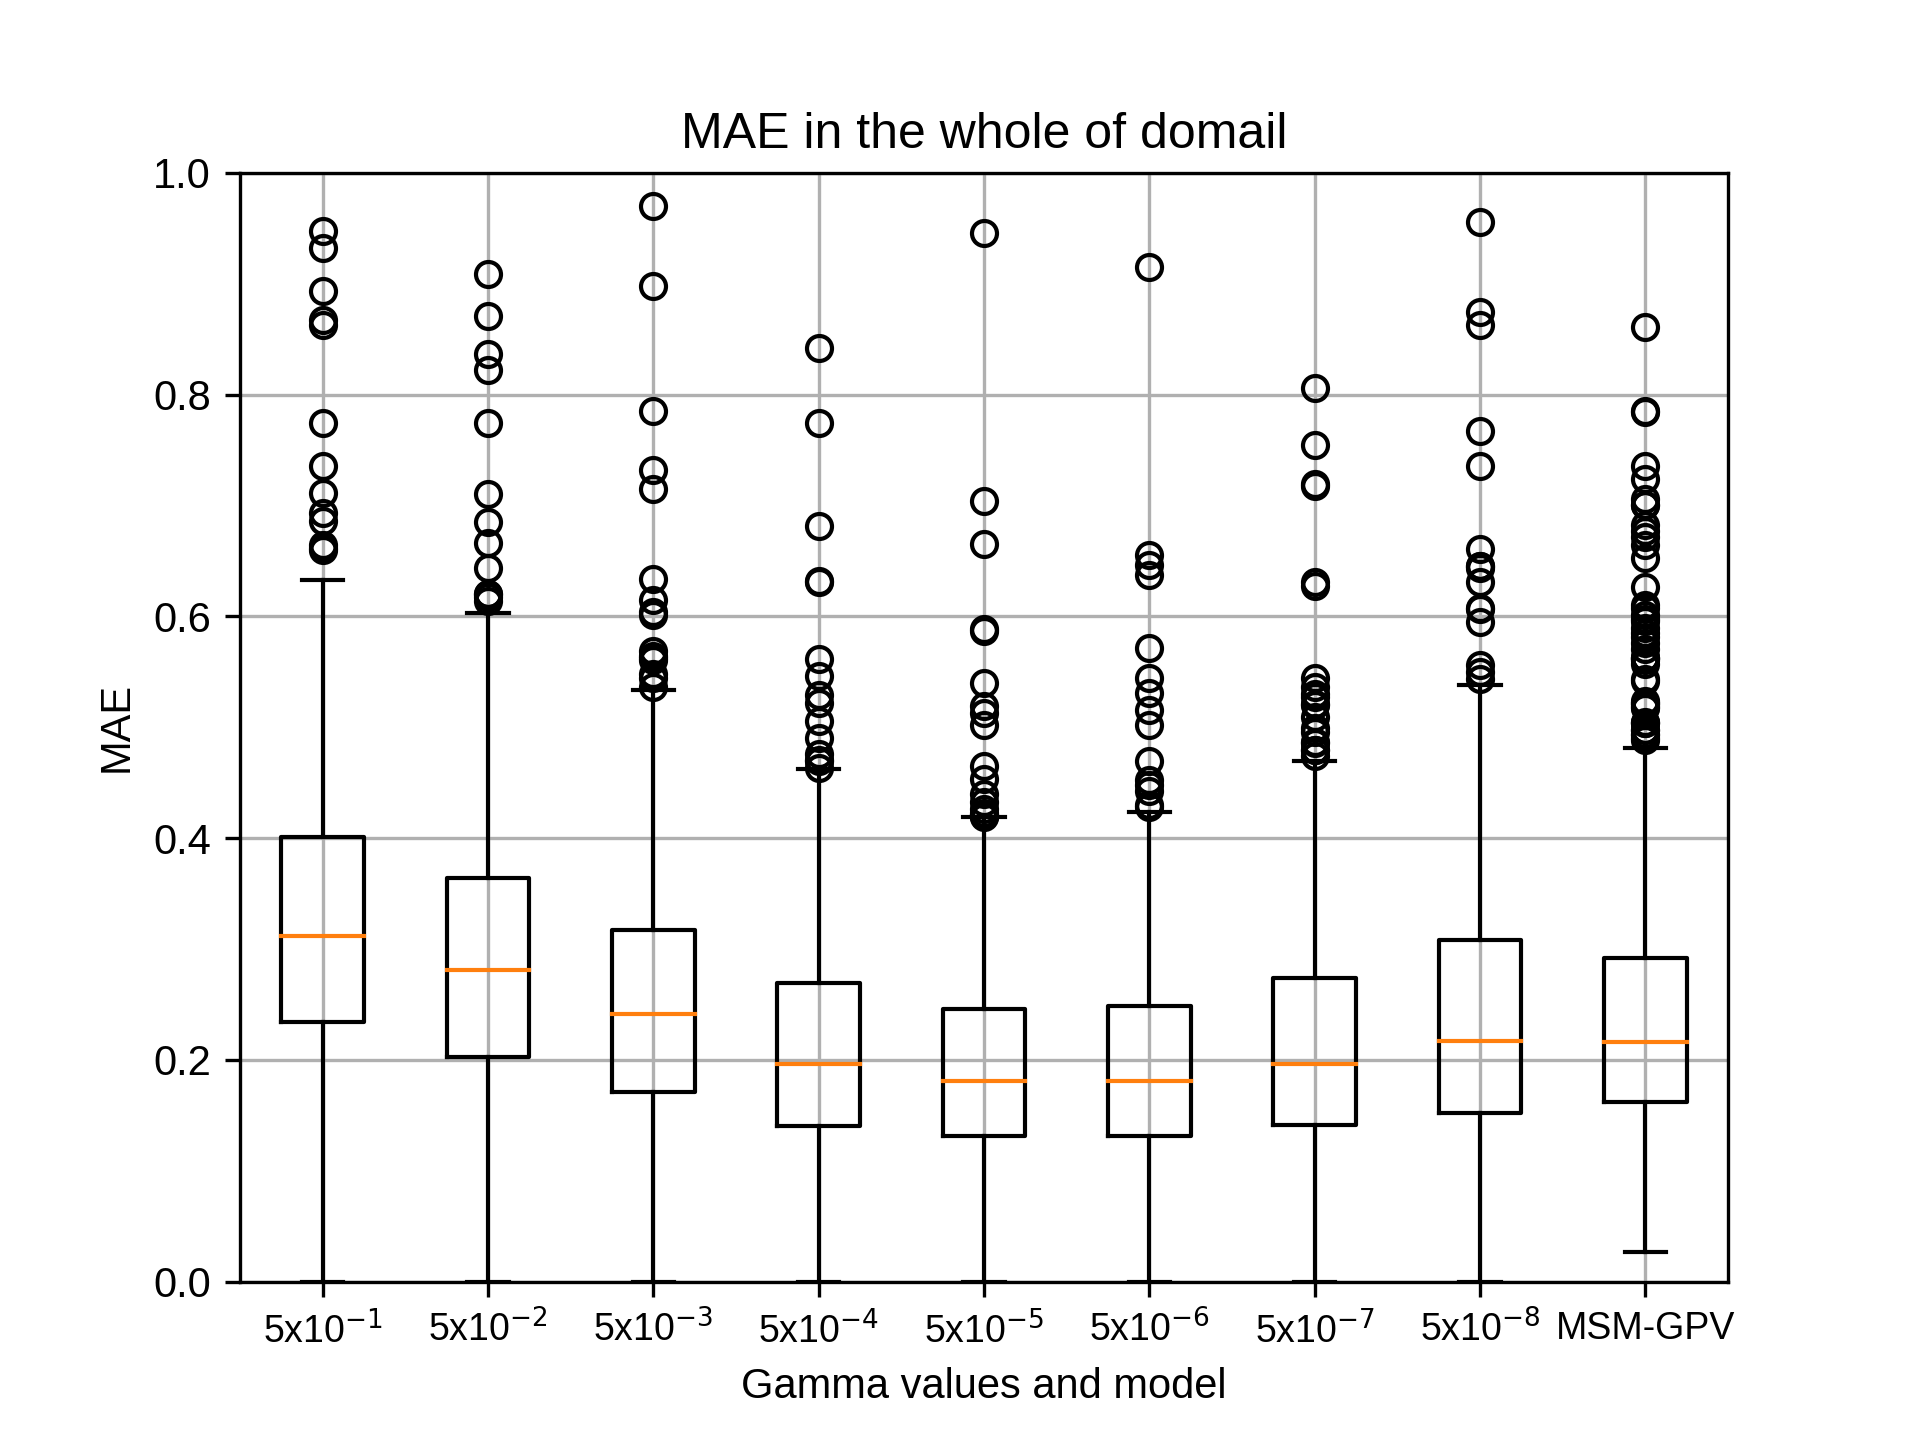
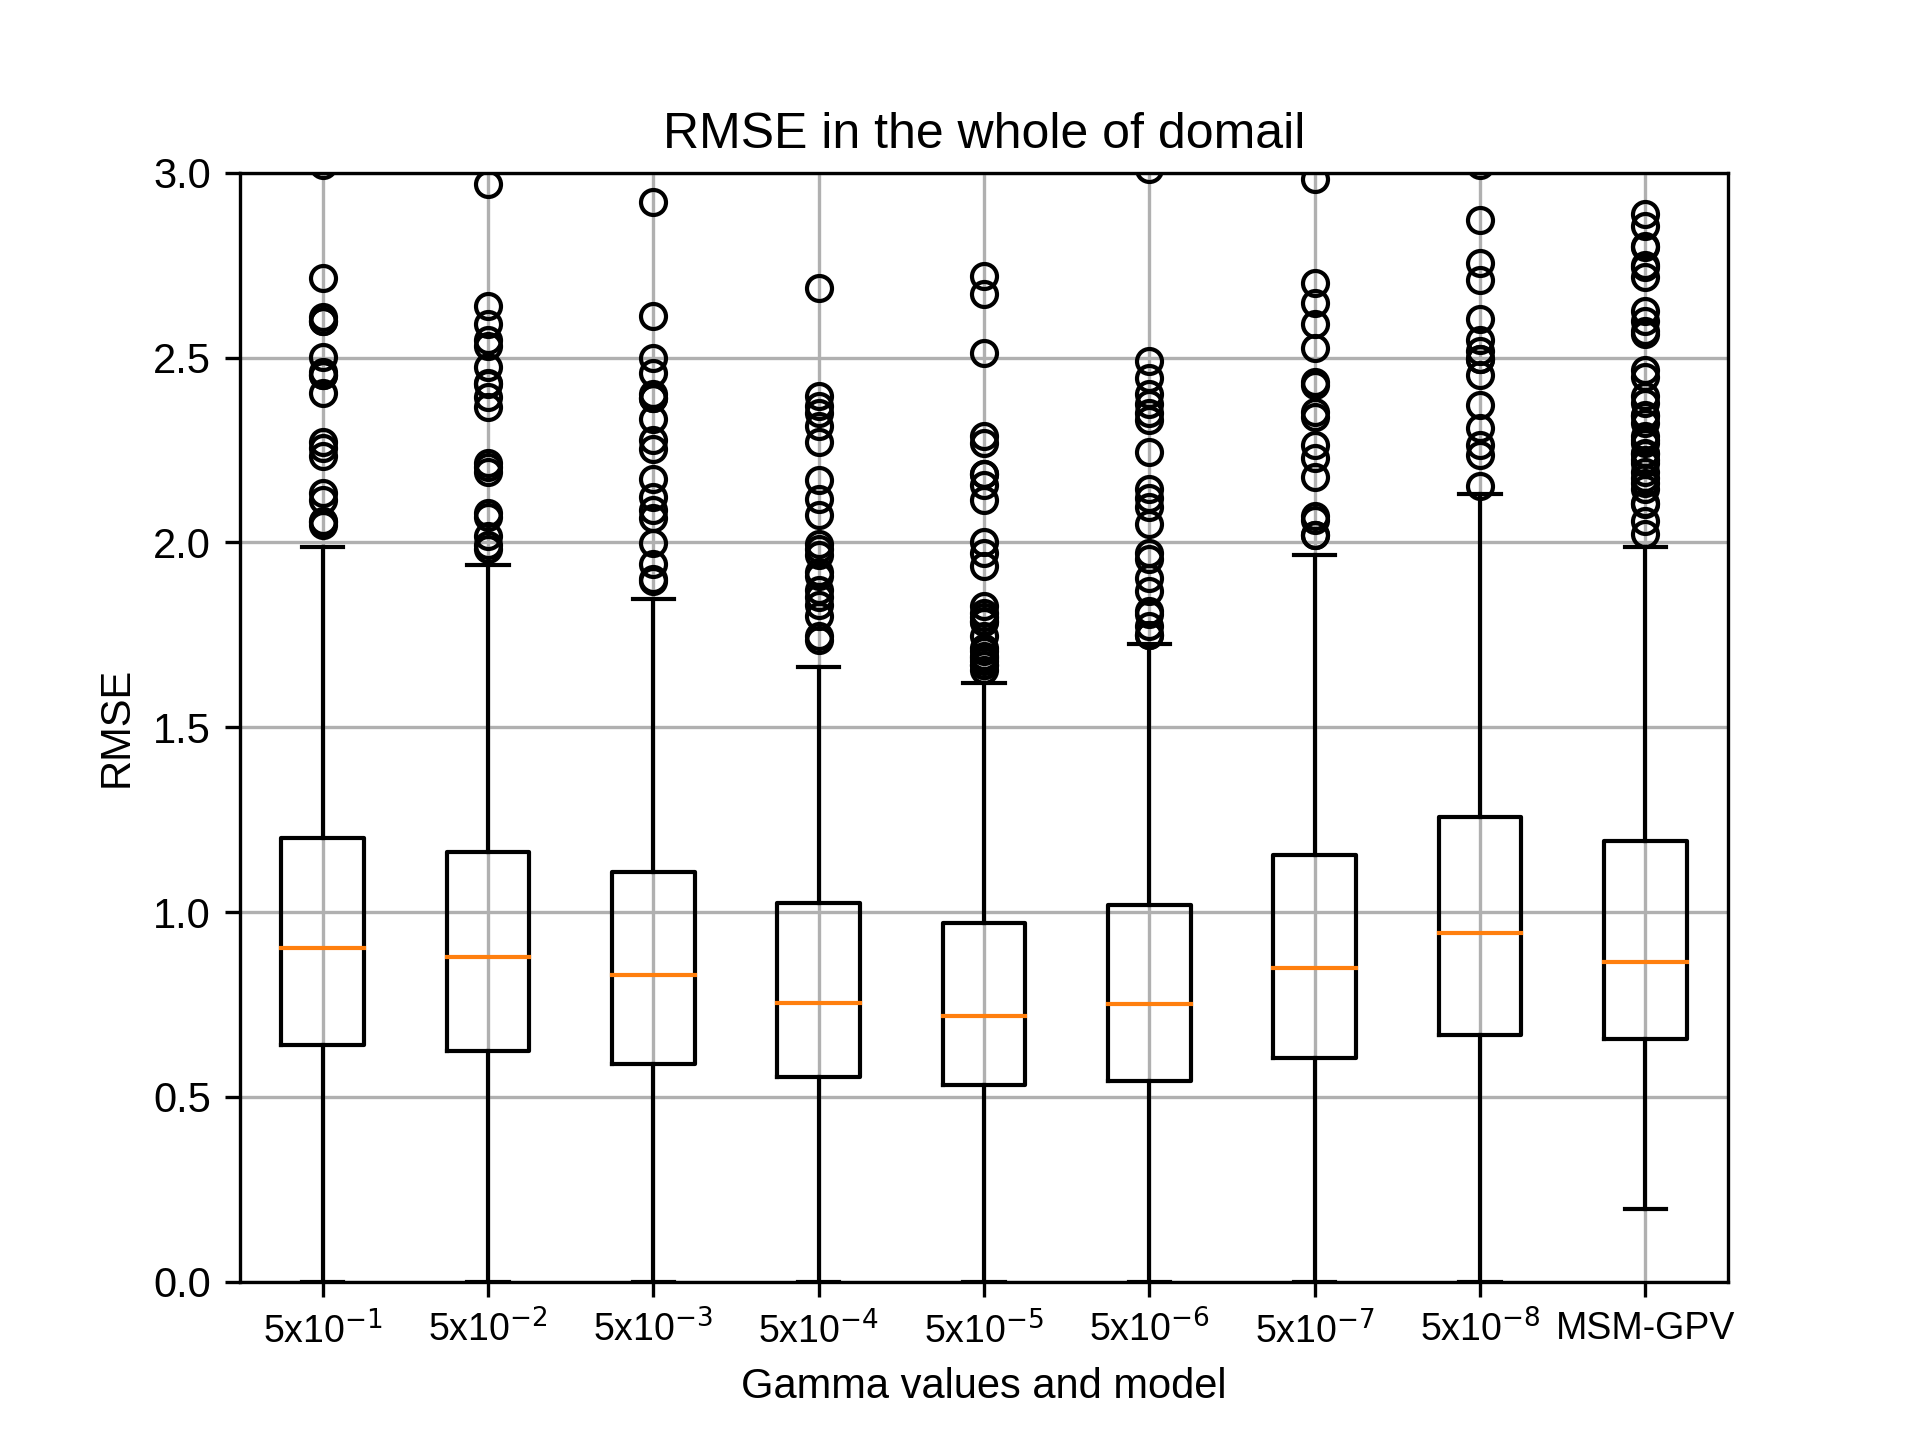
10月のsiteB,rg2=6の結果です。
kobayashi_yusukeMonday, November 16th, 2020 at 5:24:57 PM GMT+09:00
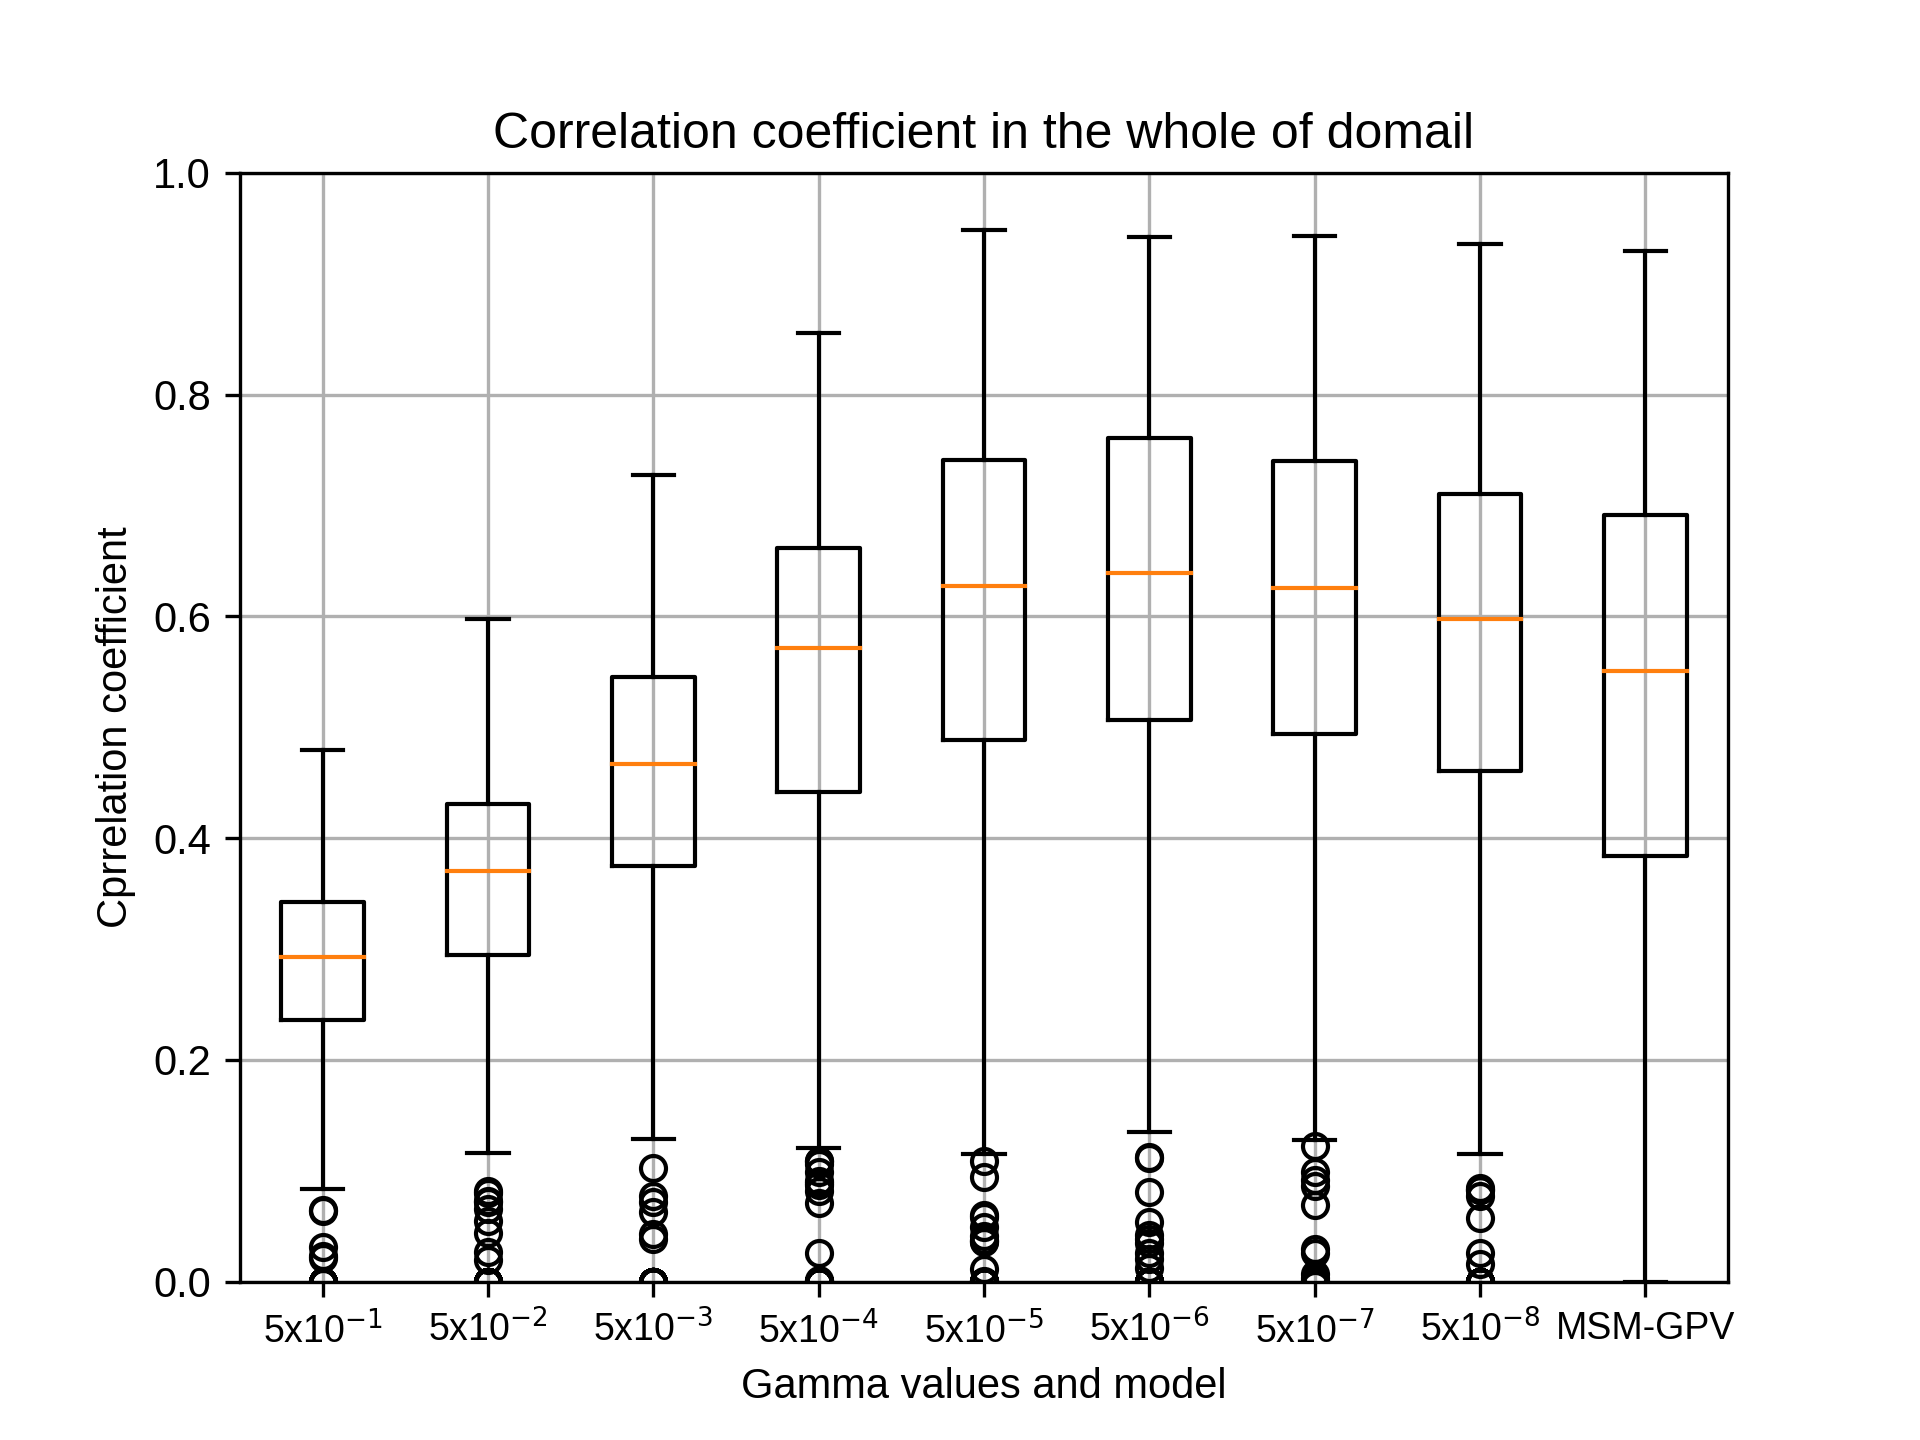
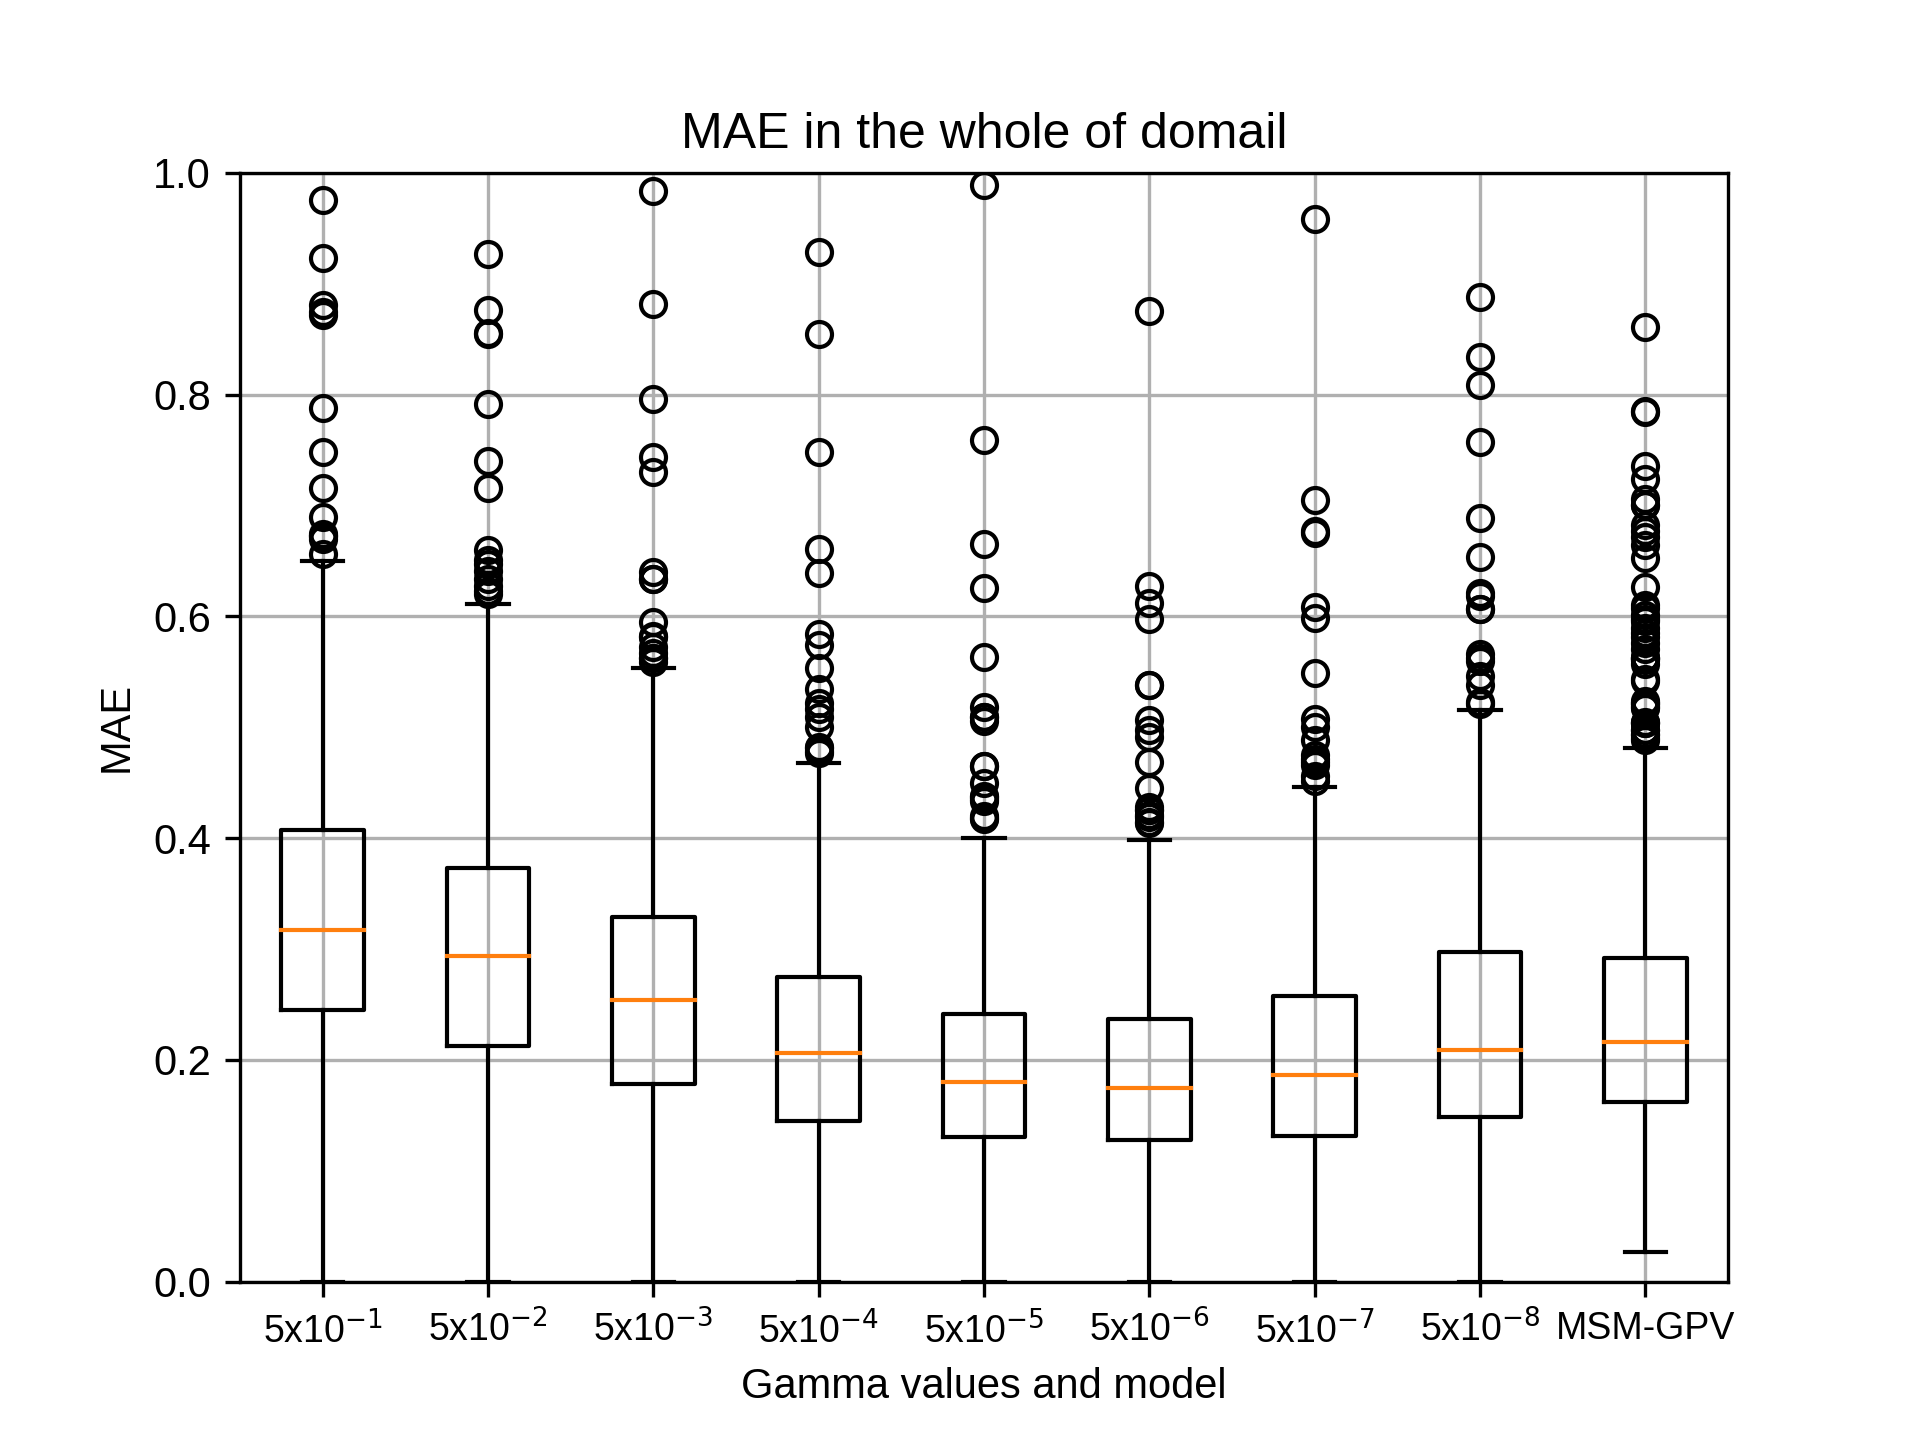
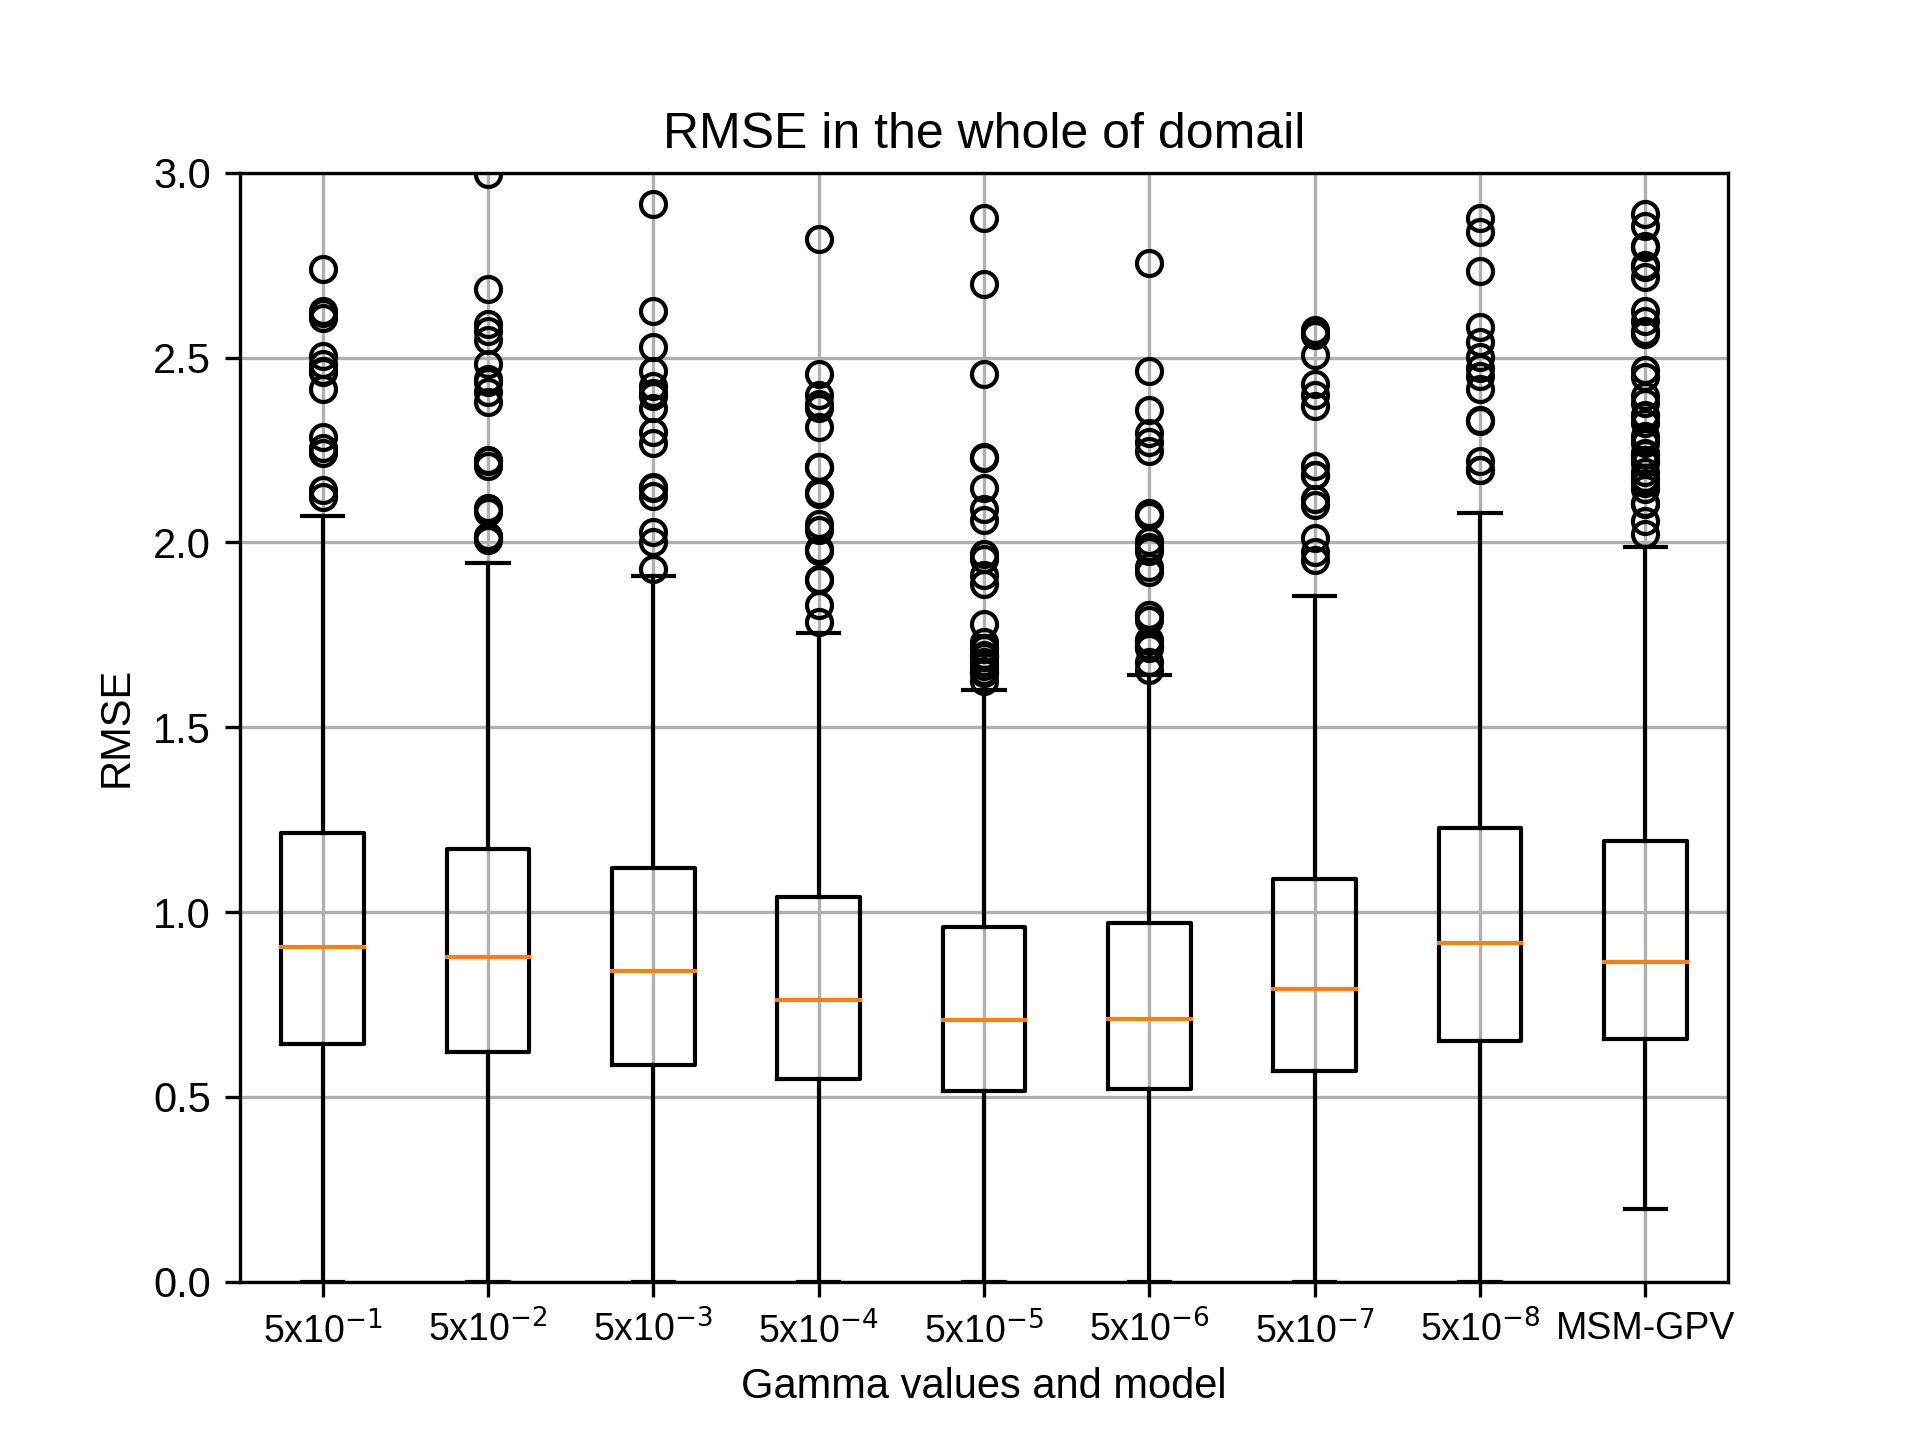
10月のsiteB,rg2=8の結果です。
kobayashi_yusukeMonday, November 16th, 2020 at 5:25:17 PM GMT+09:00


10月のsiteB,rg2=10の結果です。
kobayashi_yusukeMonday, November 16th, 2020 at 5:25:35 PM GMT+09:00
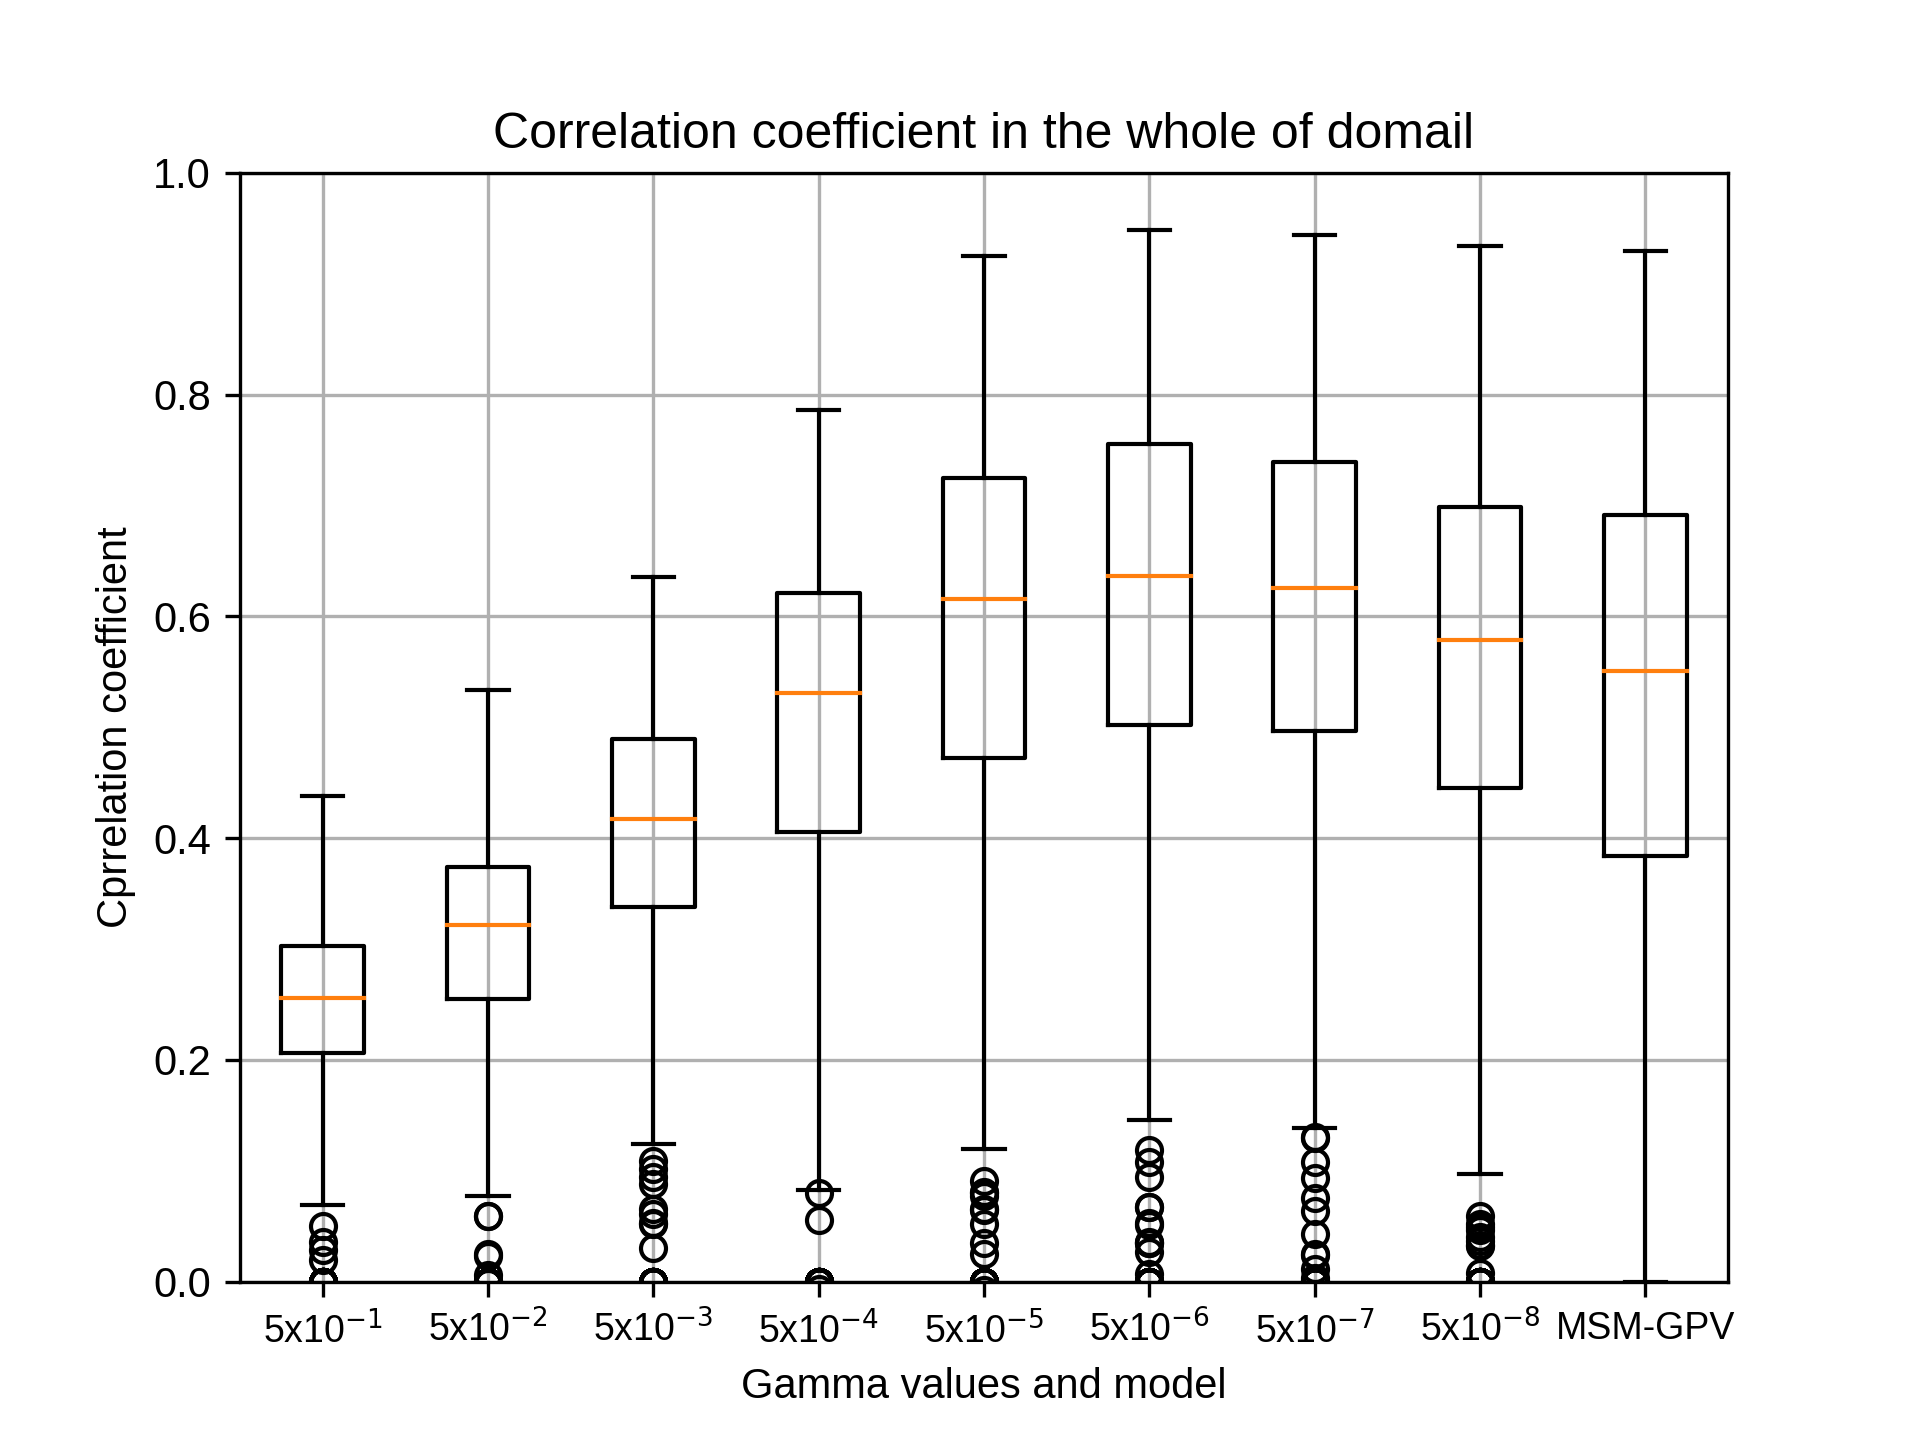
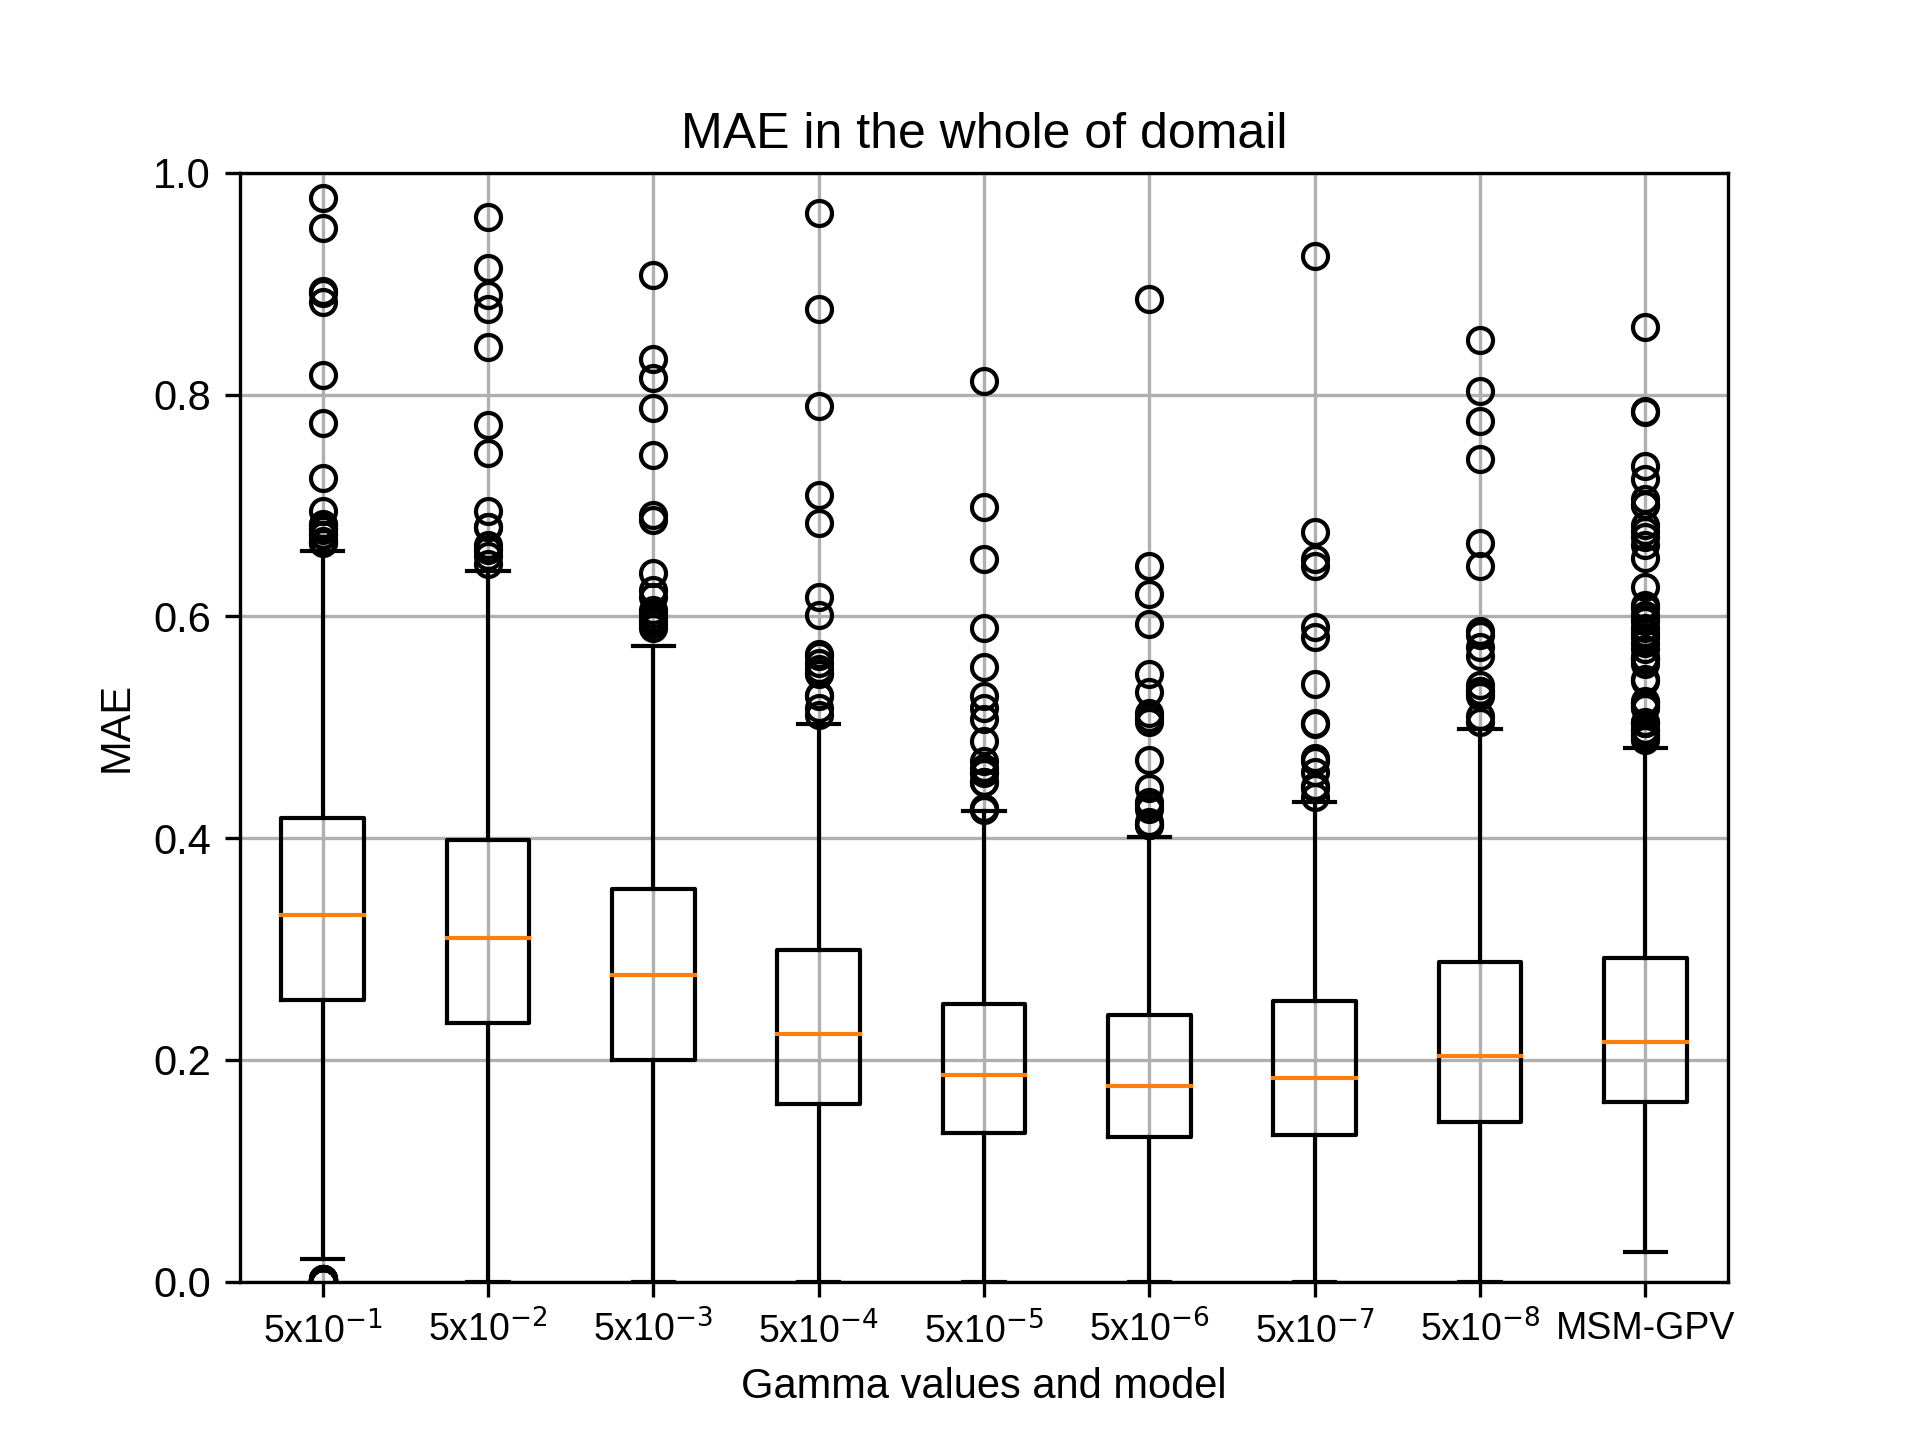
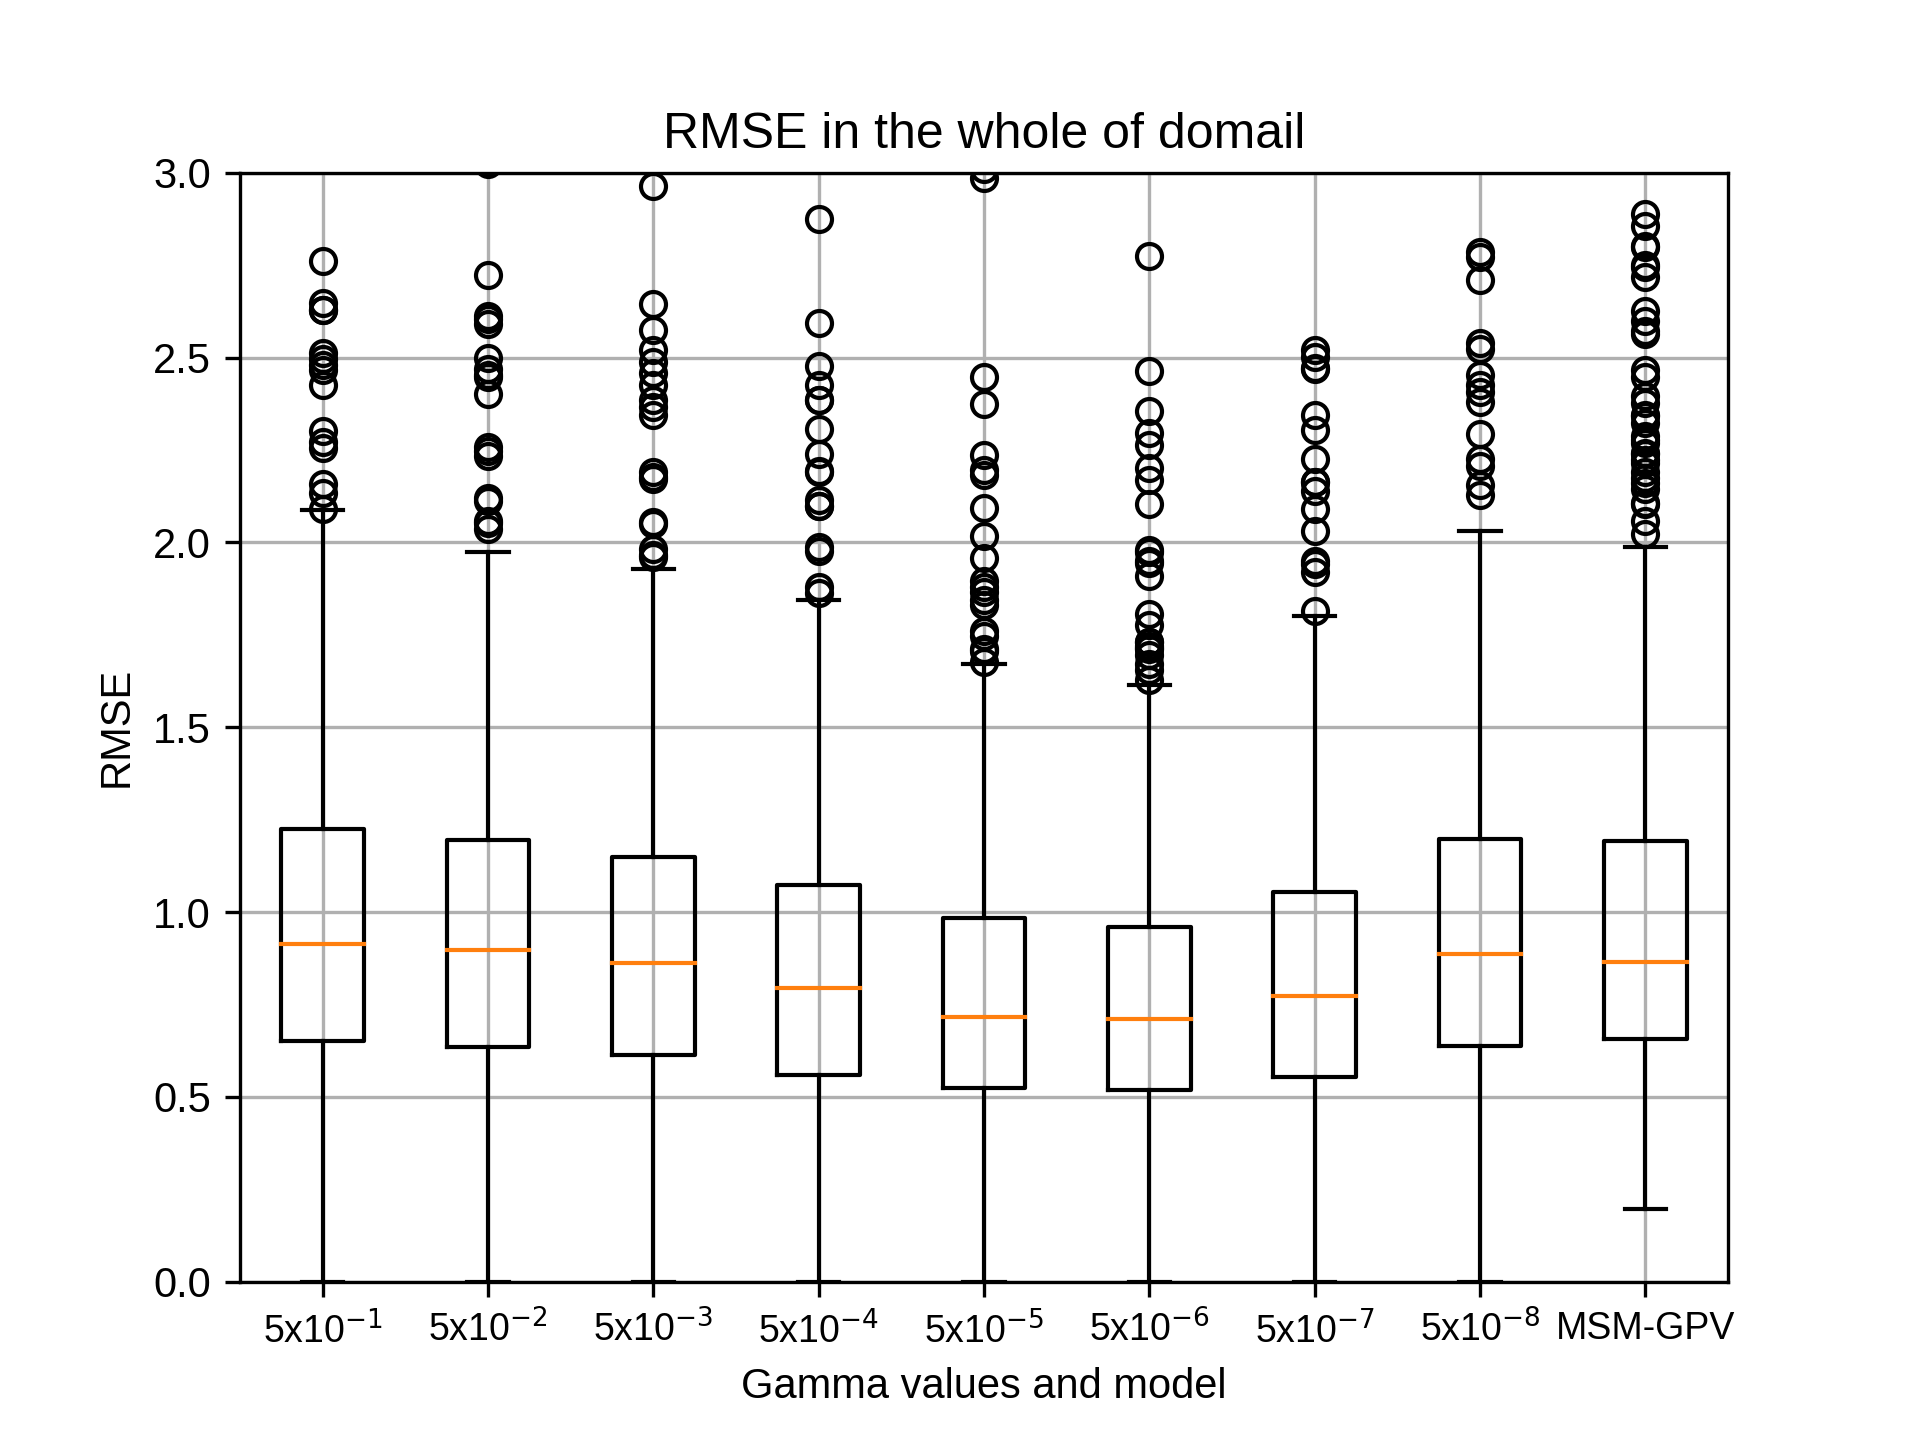
10月のsiteB,rg2=12の結果です。
10月のsiteBではrg2=8でgammaが5x10⁻⁶のとき、相関係数の中央値が最も高くなりました。
10月のsiteBではrg2=8でgammaが5x10⁻⁶のとき、相関係数の中央値が最も高くなりました。
kobayashi_yusukeMonday, November 16th, 2020 at 5:25:51 PM GMT+09:00
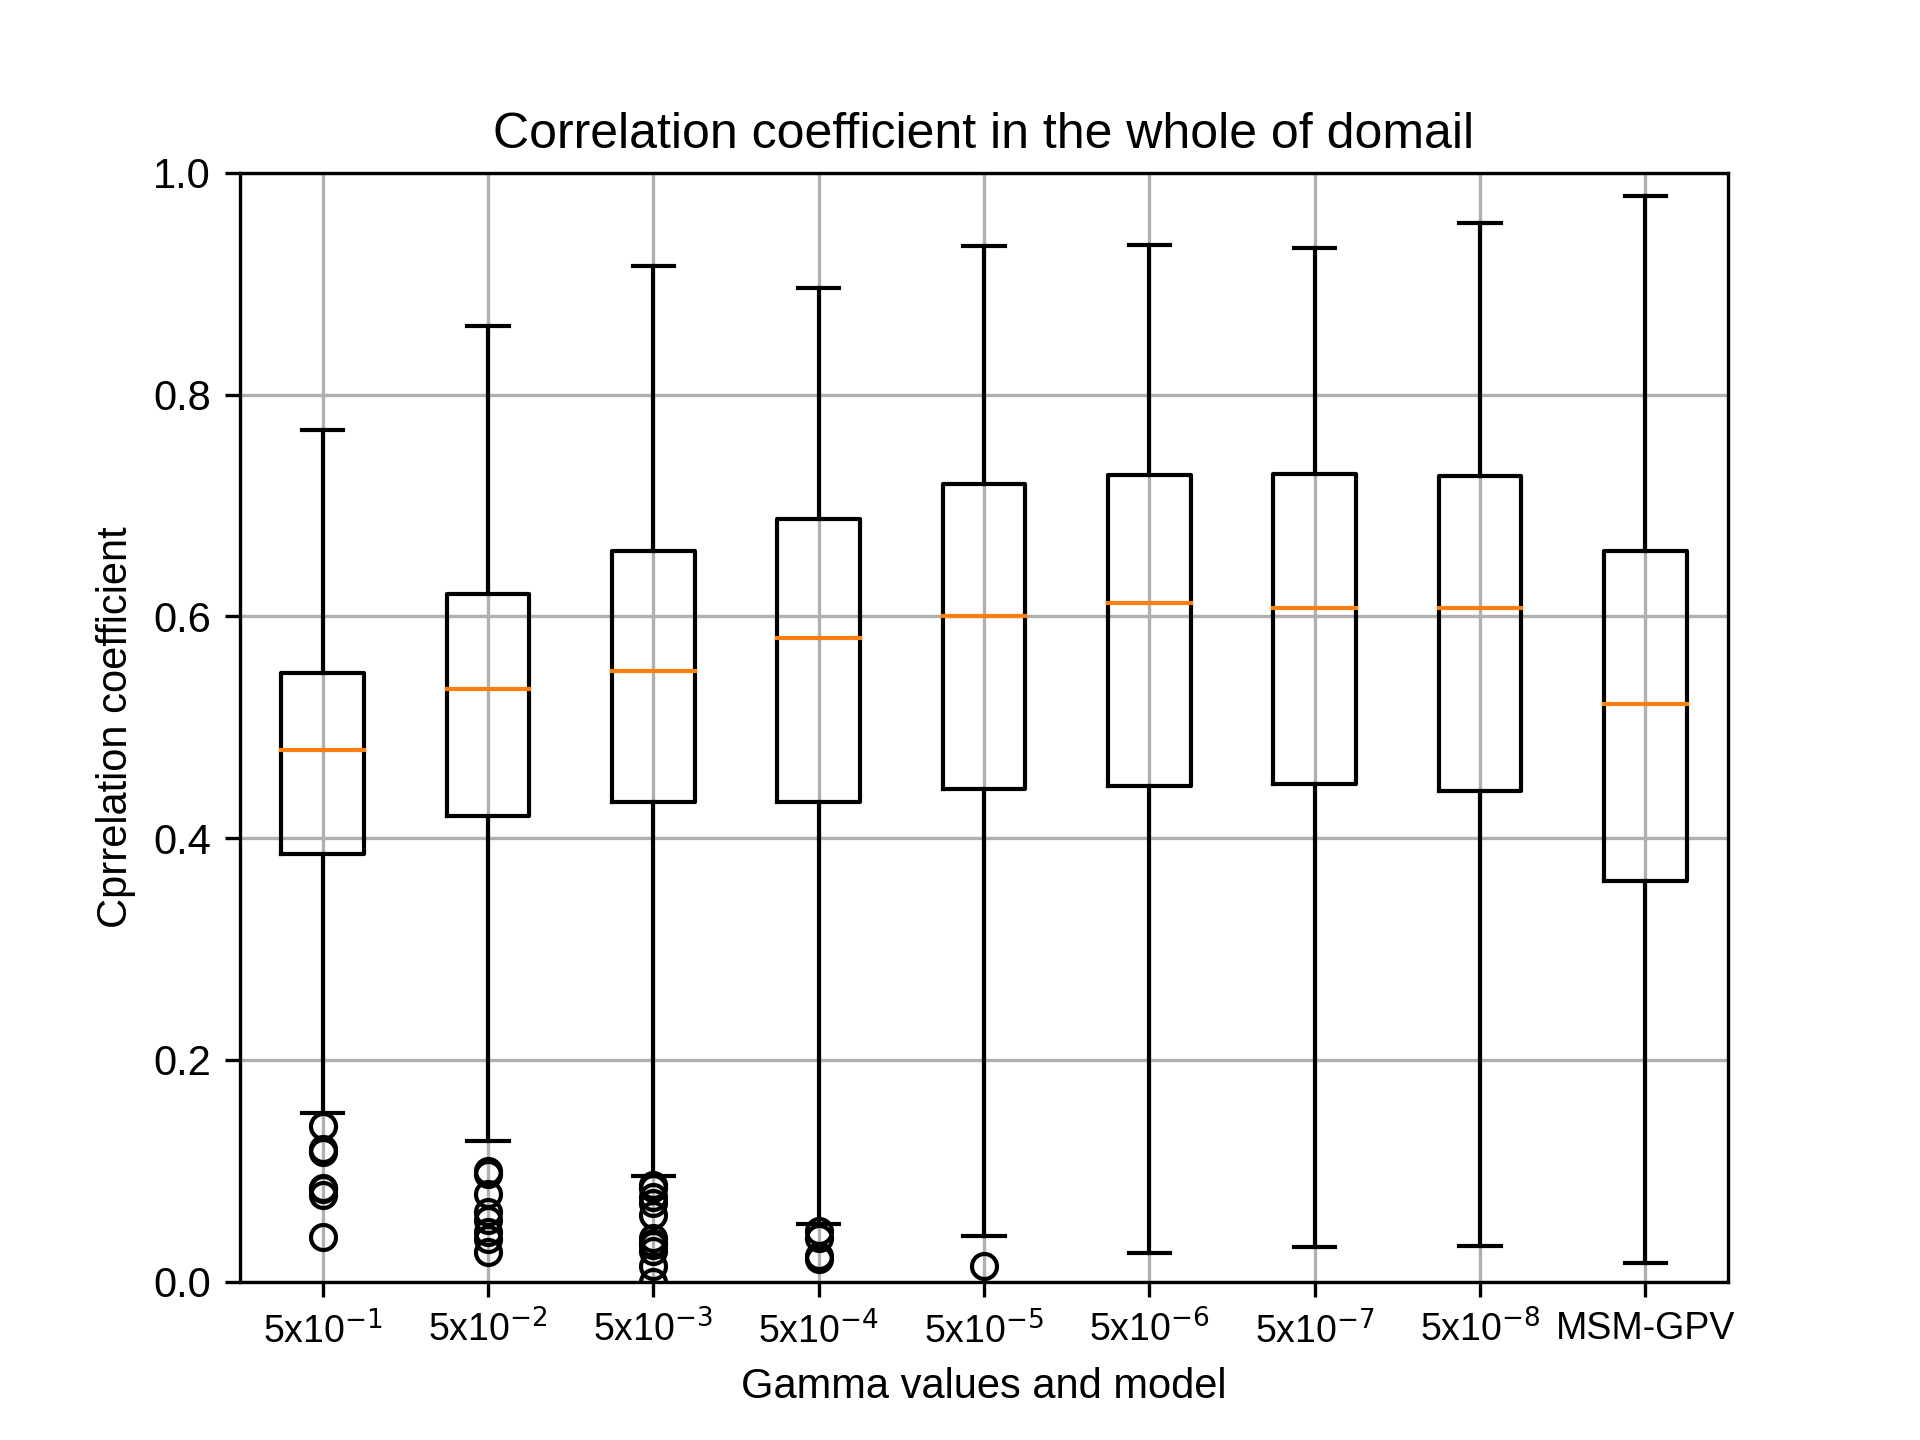
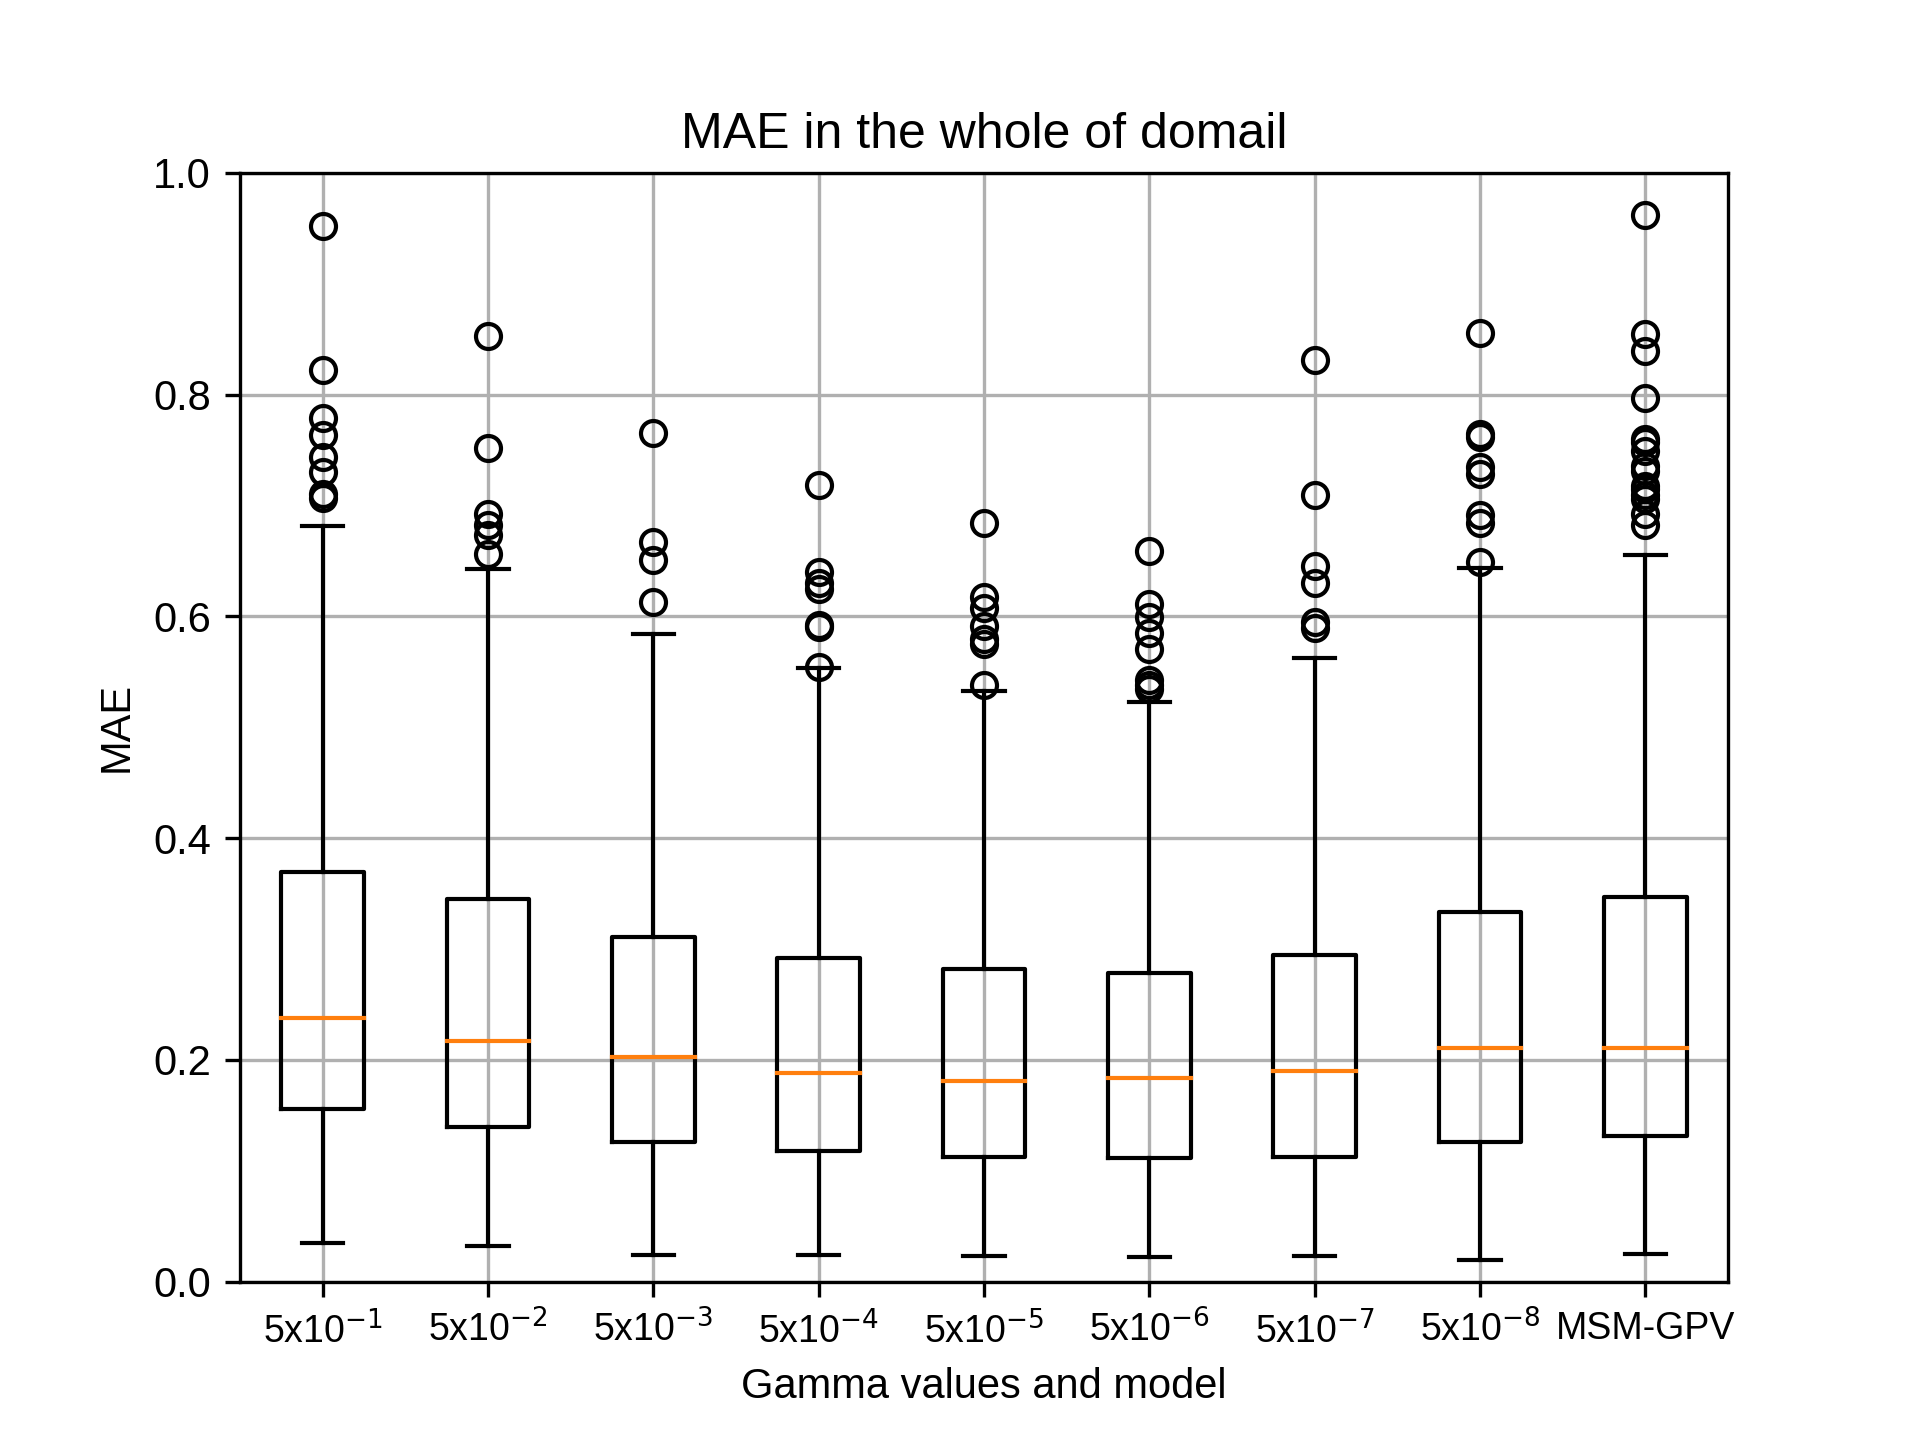
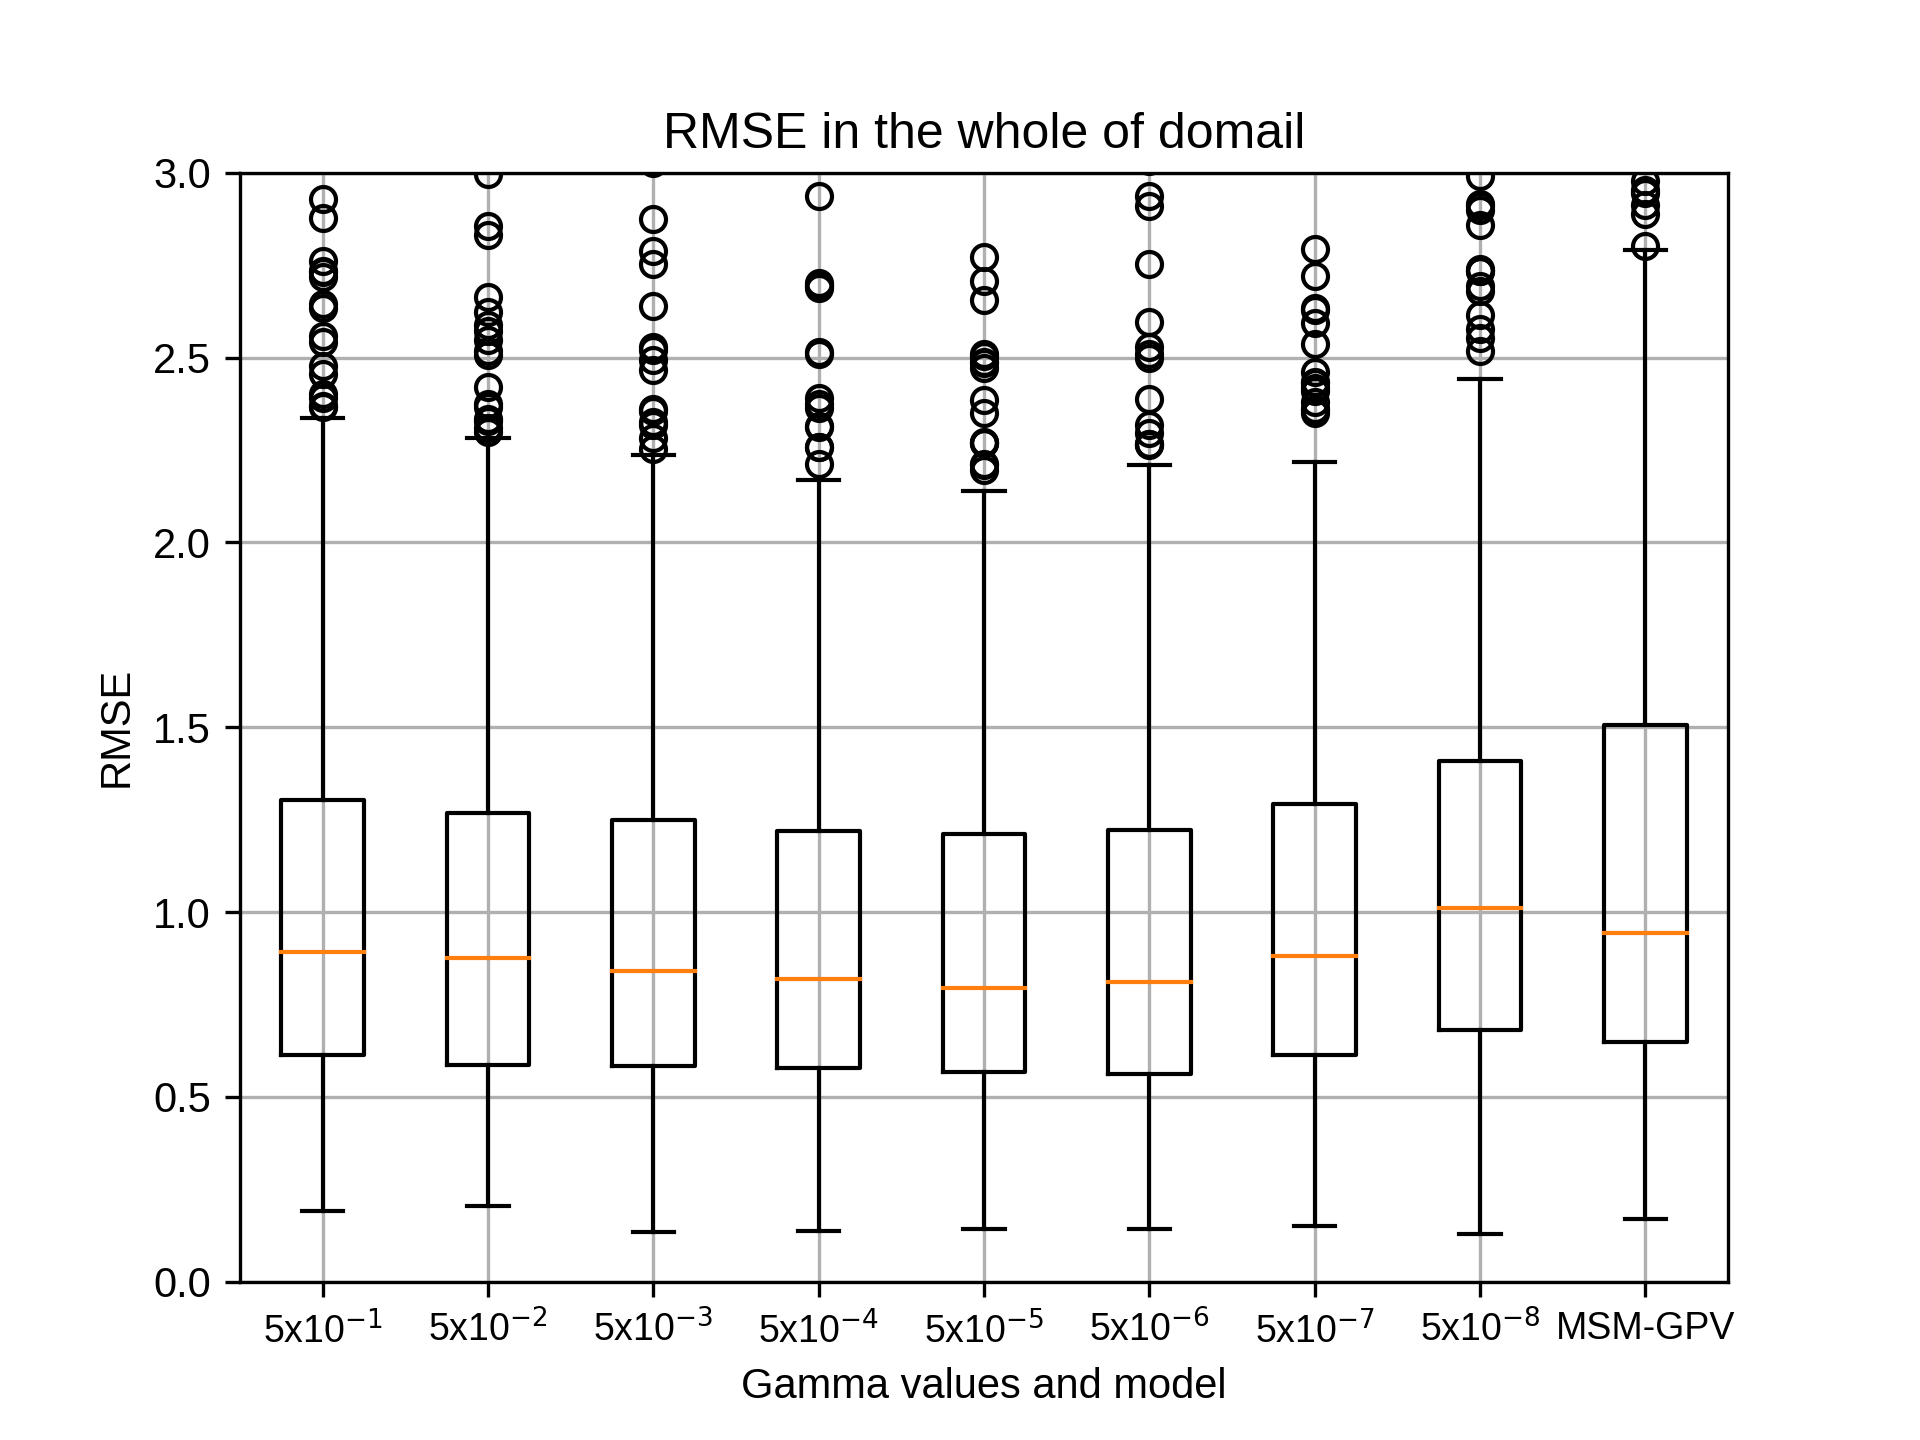
続いて、10月のsiteC,rg2=4の結果です。
kobayashi_yusukeMonday, November 16th, 2020 at 5:26:06 PM GMT+09:00
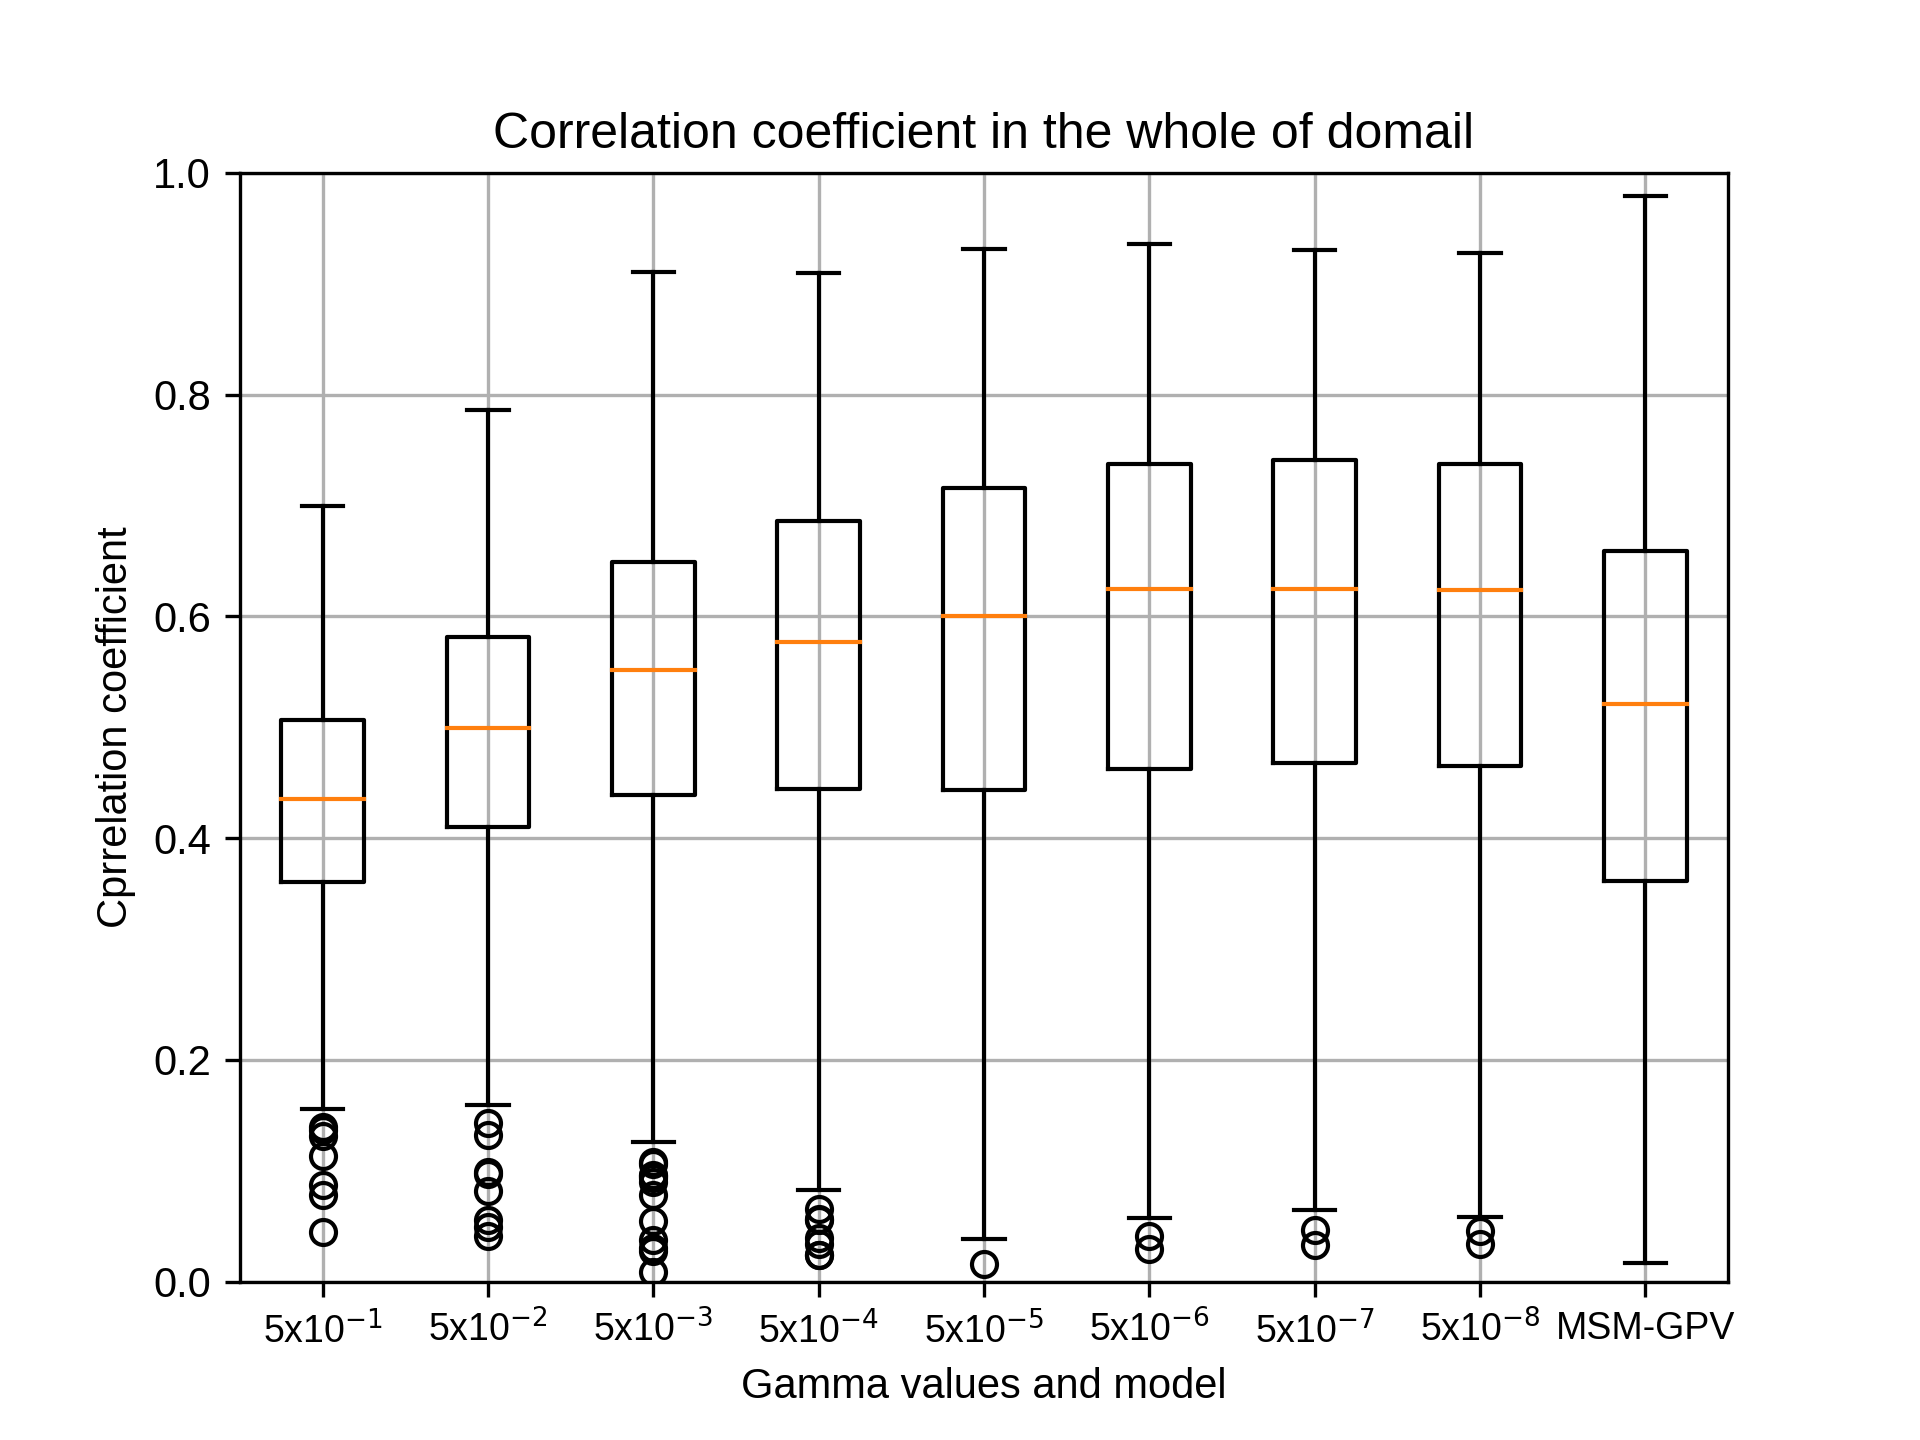
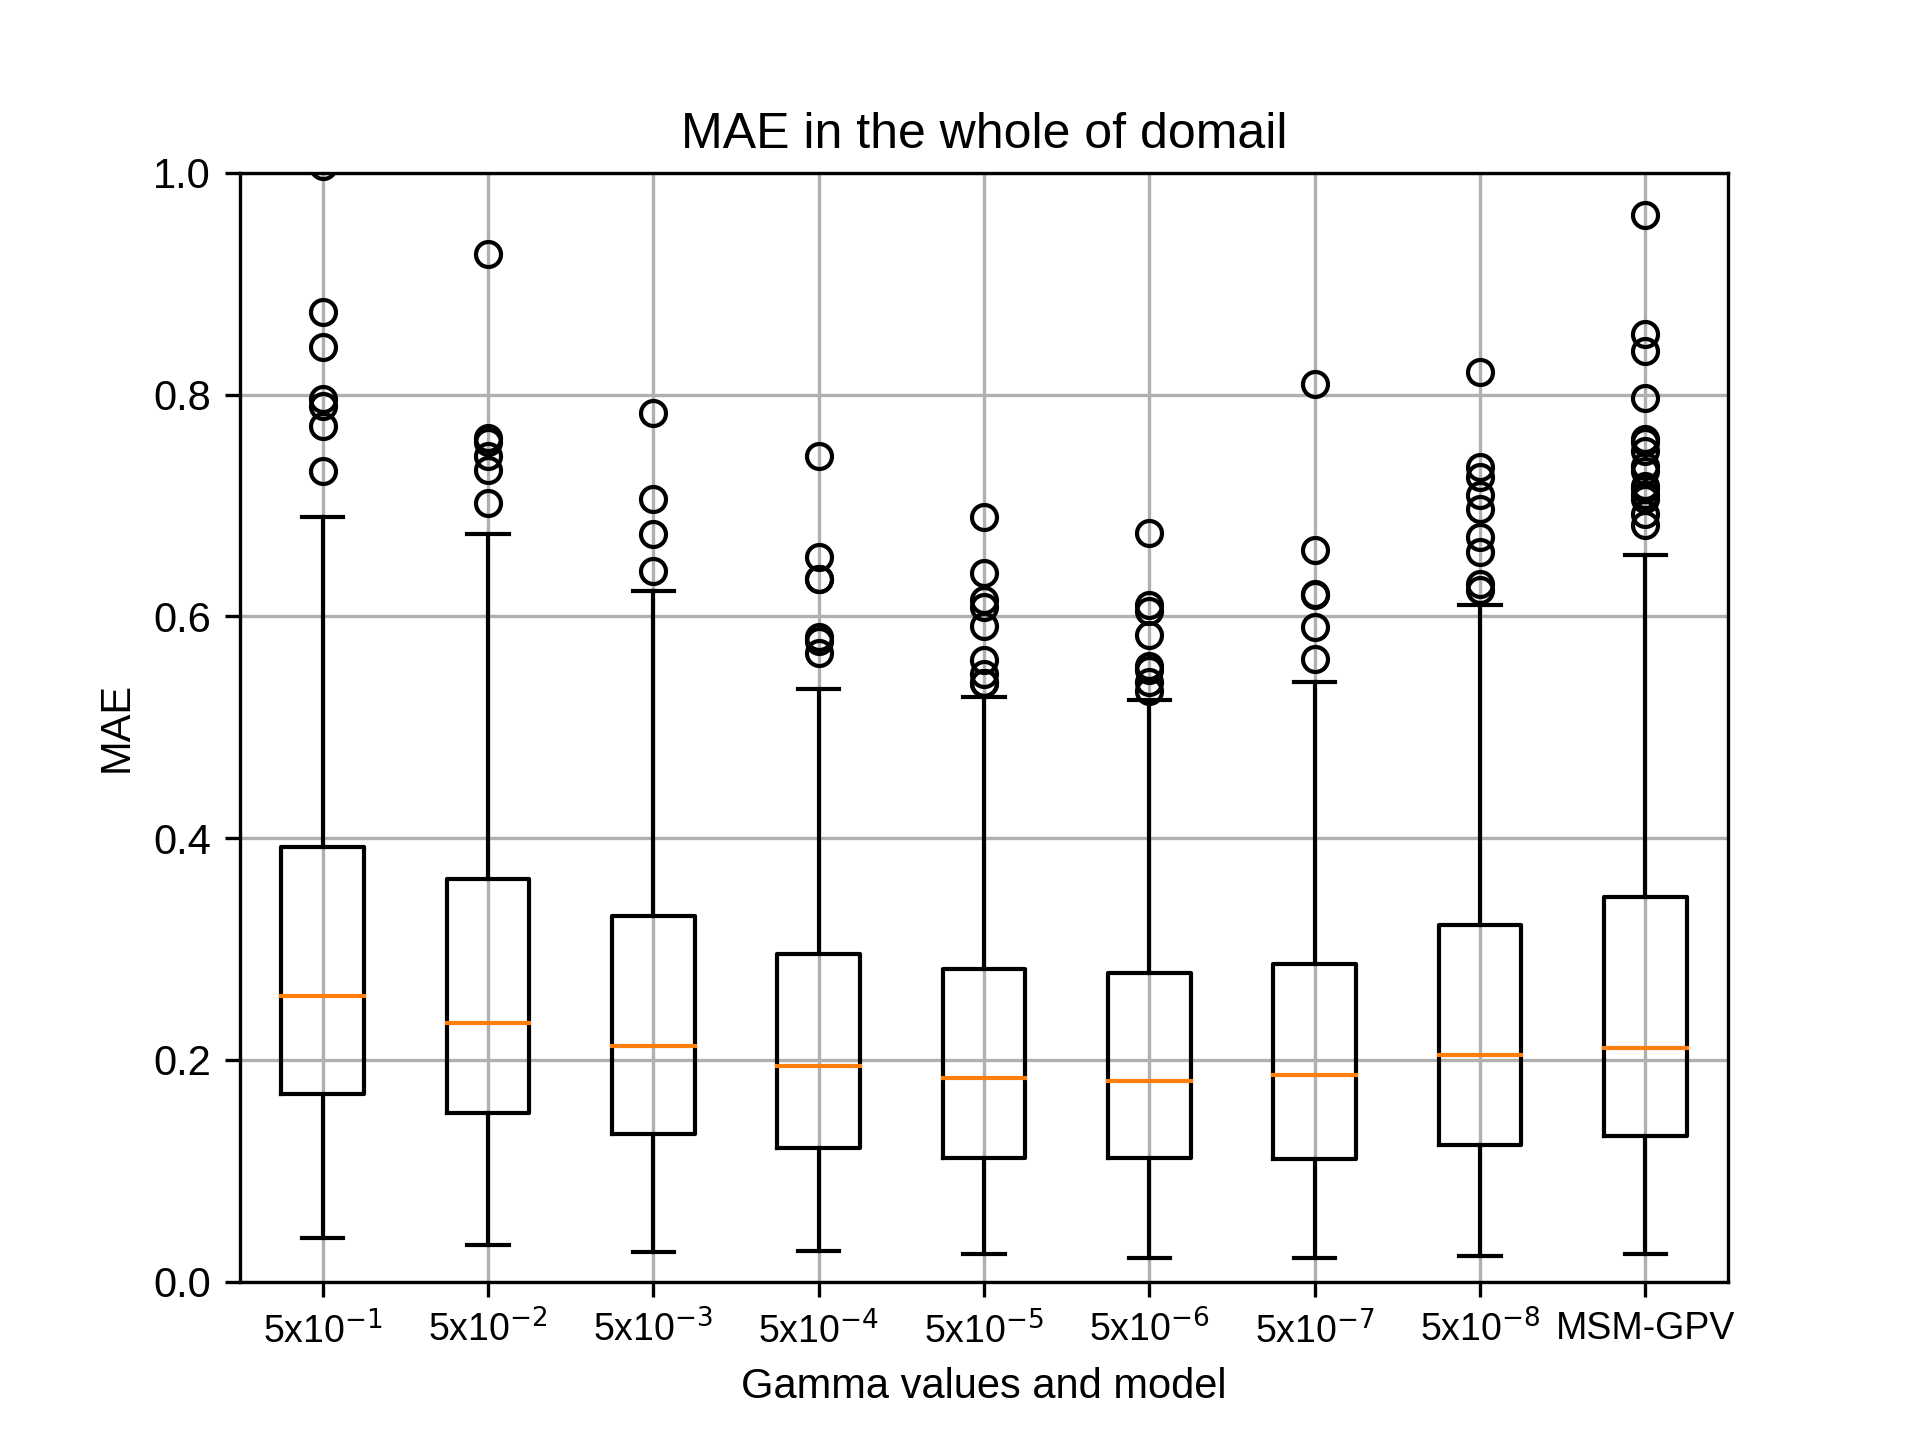
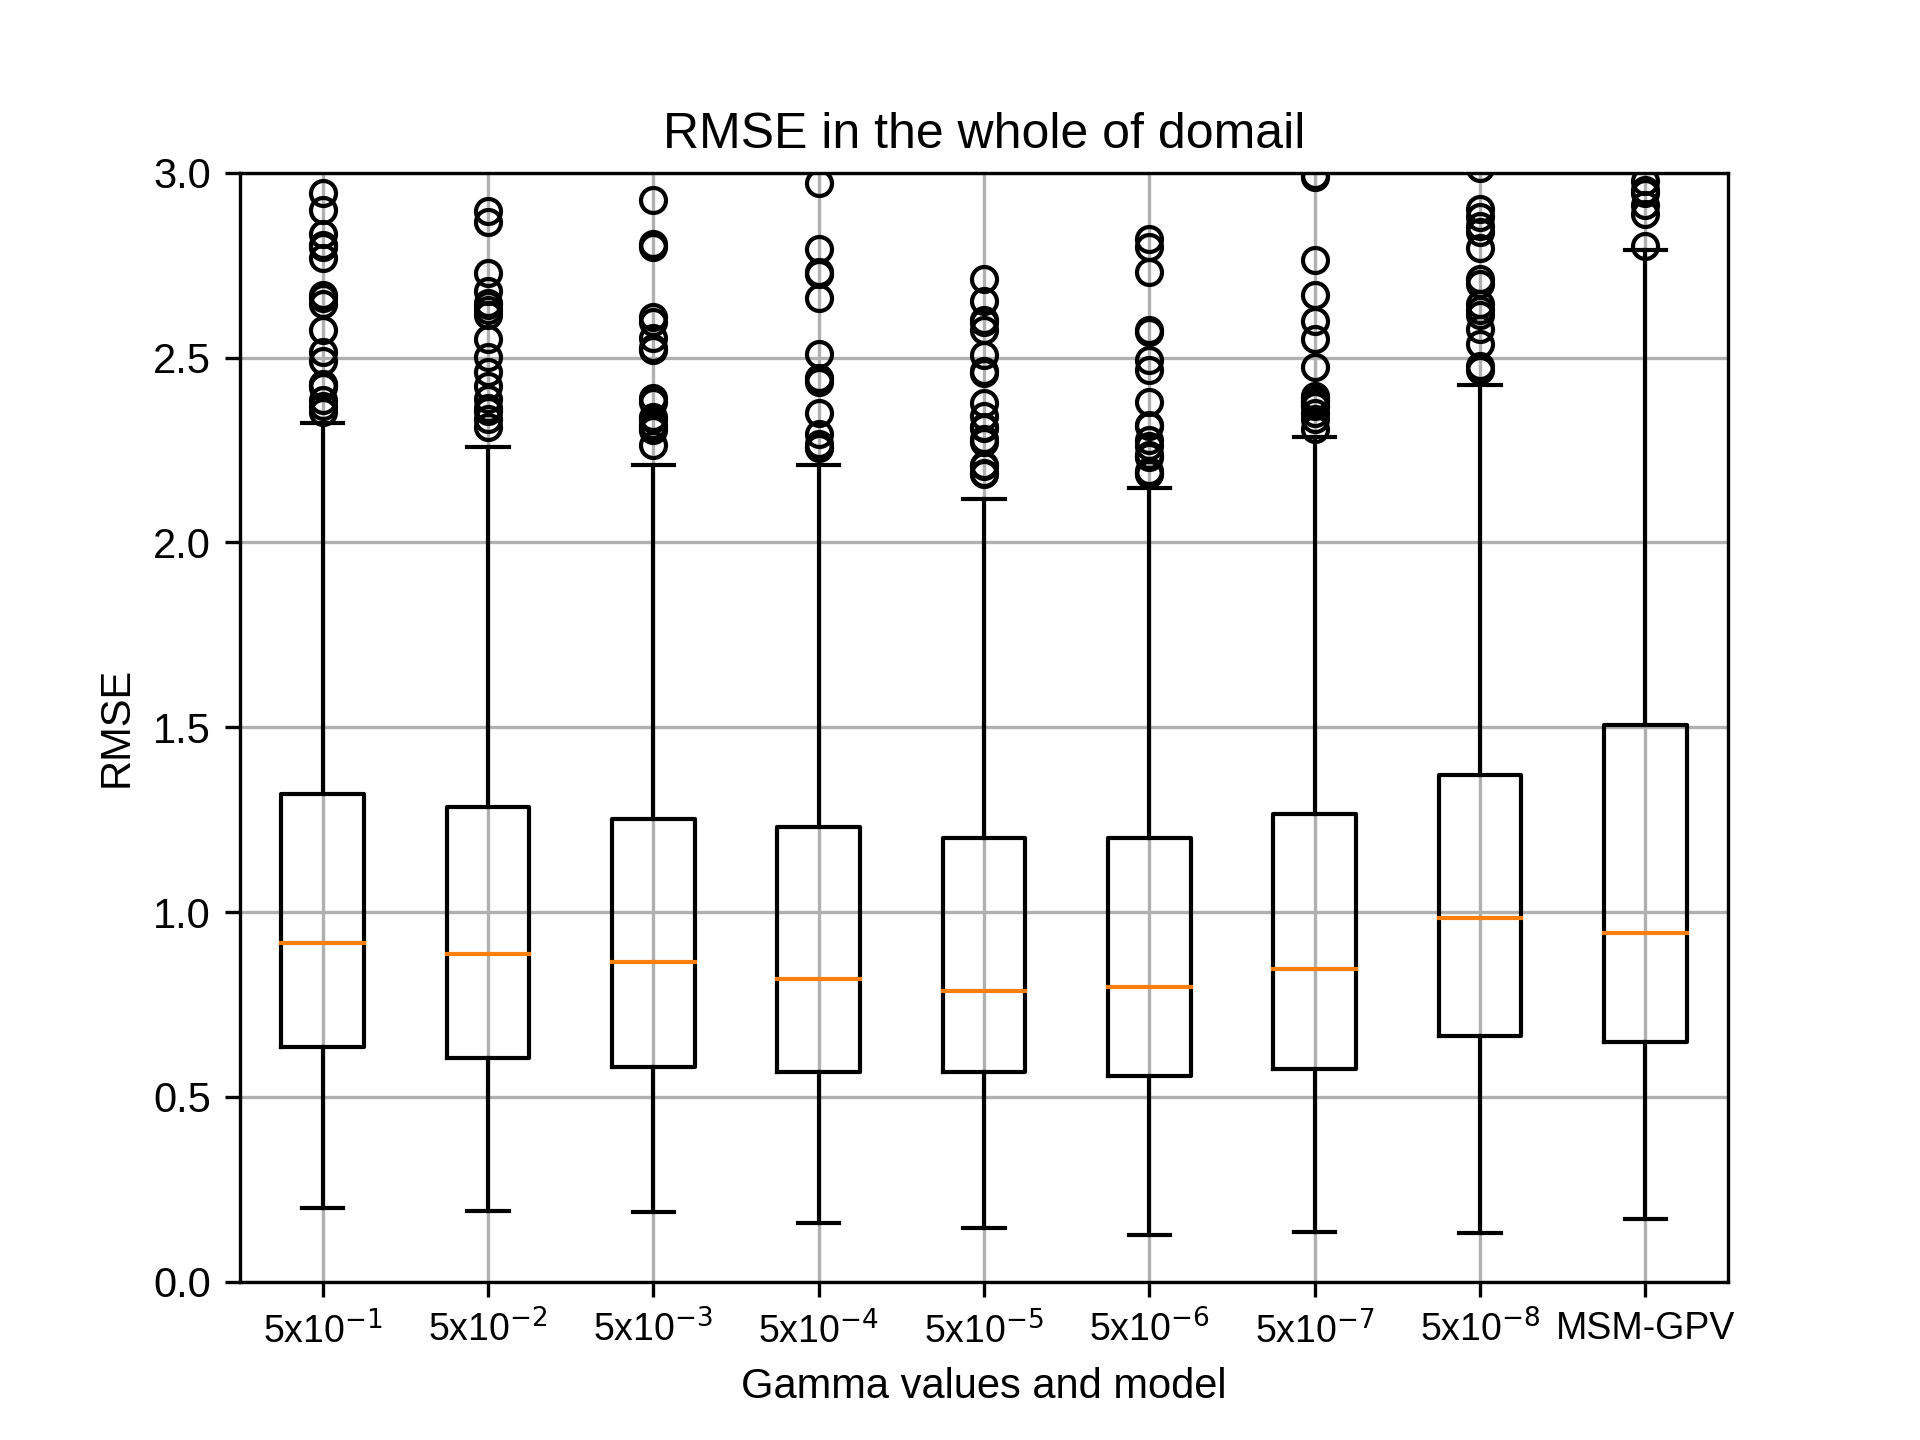
10月のsiteC,rg2=6の結果です。
kobayashi_yusukeMonday, November 16th, 2020 at 5:26:20 PM GMT+09:00
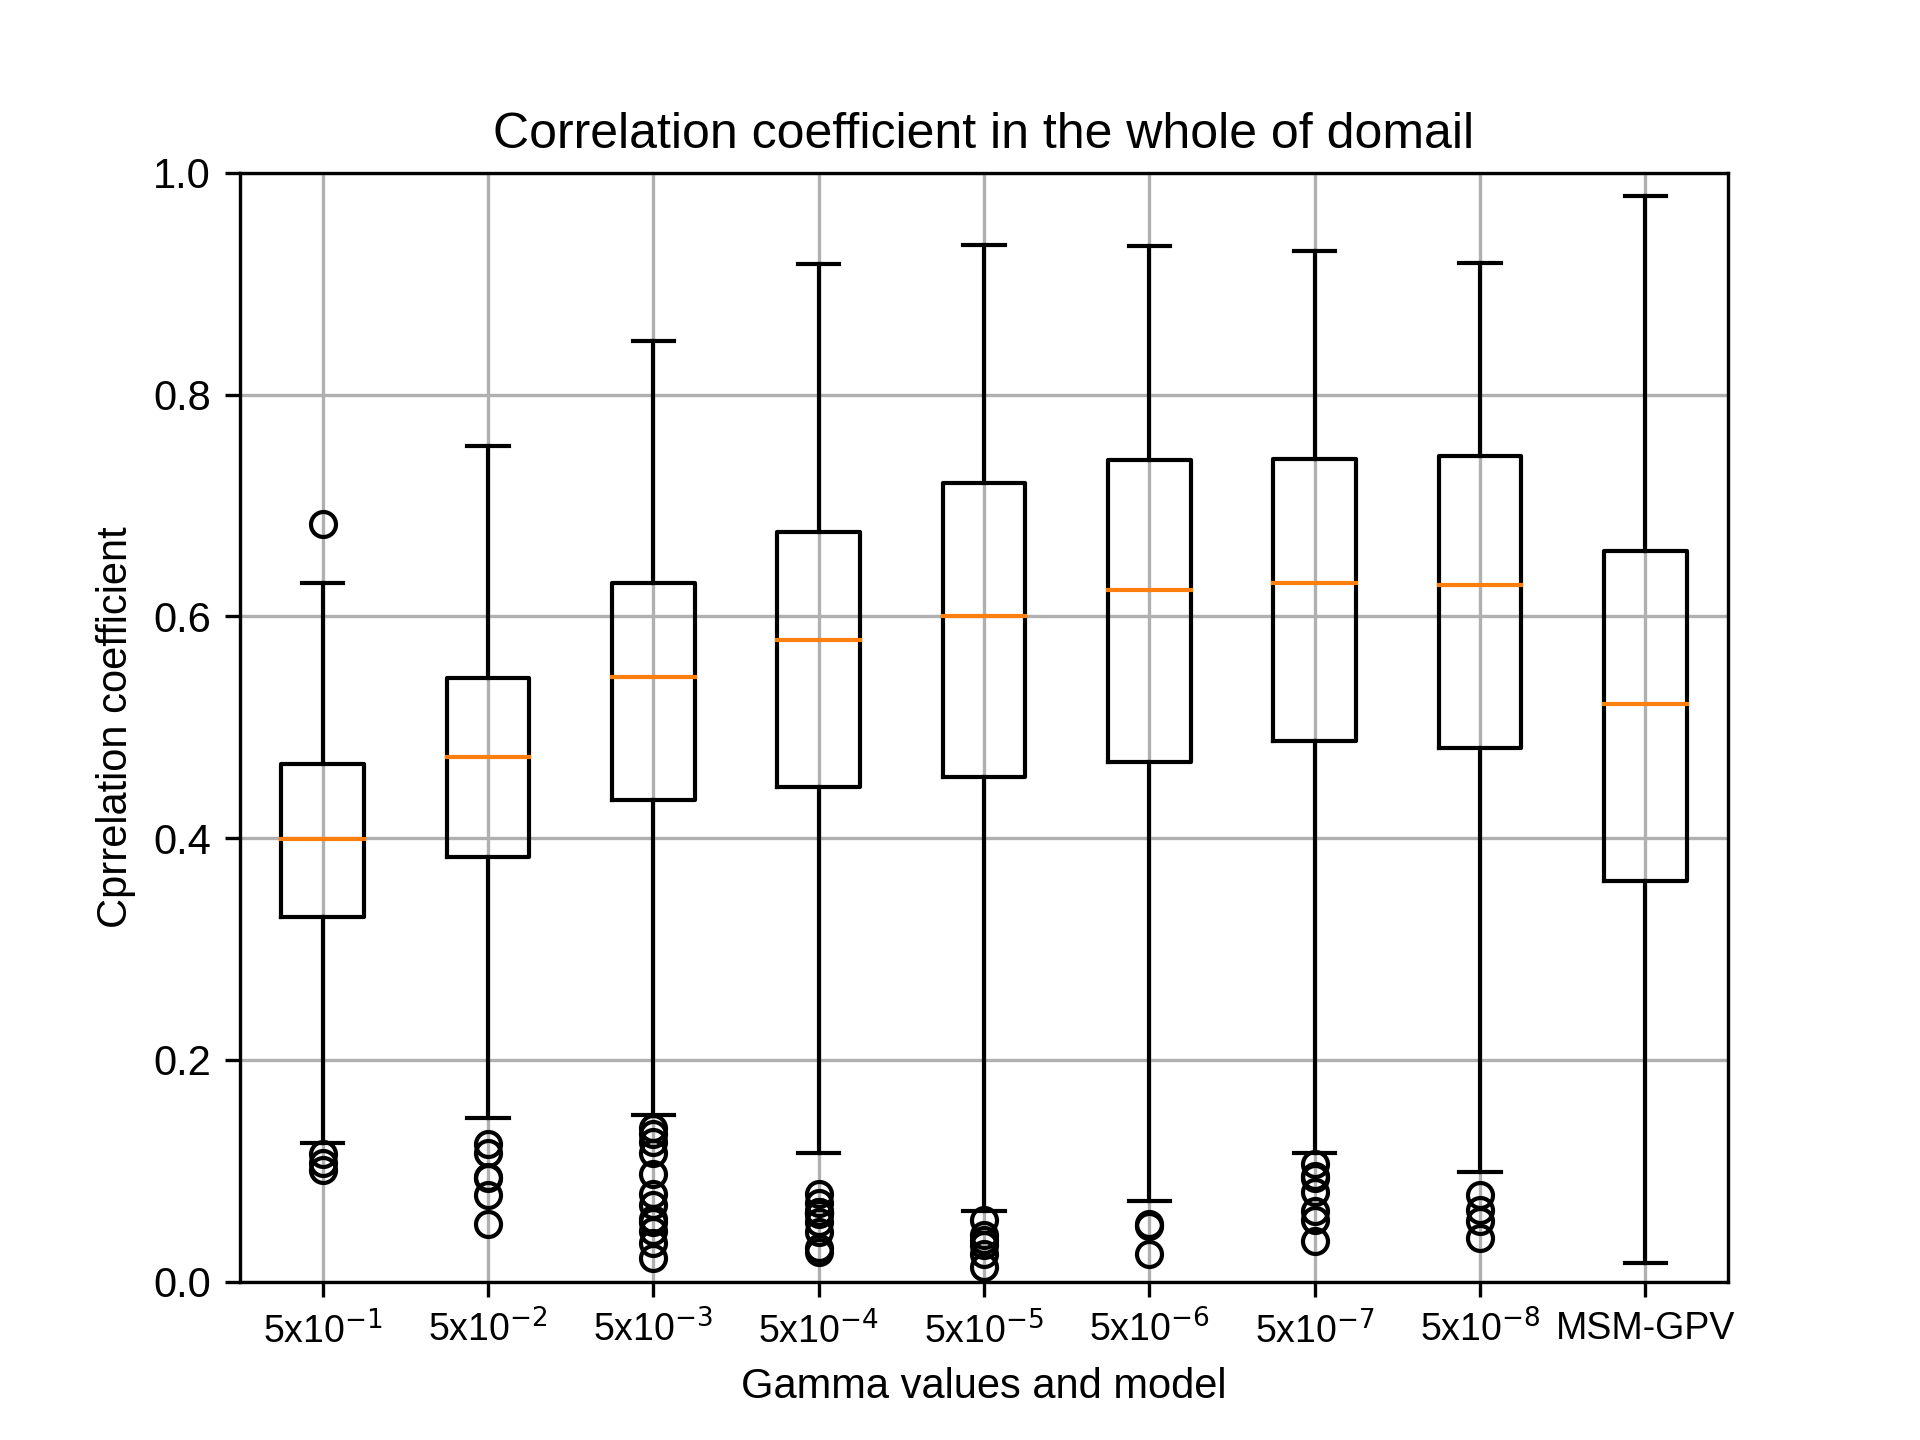
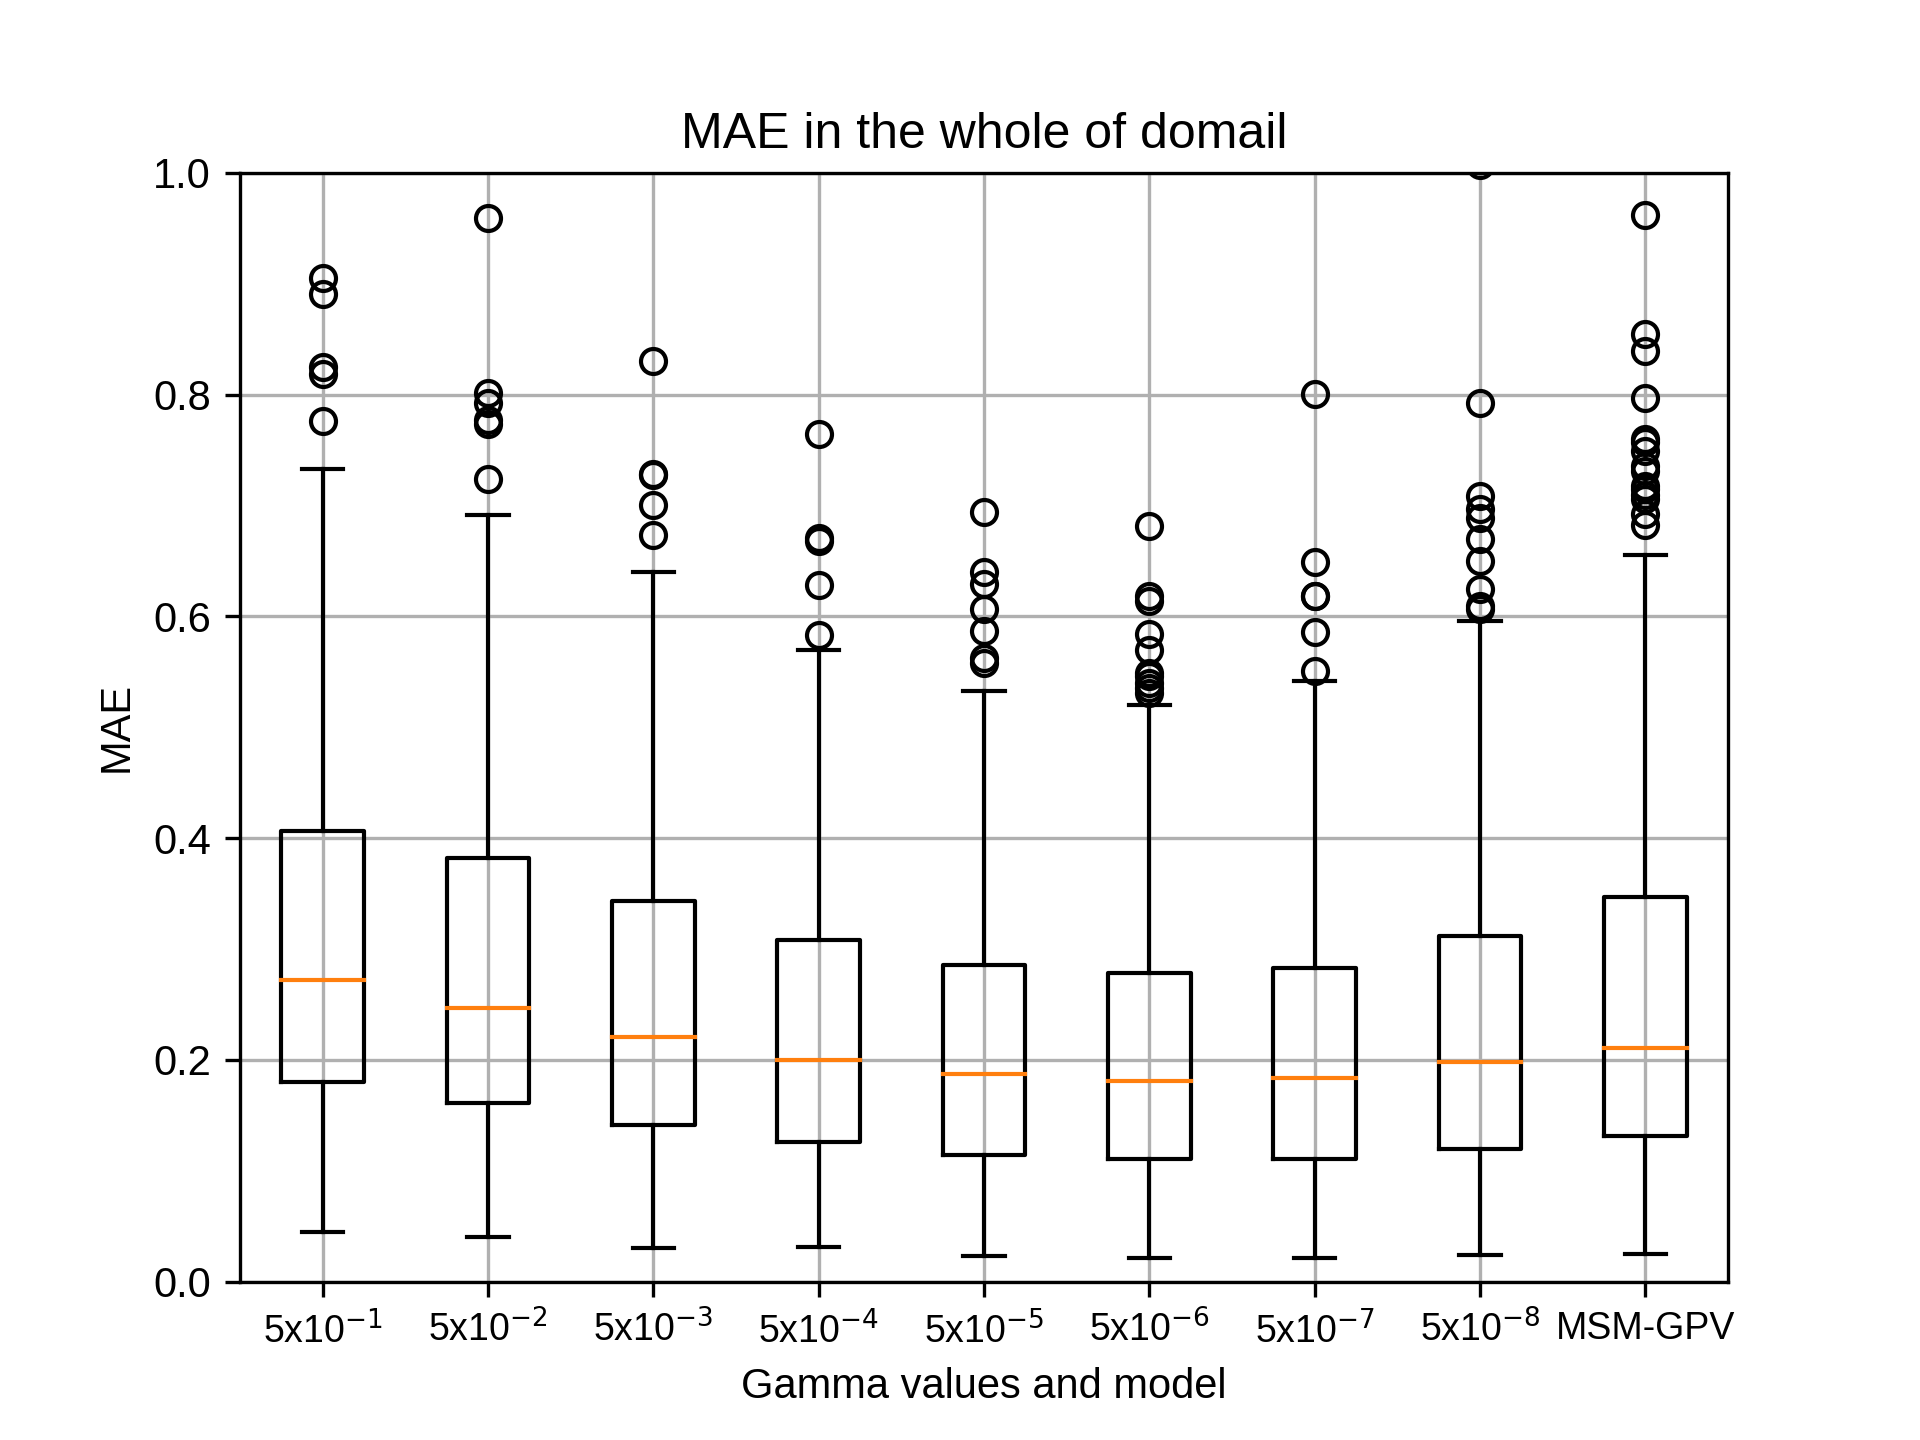
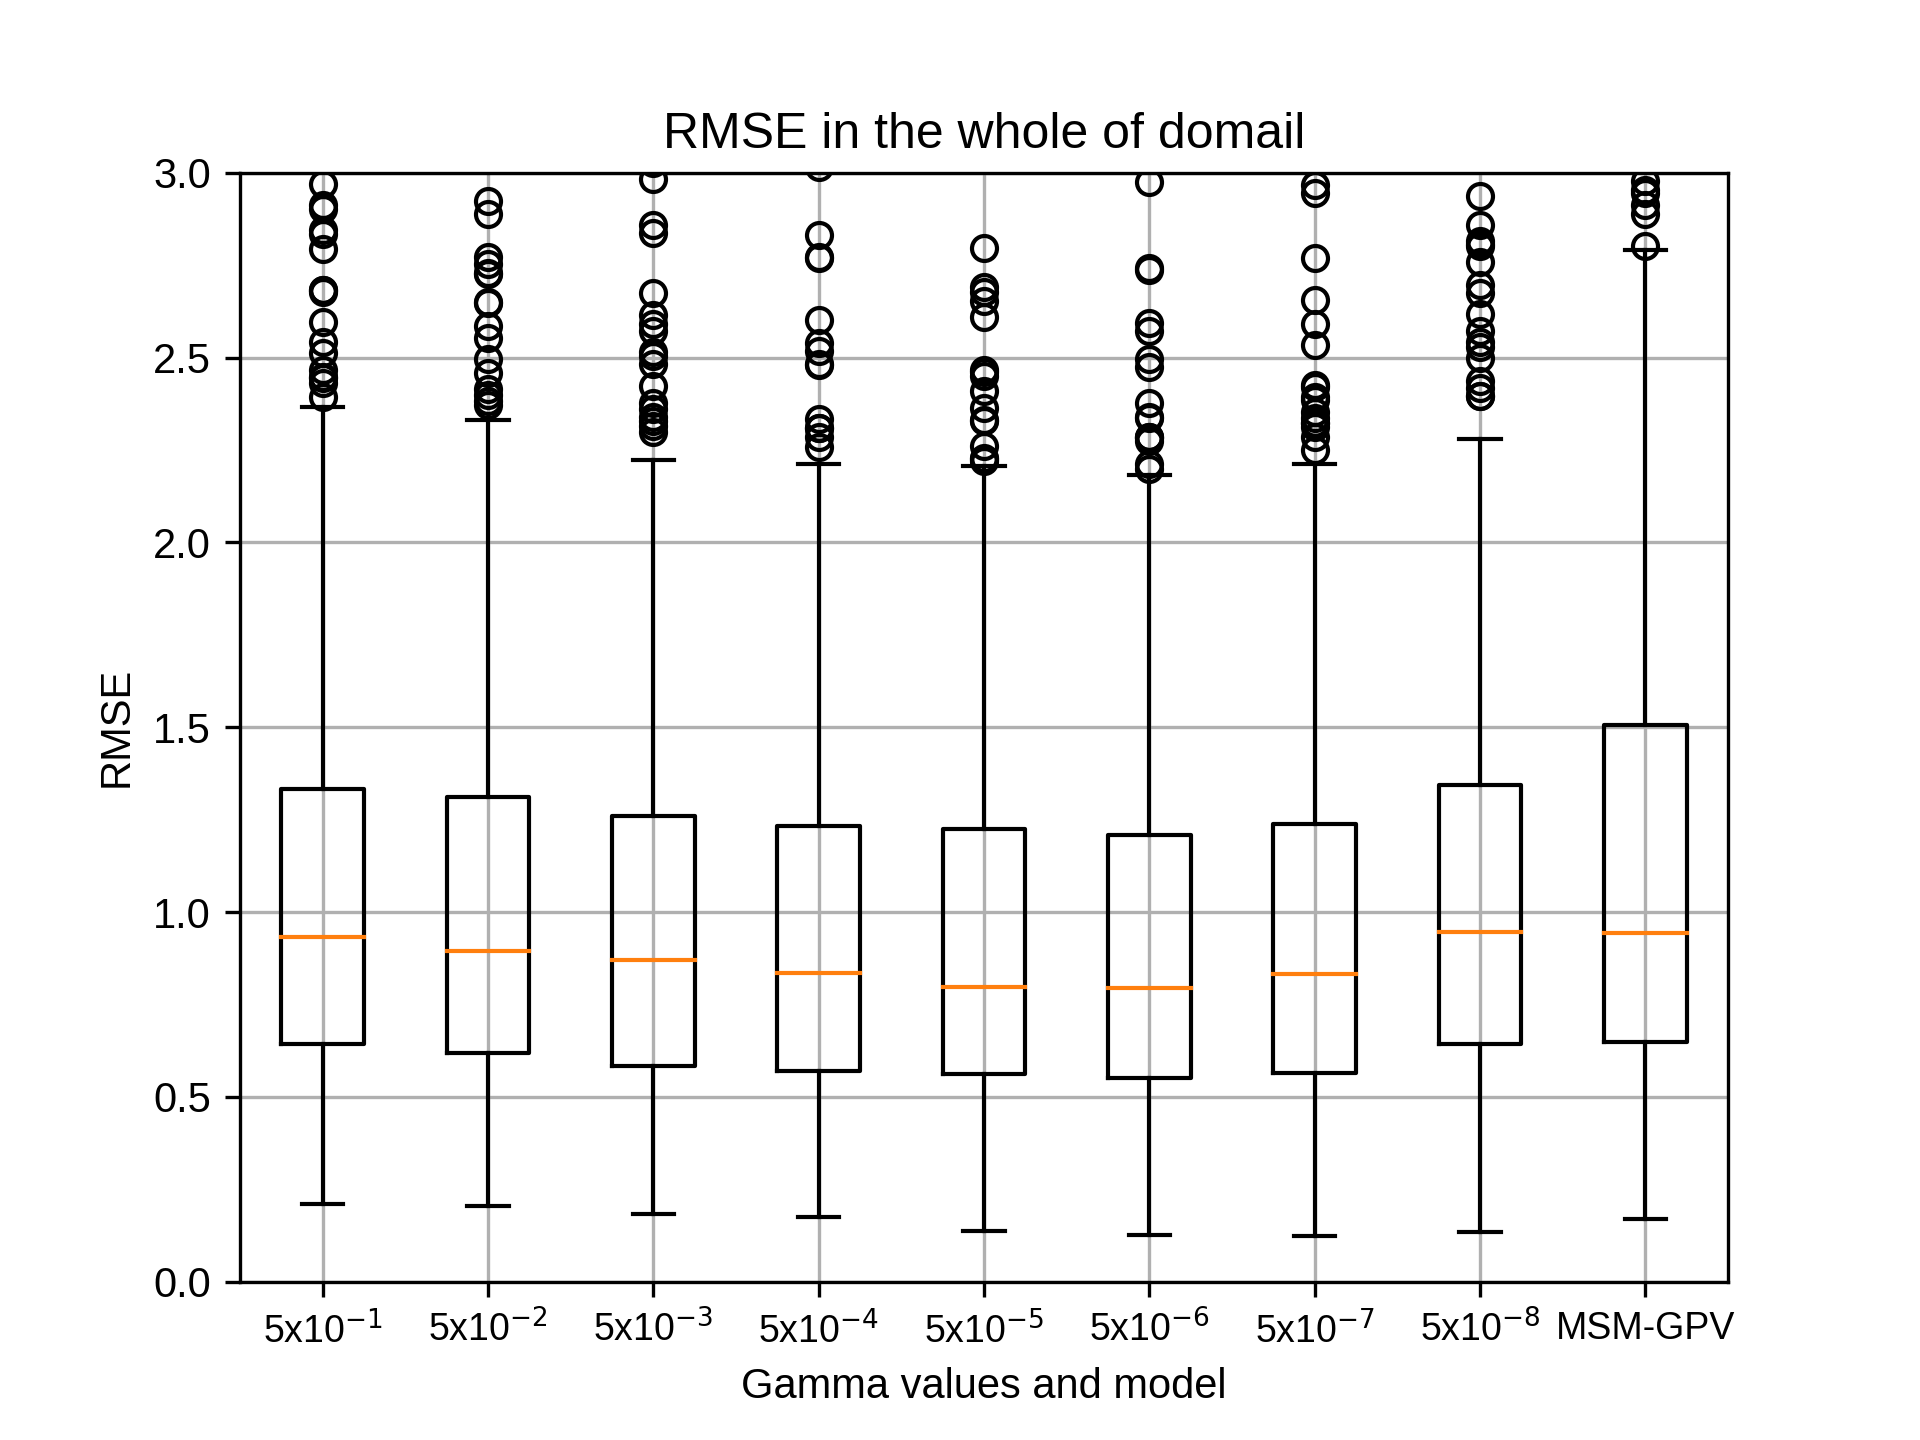
10月のsiteC,rg2=8の結果です。
kobayashi_yusukeMonday, November 16th, 2020 at 5:26:40 PM GMT+09:00


10月のsiteC,rg2=10の結果です。
kobayashi_yusukeMonday, November 16th, 2020 at 5:27:00 PM GMT+09:00
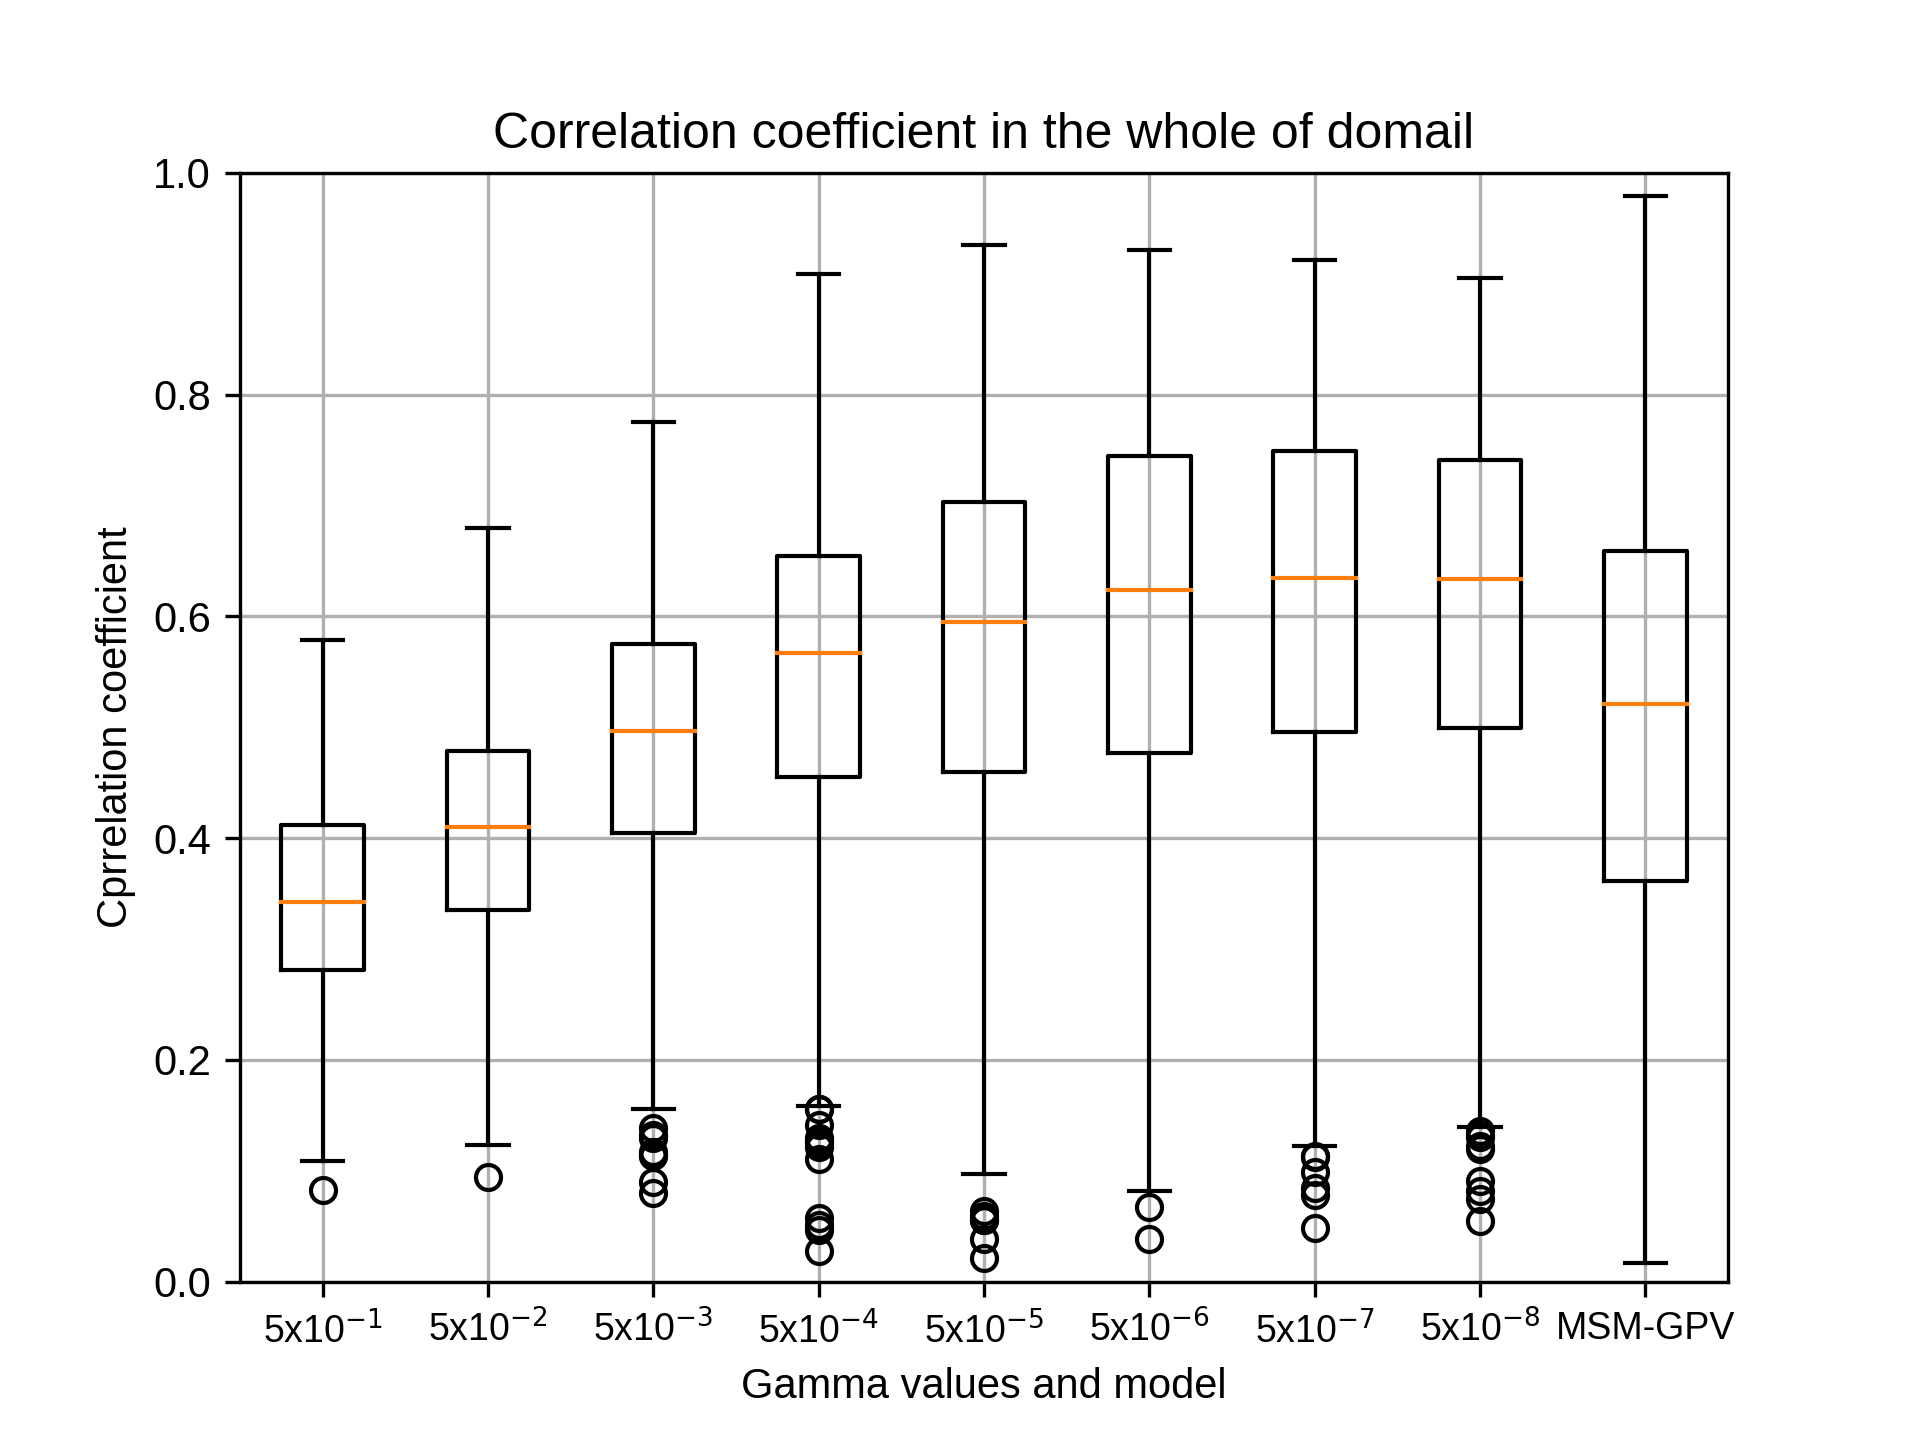
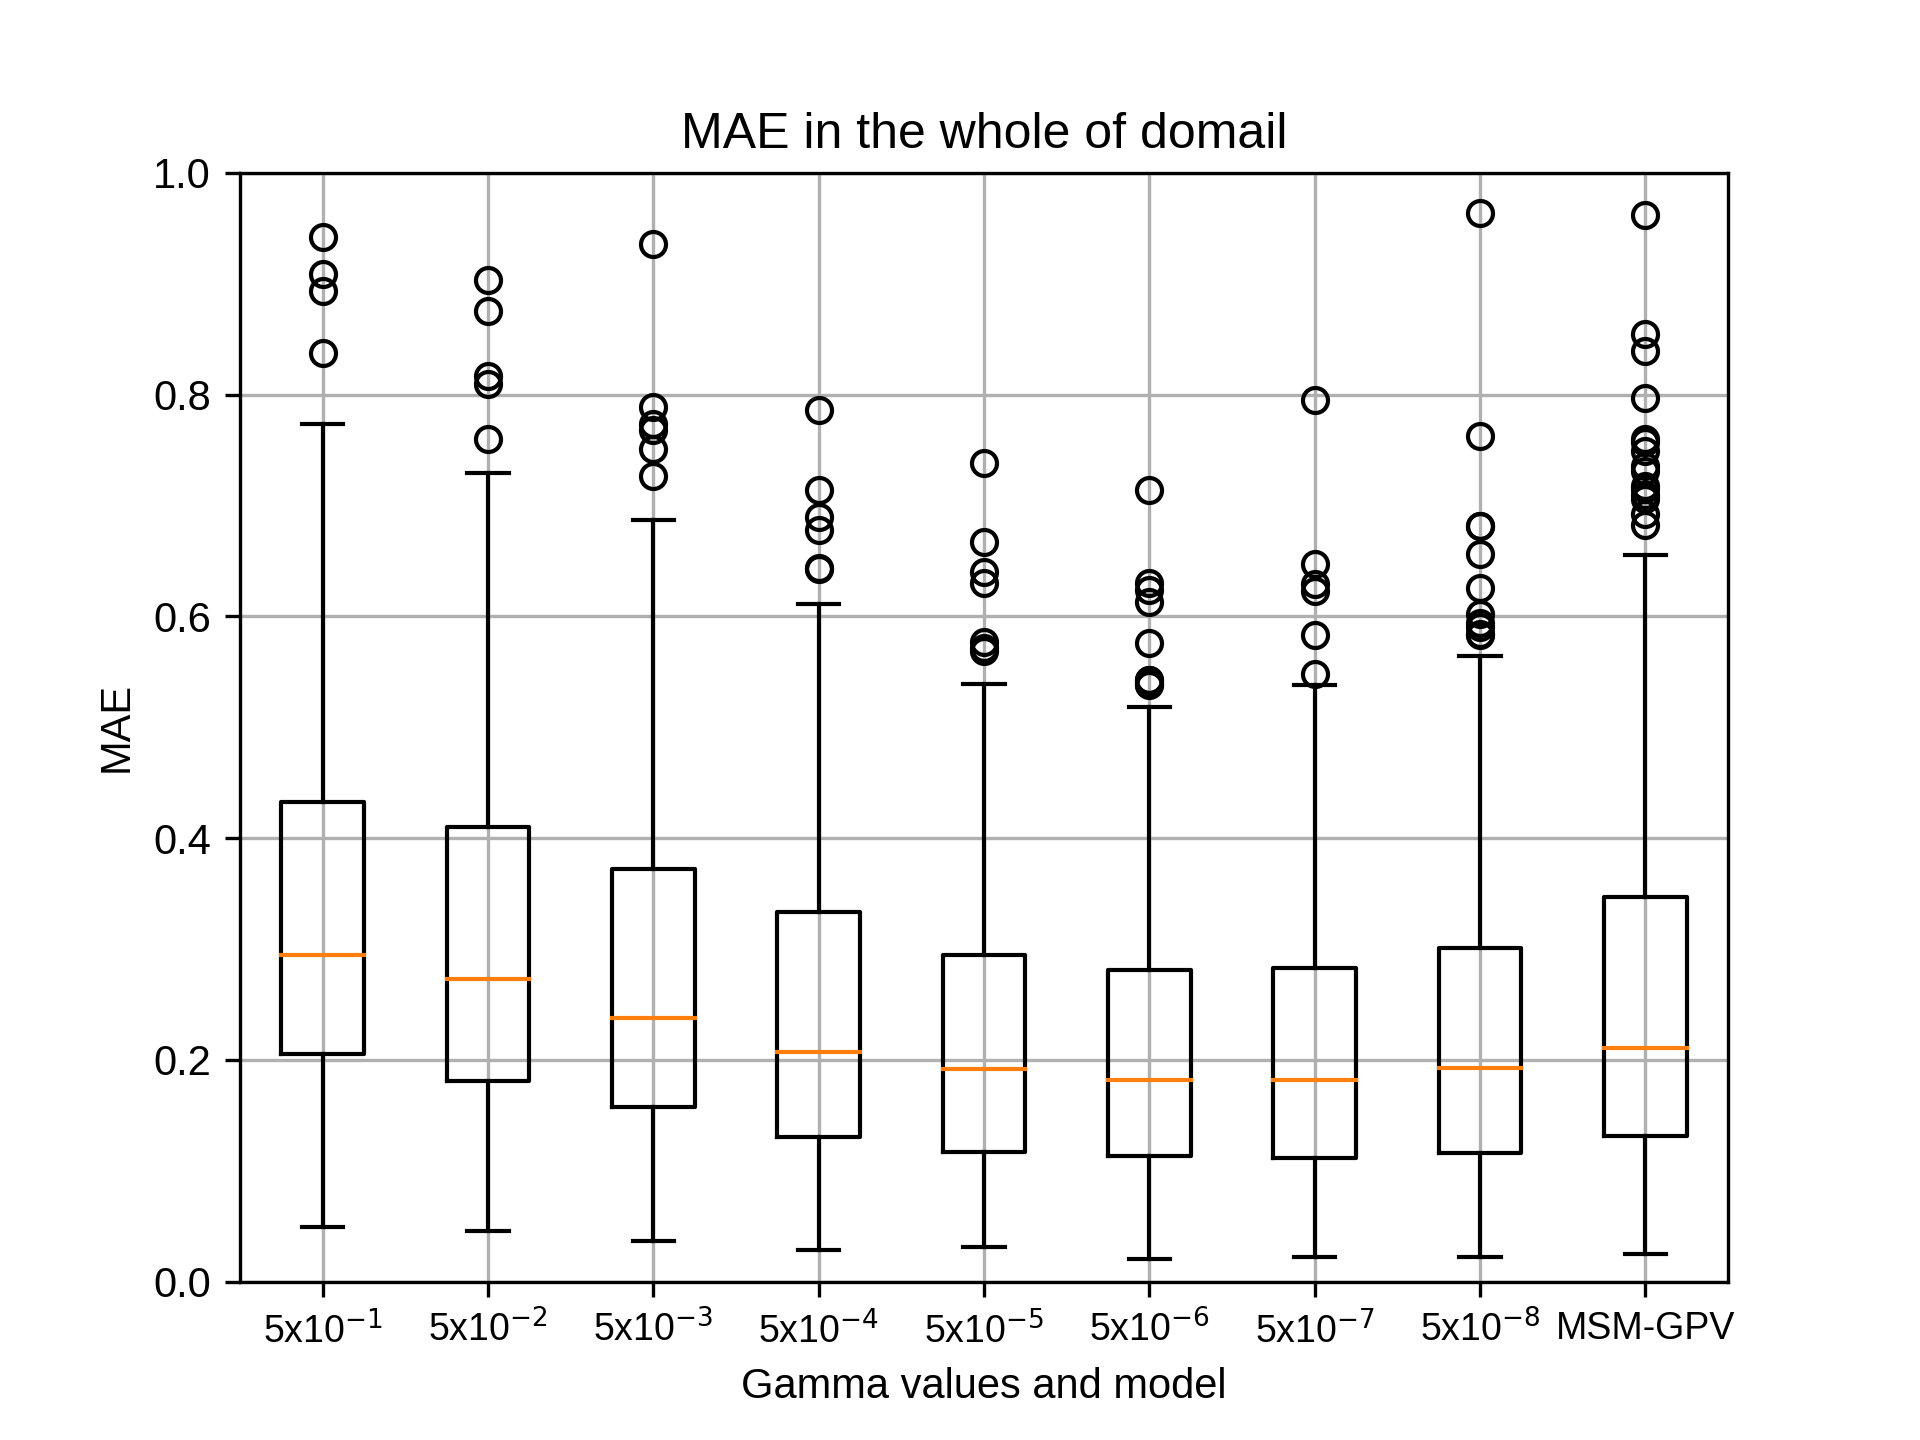
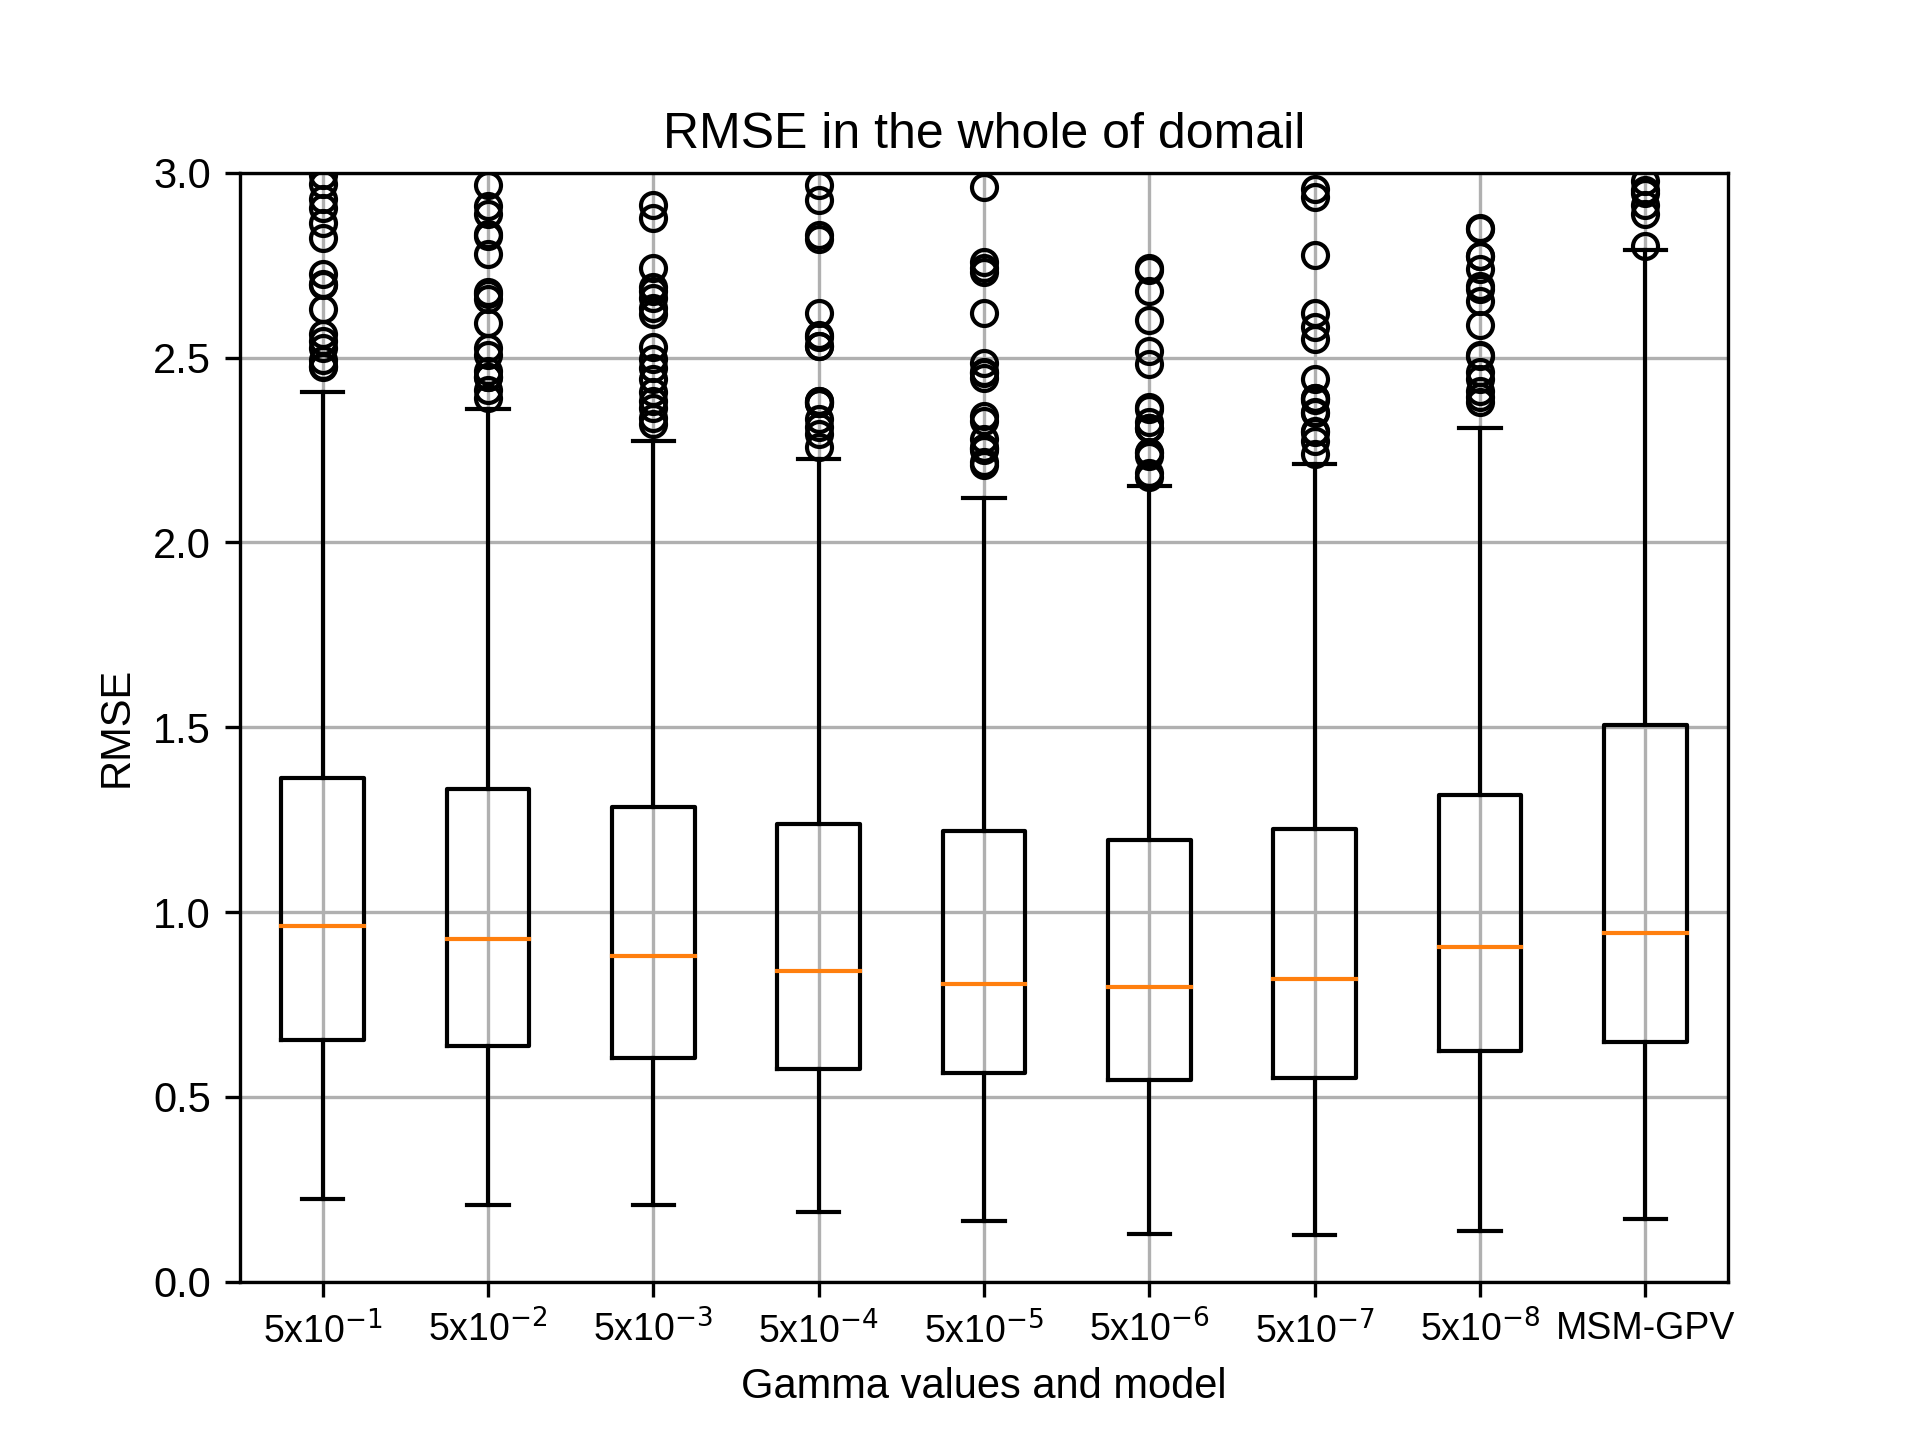
10月のsiteC,rg2=12の結果です。
10月のsiteCではrg2=12でgammaが5x10⁻⁷のとき、相関係数の中央値が最も高くなりました。
10月のsiteCではrg2=12でgammaが5x10⁻⁷のとき、相関係数の中央値が最も高くなりました。
kobayashi_yusukeMonday, November 16th, 2020 at 5:27:22 PM GMT+09:00
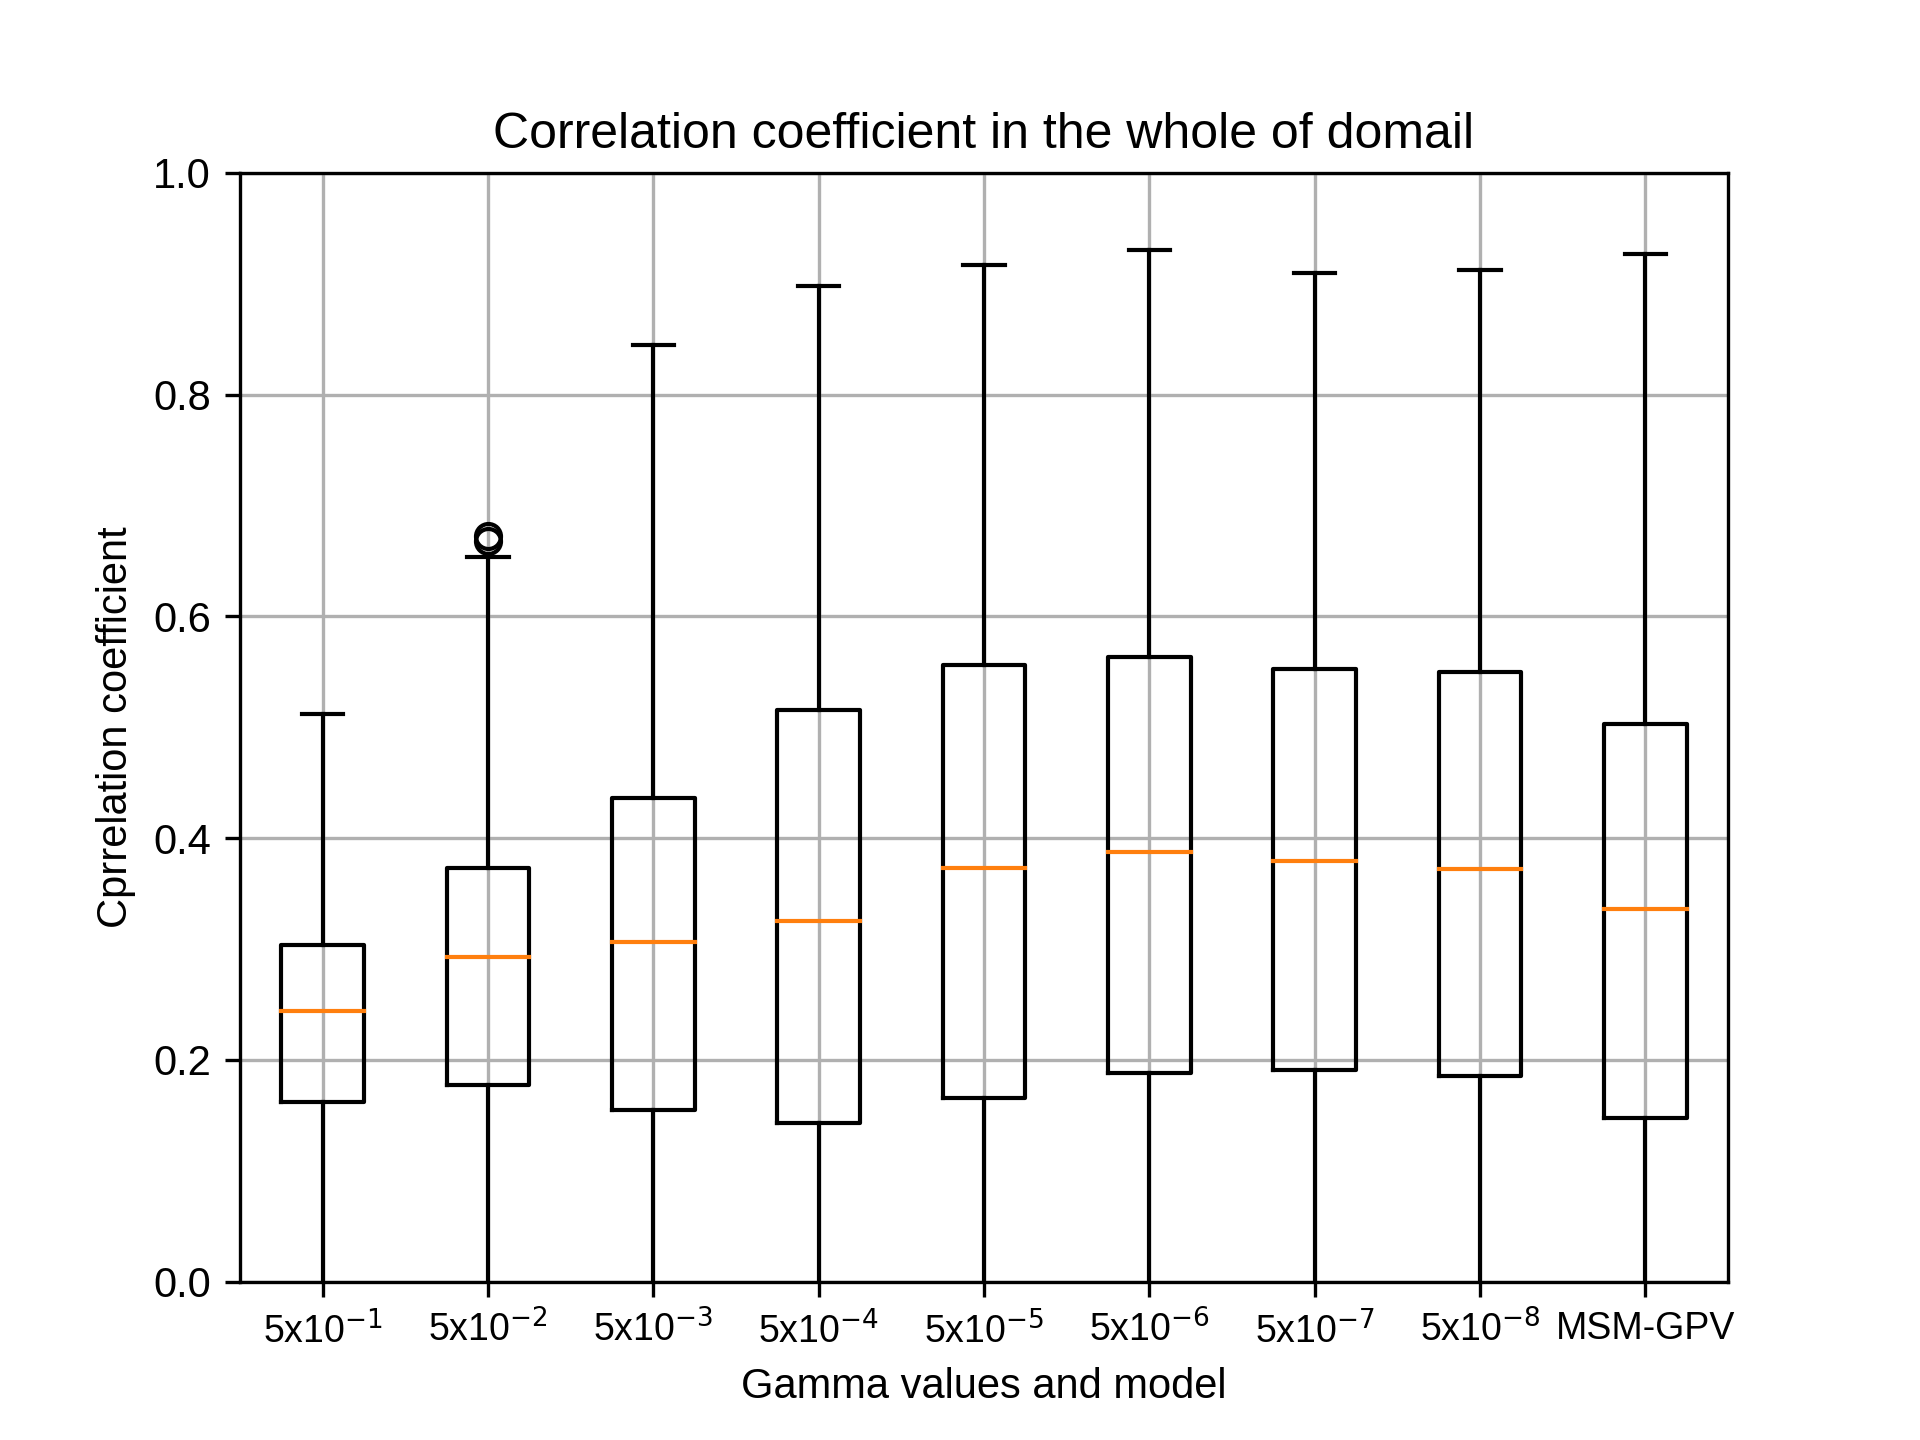
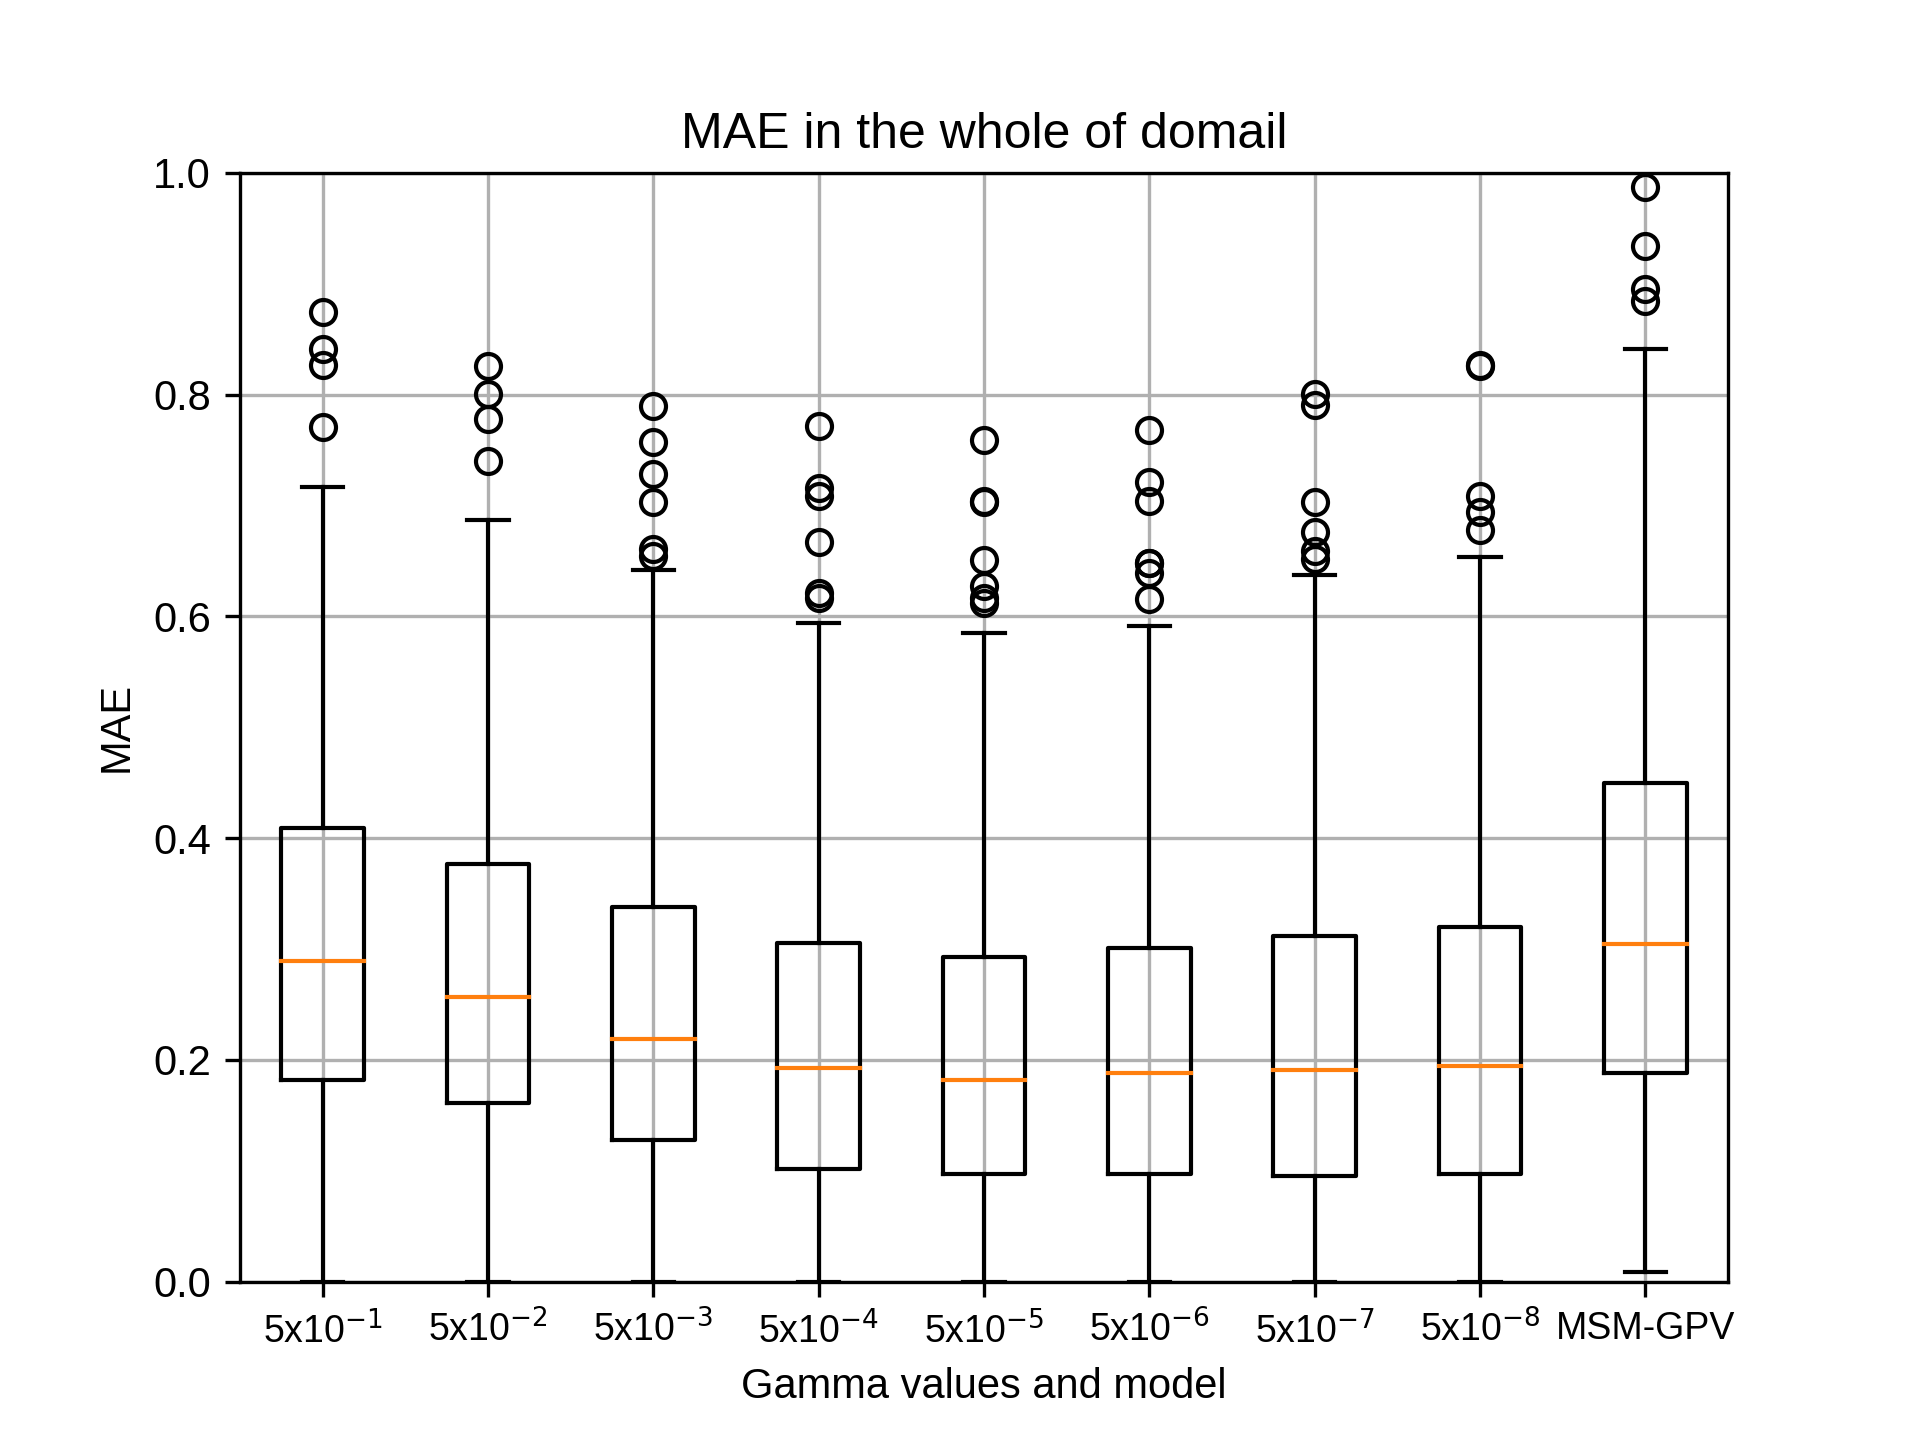
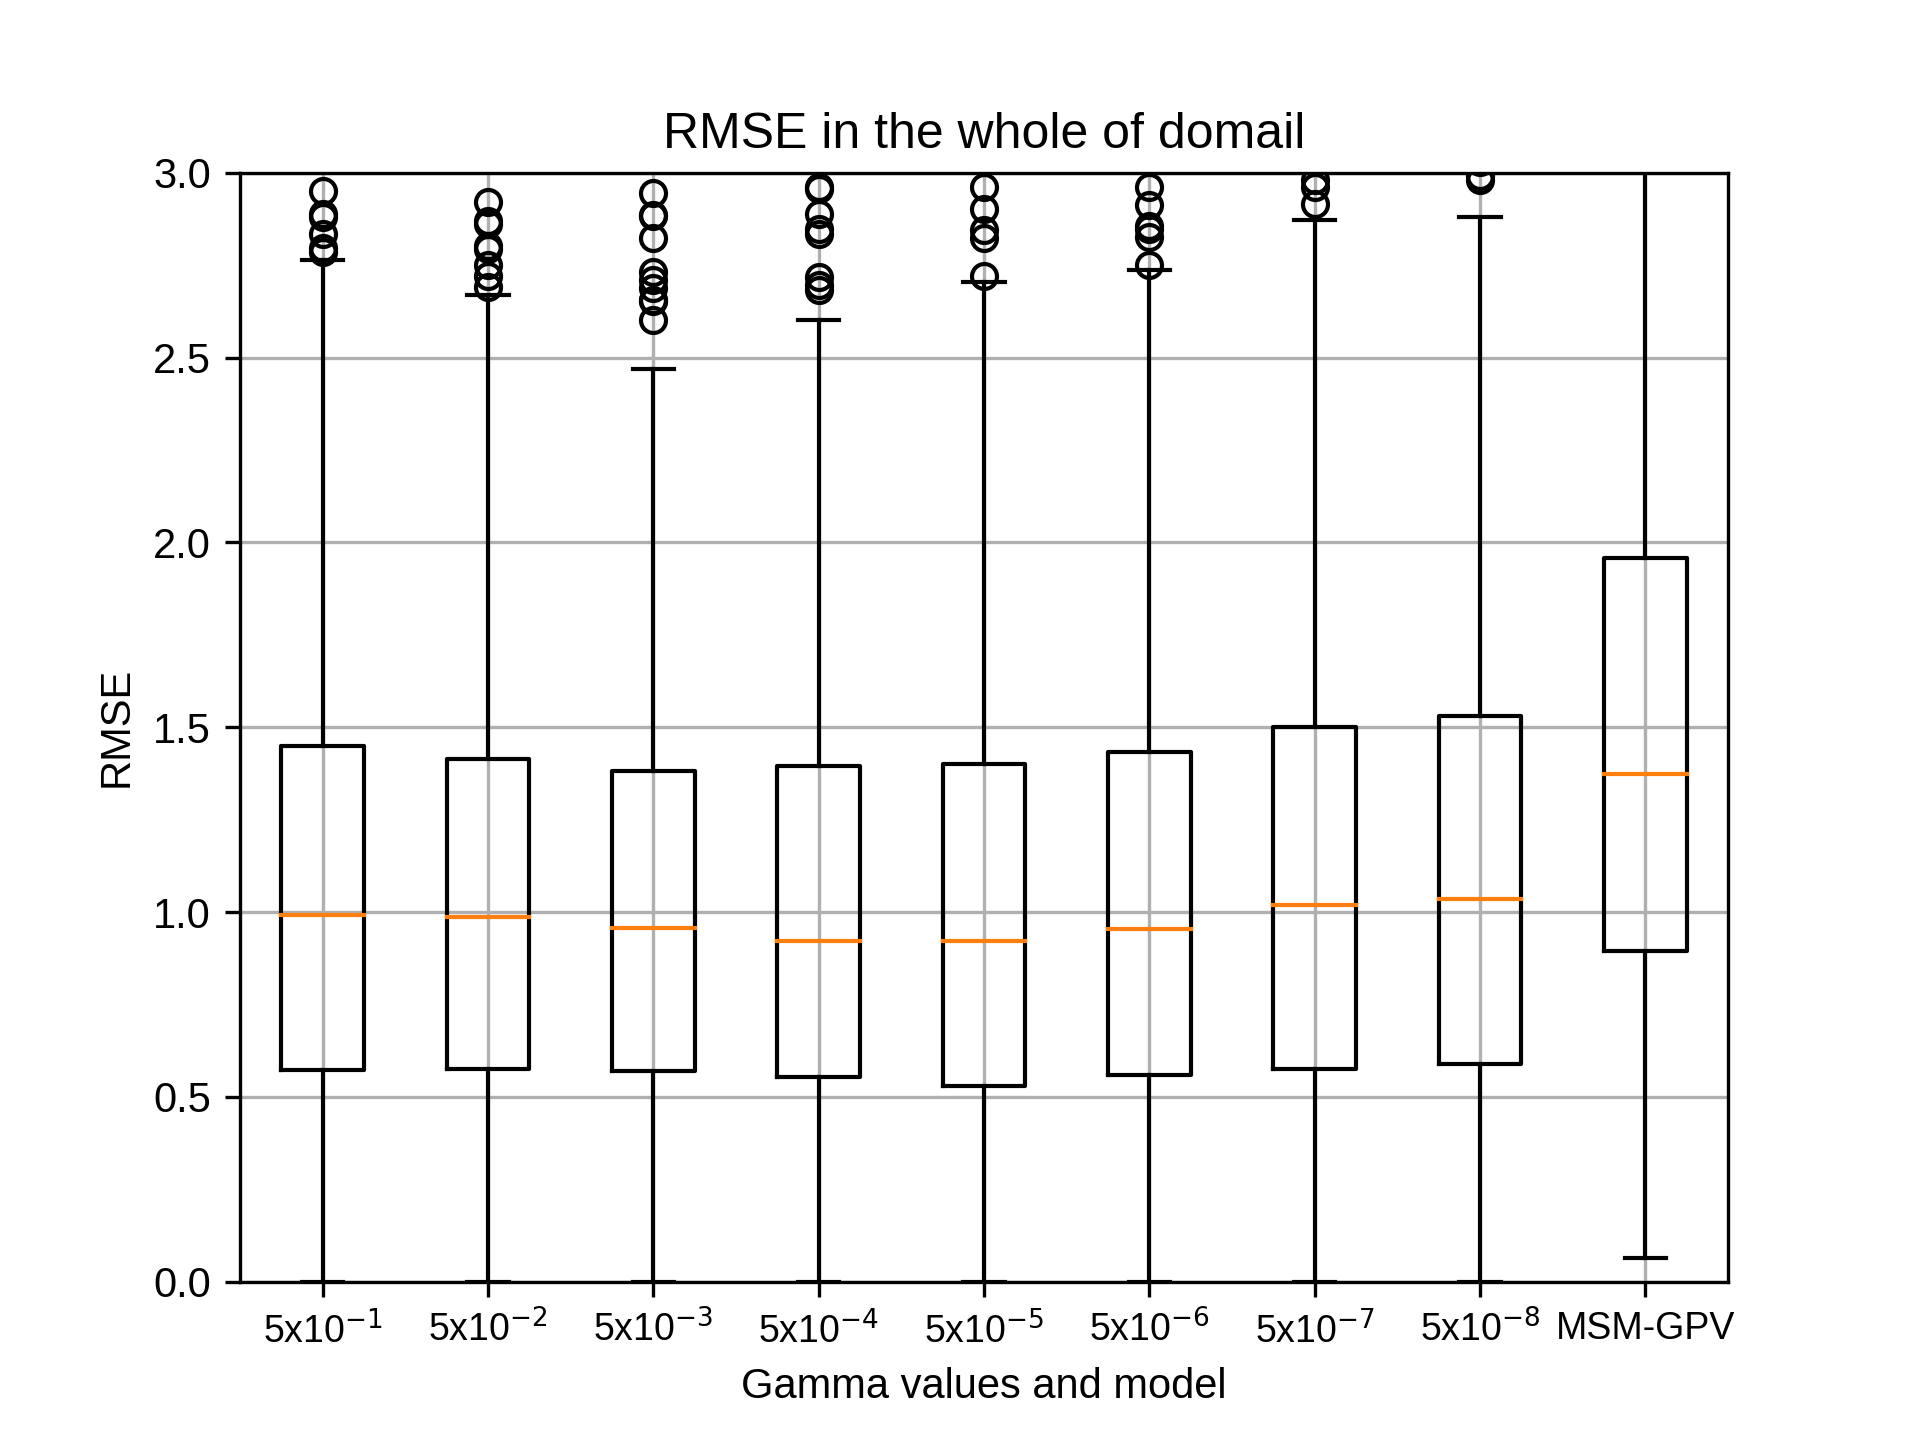
10月のsiteD,rg2=4の結果です。
kobayashi_yusukeMonday, November 16th, 2020 at 5:27:40 PM GMT+09:00
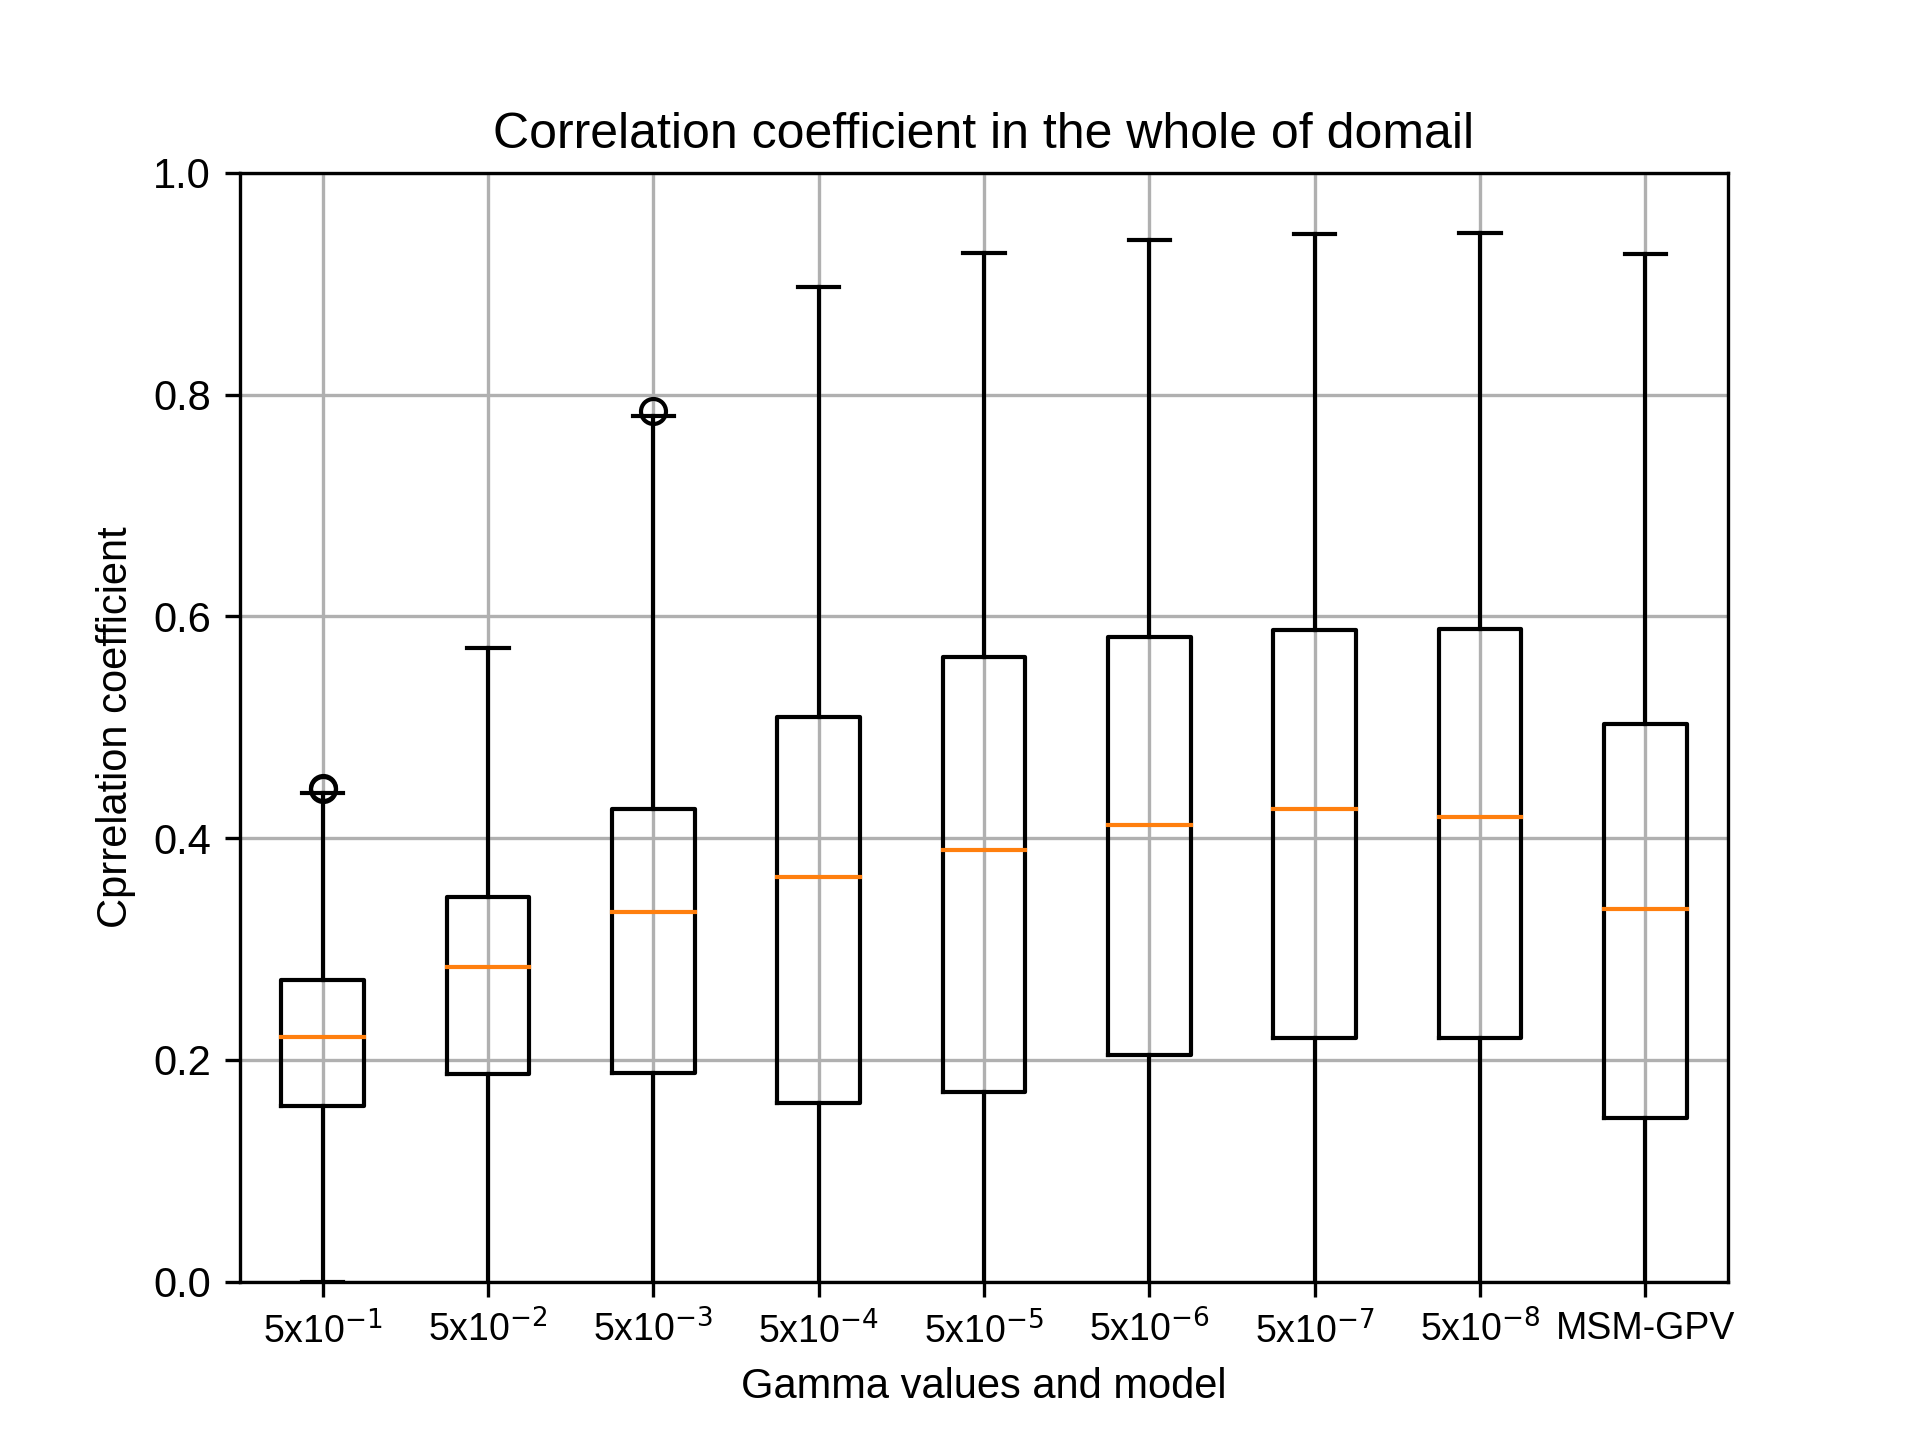
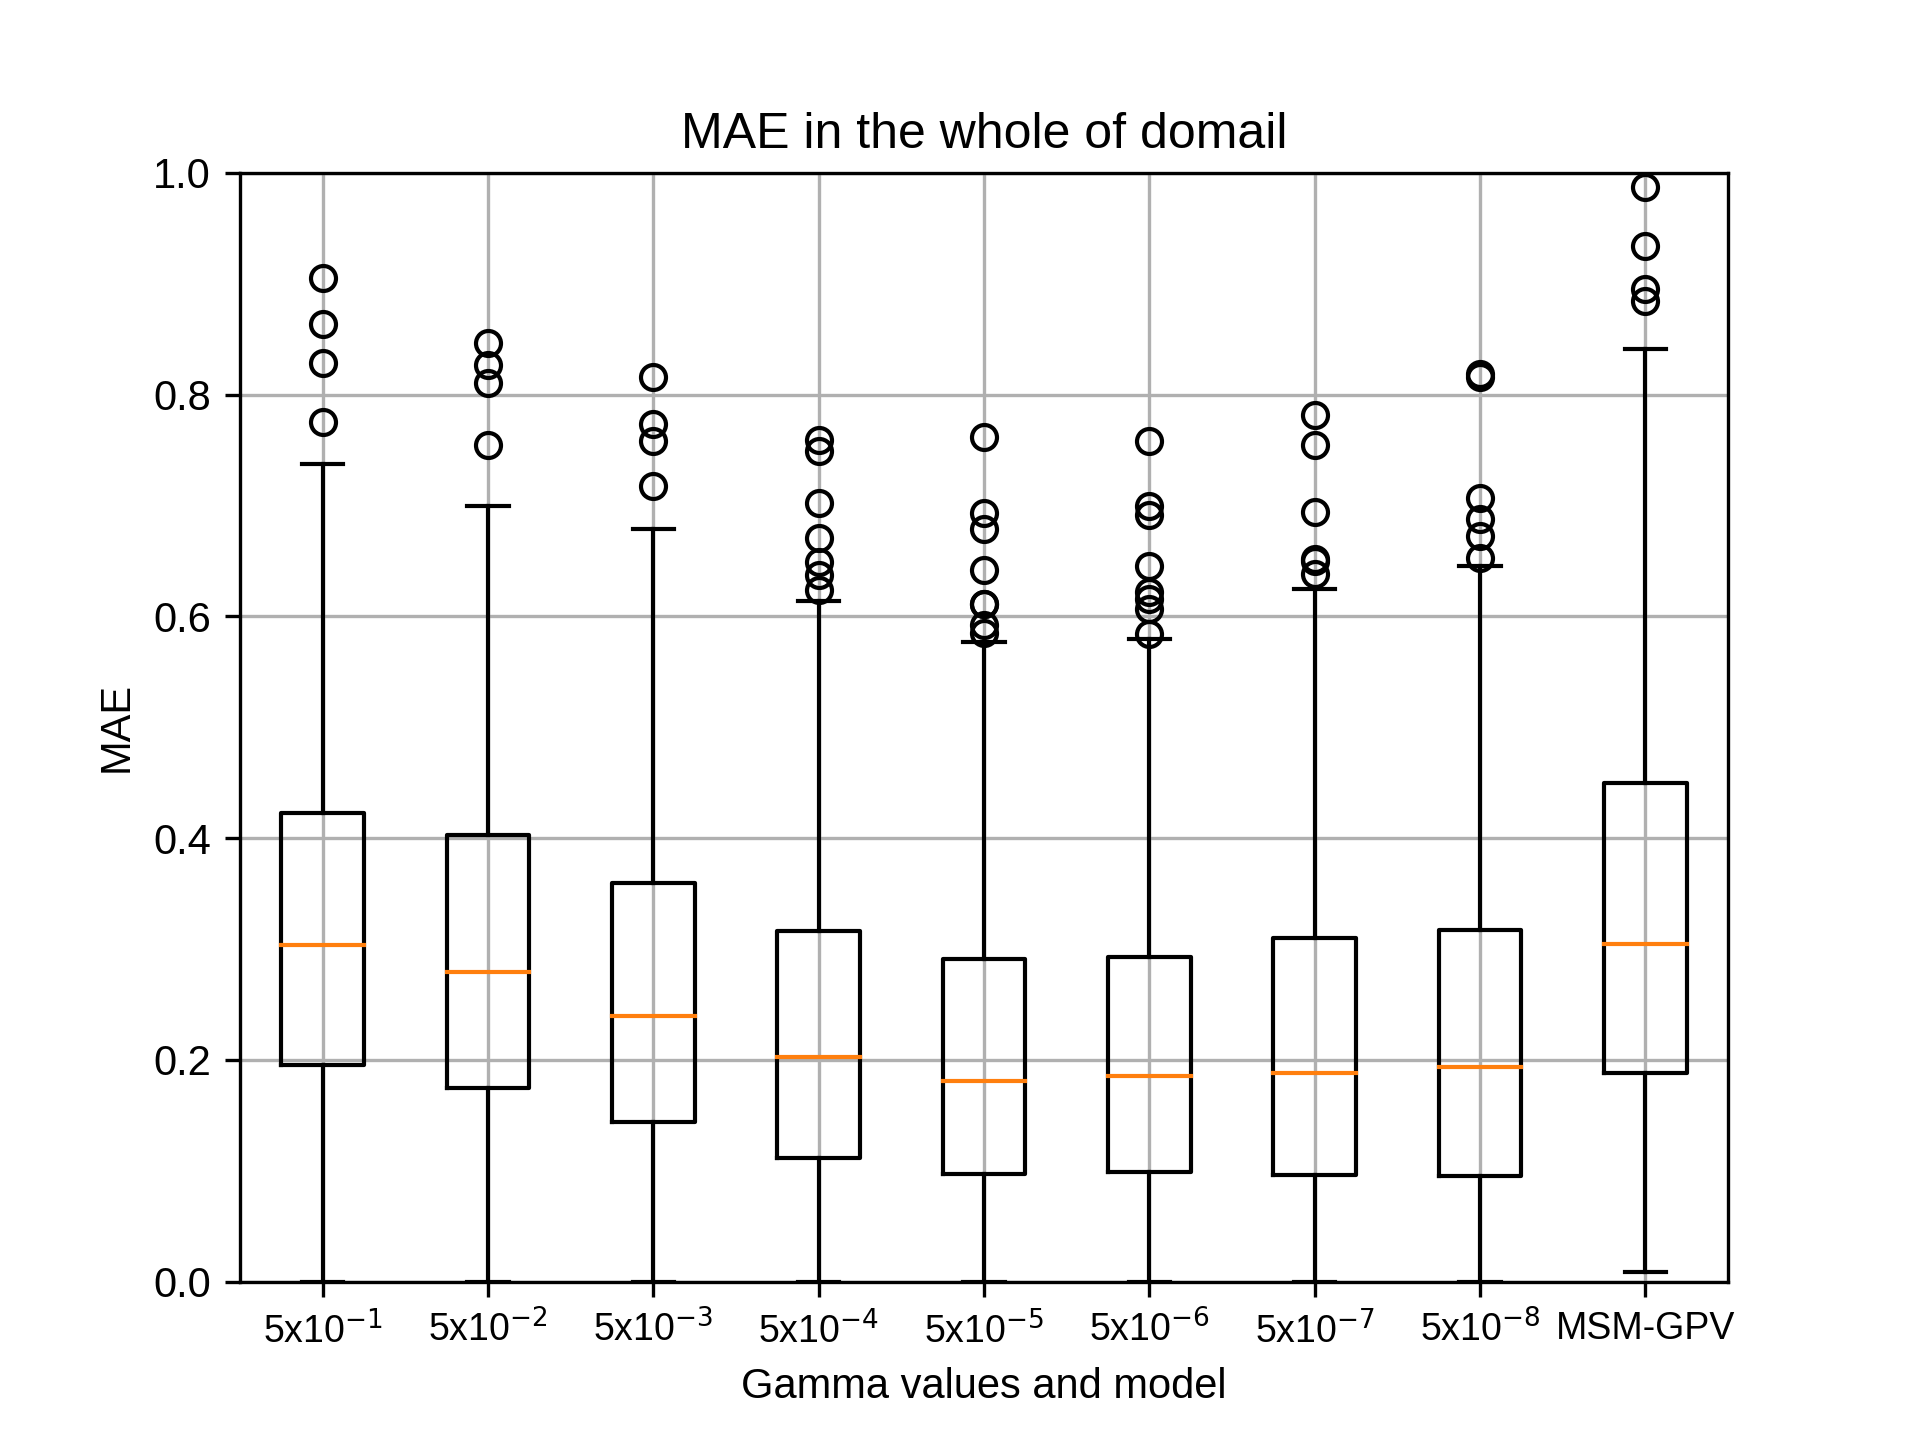
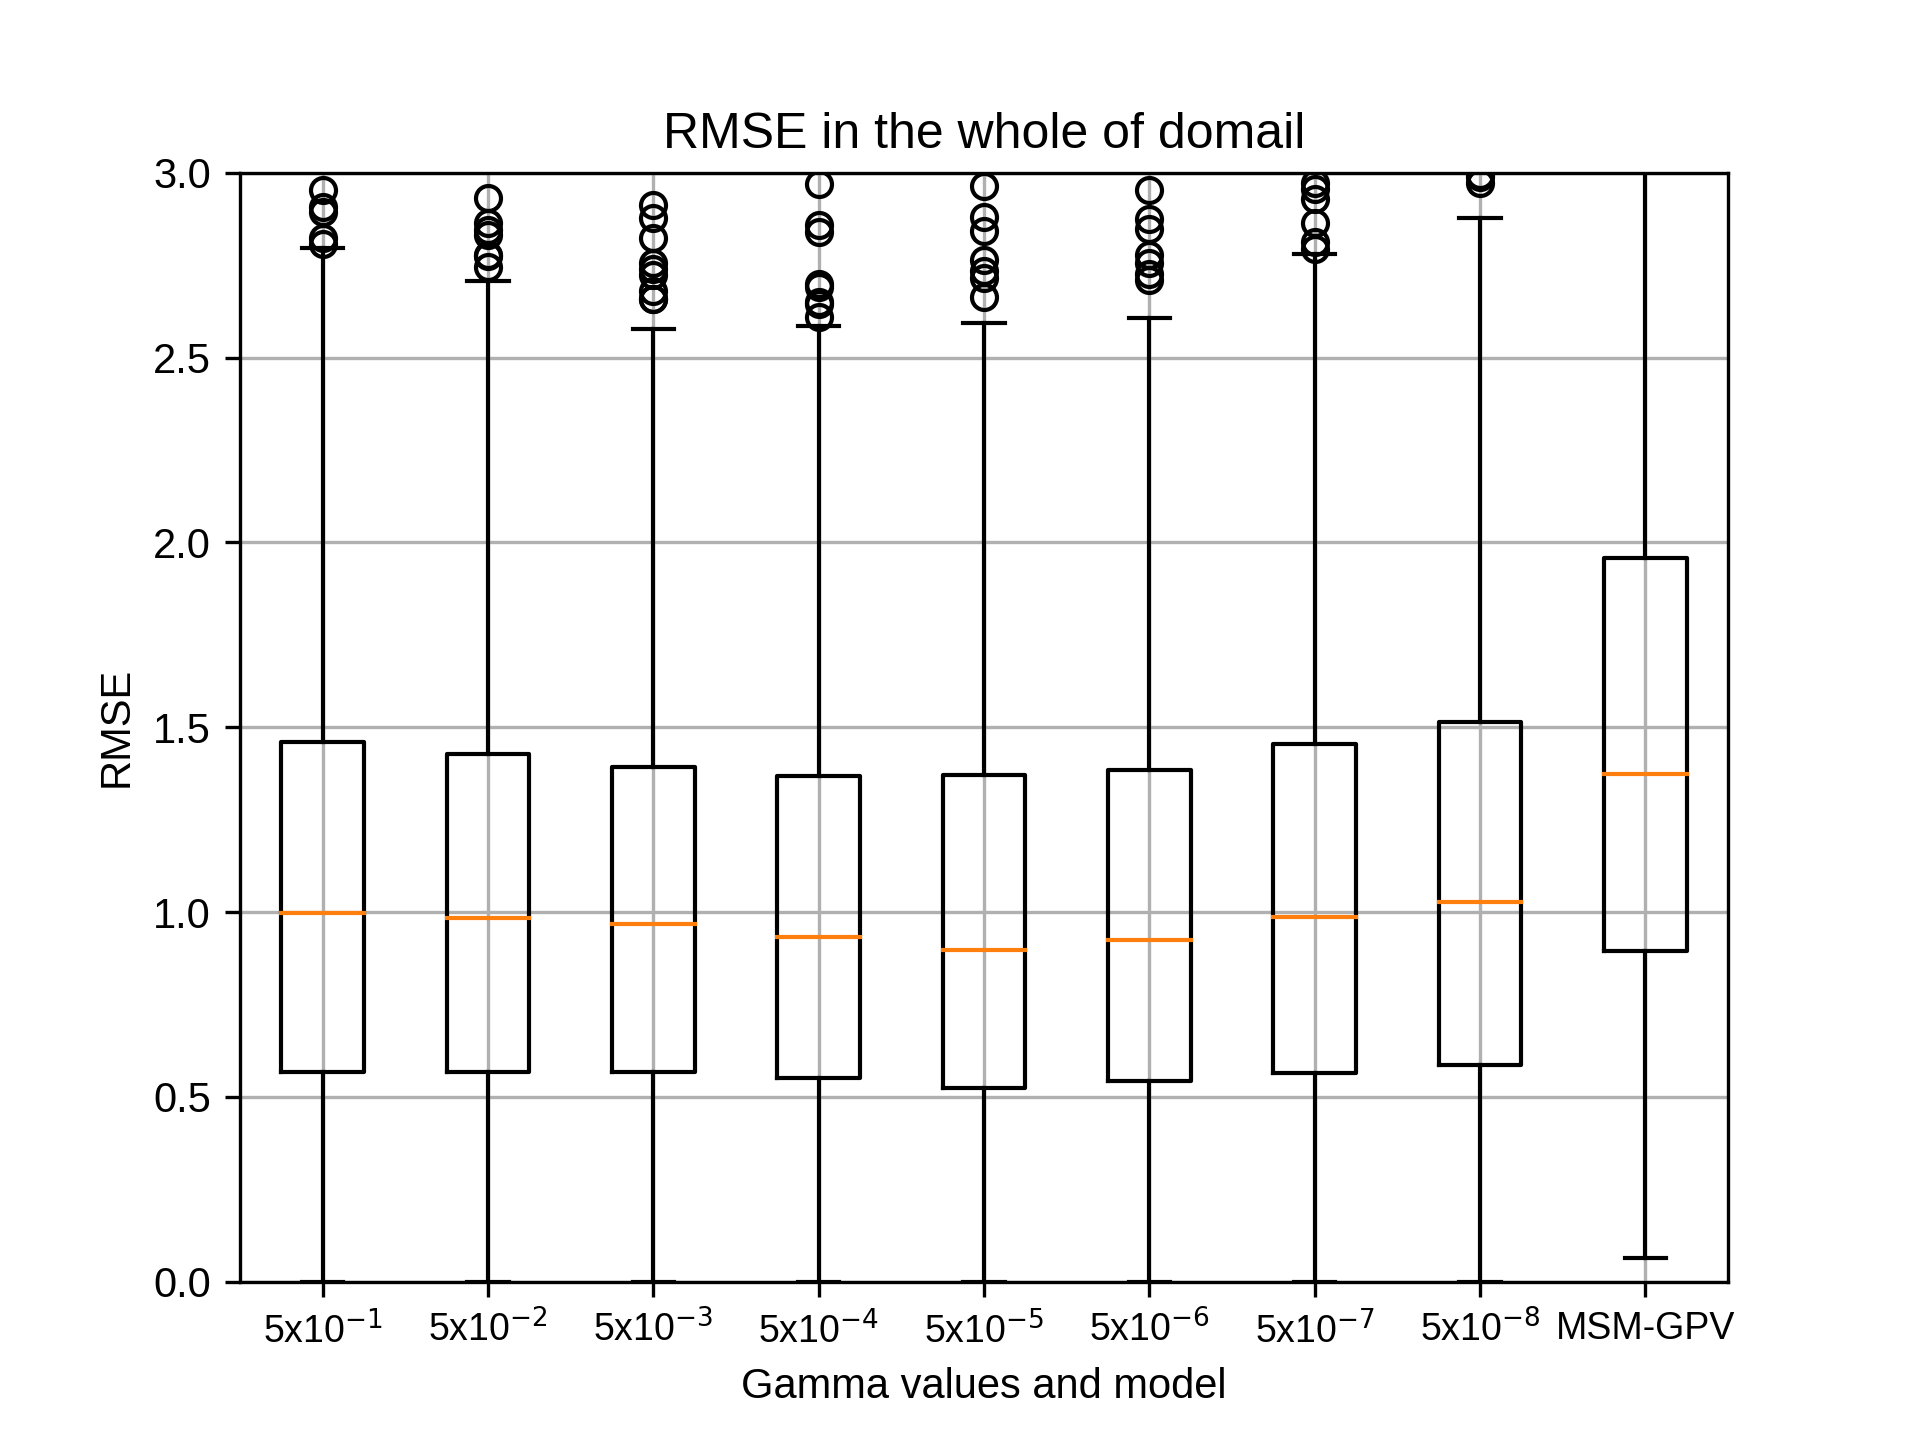
10月のsiteD,rg2=6の結果です。
kobayashi_yusukeMonday, November 16th, 2020 at 5:27:55 PM GMT+09:00
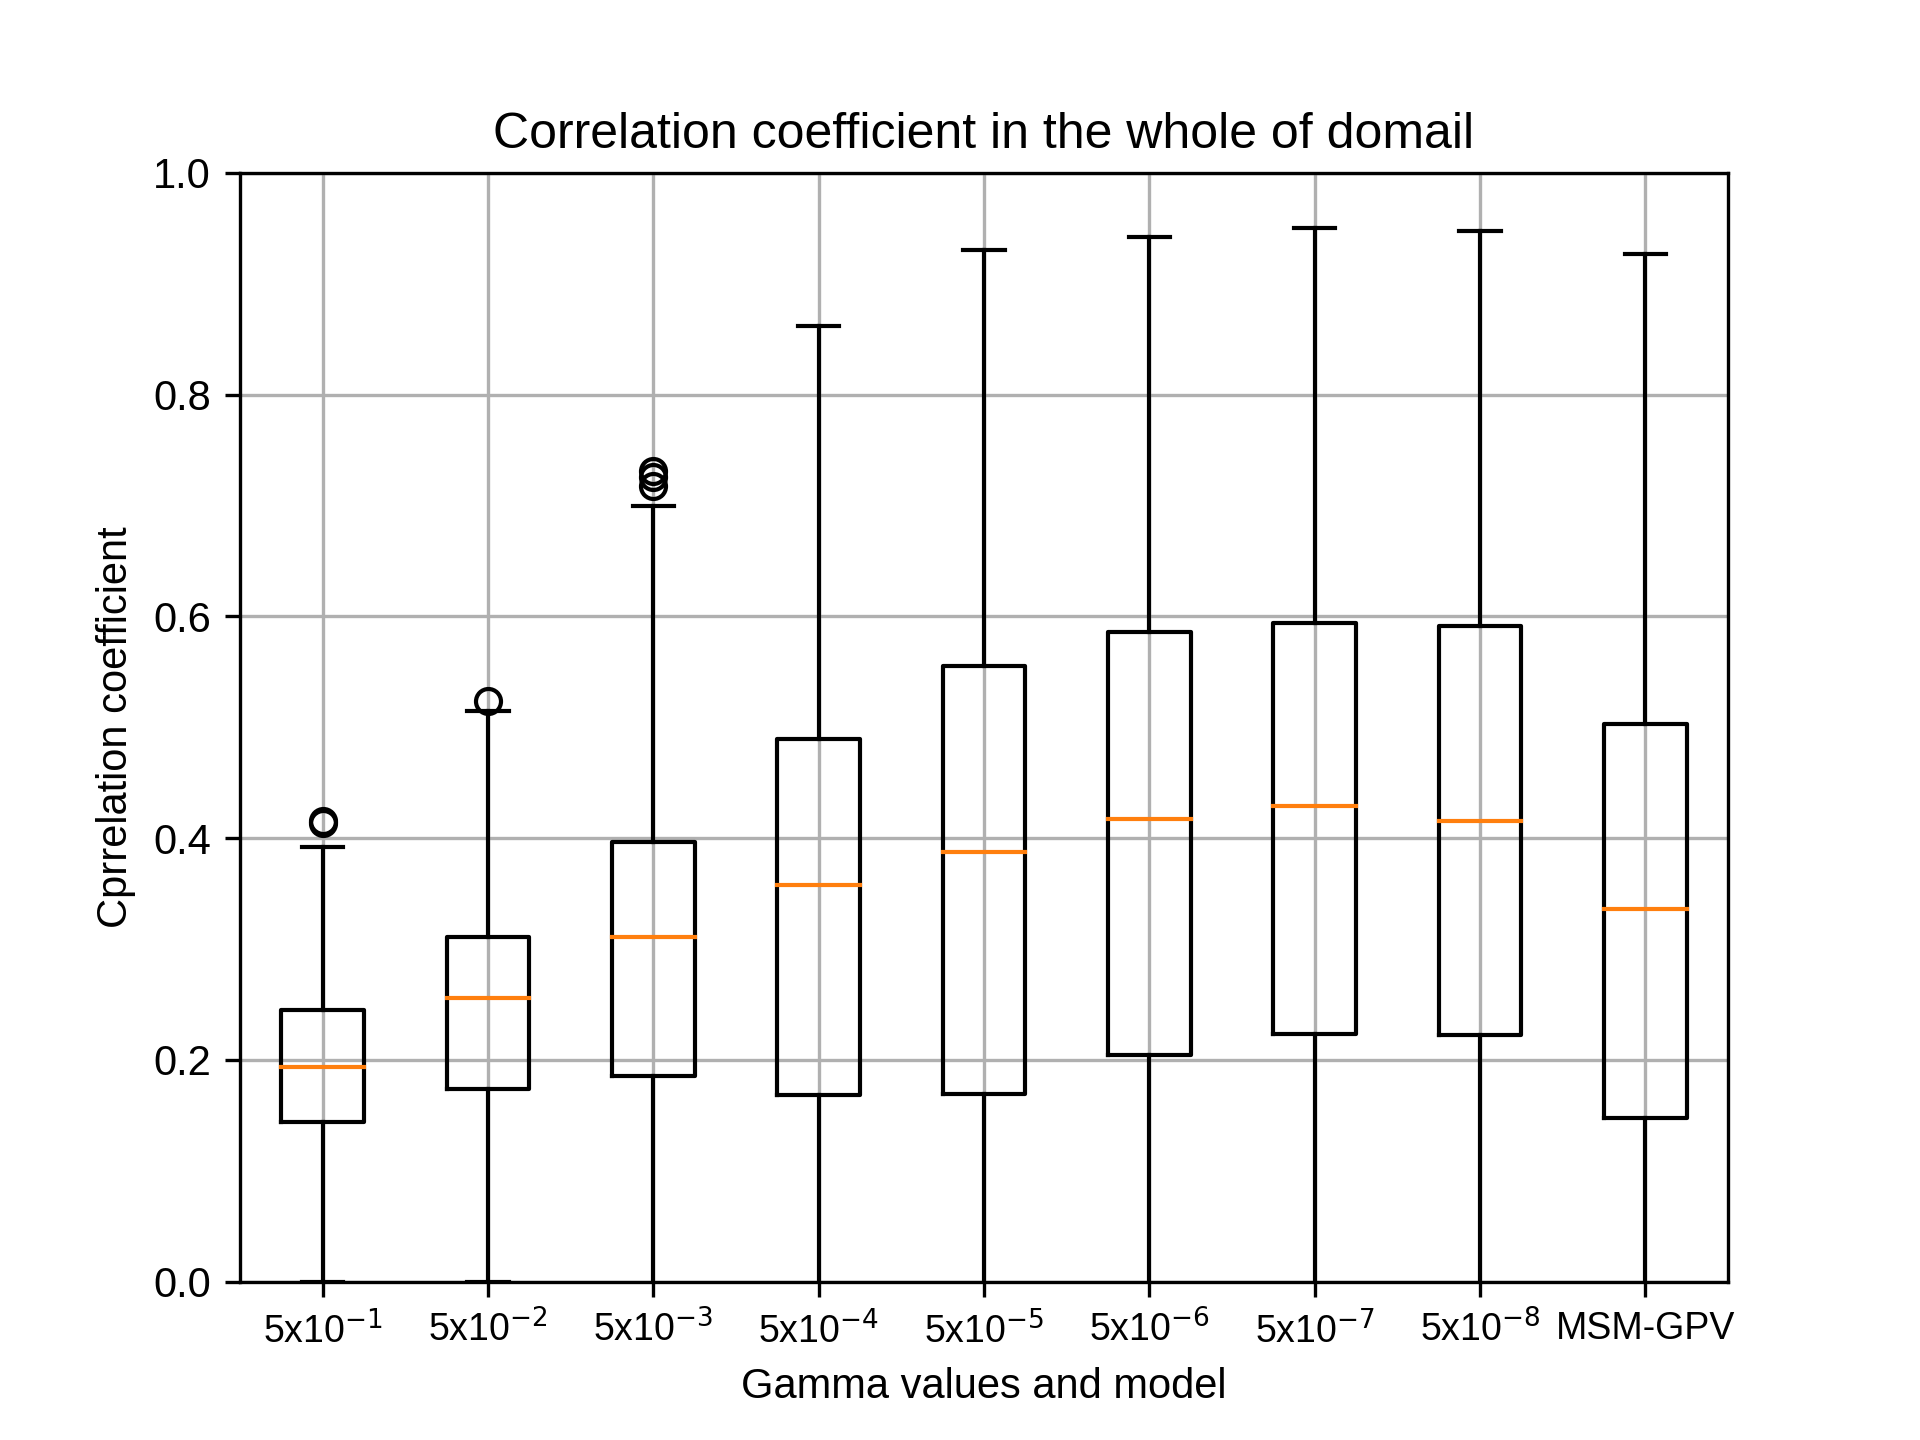
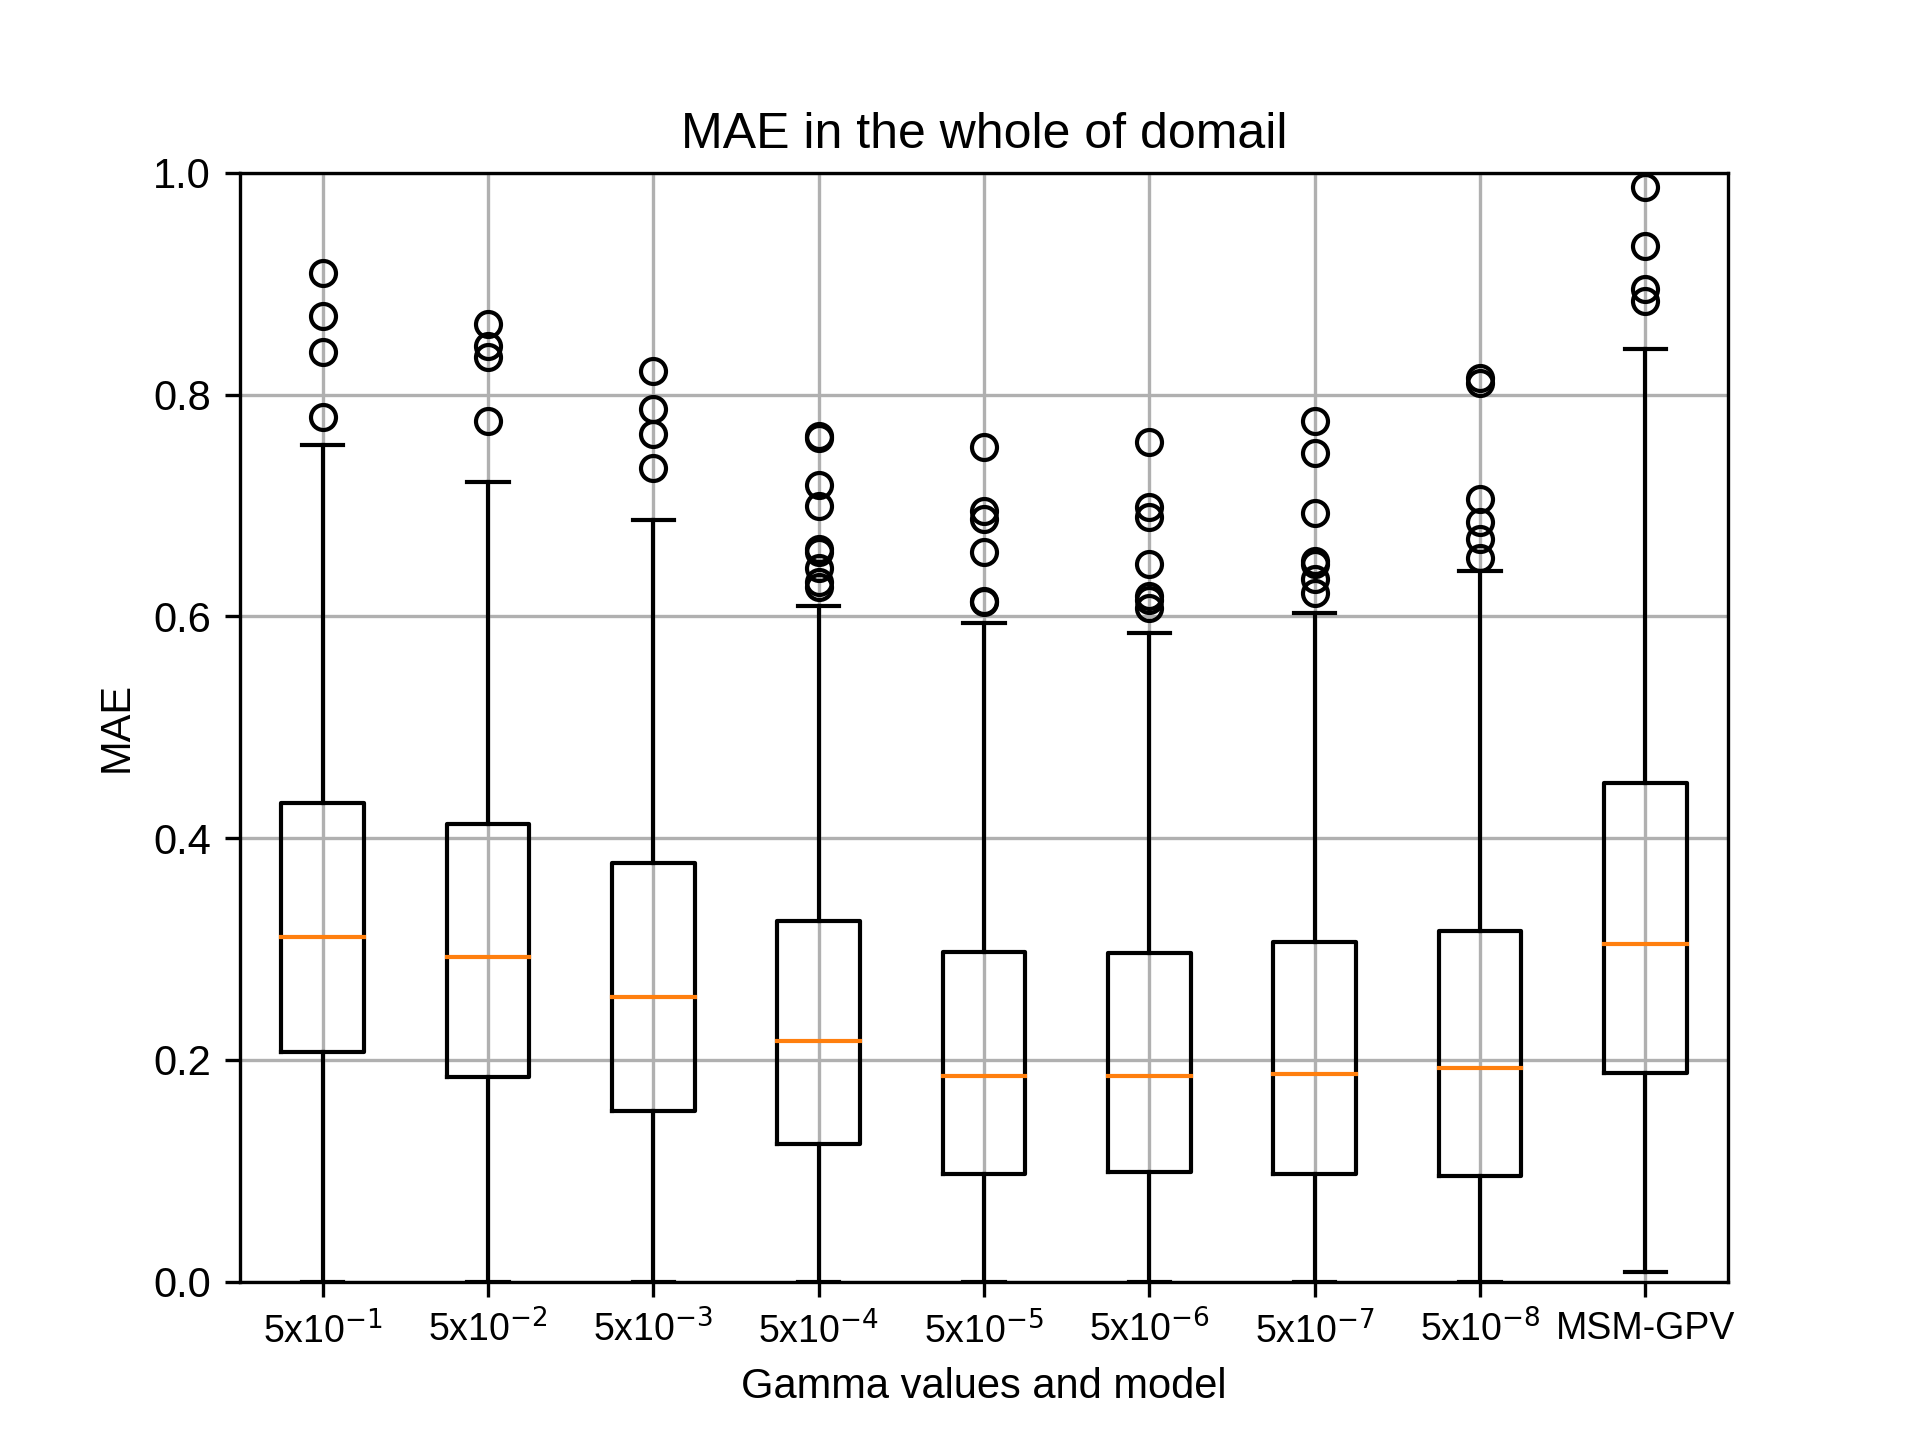

10月のsiteD,rg2=8の結果です。
kobayashi_yusukeMonday, November 16th, 2020 at 5:28:17 PM GMT+09:00
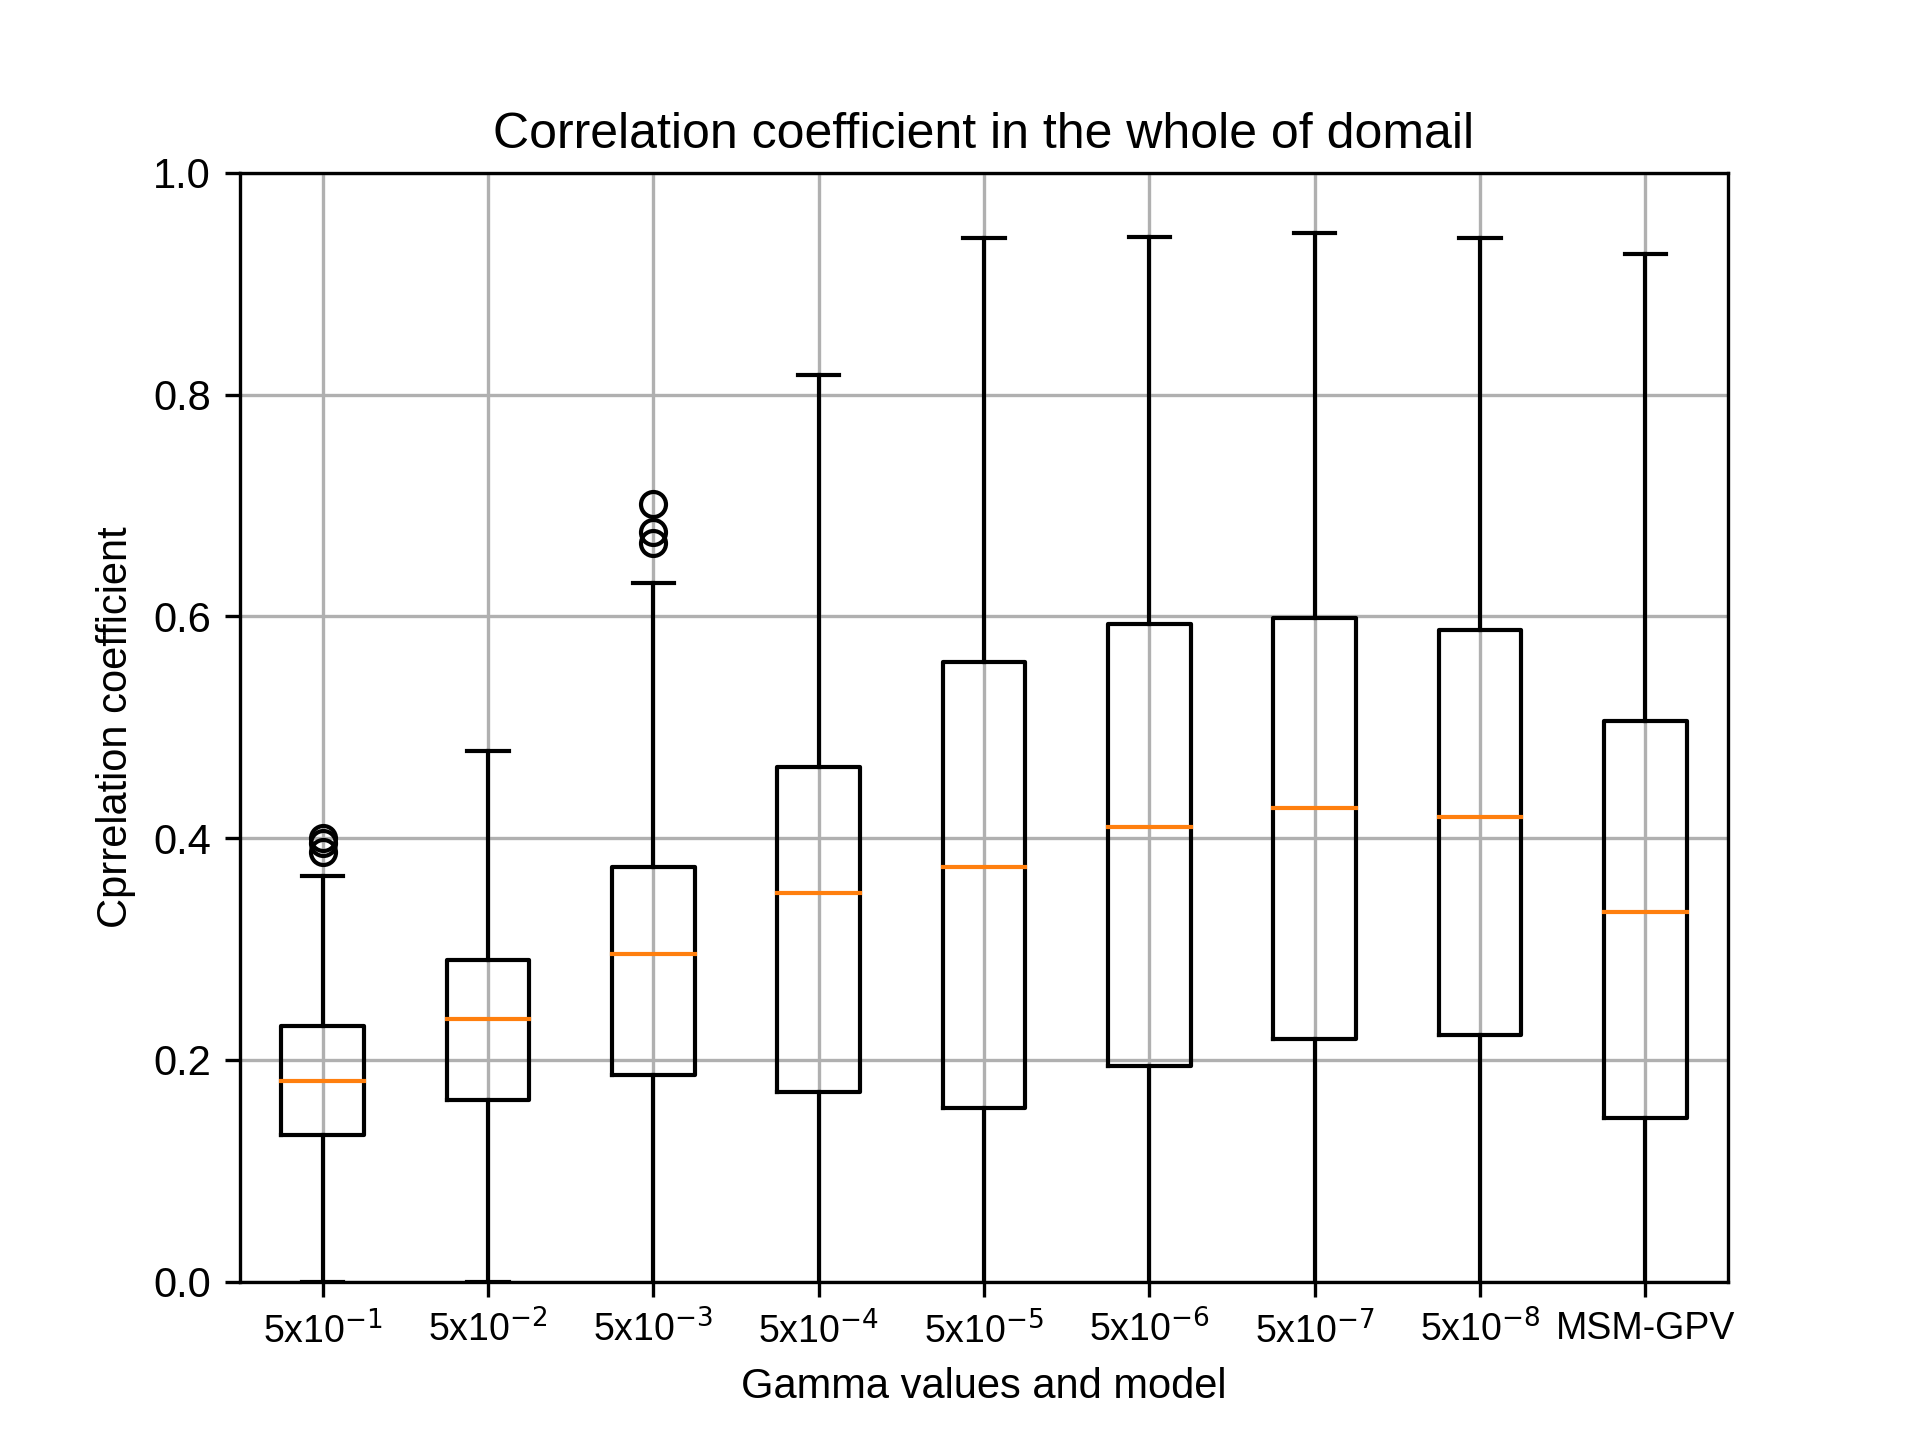


10月のsiteD,rg2=10の結果です。
kobayashi_yusukeMonday, November 16th, 2020 at 5:28:36 PM GMT+09:00
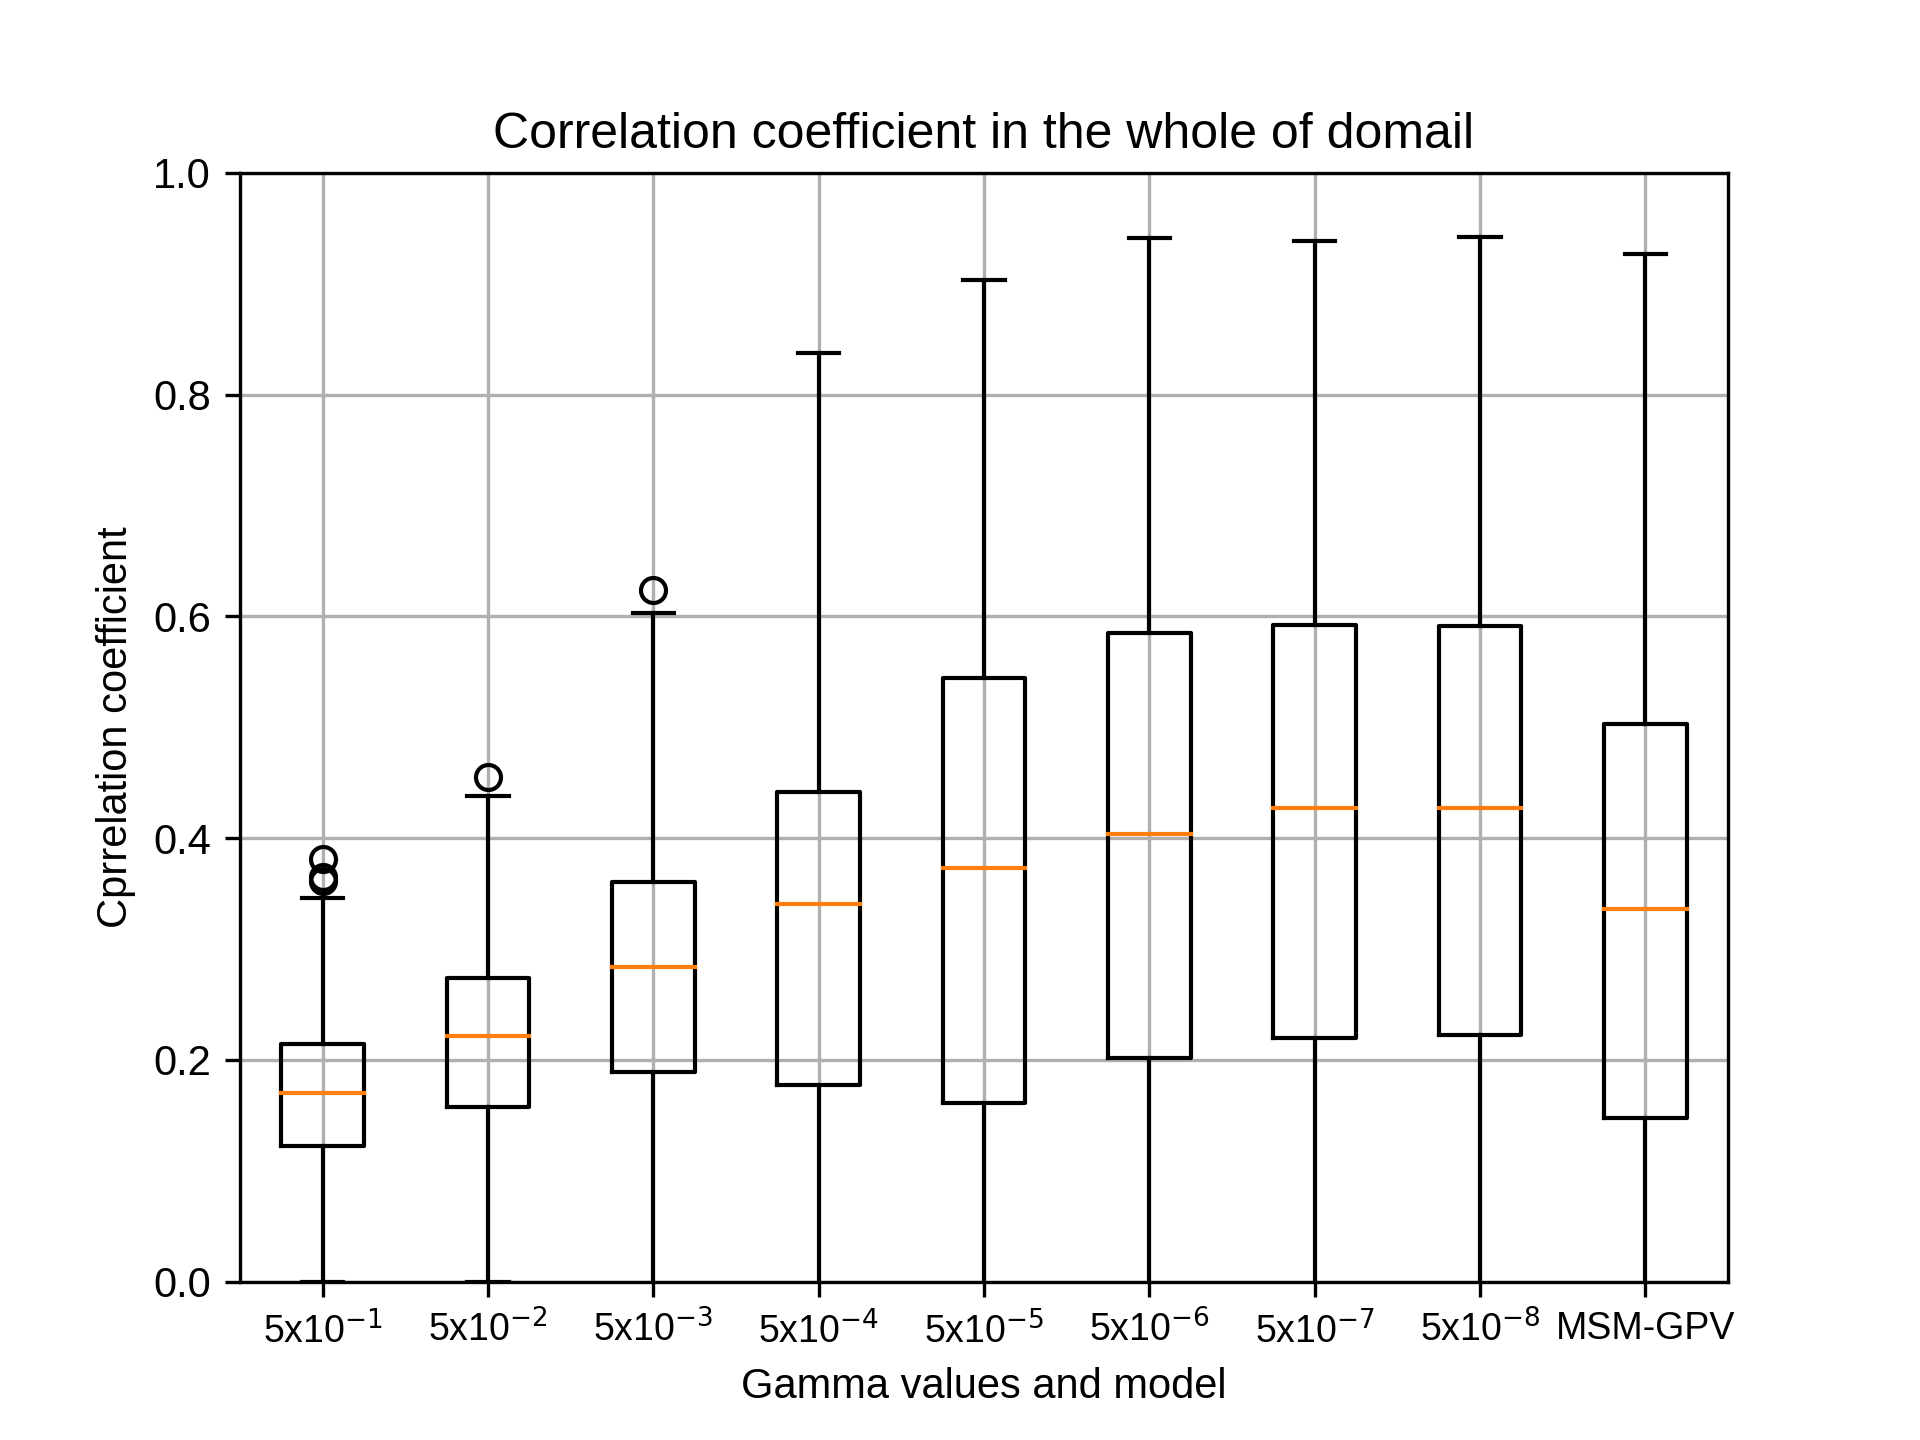
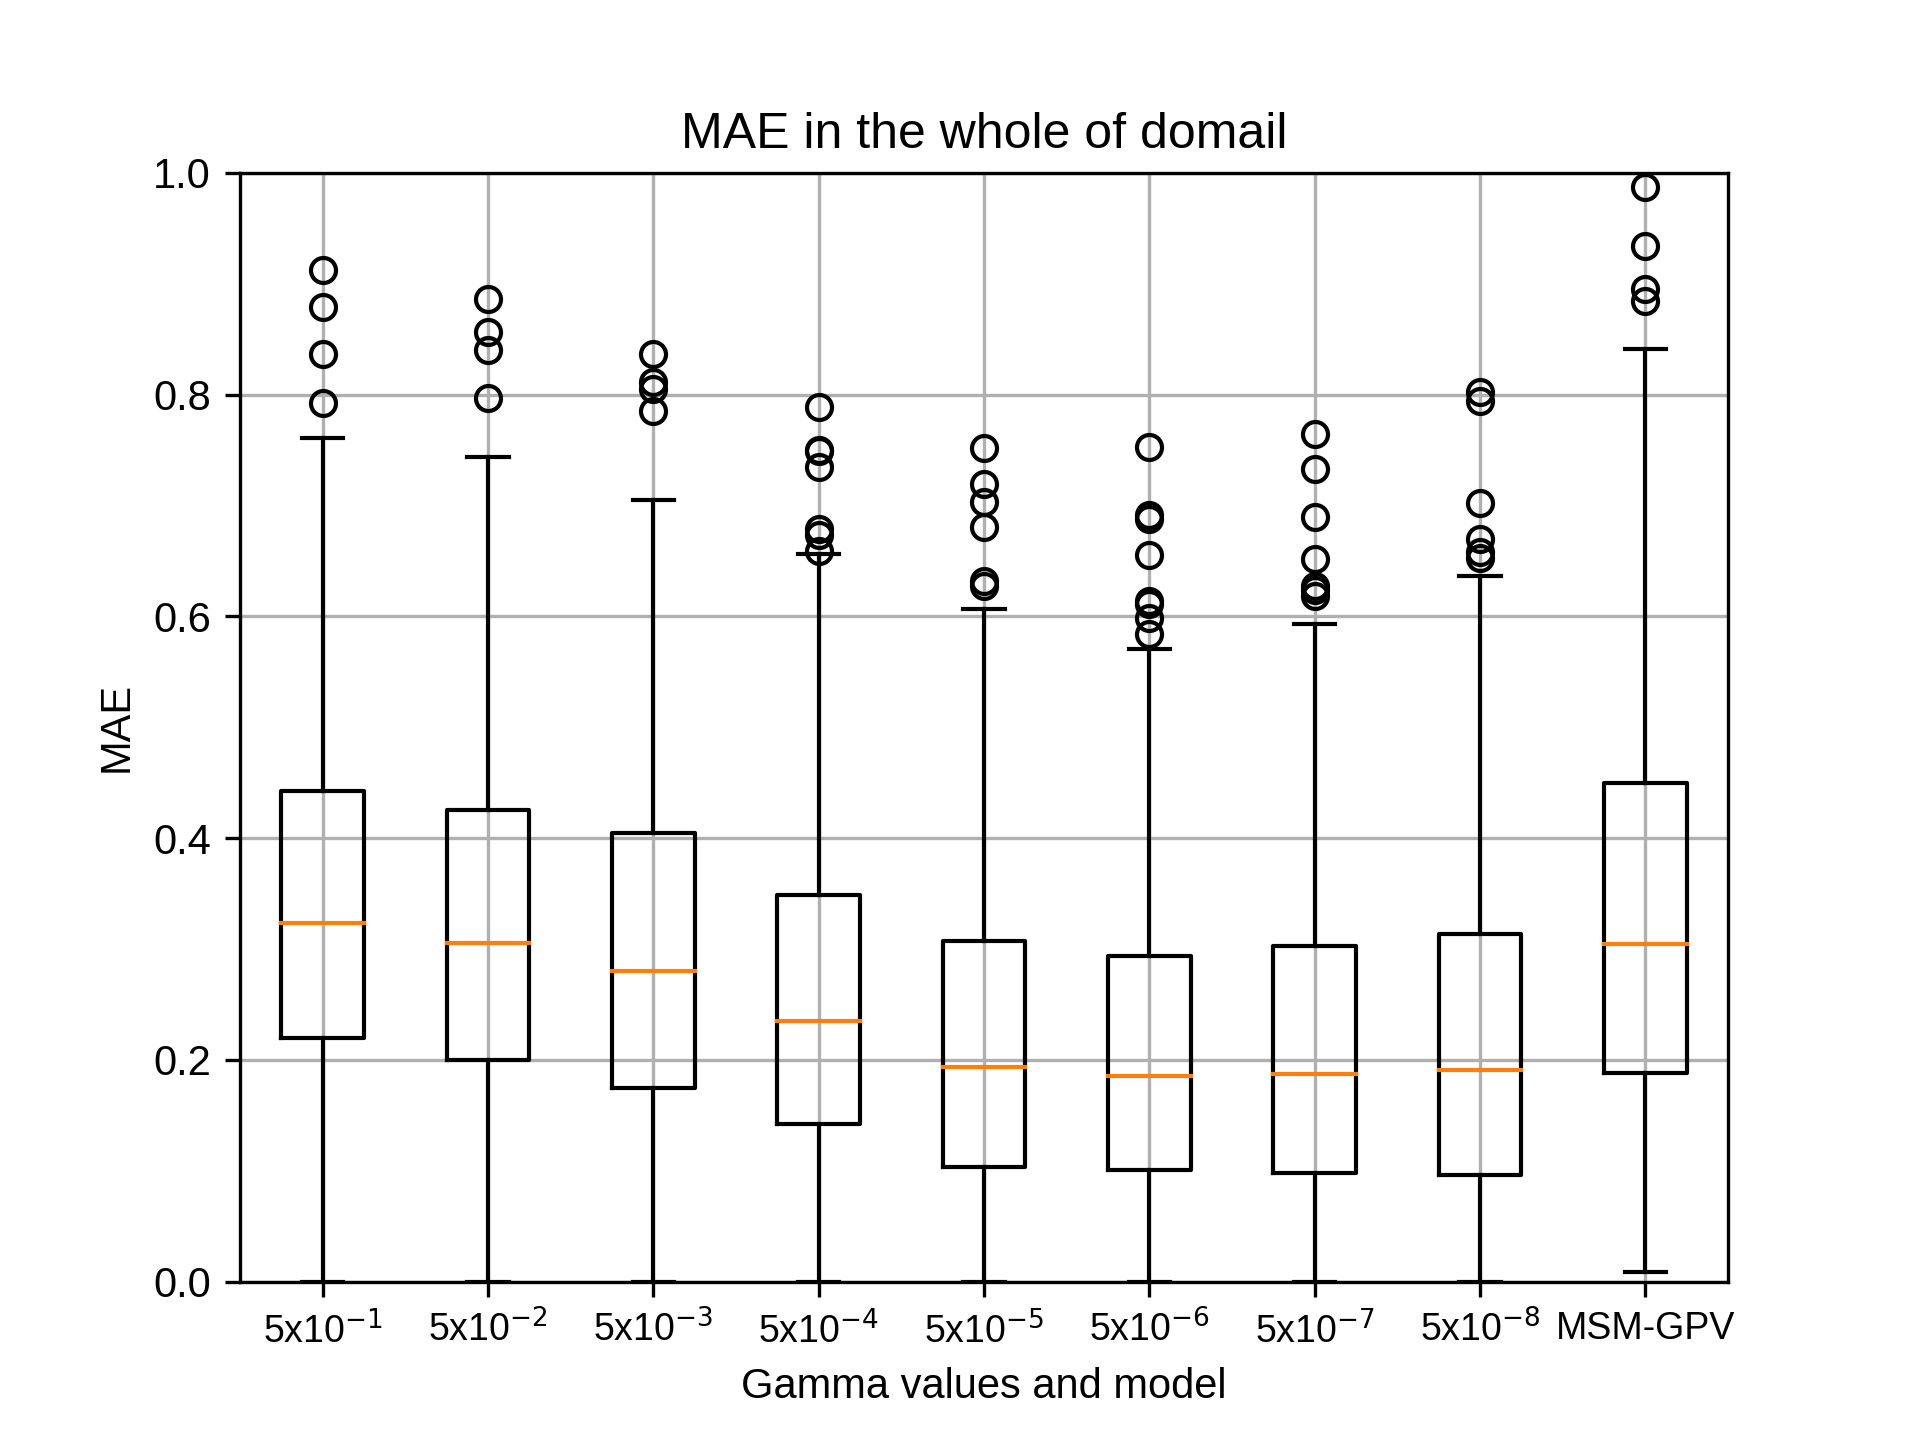
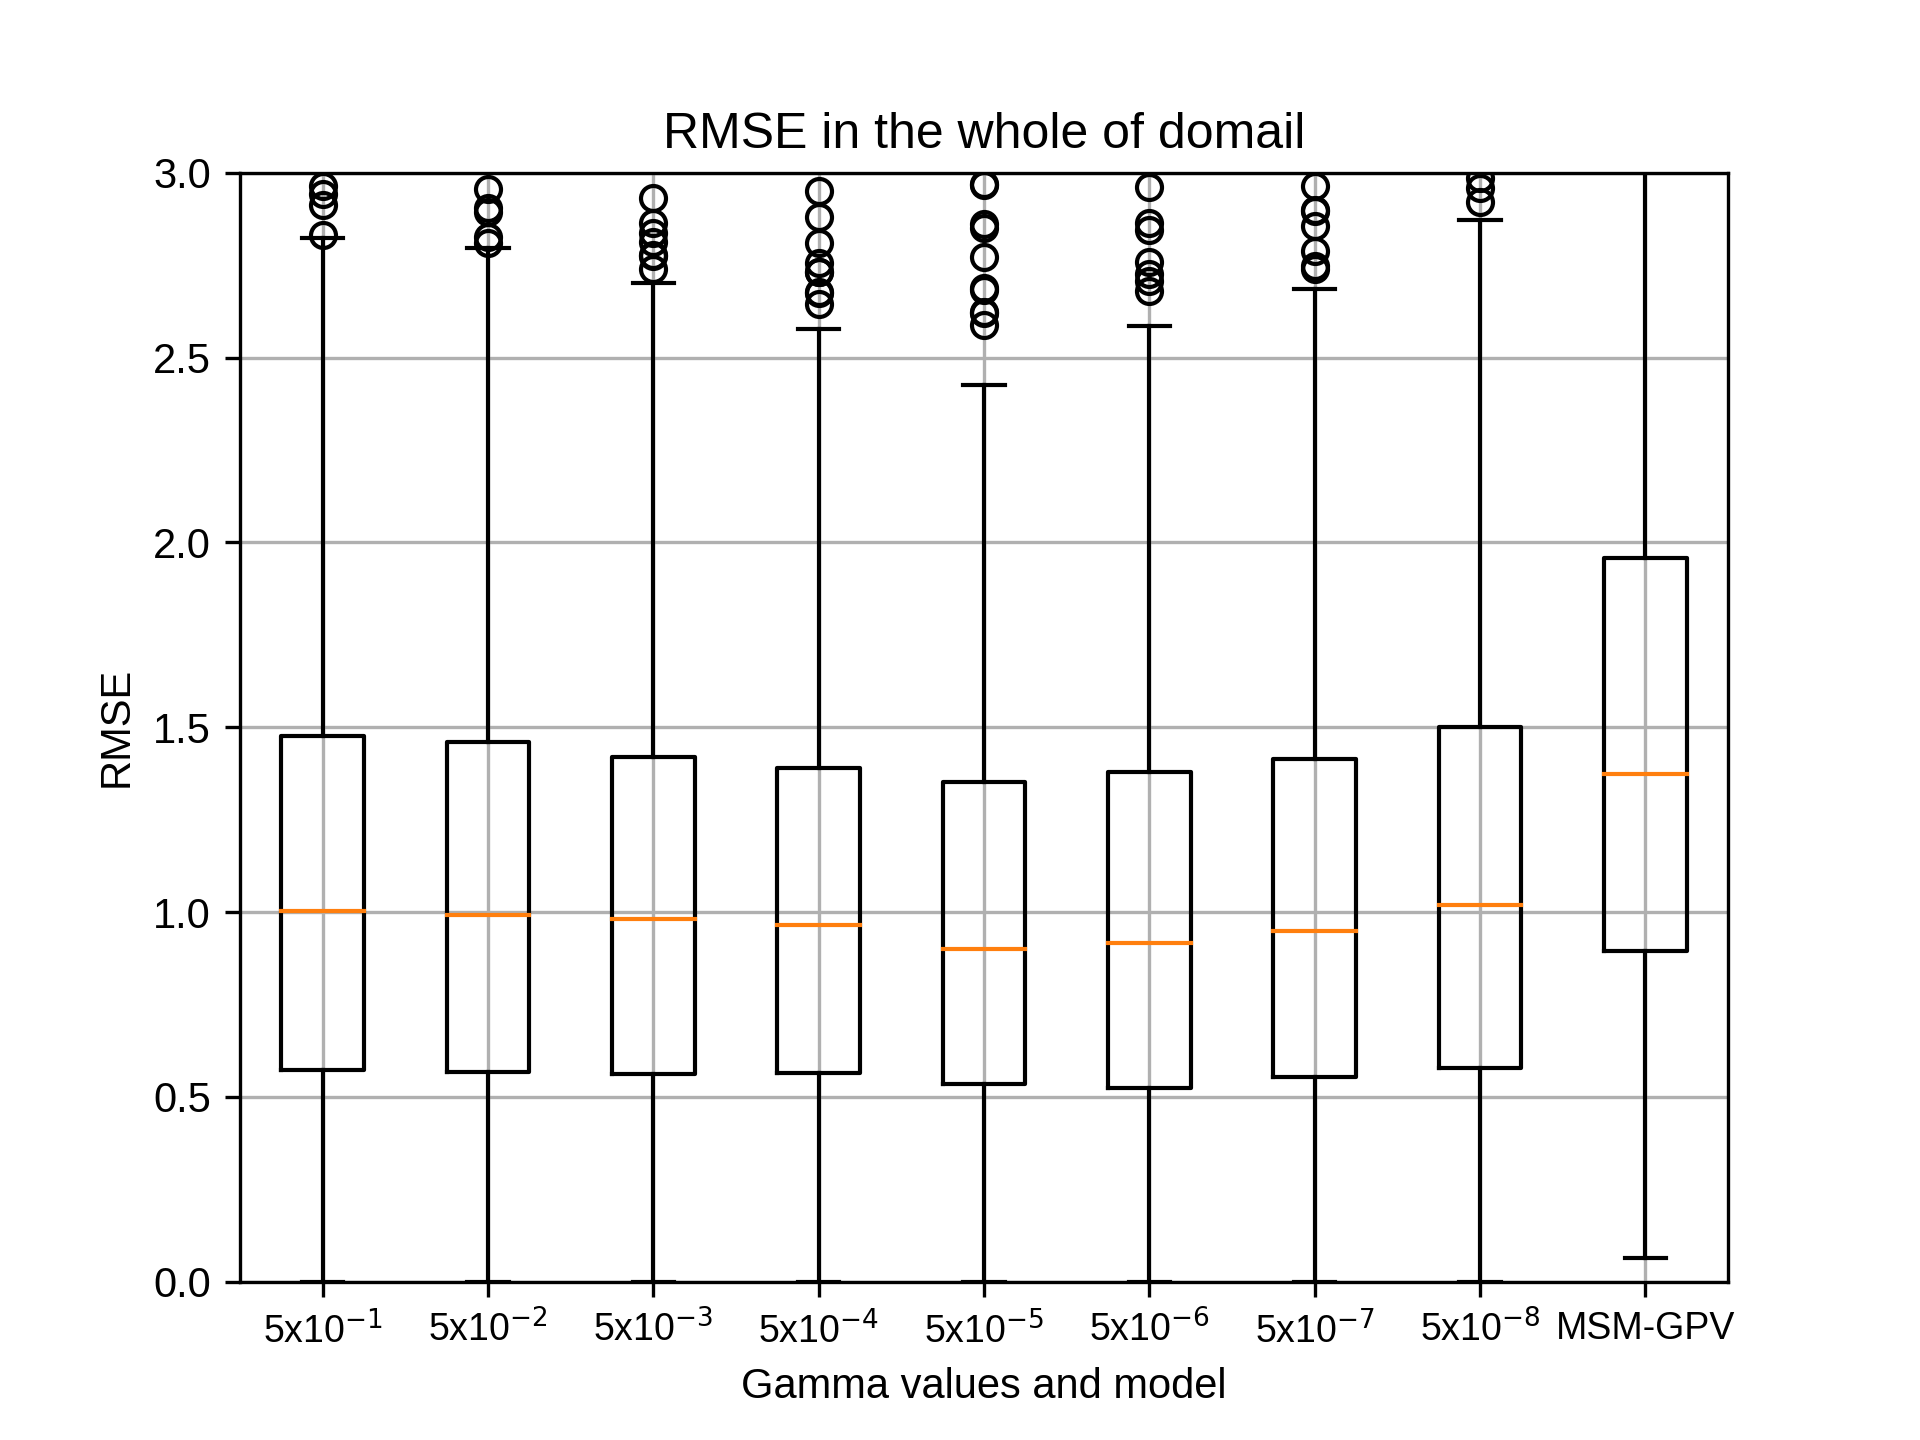
10月のsiteD,rg2=12の結果です。
10月のsiteDではrg2=8でgammaが5x10⁻⁷のとき、相関係数の中央値が最も高くなりました。
10月のsiteDではrg2=8でgammaが5x10⁻⁷のとき、相関係数の中央値が最も高くなりました。
kobayashi_yusukeMonday, November 16th, 2020 at 5:28:59 PM GMT+09:00
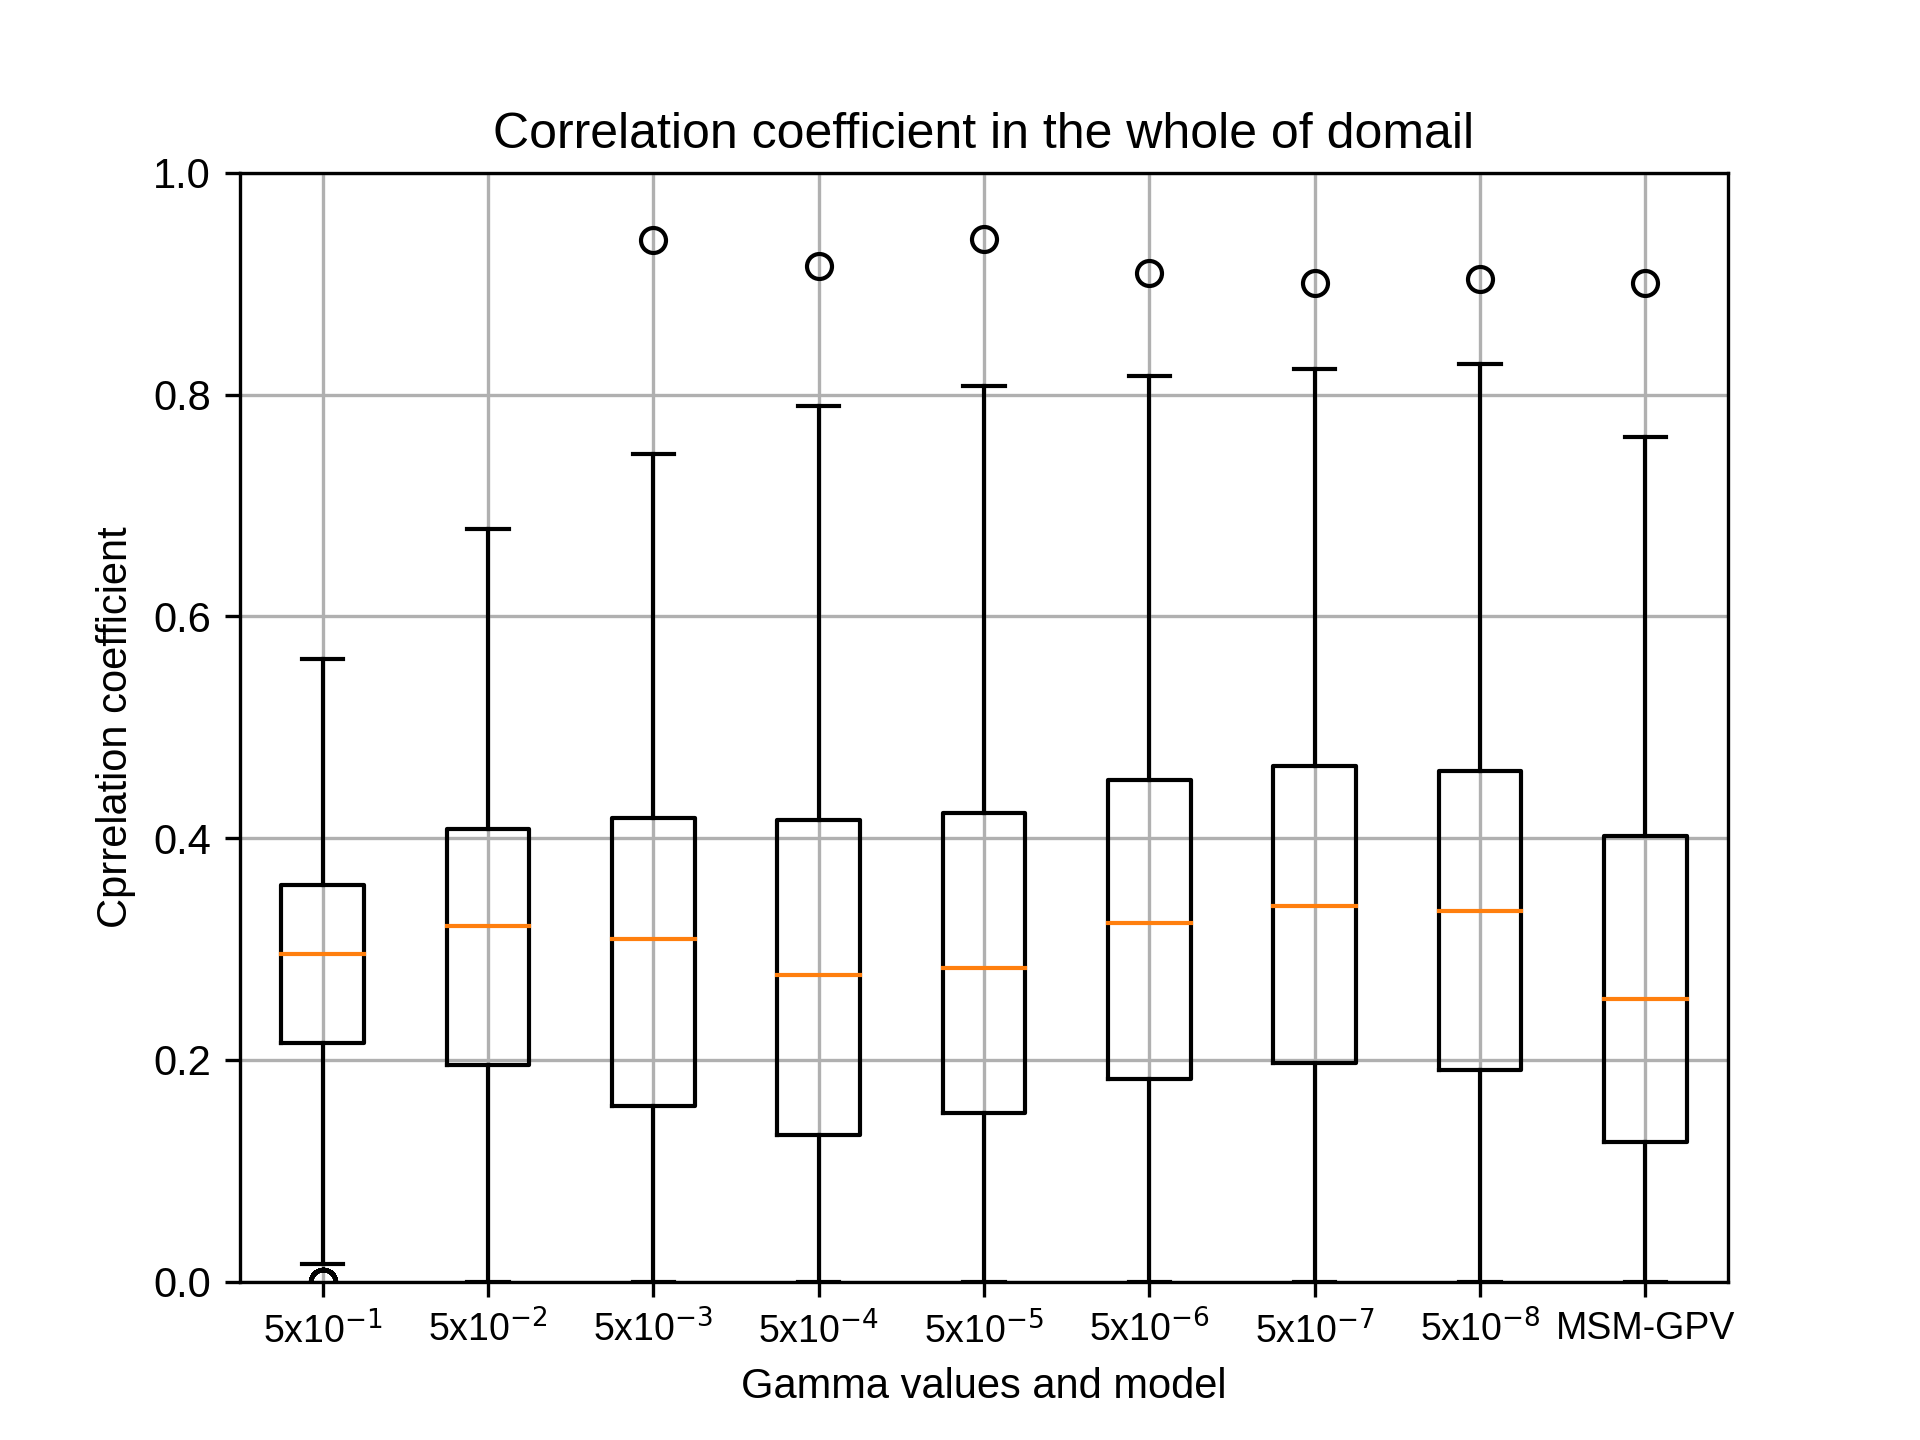

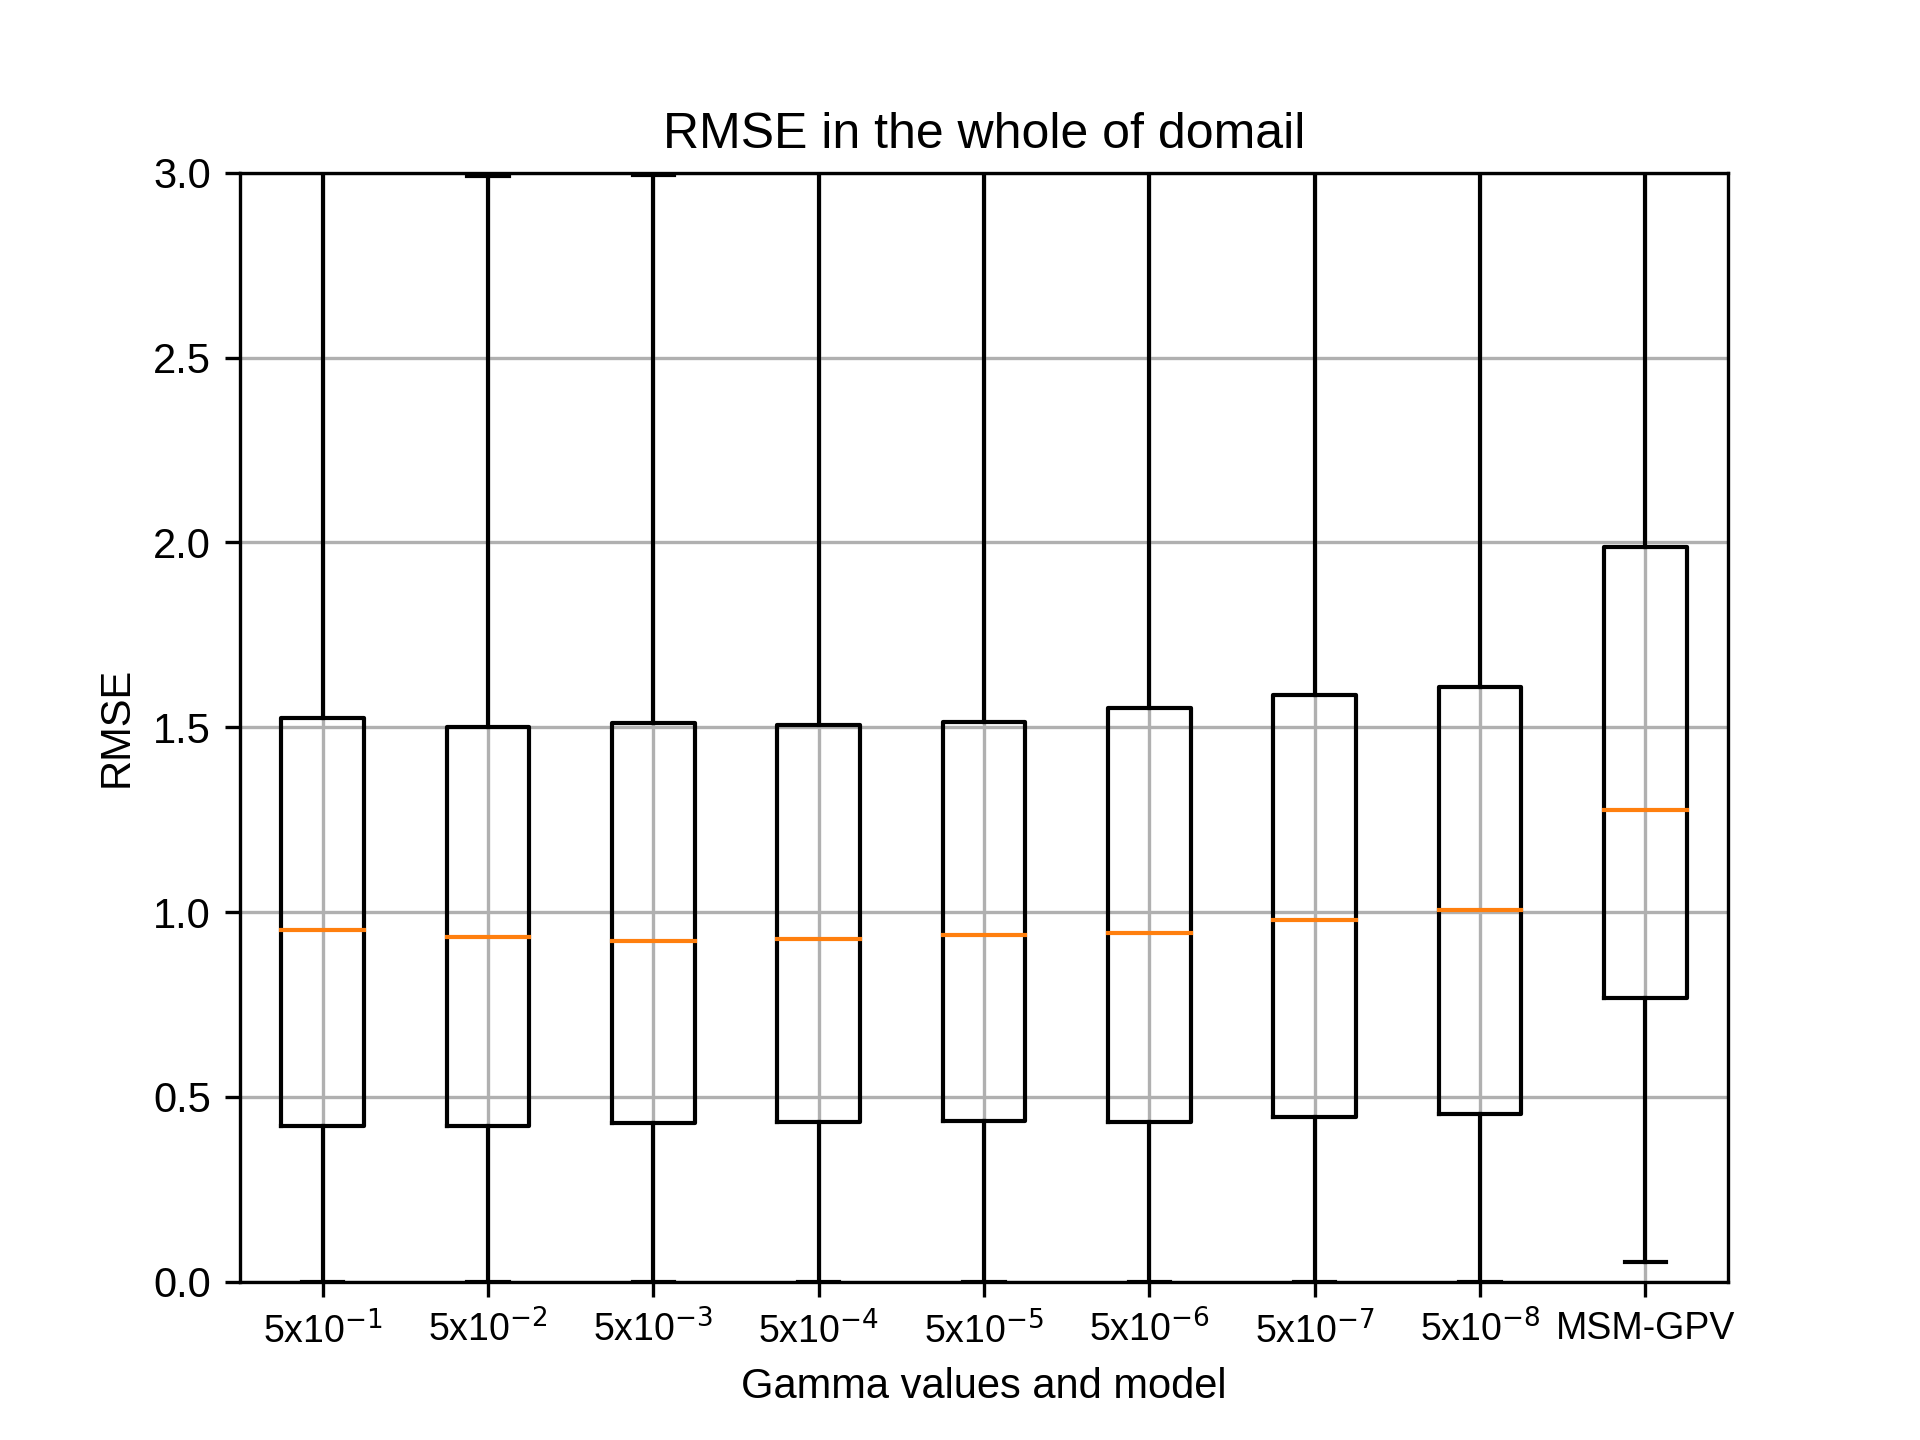
最後に、10月のsiteEの結果です。
まず、10月のsiteE,rg2=4の結果です。
まず、10月のsiteE,rg2=4の結果です。
kobayashi_yusukeMonday, November 16th, 2020 at 5:29:23 PM GMT+09:00

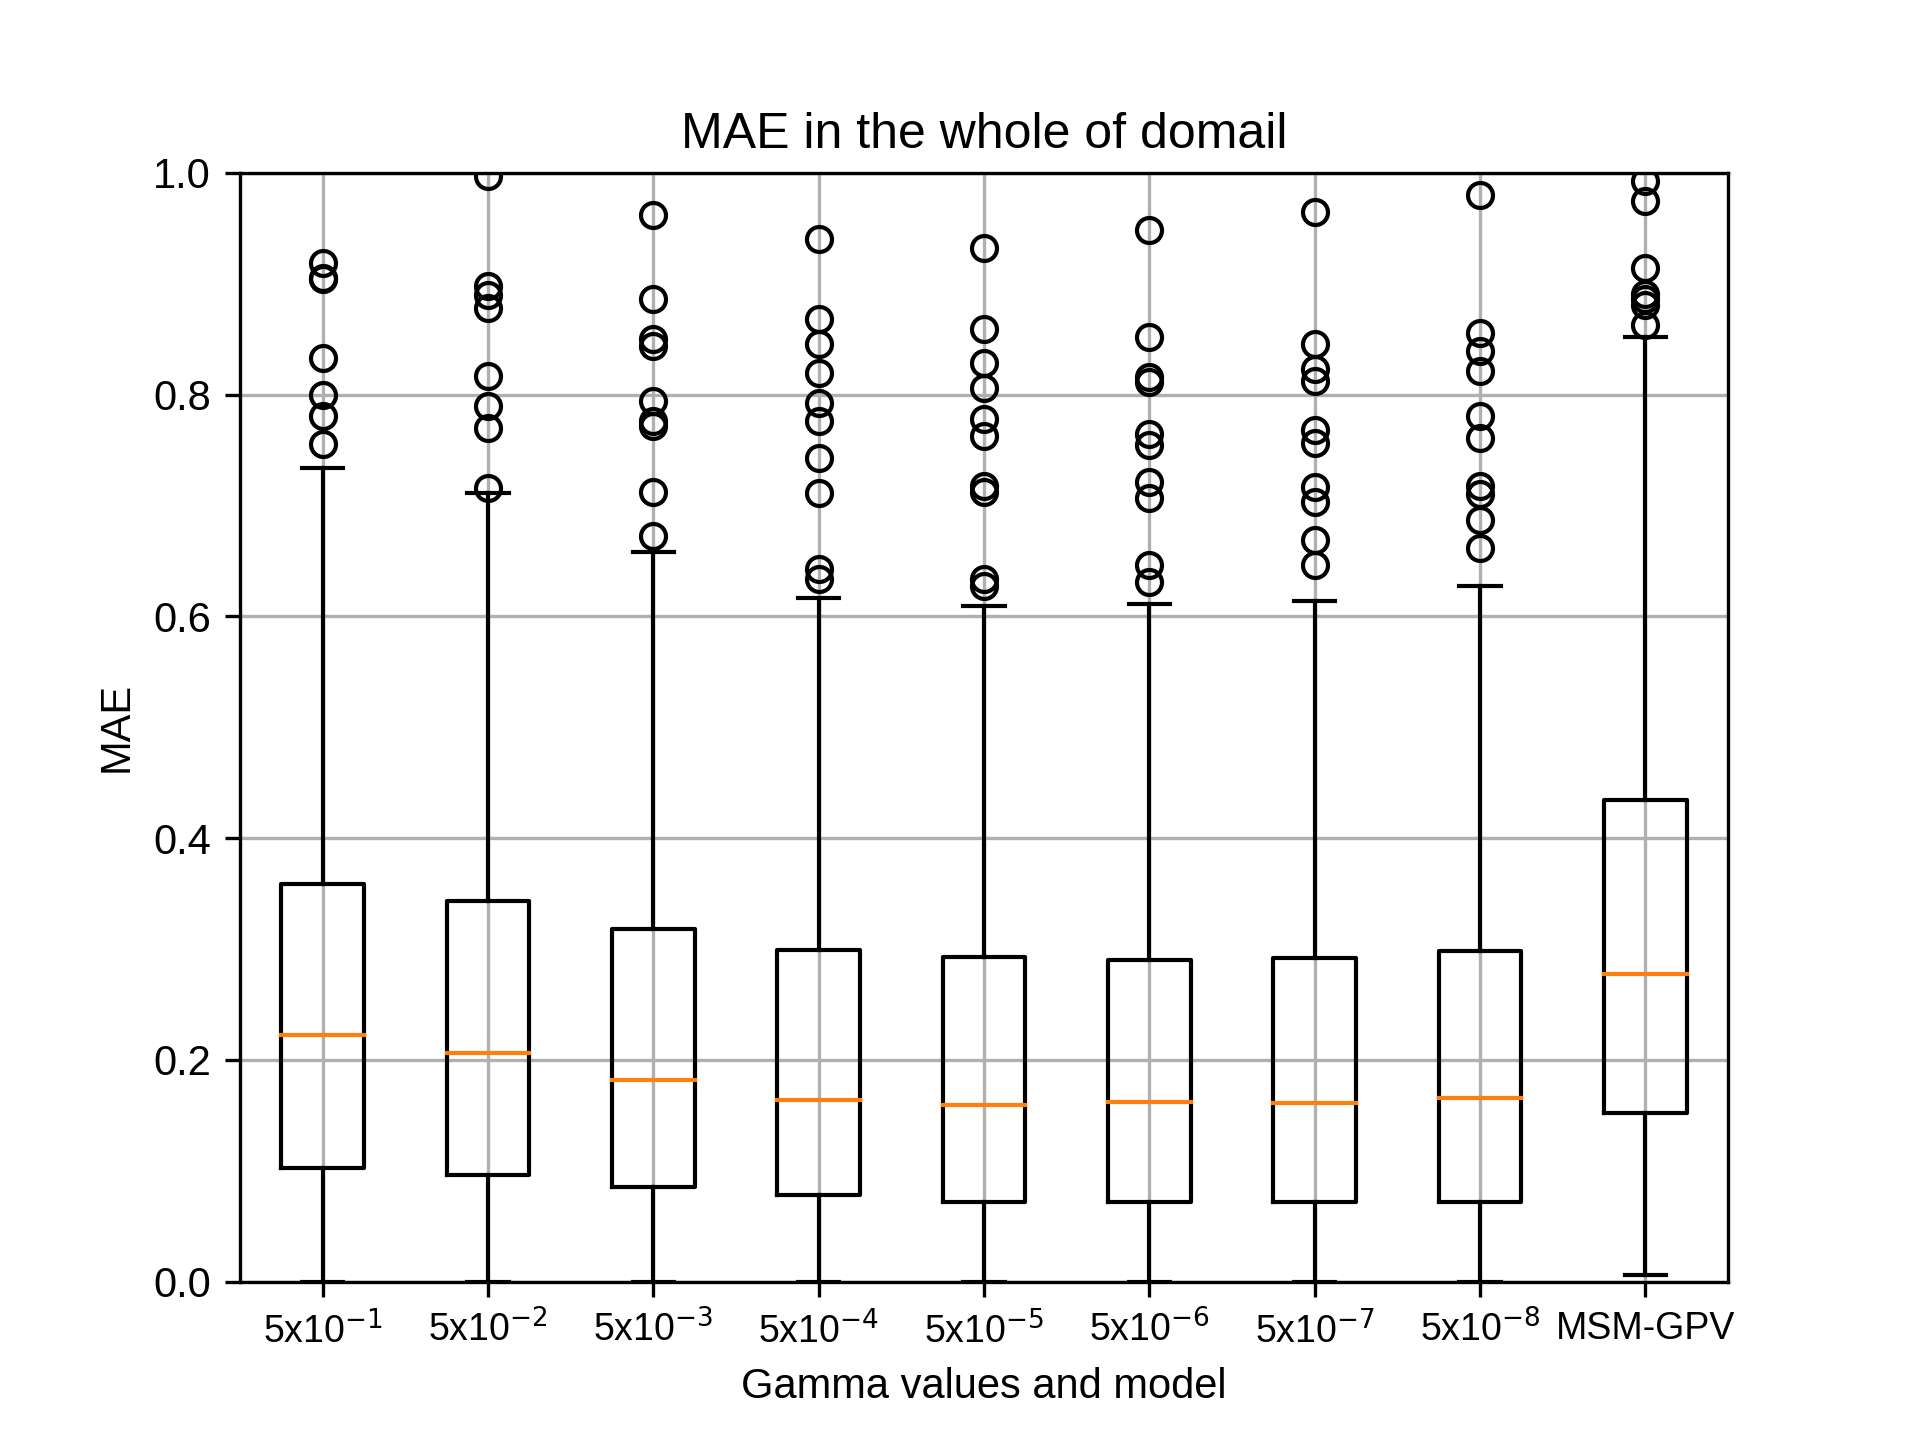

10月のsiteE,rg2=6の結果です。
kobayashi_yusukeMonday, November 16th, 2020 at 5:29:35 PM GMT+09:00
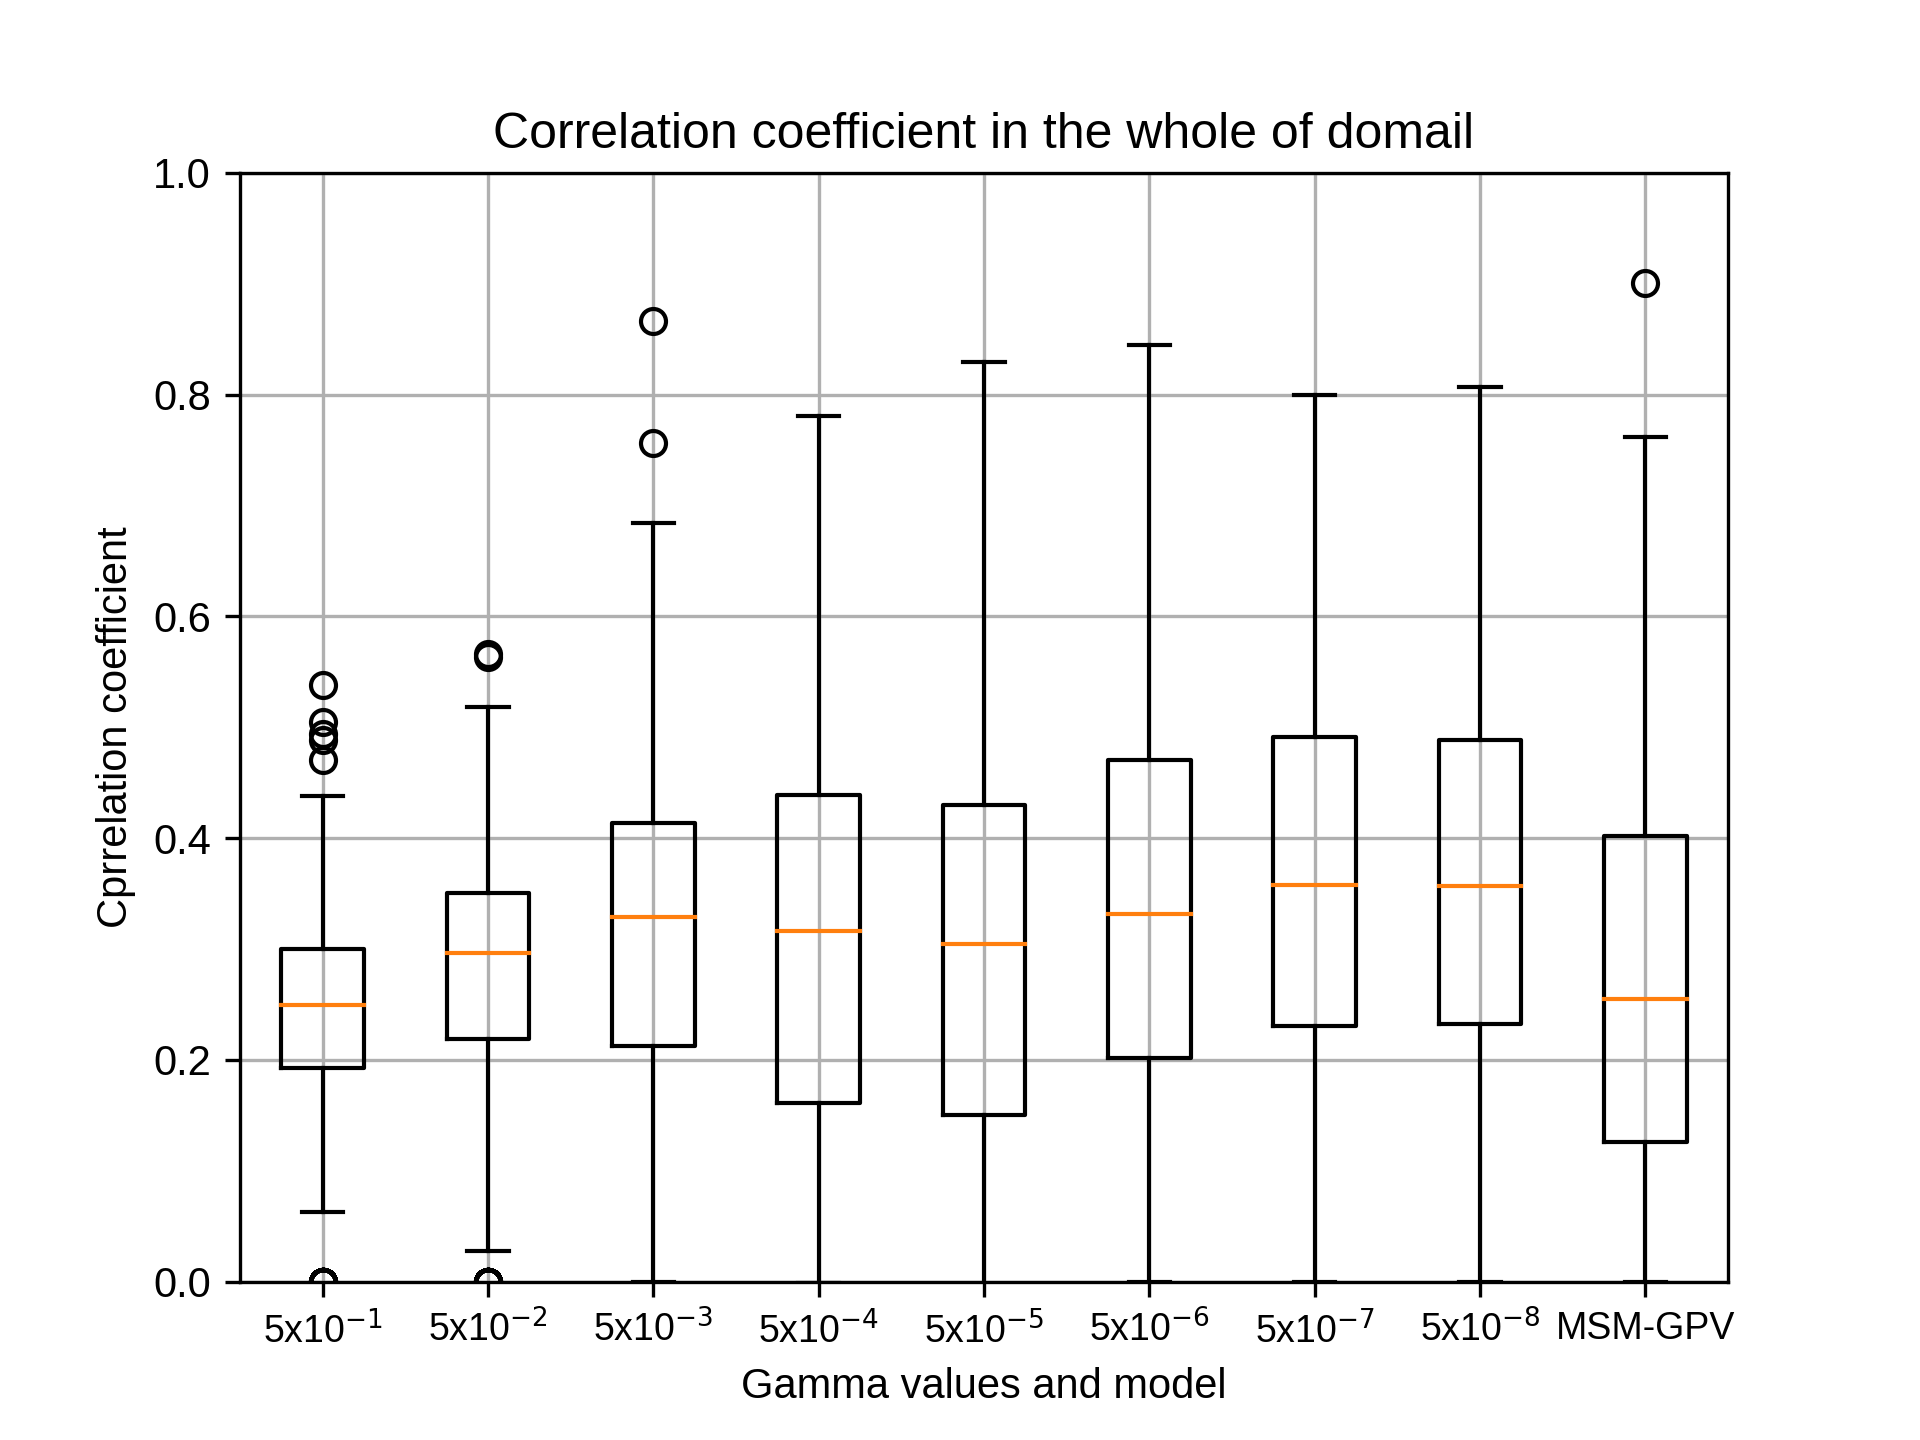
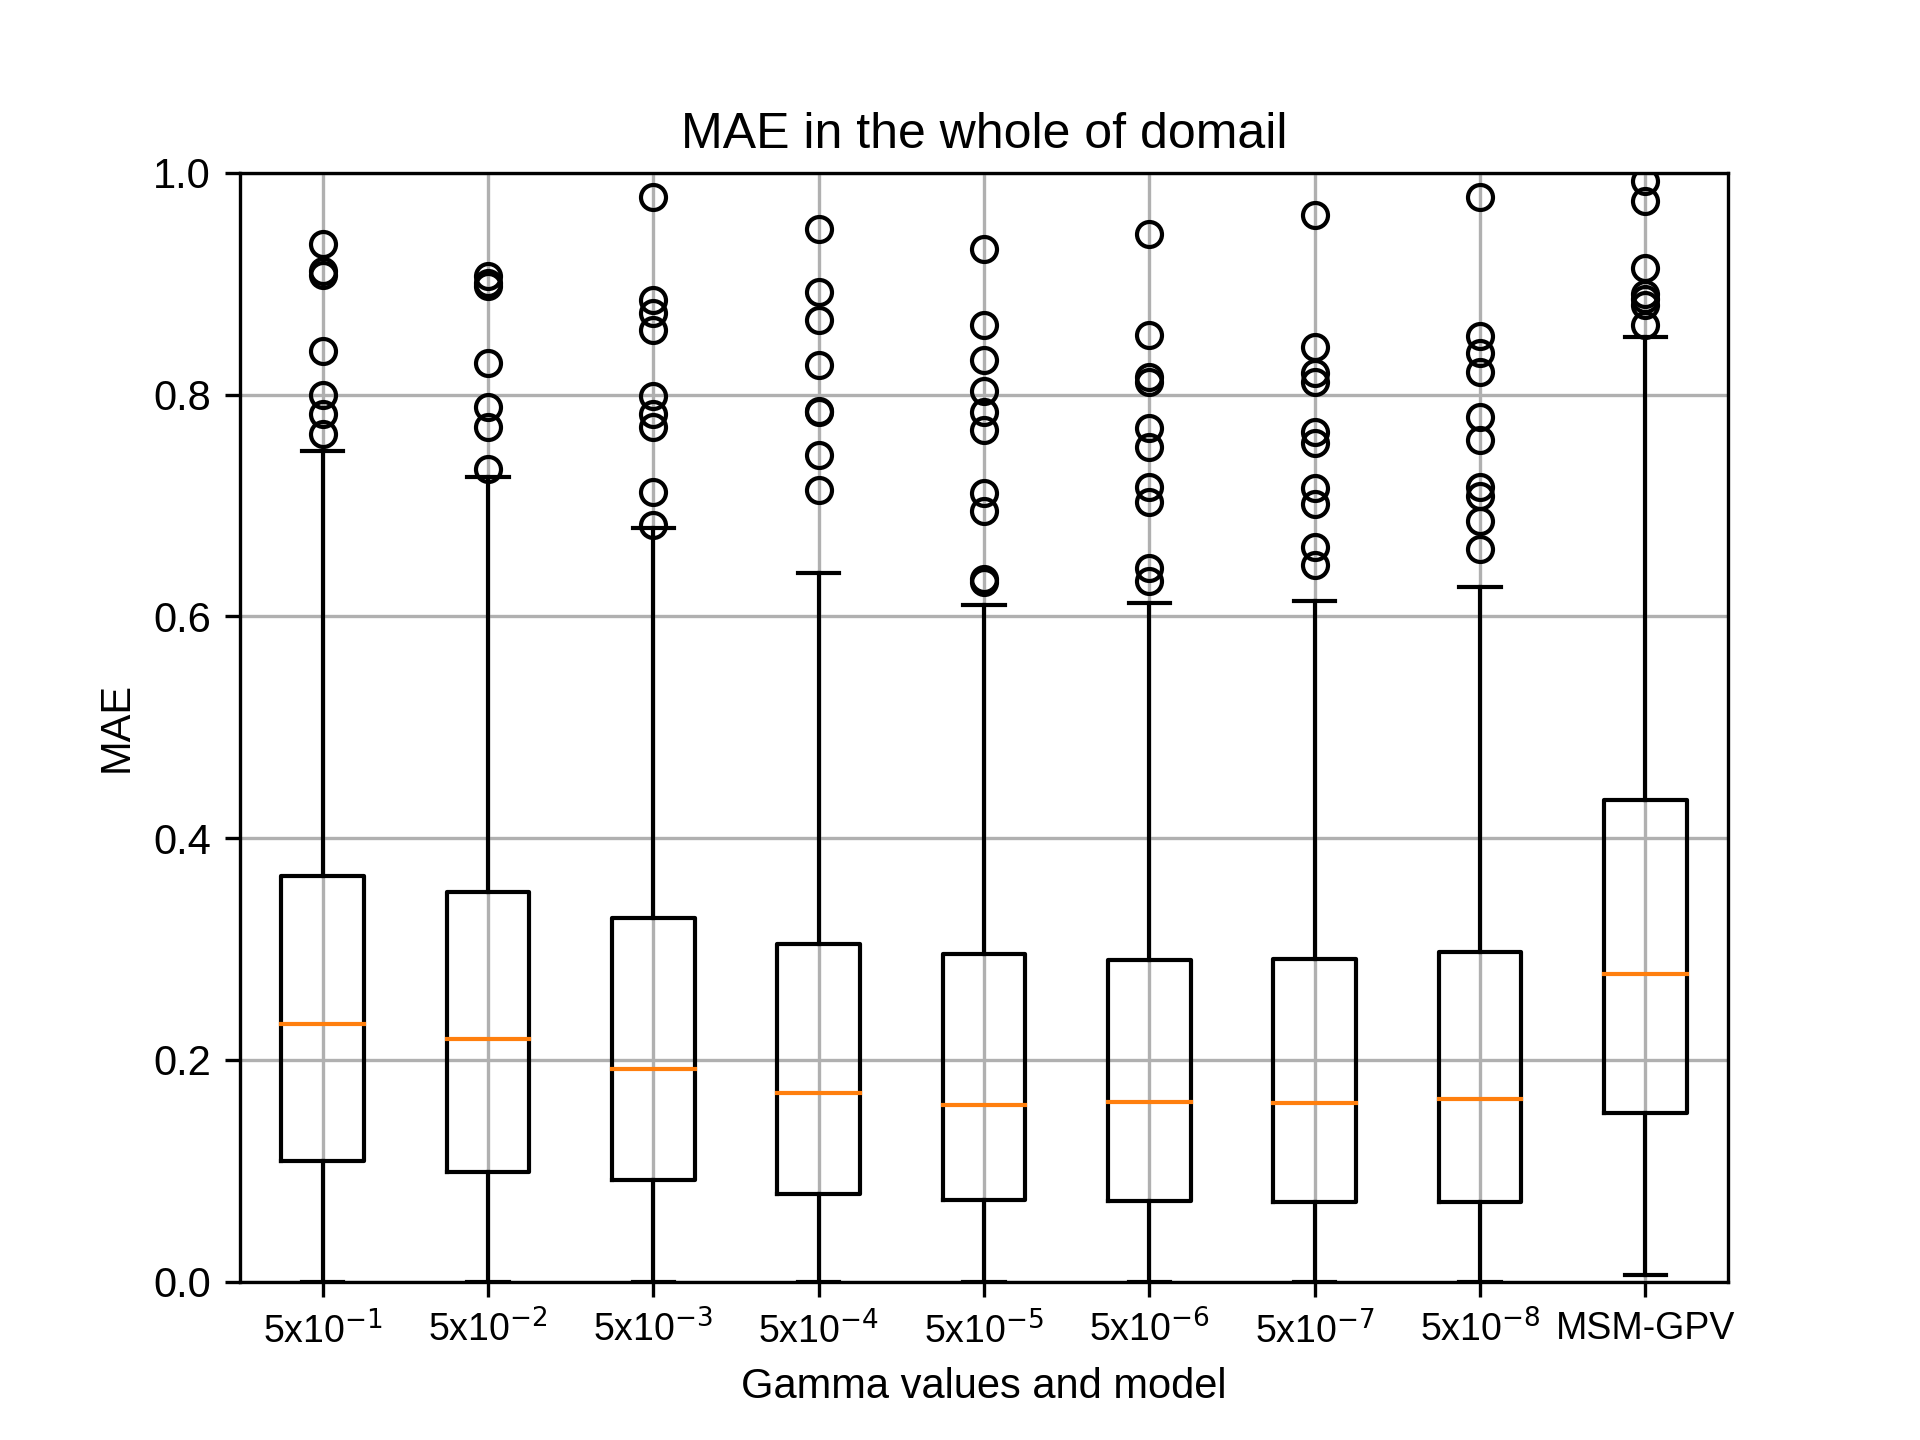
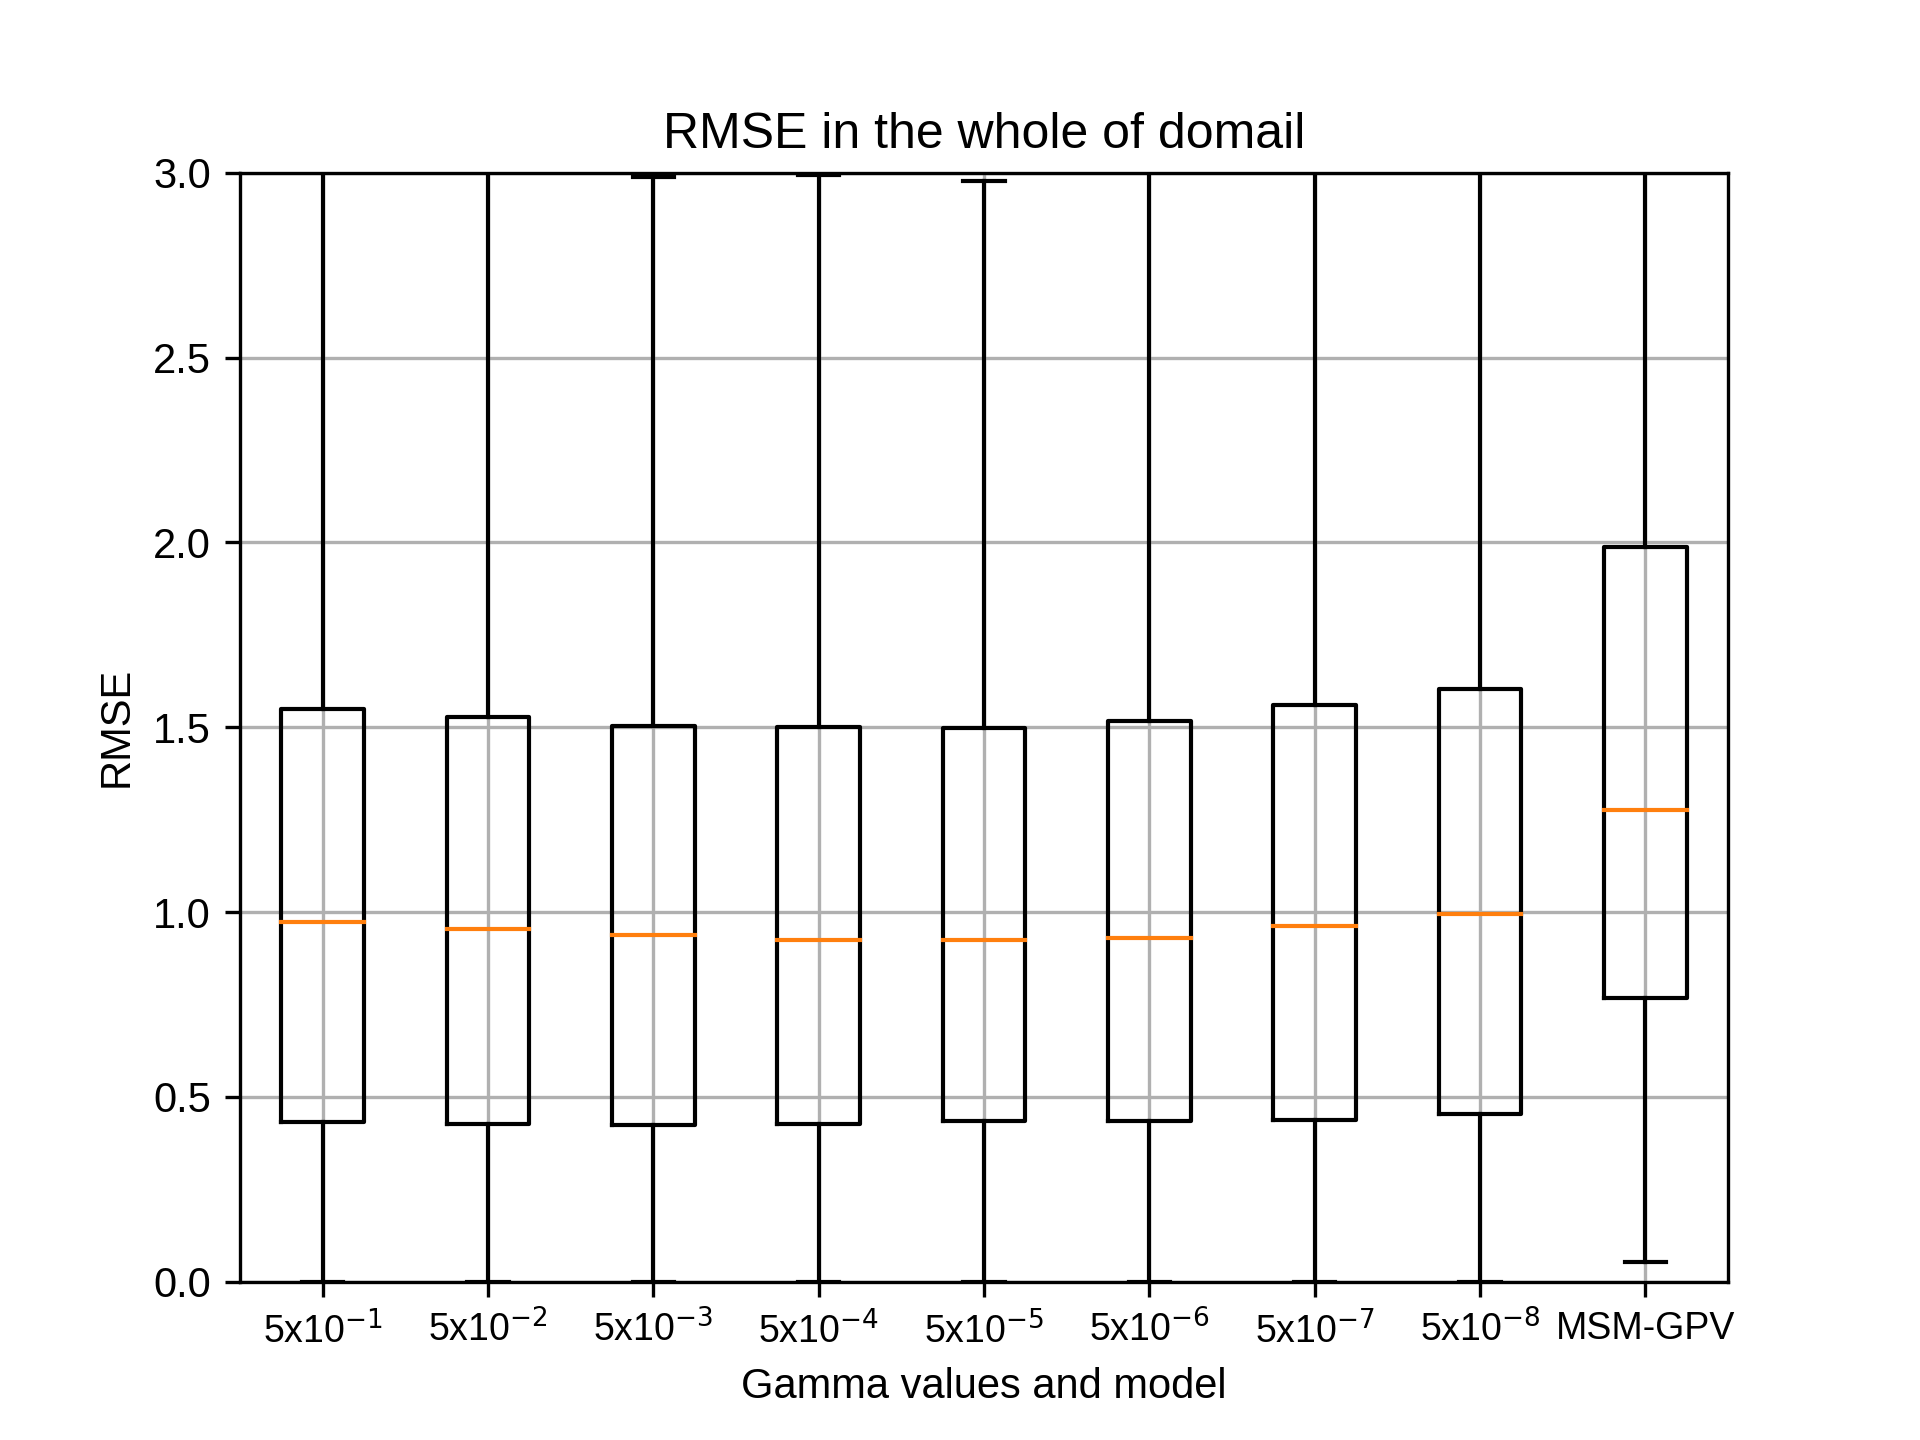
10月のsiteE,rg2=8の結果です。
kobayashi_yusukeMonday, November 16th, 2020 at 5:30:04 PM GMT+09:00

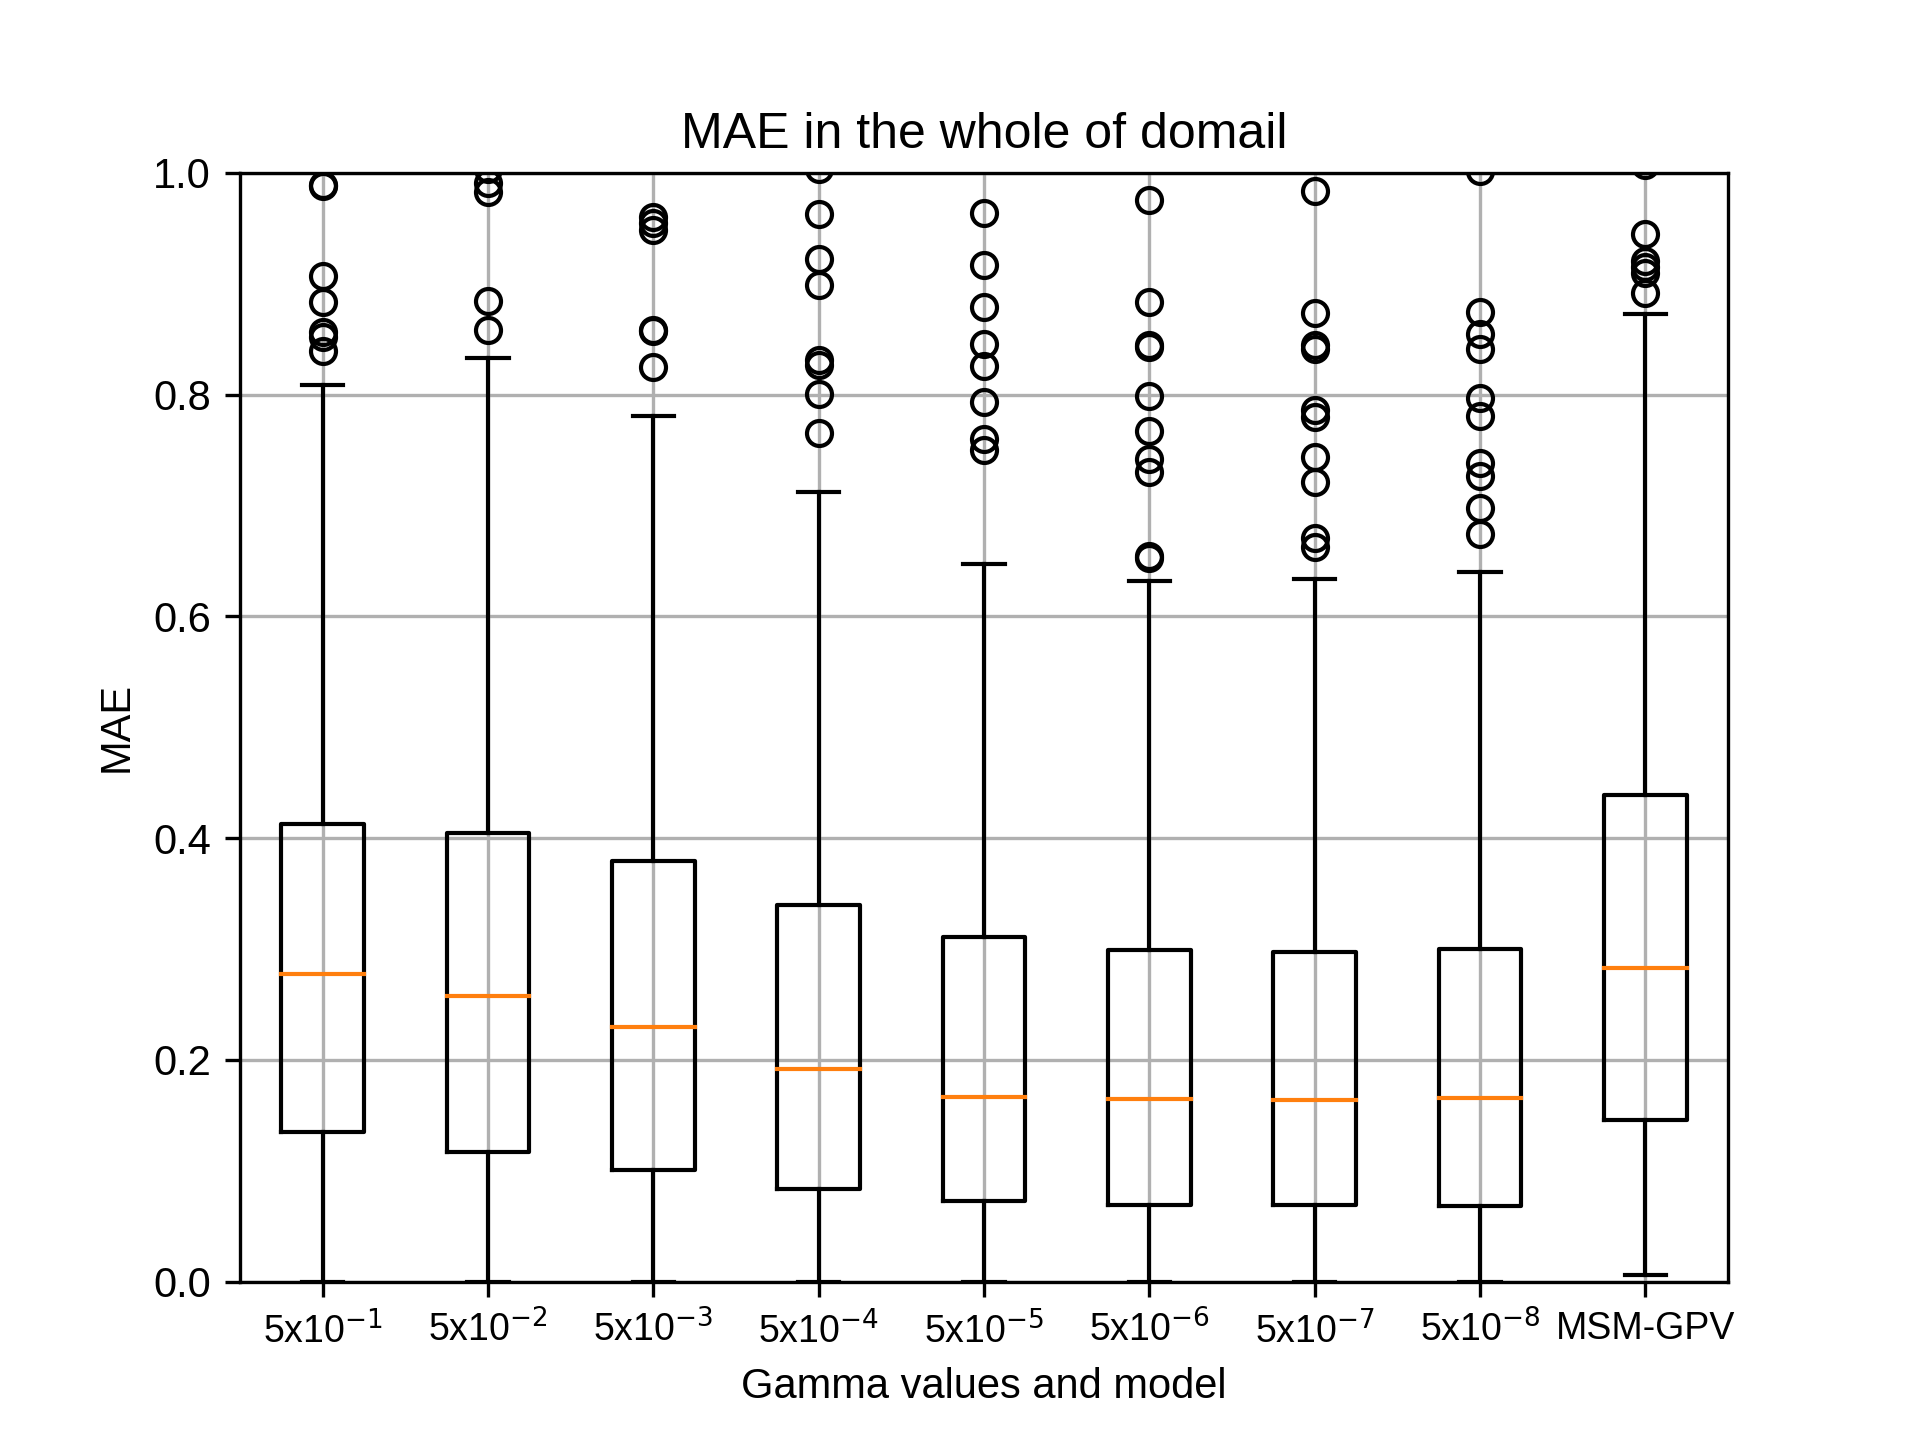
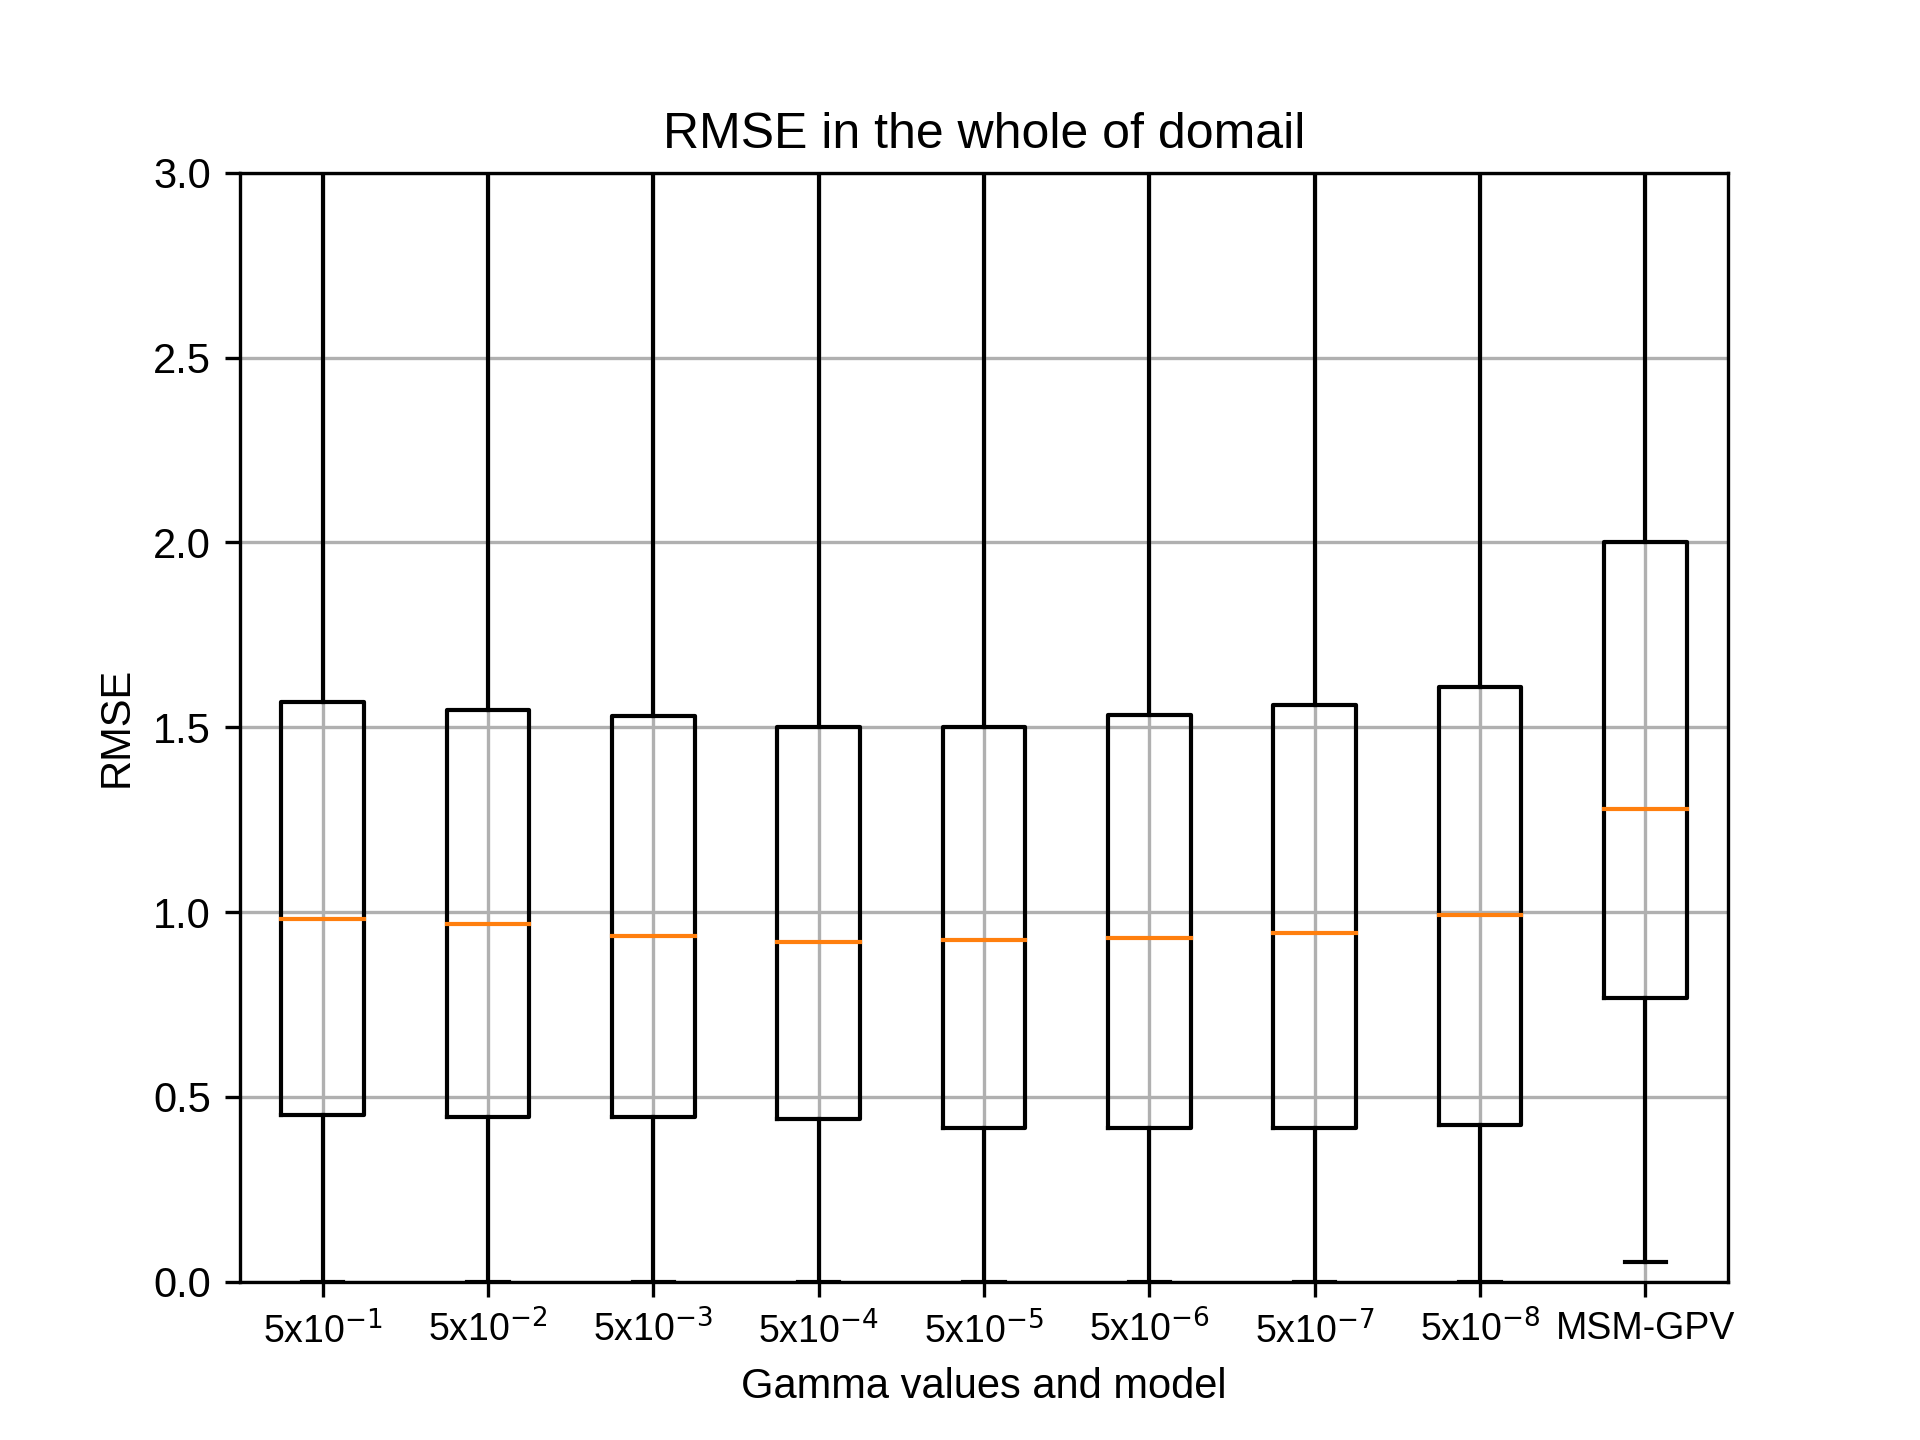
10月のsiteE,rg2=10の結果です。
kobayashi_yusukeMonday, November 16th, 2020 at 5:30:23 PM GMT+09:00
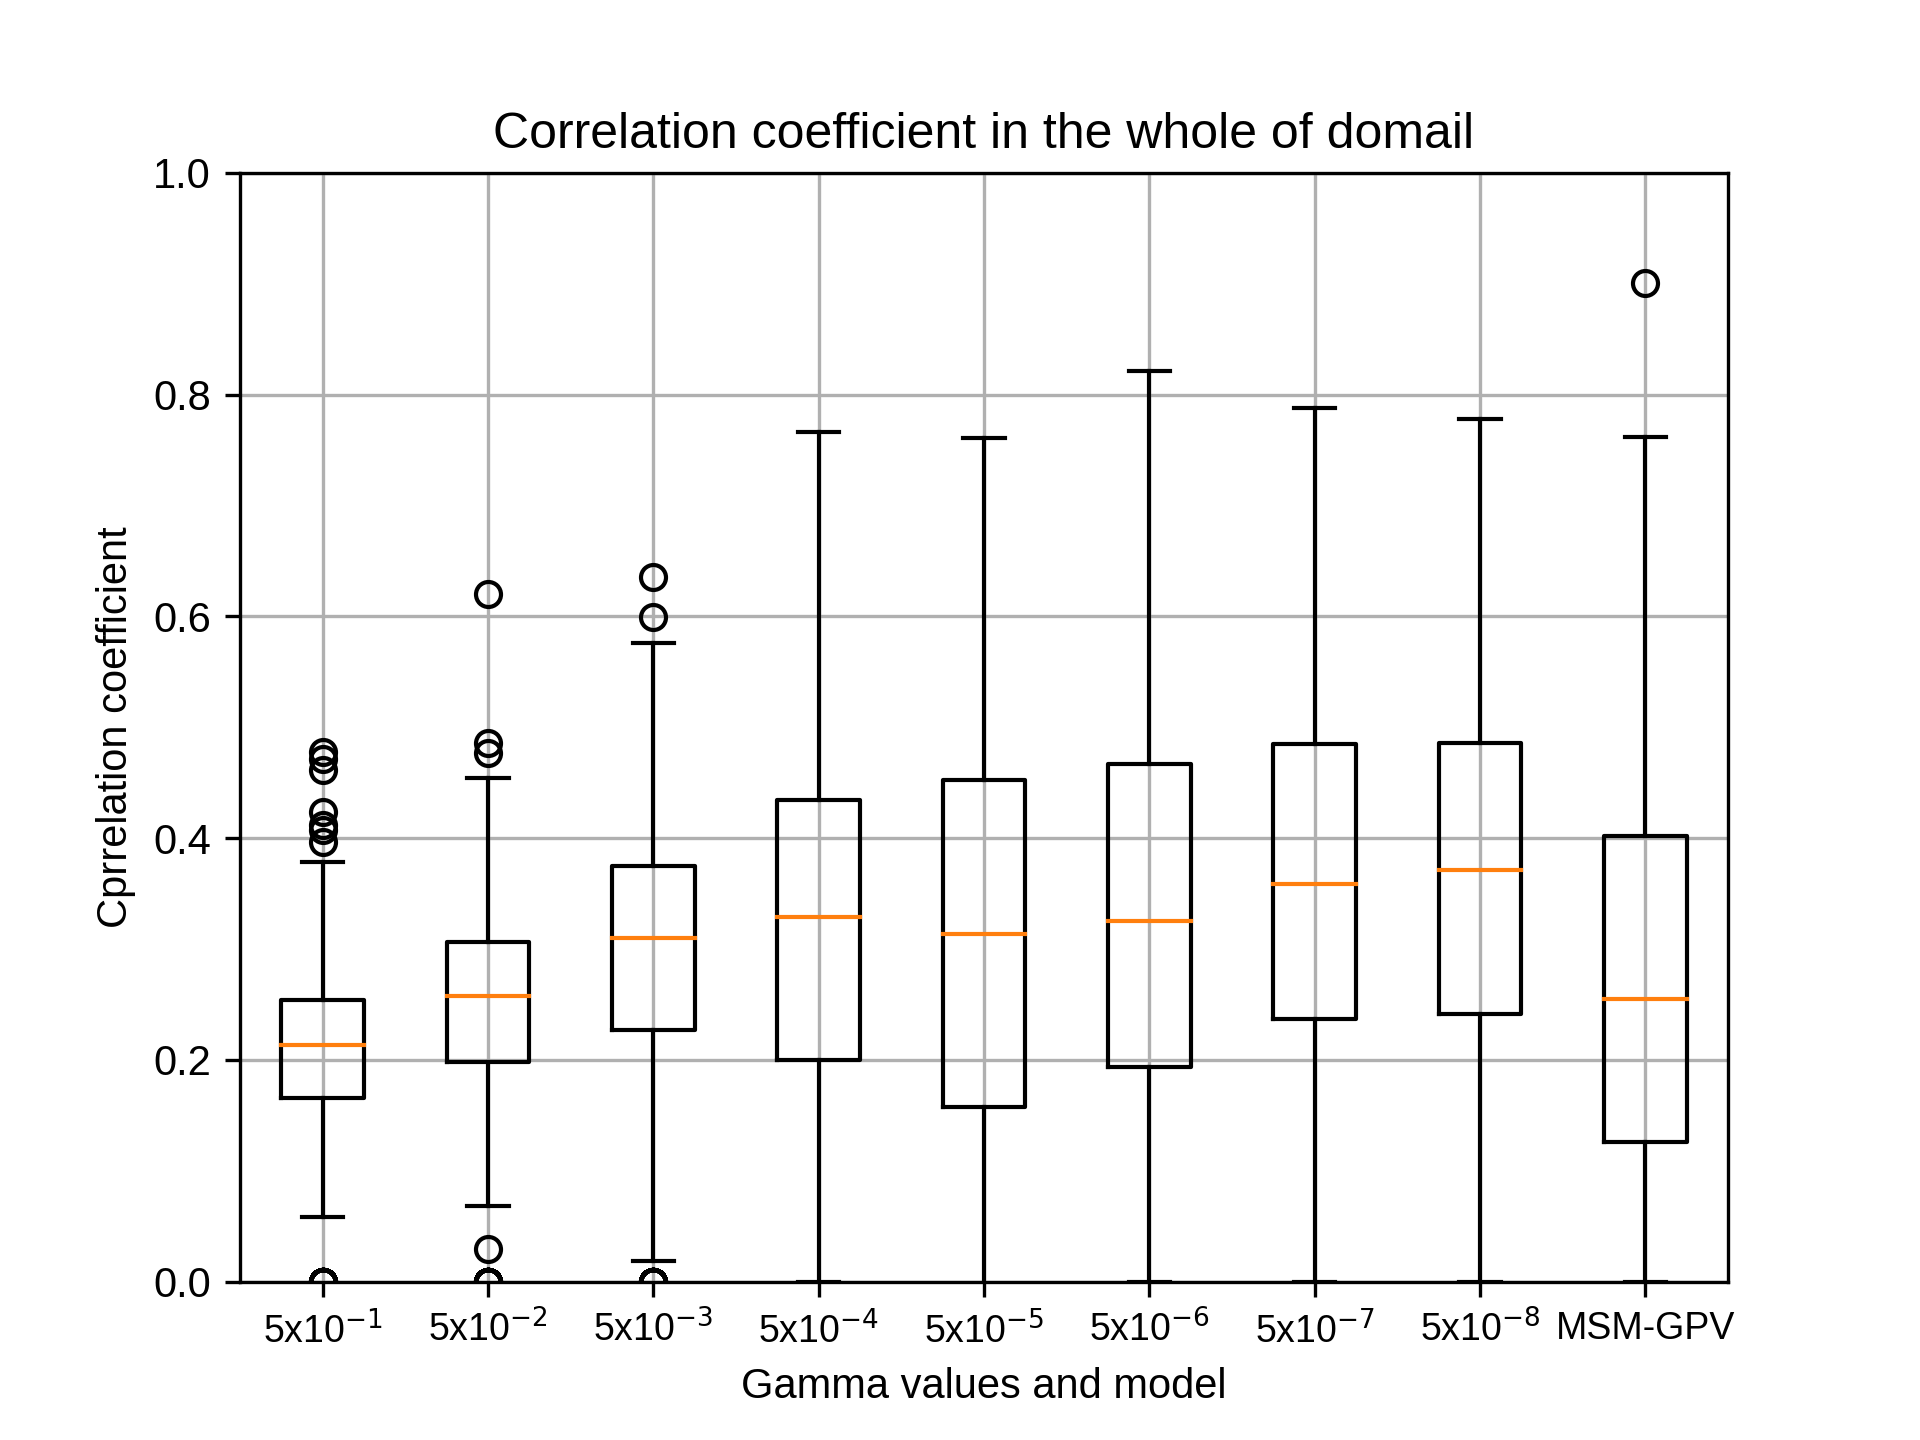
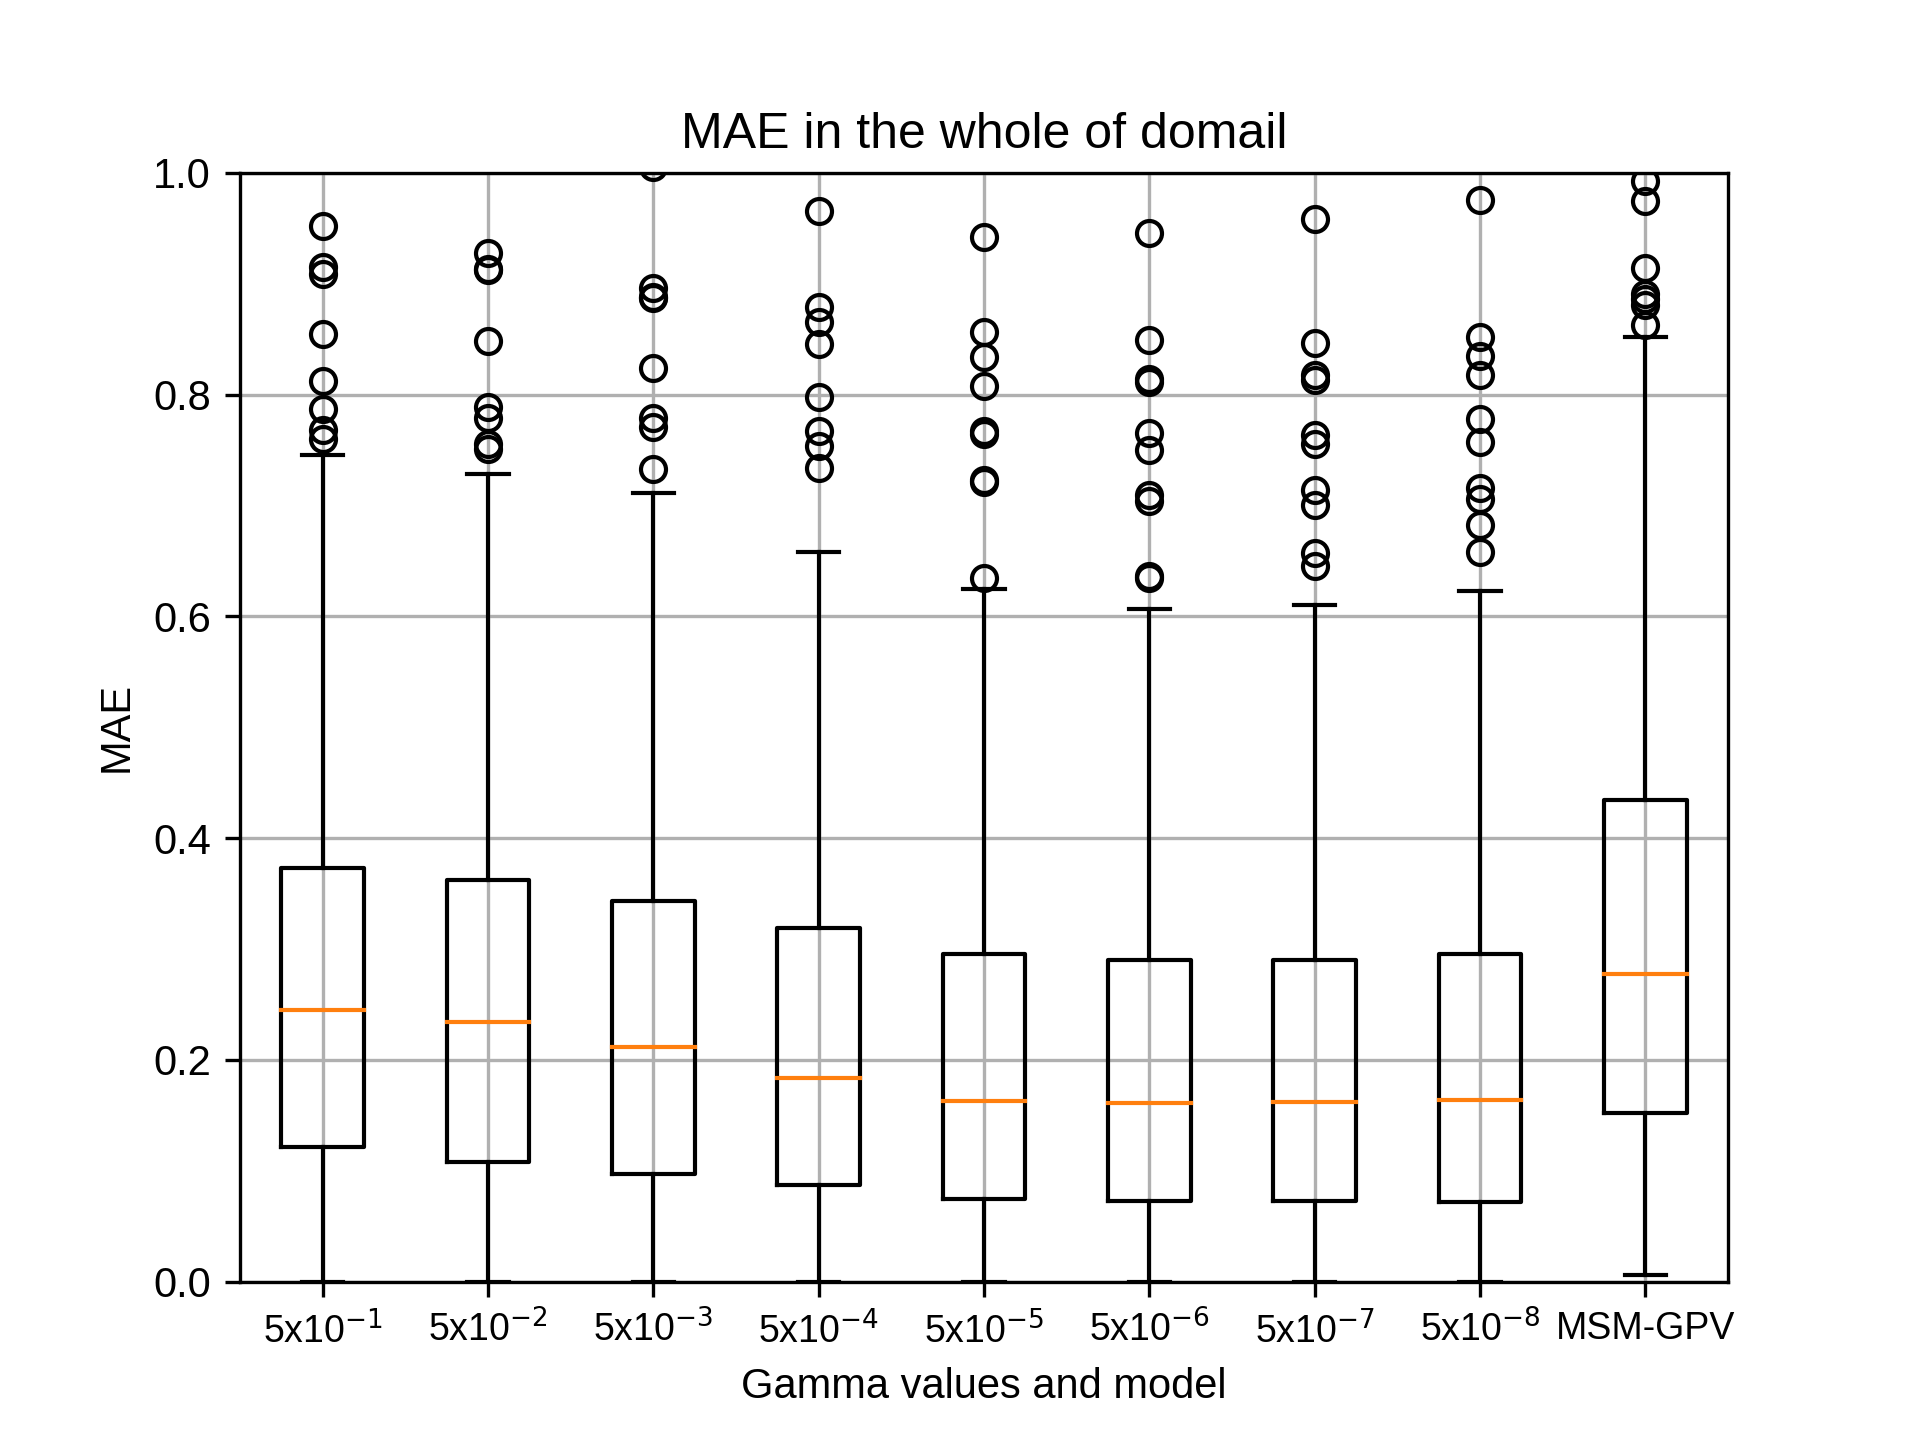
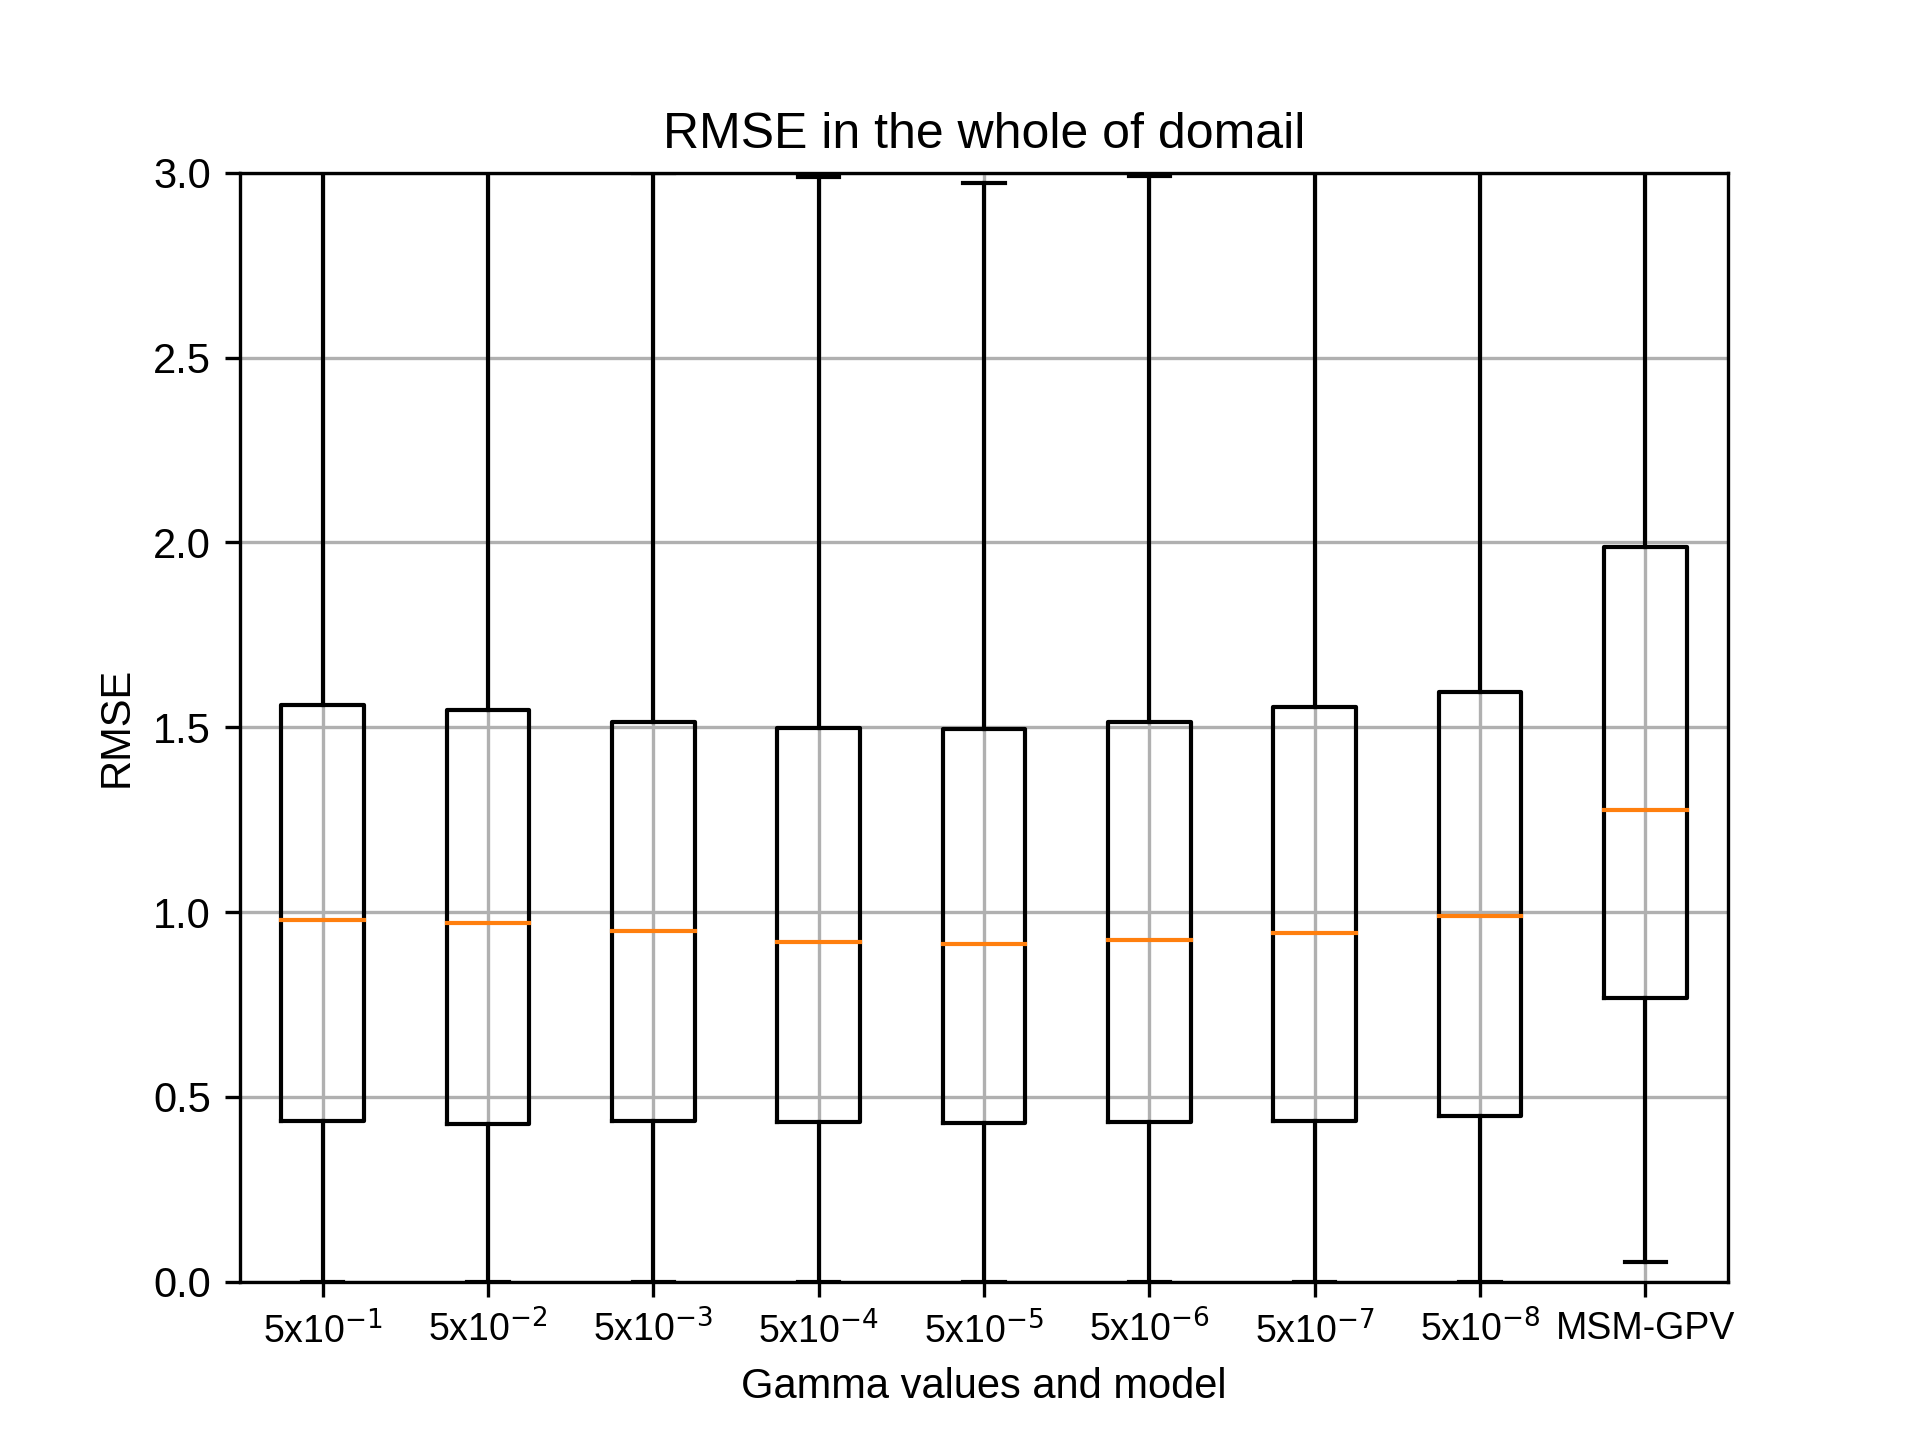
10月のsiteE,rg2=12の結果です。
10月のsiteEではrg2=12でgammaが5x10⁻⁸のとき、相関係数の中央値が最も高くなりました。
10月のsiteEではrg2=12でgammaが5x10⁻⁸のとき、相関係数の中央値が最も高くなりました。
kobayashi_yusukeMonday, November 16th, 2020 at 5:30:30 PM GMT+09:00
10月をまとめますと、特徴量ベクトルは8もしくは12のときに相関係数の中央値が最も高くなりました。ただ、8,10,12でほとんど差はございませんでした。
gammaの値はすべて当初のgamma値と同じ値で最大になりました。
最初のエクセルファイルにまとめておりますのでご参照ください。
1,4,7,10月をまとめますと、特徴量ベクトルは8,10もしくは12のときに相関係数の中央値が最も高くなりました。ただ、8,10,12でほとんど差はございませんでした。
計算機のパフォーマンスを考えた場合には、8もしくは10がベストではないかと考えております。
以上、よろしくお願いいたします。
gammaの値はすべて当初のgamma値と同じ値で最大になりました。
最初のエクセルファイルにまとめておりますのでご参照ください。
1,4,7,10月をまとめますと、特徴量ベクトルは8,10もしくは12のときに相関係数の中央値が最も高くなりました。ただ、8,10,12でほとんど差はございませんでした。
計算機のパフォーマンスを考えた場合には、8もしくは10がベストではないかと考えております。
以上、よろしくお願いいたします。
takao-yWednesday, November 18th, 2020 at 7:46:47 AM GMT+09:00
小林様
吉兼です。ありがとうございます。8以上でそれほど差がないということは、MSM-GPV(5km)の降水特性を認識するには、約75km四方以上の領域であれば良いということでしょうか。メソベータスケール(寒冷前線、温暖前線、停滞前線など)に伴う降水特性を認識するにはその程度の大きさが必要?
吉兼です。ありがとうございます。8以上でそれほど差がないということは、MSM-GPV(5km)の降水特性を認識するには、約75km四方以上の領域であれば良いということでしょうか。メソベータスケール(寒冷前線、温暖前線、停滞前線など)に伴う降水特性を認識するにはその程度の大きさが必要?
kobayashi_yusukeWednesday, November 18th, 2020 at 10:50:12 AM GMT+09:00
吉兼先生
小林です。お返事ありがとうございます。8ですと17x17になりますので、約85km四方以上となります。降雨特性については私は不勉強のところですが、統計的には8,10,12でそれほど変わらない結果となっております。以上、よろしくお願いいたします。
小林です。お返事ありがとうございます。8ですと17x17になりますので、約85km四方以上となります。降雨特性については私は不勉強のところですが、統計的には8,10,12でそれほど変わらない結果となっております。以上、よろしくお願いいたします。
takao-yFriday, December 4th, 2020 at 2:39:14 PM GMT+09:00
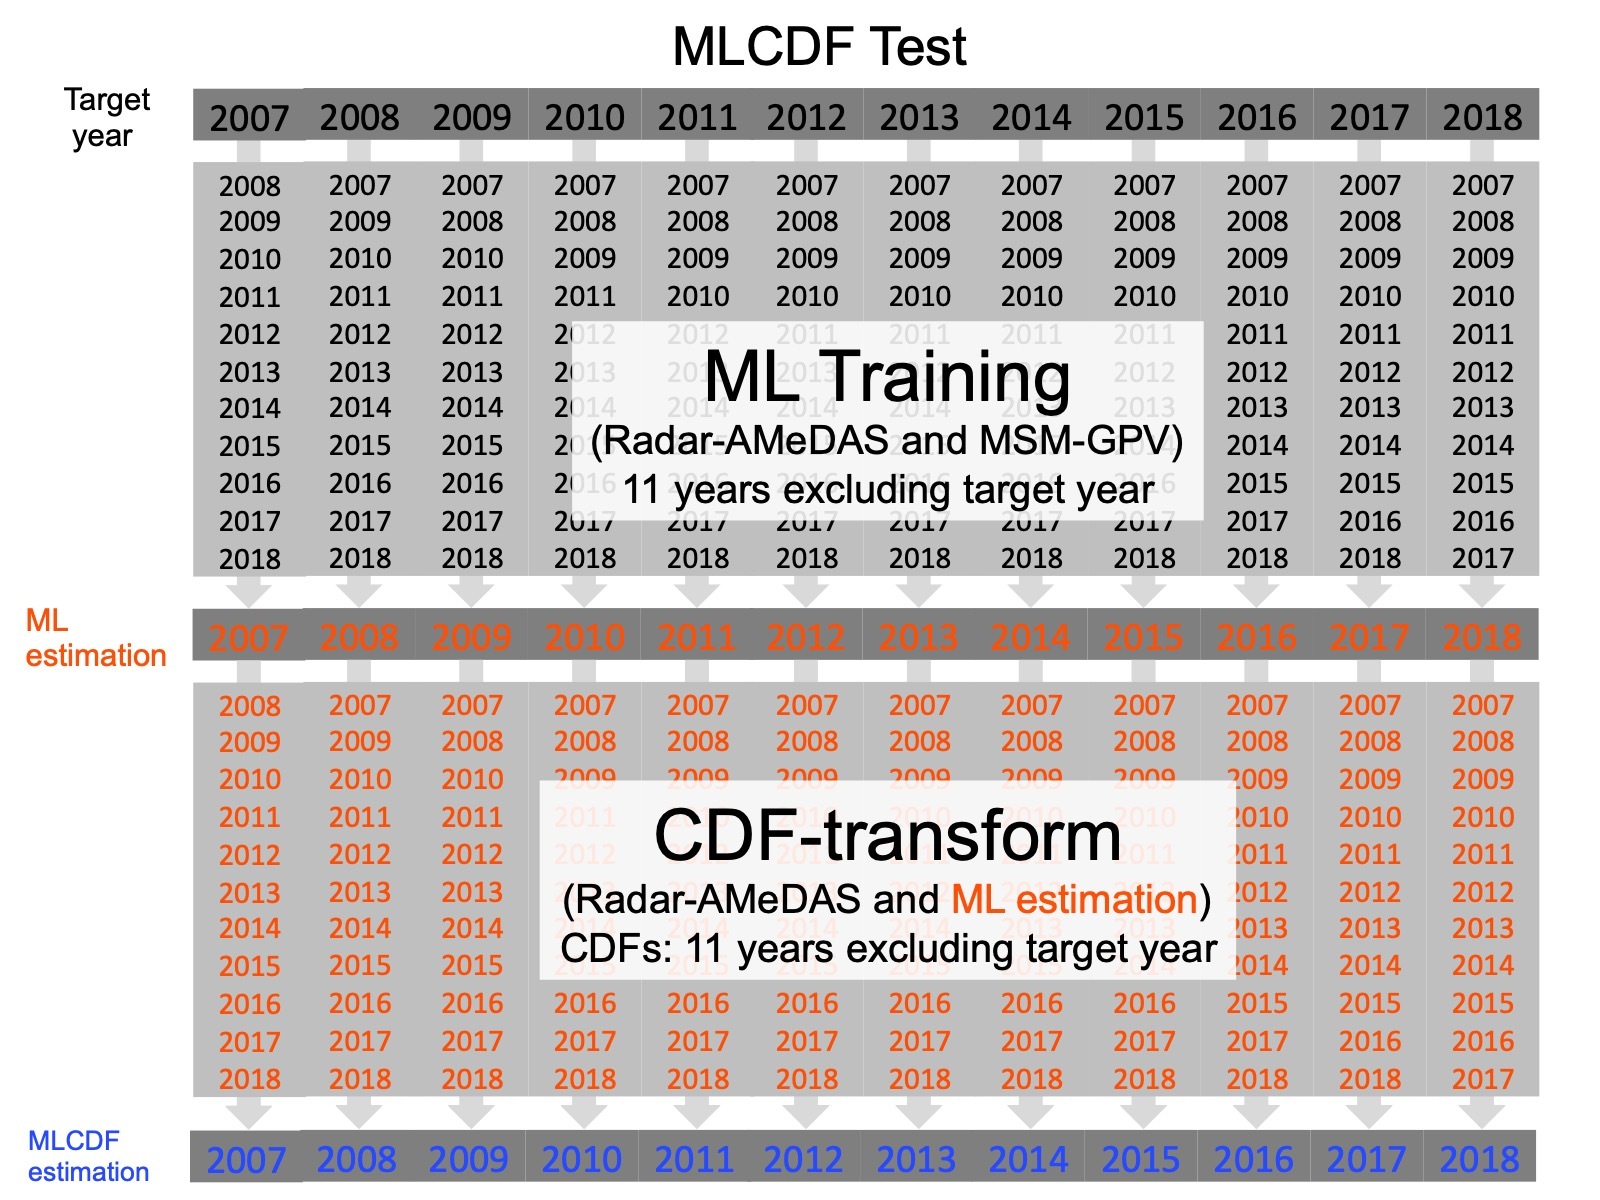
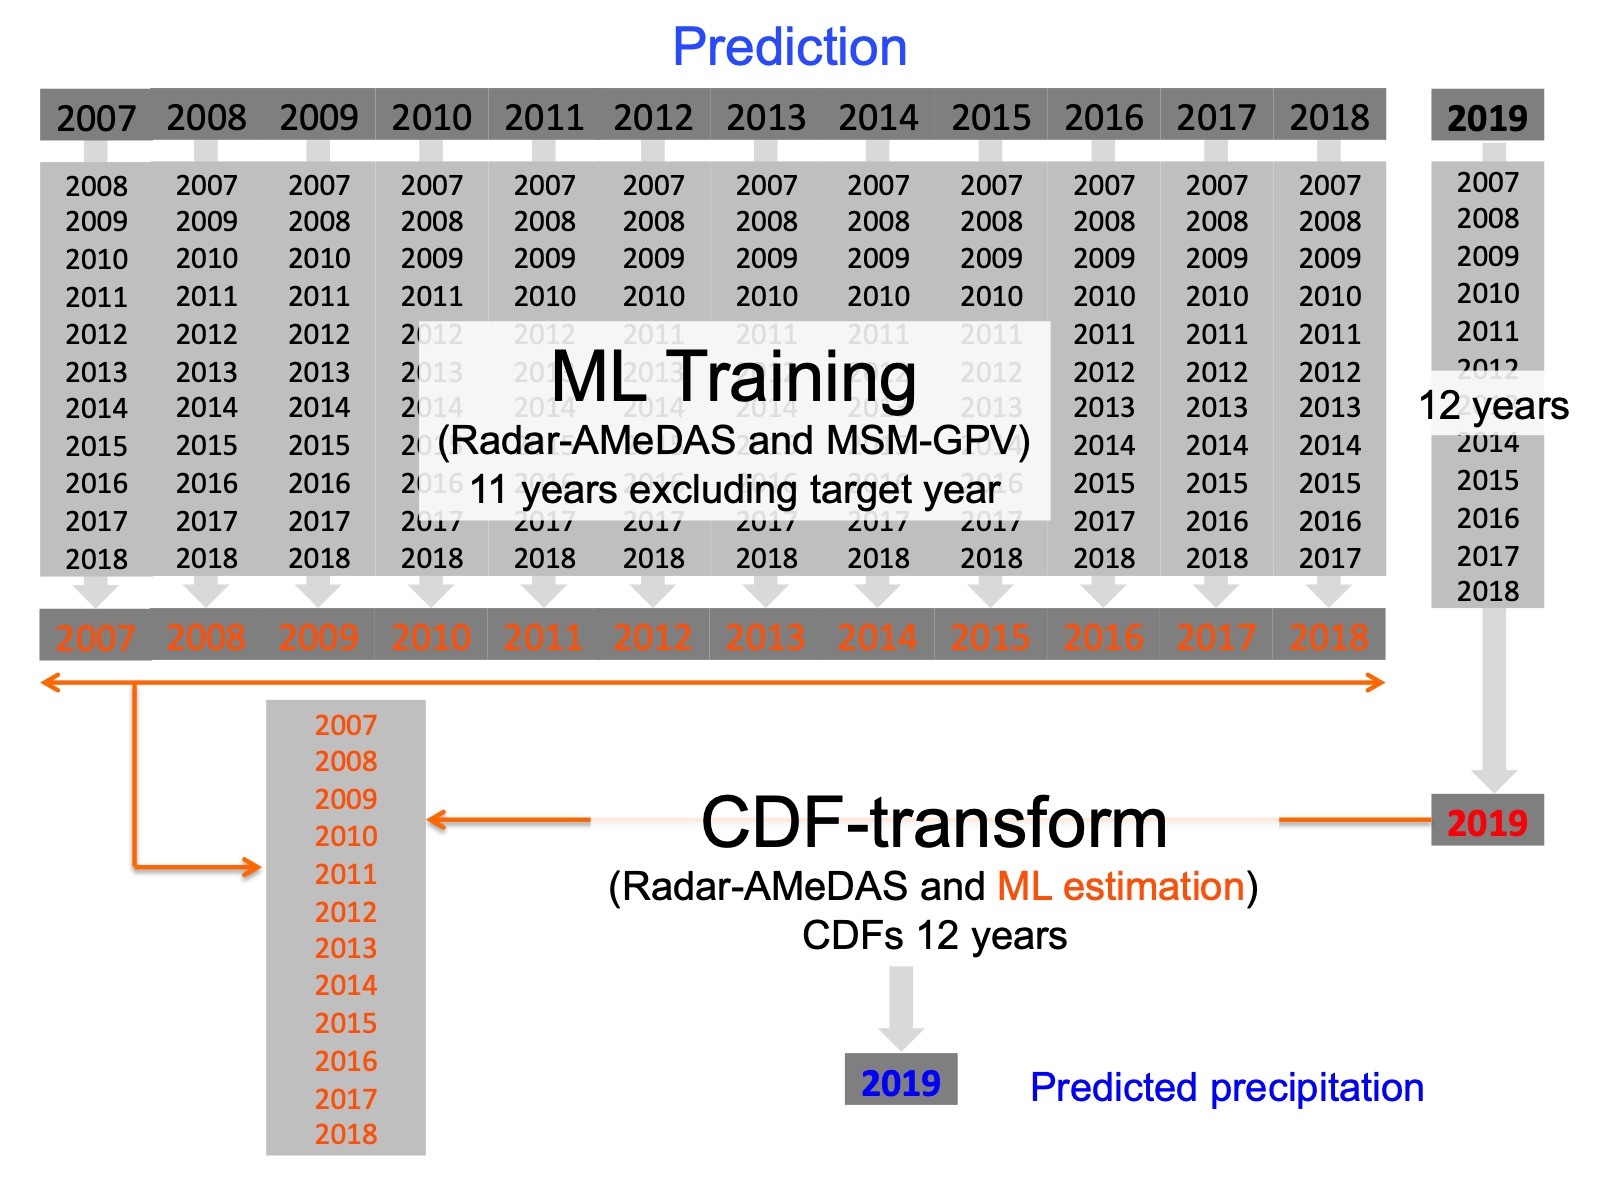
吉兼です。確認のため、機械学習の訓練期間とテスト期間およびCDF作成のためのデータのフローチャートを作成してみました。図を添付します。機械学習で訓練年にテスト年を含むと答えを教えていることになり推定の意味がなくなるため、テスト年を除いた11年間で訓練します。(テスト年を含めた場合、統計処理をしているので全く同じになることはないのですが、影響を強く受けますので結果として汎化能力が低下します。)CDF過程も同様に対象年を除いてCDFを作成します。その場合は年々変動により対象年毎にCDFが変化します。あまりにも変動の影響が大きい場合はそれが誤差要因となり、パフォーマンスが低下します。なるべく長期間でCDFを作成した方が年々変動による誤差を小さくできます。対象年を含めてCDFを作る場合はどの年も同じCDFを適用するため年々変動が見かけ上なくなるのですが、作成したCDFに偏りがないかどうかのチェックもできなくなるため、別の年を推定する際の信頼性が低くなります。作成したCDFの信頼性を調査するために対象年を除いてCDFを作成しています。機械学習、CDF過程を経て得られた結果に問題ないかをチェックした上で、予報値の補正を行います。このような(面倒かつ複雑な)手順を踏むことにより、信頼性の高い推定値を得ることが可能になります。
問題点や説明がよく分からないなどありましたら、ご指摘いただければ幸いです。
問題点や説明がよく分からないなどありましたら、ご指摘いただければ幸いです。
takao-yFriday, December 4th, 2020 at 2:56:47 PM GMT+09:00
とはいえ、12年程度では特に夏季は機械学習、CDF補正共に十分ではないため、データを増やす必要があります。今までは月毎で学習していましたが、対象月を中心に3ヶ月間に学習期間を増やした方が良さそうです。(確か、以前に小林さんに実施していただいたものは3ヶ月で学習されていたと思います。若干時間がかかりますが、その方が良さそうです。) 吉兼
takao-ySaturday, December 5th, 2020 at 11:21:14 AM GMT+09:00
吉兼です。バイナリ版についてpele-nの/home/takao-y/mlcdft-bin/ml-region1-all-python4-jaxaにコピーして、領域限定でテストを行なっています。(学習期間を対象月を挟んで3ヶ月で設定。とりあえず20072014までの8年間を学習、20152019の5年間をテスト。CDFも20072014で作成し、20152019を補正)。今の所順調に作動しています。同じものをisotope3でも動かしており、終了後に出力データの確認を行います。もしよろしければ、コピーして動作確認をお願いできますでしょうか。(学習を3ヶ月に拡張したことにより、プロセスの一部を手動で行う必要があります。全自動化を検討中。)
また、作業用ディレクトリとして我々も/goemon_disk2を使わせていただいてもよろしいでしょうか。
バイナリ版では、I/Oのアクセスが軽減しており、計算機への負荷も軽減されると期待しています。ただ、同時並行計算を実施した場合のサーバーへの影響を把握していないため、もし可能でしたら計算サーバー(およびネットワーク)の負荷をモニタリングしていただければ幸いです。
よろしくお願いいたします。
また、作業用ディレクトリとして我々も/goemon_disk2を使わせていただいてもよろしいでしょうか。
バイナリ版では、I/Oのアクセスが軽減しており、計算機への負荷も軽減されると期待しています。ただ、同時並行計算を実施した場合のサーバーへの影響を把握していないため、もし可能でしたら計算サーバー(およびネットワーク)の負荷をモニタリングしていただければ幸いです。
よろしくお願いいたします。
gyinMonday, December 7th, 2020 at 11:42:56 AM GMT+09:00
Dear Yoshikane-sensei,
I was trying to go the the directory you mentioned for the binary version. However, when I change direction to your folder, it shows "??????". I guess it is because of the file permissions not open to the group. Could you please check it? Thank you!
Best regards,
Gaohong
I was trying to go the the directory you mentioned for the binary version. However, when I change direction to your folder, it shows "??????". I guess it is because of the file permissions not open to the group. Could you please check it? Thank you!
Best regards,
Gaohong
takao-yMonday, December 7th, 2020 at 1:25:07 PM GMT+09:00
Dear Yin-san,
I changed the file permission. Please check it again. (Please do not forget to copy “ml” directory. MSM-GPV and Radar_AMeDAS data are included in ml directory.)
Best Regards,
T. Yoshikane
I changed the file permission. Please check it again. (Please do not forget to copy “ml” directory. MSM-GPV and Radar_AMeDAS data are included in ml directory.)
Best Regards,
T. Yoshikane
gyinMonday, December 7th, 2020 at 4:11:17 PM GMT+09:00
Dear Yoshikane-sensei,
Thank you for your reply! I tried it and it still shows “許可がありません“. I am not sure but maybe the directory access (/home/takao-y) permission is also needed? I currently cannot go to the directory (/home/takao-y) at pele-n as well.
Could you please check it when you have time. Thank you again!
Best regards,
Gaohong
yamamoto.kosukeWednesday, December 23rd, 2020 at 6:16:50 PM GMT+09:00
@takao-y @gyin
Sorry for the late reply. I changed the permission of /home/takao-y/ so that you can access.
Since I have confirmed the original mlcdft-bin, that learns only one month, is running with no problem, I am trying to make classifier for all grids using 2007-2018 data. Should I wait for your results by the new mlcdft-bin, that learns 3 months?
yamamoto.kosukeWednesday, December 23rd, 2020 at 6:19:51 PM GMT+09:00
@takao-y @gyin
As for the goemon_disk2, we do not recommend to use since it is almost full. We can let you know other workspace if you can tell me how much storage you need.
As for the goemon_disk2, we do not recommend to use since it is almost full. We can let you know other workspace if you can tell me how much storage you need.
takao-yWednesday, December 16th, 2020 at 2:35:11 PM GMT+09:00
小林様
お世話になっております。吉兼です。
2019年のデータですが、JAXAサーバーで利用は可能でしょうか。参考までに、芳村研で購入した2019年分の雨量解析データを
pele-n:/home/takao-y/pub/に置きました。もしよろしければ、差し当たりお使いいただければ幸いです。よろしくお願いいたします。
お世話になっております。吉兼です。
2019年のデータですが、JAXAサーバーで利用は可能でしょうか。参考までに、芳村研で購入した2019年分の雨量解析データを
pele-n:/home/takao-y/pub/に置きました。もしよろしければ、差し当たりお使いいただければ幸いです。よろしくお願いいたします。
takao-yWednesday, December 16th, 2020 at 3:09:43 PM GMT+09:00
小林様
度々すみません。Yinさんからの情報によると、
/goemon_disk2/trmmauto/AI_GSMaP/svm-msm-wj-201906/MSMGPV/data1/siteB
の2007年4月のデータについて、データサイズが117(longitude)x134(latitude)x723(1ヶ月のデータ数: 実際には720であるはず)となっていて、さらに全ての-999,000,000.(欠測?)となっているそうです。(siteCなどは特に問題はないそうです。)ご確認いただけますでしょうか。
よろしくお願いいたします。
度々すみません。Yinさんからの情報によると、
/goemon_disk2/trmmauto/AI_GSMaP/svm-msm-wj-201906/MSMGPV/data1/siteB
の2007年4月のデータについて、データサイズが117(longitude)x134(latitude)x723(1ヶ月のデータ数: 実際には720であるはず)となっていて、さらに全ての-999,000,000.(欠測?)となっているそうです。(siteCなどは特に問題はないそうです。)ご確認いただけますでしょうか。
よろしくお願いいたします。
gyinWednesday, December 16th, 2020 at 3:22:25 PM GMT+09:00
Dear Yoshikane-sensei,
I did a quick look at the MSM-GPV April data for other sites as well (sites A, D, and E). It seems only site B has the problem with all values given as -999,000,000. But for all sites, the number of hours are given as 723.
Thank you very much!
Best regards,
Gaohong
I did a quick look at the MSM-GPV April data for other sites as well (sites A, D, and E). It seems only site B has the problem with all values given as -999,000,000. But for all sites, the number of hours are given as 723.
Thank you very much!
Best regards,
Gaohong
yamamoto.kosukeWednesday, December 23rd, 2020 at 6:20:31 PM GMT+09:00
@kobayashi_yusuke
すみませんが、こちらについてはご確認いただけますでしょうか?
すみませんが、こちらについてはご確認いただけますでしょうか?
uwatokoWednesday, January 13th, 2021 at 9:40:54 PM GMT+09:00
すみません、ご確認が遅くなりました。
昨年9月に判明し、4月データを作成し直して処理を進めたのですが、
処理はjsbach11で実施したため、goemon_disk2にあるデータの更新
しておりませんでした。
更新しましたので、ご確認お願いします。
昨年9月に判明し、4月データを作成し直して処理を進めたのですが、
処理はjsbach11で実施したため、goemon_disk2にあるデータの更新
しておりませんでした。
更新しましたので、ご確認お願いします。
takao-yFriday, January 22nd, 2021 at 2:28:25 PM GMT+09:00
東上床様
ありがとうございます。
Yin-san,
Higashiuwatoko-san updated the data in goemon_disk2. Could you make sure that the data is correct?
ありがとうございます。
Yin-san,
Higashiuwatoko-san updated the data in goemon_disk2. Could you make sure that the data is correct?
gyinFriday, January 22nd, 2021 at 2:47:30 PM GMT+09:00
Dear Higashiuwatoko-san,
Thank you very much for updating the April data. Could you please guide the path to the updated data?
I tried to read the MSM-GPV data for site B from the following path on both zico-n and pele-n:
/goemon_disk2/trmmauto/AI_GSMaP/svm-msm-wj-201906/MSMGPV/data1/siteB/200804
However, it seems still all values inside the rsms-200804.grd are -999000000. Could you please double check it? Thank you very much!
Best regards,
Gaohong
takao-yThursday, January 7th, 2021 at 11:14:48 AM GMT+09:00
小林様
計算領域ですが、現在設定されているSiteA,B,C,D,Eでは日本全域をカバーできないようです。ご確認いただけますでしょうか。
吉兼
計算領域ですが、現在設定されているSiteA,B,C,D,Eでは日本全域をカバーできないようです。ご確認いただけますでしょうか。
吉兼
takao-yWednesday, January 13th, 2021 at 11:44:17 AM GMT+09:00
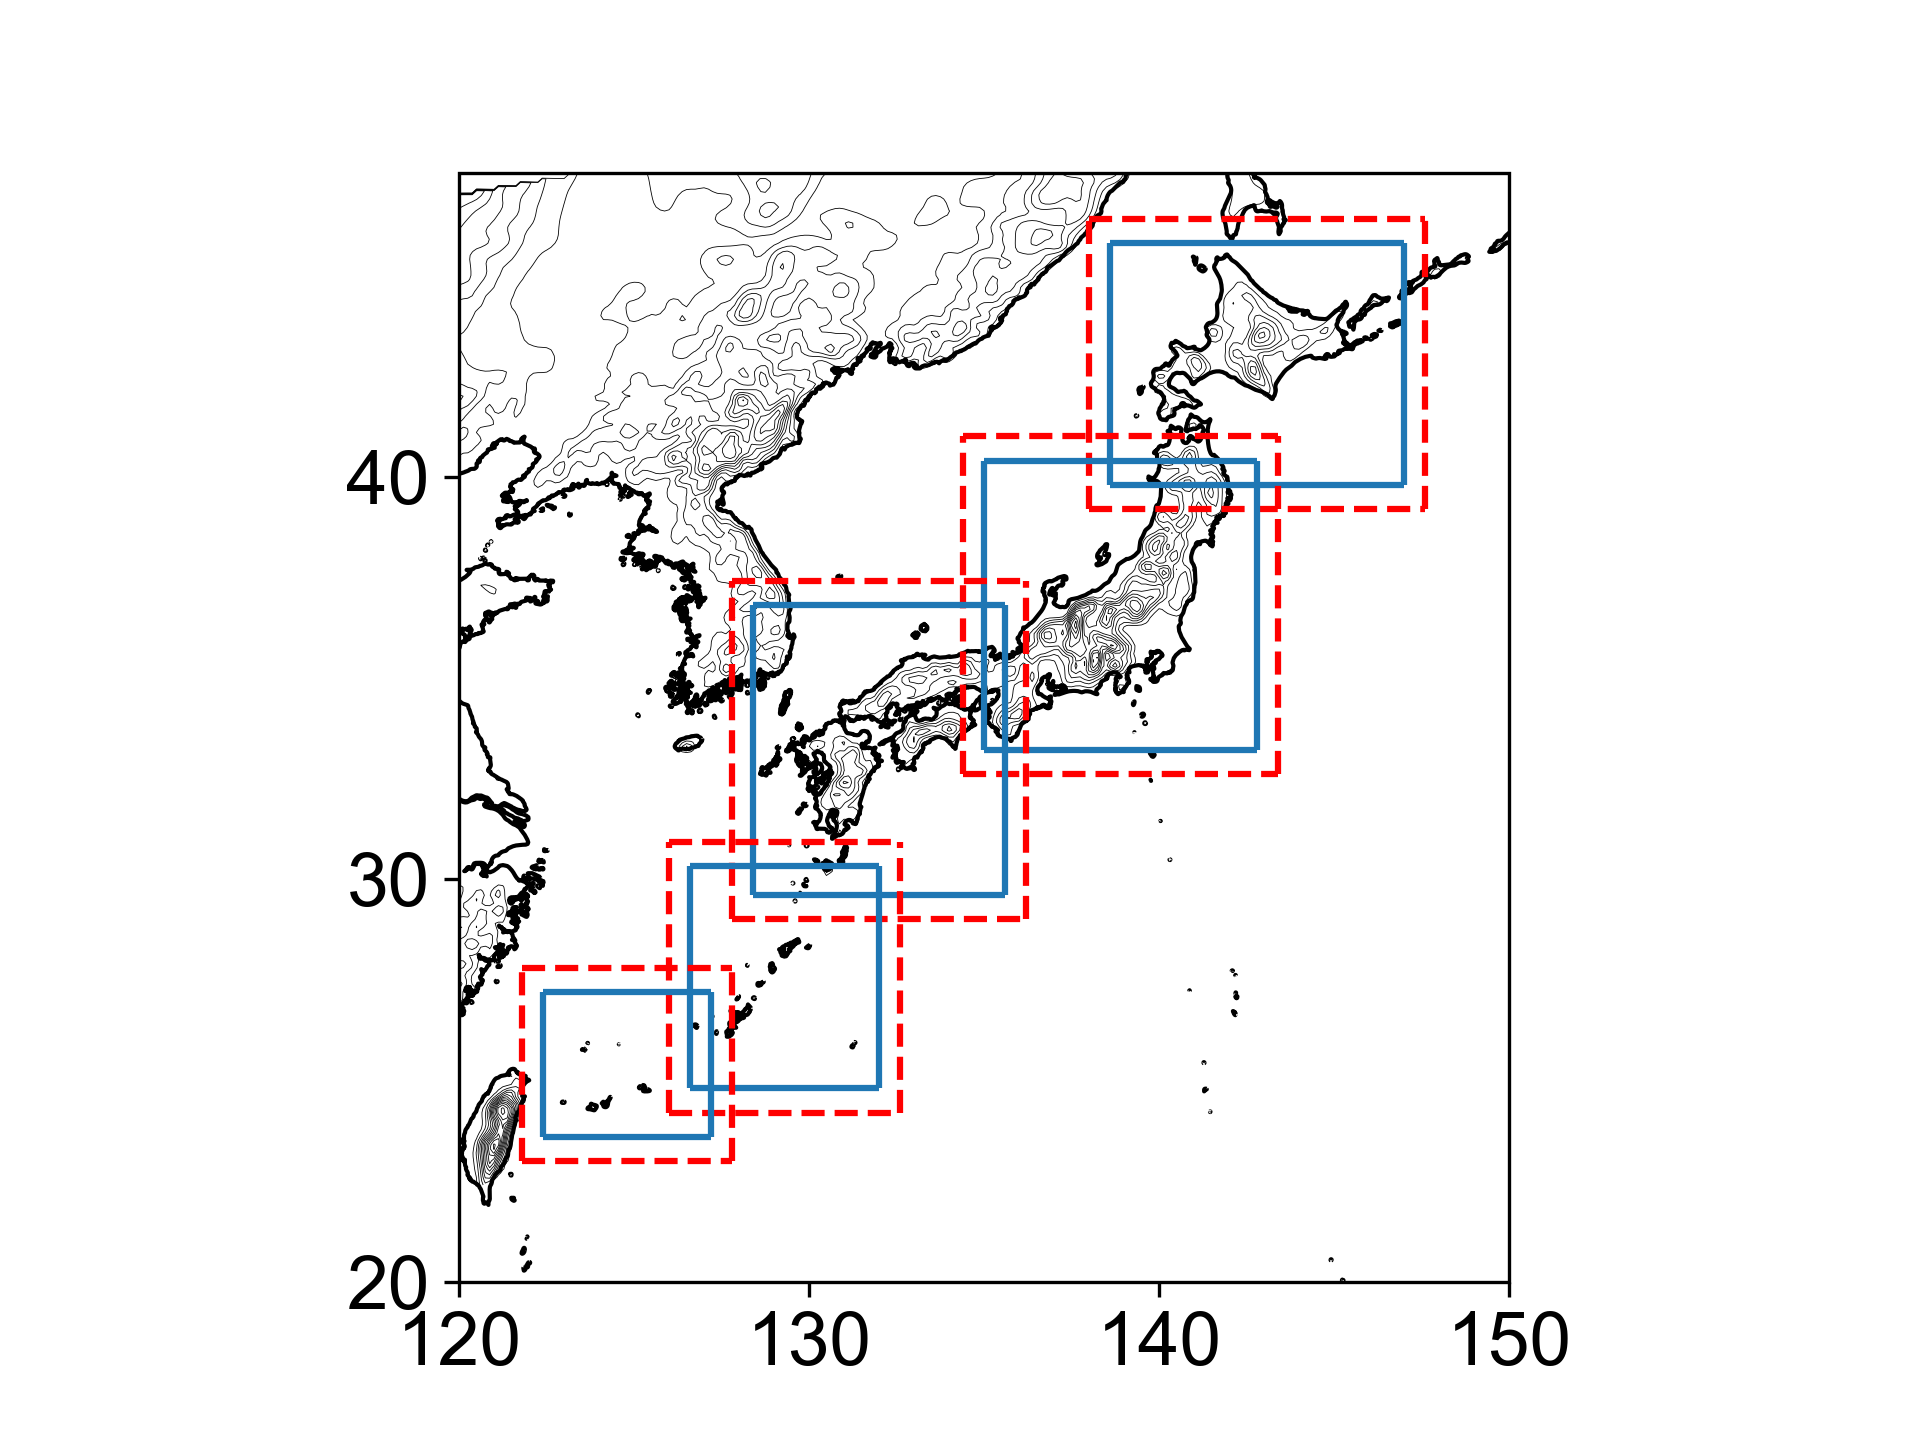
吉兼です。
小林さんが設定された領域に近くなるように再設定してみました。ご確認いただけますでしょうか。
各領域の緯度、経度は以下の通りです。
FVはMSMGPV作成のためのデータ領域です。
Site A 138.6 147.0 39.8 45.8
Site A FV 138.0 147.6 39.2 46.4
Site B 135.0 142.8 33.2 40.4
Site B FV 134.4 143.4 32.6 41.0
Site C 128.4 135.6 29.6 36.8
Site C FV 127.8 136.2 29.0 37.4
Site D 126.6 132.0 24.8 30.32
Site D FV 126.0 132.6 24.2 30.92
Site E 122.4 127.2 23.6 27.2
Site E FV 121.8 127.8 23.0 27.8
Site E 122.4 127.2 23.6 27.2
Site E FV 121.8 127.8 23.0 27.8
takao-yWednesday, January 13th, 2021 at 11:56:28 AM GMT+09:00
領域設定ツールを作成しましたので、もし修正の必要がありましたら、ご利用ください。
(小林さんが作成された切り出し方法の詳細については十分に把握していませんので、私の設定は適切でないかもしれません。適宜修正していただければ幸いです。)
https://www.dropbox.com/s/7ammd3rczu29vzn/domain.tar.gz?dl=0
120E,20Nを始点として解像度0.06degで日本全域をカバーしています。domain.shで、x?1,x?2,y?1,y?2(始点からのグリッド数)を設定します。rg2=10は特徴量の範囲(21x21)に対応します。上の添付図の赤破線が特徴量の範囲、青線が推定値出力です。
問題がなければ、各領域の切り出しデータをYinさんにお渡しいただければと思います。その時点で識別器ファイルの容量を見積もります。
よろしくお願いいたします。
uwatokoWednesday, January 13th, 2021 at 9:40:54 PM GMT+09:00
すみません、ご確認が遅くなりました。
昨年9月に判明し、4月データを作成し直して処理を進めたのですが、
処理はjsbach11で実施したため、goemon_disk2にあるデータの更新
しておりませんでした。
更新しましたので、ご確認お願いします。
昨年9月に判明し、4月データを作成し直して処理を進めたのですが、
処理はjsbach11で実施したため、goemon_disk2にあるデータの更新
しておりませんでした。
更新しましたので、ご確認お願いします。
takao-yFriday, January 22nd, 2021 at 11:42:35 AM GMT+09:00
吉兼です。
13日に報告させていただいた領域設定について、その後いかがでしょうか。もし設定に問題がありましたら、ご指摘いただければと思います。もし可能でしたら、各領域で変換されたデータについても早めにいただけると助かります。
よろしくお願いいたします。
13日に報告させていただいた領域設定について、その後いかがでしょうか。もし設定に問題がありましたら、ご指摘いただければと思います。もし可能でしたら、各領域で変換されたデータについても早めにいただけると助かります。
よろしくお願いいたします。
uwatokoFriday, January 22nd, 2021 at 2:51:10 PM GMT+09:00
失礼しました。ご連絡頂いているのに気づいてなくて対応しておりませんでした。
早速検討致します。
すみません、少しお待ちいただければと思います。
早速検討致します。
すみません、少しお待ちいただければと思います。
uwatokoFriday, January 22nd, 2021 at 2:51:10 PM GMT+09:00
失礼しました。ご連絡頂いているのに気づいてなくて対応しておりませんでした。
早速検討致します。
すみません、少しお待ちいただければと思います。
早速検討致します。
すみません、少しお待ちいただければと思います。
uwatokoMonday, January 25th, 2021 at 1:12:24 PM GMT+09:00
@takao-y さん
すみません、再度確認ですが、MSMGPV作成のためのデータ領域とある
FVがMSMの切り出し領域と考えればよろしいでしょうか。
すみません、再度確認ですが、MSMGPV作成のためのデータ領域とある
FVがMSMの切り出し領域と考えればよろしいでしょうか。
uwatokoMonday, January 25th, 2021 at 5:03:44 PM GMT+09:00
あと、siteEですが、緯度の範囲がこれまで23.0~28.0だったのがFVだと23.0~27.8と少し狭くなっていますが、これは問題ないでしょうか。
takao-yTuesday, January 26th, 2021 at 9:20:22 AM GMT+09:00
FV(赤破線枠)がMSMGPVからの切り出し領域で、実際の評価は青枠内で実施します。siteEについては、28.0 -> 27.8でも特に問題はないかなと思います。よろしくお願いいたします。
takao-yTuesday, January 26th, 2021 at 11:56:17 AM GMT+09:00
すみません。確認ですが、入力データについては、MSMGPV,Radar_AMeDAS両方ともFV領域での切り出しでお願いいたします。また、恐らく欠測値が出てくると思いますが、データ作成時に欠測値が分かるようにしていただければと思います。
よろしくお願いいたします。
よろしくお願いいたします。
uwatokoTuesday, January 26th, 2021 at 3:11:45 PM GMT+09:00
siteEの件、了解しました。また、切り出しですが、Radar_AMeDASは切り出しの準備はしてなかったのですが、そちらも対応致します。
宜しくお願いします。
宜しくお願いします。
uwatokoFriday, February 5th, 2021 at 4:33:29 PM GMT+09:00
@takao-y 様、@yamamoto.kosuke 様
ご依頼の切り出しの件です。
MSMは2007年~2018年まで作成済ですが、解析雨量は時間がかかるので、
とりあえず3年分(2007年~2009年)を用意しました。
また、3年分毎に出来上がったらお知らせします。
MSMは jsbach11:/data/trmmauto/AI_GSMaP/svm-msm-wj/MSMGPV/data1x/siteX/yyyymm
解析雨量は sbach11:/data/trmmauto/AI_GSMaP/svm-msm-wj/wget-Analyses_precipitation/data1x/siteX/yyyymm
ご依頼の切り出しの件です。
MSMは2007年~2018年まで作成済ですが、解析雨量は時間がかかるので、
とりあえず3年分(2007年~2009年)を用意しました。
また、3年分毎に出来上がったらお知らせします。
MSMは jsbach11:/data/trmmauto/AI_GSMaP/svm-msm-wj/MSMGPV/data1x/siteX/yyyymm
解析雨量は sbach11:/data/trmmauto/AI_GSMaP/svm-msm-wj/wget-Analyses_precipitation/data1x/siteX/yyyymm
takao-yTuesday, February 9th, 2021 at 11:31:43 AM GMT+09:00
ありがとうございます。解析雨量ですが、私が以前にお渡ししたプログラムをご参照にされた場合は、MSM-GPVよりも1時間ずれていると思います。例えば、解析雨量では0UTC~1UTCの1時間積算値に対し、解析雨量では23UTC-0UTCの1時間値となっています。修正版をお渡しするのを忘れていました。修正方法は3つあって、1. 添付のプログラムを参考にデータセットを作り直す、2. 作成されたデータセットのズレを修正する、3. 機械学習入力データ作成時に調整することが挙げられます。もし、すでに作成されている場合は、2か3が良いかと思いますが、機械学習プログラムを書き換えるより、2のデータセットのズレを修正する方が混乱がないかと思います。
参考までに、プログラムを添付いたします。
https://www.dropbox.com/s/la6kc6w6f1lhl6r/radar_amedas-20210209.tar.gz?dl=0
参考までに、プログラムを添付いたします。
https://www.dropbox.com/s/la6kc6w6f1lhl6r/radar_amedas-20210209.tar.gz?dl=0
uwatokoWednesday, February 10th, 2021 at 4:53:00 PM GMT+09:00
@takao-y様
解析雨量ですが、頂いたプログラムとは別に、こちらでそのままの時刻をそのまま切り出しておりますので、時刻は大丈夫だと思いますが、勘違いしてますでしょうか。
問題なければ、解析雨量のsite毎の切り出しと解像度をMSMと合わせる処理が全期間(2007年~2018年)終了しました。
jsbach11:/data/trmmauto/AI_GSMaP/svm-msm-wj/wget-Analyses_precipitation/data1x/siteX/yyyymm
宜しくお願いします。
解析雨量ですが、頂いたプログラムとは別に、こちらでそのままの時刻をそのまま切り出しておりますので、時刻は大丈夫だと思いますが、勘違いしてますでしょうか。
問題なければ、解析雨量のsite毎の切り出しと解像度をMSMと合わせる処理が全期間(2007年~2018年)終了しました。
jsbach11:/data/trmmauto/AI_GSMaP/svm-msm-wj/wget-Analyses_precipitation/data1x/siteX/yyyymm
宜しくお願いします。
takao-yThursday, February 11th, 2021 at 1:29:32 PM GMT+09:00
ご連絡ありがとうございます。私のプログラムを使っていないのであれば問題ありません。小林さんが別に作成されたプログラムを採用しているとのこと承知いたしました。よろしくお願いいたします。
yamamoto.kosukeWednesday, February 24th, 2021 at 4:28:49 PM GMT+09:00
@uwatokoさま
MSM及び解析雨量のデータ整備ありがとうございます。jsbach11はALOSとの関係上Gaohongさんや吉兼先生が直接入って頂き辛いので、zico-n/pele-nから参照できるようにしていただけないでしょうか?
それすらもルール上ダメだったような記憶もあるので、ダメな場合は新たに入ったストレージをマウントして、そちらに移していただければと思います。
MSM及び解析雨量のデータ整備ありがとうございます。jsbach11はALOSとの関係上Gaohongさんや吉兼先生が直接入って頂き辛いので、zico-n/pele-nから参照できるようにしていただけないでしょうか?
それすらもルール上ダメだったような記憶もあるので、ダメな場合は新たに入ったストレージをマウントして、そちらに移していただければと思います。
yamamoto.kosukeWednesday, February 24th, 2021 at 6:06:46 PM GMT+09:00
@uwatoko さま
度々すみません。現状2018年までの切り出しが完了しているとのことですが、識別機作成に当たっては2020年まで含められたほうが良いと思うので、MSM、解析雨量共に直近の2020年まで切り出しを行っていただくことは可能でしょうか。
度々すみません。現状2018年までの切り出しが完了しているとのことですが、識別機作成に当たっては2020年まで含められたほうが良いと思うので、MSM、解析雨量共に直近の2020年まで切り出しを行っていただくことは可能でしょうか。
uwatokoFriday, February 26th, 2021 at 9:14:26 PM GMT+09:00
@yamamoto.kosuke 様
zico-n/pele-nに吉兼先生のアカウントはありますので、
gaohongさんのアカウントを作成しました。
(初期パスワード:Ka#8Aba6)
また、ご依頼のデータは下記に置きました。
解析雨量:/lebron_disk09/GPM/AI_GSMaP/DATA/SRF_GPV_Ggis1km_cut/siteX/yyyymm
MSM:/lebron_disk09/GPM/AI_GSMaP/DATA/MSM_GPV_Rjp_cut/siteX/yyyymm
ご依頼の2020年までの切り出しは行います。完了したらお知らせします。
zico-n/pele-nに吉兼先生のアカウントはありますので、
gaohongさんのアカウントを作成しました。
(初期パスワード:Ka#8Aba6)
また、ご依頼のデータは下記に置きました。
解析雨量:/lebron_disk09/GPM/AI_GSMaP/DATA/SRF_GPV_Ggis1km_cut/siteX/yyyymm
MSM:/lebron_disk09/GPM/AI_GSMaP/DATA/MSM_GPV_Rjp_cut/siteX/yyyymm
ご依頼の2020年までの切り出しは行います。完了したらお知らせします。
yamamoto.kosukeMonday, March 1st, 2021 at 12:18:41 PM GMT+09:00
@uwatoko さま
ありがとうございます!2020まで終わったらGaohongさんに識別機作成を対応いただこうと思います。ちなみに、アカウントは「gyin」で作成済みなので、「gaohong」は削除いただいてOKかと思います。
home領域は小さいと思うので、識別機保存用に/lebron_disk09/gyin/を作成して使わせていただけないでしょうか?もしほかに適切な場所があればご教示ください。よろしくお願いいたします。
ありがとうございます!2020まで終わったらGaohongさんに識別機作成を対応いただこうと思います。ちなみに、アカウントは「gyin」で作成済みなので、「gaohong」は削除いただいてOKかと思います。
home領域は小さいと思うので、識別機保存用に/lebron_disk09/gyin/を作成して使わせていただけないでしょうか?もしほかに適切な場所があればご教示ください。よろしくお願いいたします。
uwatokoMonday, March 1st, 2021 at 12:50:00 PM GMT+09:00
@yamamoto.kosuke 様
「gaohong」さんのアカウントの件、了解しました。
ディスクですが。/lebron_disk09/をお使いください。
宜しくお願いします。
「gaohong」さんのアカウントの件、了解しました。
ディスクですが。/lebron_disk09/をお使いください。
宜しくお願いします。
yamamoto.kosukeMonday, March 1st, 2021 at 1:04:01 PM GMT+09:00
@uwatoko 様
ありがとうございます。お手隙の際で構いませんので、/lebron_disk09/gyin/を作成頂けますでしょうか?よろしくお願いいたします。
ありがとうございます。お手隙の際で構いませんので、/lebron_disk09/gyin/を作成頂けますでしょうか?よろしくお願いいたします。
uwatokoMonday, March 1st, 2021 at 3:32:04 PM GMT+09:00
@yamamoto.kosuke様
先日作ってもらったアカウントは「gaohong」は削除しました。
また、作成依頼のあった/lebron_disk09/gyin/も作成致しました。
よろしくお願いいたします。
先日作ってもらったアカウントは「gaohong」は削除しました。
また、作成依頼のあった/lebron_disk09/gyin/も作成致しました。
よろしくお願いいたします。
uwatokoThursday, March 4th, 2021 at 2:17:19 PM GMT+09:00
@yamamoto.kosuke様
解析雨量の2019~2020年データ作成が完了いたしました。
MSMについては来週前半になる見込みです。
/lebron_disk09/GPM/AI_GSMaP/DATA/SRF_GPV_Ggis1km_cut/siteX/yyyymm
解析雨量の2019~2020年データ作成が完了いたしました。
MSMについては来週前半になる見込みです。
/lebron_disk09/GPM/AI_GSMaP/DATA/SRF_GPV_Ggis1km_cut/siteX/yyyymm
takao-yFriday, March 5th, 2021 at 11:19:31 AM GMT+09:00
ありがとうございました。
引き続きよろしくお願いいたします。
吉兼
引き続きよろしくお願いいたします。
吉兼
uwatokoTuesday, March 9th, 2021 at 4:53:35 PM GMT+09:00
@yamamoto.kosuke様、@takao-y 様
MSMの2019年、2020年分のデータ作成が完了致しました。
MSM:/lebron_disk09/GPM/AI_GSMaP/DATA/MSM_GPV_Rjp_cut/siteX/yyyymm
MSMの2019年、2020年分のデータ作成が完了致しました。
MSM:/lebron_disk09/GPM/AI_GSMaP/DATA/MSM_GPV_Rjp_cut/siteX/yyyymm
uwatokoMonday, January 25th, 2021 at 5:03:44 PM GMT+09:00
あと、siteEですが、緯度の範囲がこれまで23.0~28.0だったのがFVだと23.0~27.8と少し狭くなっていますが、これは問題ないでしょうか。
takao-yTuesday, January 26th, 2021 at 10:18:59 AM GMT+09:00
Dear Yin-san,
Could you check the new sites (A to E) using the domain-setting tool?(https://www.dropbox.com/s/7ammd3rczu29vzn/domain.tar.gz?dl=0)
It covers all of Japan with a resolution of 0.06deg, starting from 120E,20N. I think you can draw the estimated precipitation map in whole of Japan area directly (without any interpolation tools).
x?1,x?2,y?1,y?2 in domain.sh are the number of grids from the starting point.
rg2=10 corresponds to the feature range (21x21).
Best Regards,
T. Yoshikane
gyinTuesday, January 26th, 2021 at 10:52:14 AM GMT+09:00
Dear Yoshikane-sensei,
If I understand correct, the MSM-GPV and AMeDAS data for each site will later be processed as the size of adding FV (The red dashed square in the figure)? If so, it should be no problem. Even for some months when the selected rg2=12, still there is overlapped area and it should work well.
Thank you very much for your help!
Best regards,
Gaohong
takao-yTuesday, January 26th, 2021 at 11:02:15 AM GMT+09:00
Dear Yin-san,
The MSM-GPV data are used in the FV area (red dashed square area) and AMeDAS data are used in the inner area (blue solid square area). Is that OK?
Thank you for confirming.
Best Regards,
T. Yoshikane
The MSM-GPV data are used in the FV area (red dashed square area) and AMeDAS data are used in the inner area (blue solid square area). Is that OK?
Thank you for confirming.
Best Regards,
T. Yoshikane
gyinTuesday, January 26th, 2021 at 11:05:05 AM GMT+09:00
Dear Yoshikane-sensei,
Yes, that should be OK! Thank you very much!
Best regards,
Gaohong
Yes, that should be OK! Thank you very much!
Best regards,
Gaohong
gyinTuesday, January 26th, 2021 at 11:24:34 AM GMT+09:00
Dear Yoshikane-sensei,
I am sorry but can I double confirm that for the AMeDAS data, it will be made the same size of MSM-GPV but given FV grids undefined values or it will just be the size of the inner area?
If it is just the size of the inner area, we may need to be a little careful about the size difference between the MSM-GPV and AMeDAS. For example when making the training and testing data for each grid, we may need to make some slight modifications on the code to solve size difference and pixel matching problem (lon and lat index for MSM-GPV and AMeDAS are no longer the same).
Thank you very much!
Best regards,
Gaohong
takao-yTuesday, January 26th, 2021 at 11:46:59 AM GMT+09:00
Dear Yin-san,
Sorry for misinforming you.
I think you mean the conversion program fro input data (step01-make_testing_data.sh or step01-make_training_data.sh). Yes, we have to prepare both of MSMGPV and Radar_AMeDAS of the FV ranges when we use those conversion programs.
Best Regards,
T. Yoshikane
Sorry for misinforming you.
I think you mean the conversion program fro input data (step01-make_testing_data.sh or step01-make_training_data.sh). Yes, we have to prepare both of MSMGPV and Radar_AMeDAS of the FV ranges when we use those conversion programs.
Best Regards,
T. Yoshikane
gyinTuesday, January 26th, 2021 at 11:48:31 AM GMT+09:00
Dear Yoshikane-sensei,
Thank you very much for your clarification!
Best regards,
Gaohong
Thank you very much for your clarification!
Best regards,
Gaohong
uwatokoTuesday, January 26th, 2021 at 3:11:45 PM GMT+09:00
siteEの件、了解しました。また、切り出しですが、Radar_AMeDASは切り出しの準備はしてなかったのですが、そちらも対応致します。
宜しくお願いします。
宜しくお願いします。
keiyoshi08Wednesday, February 3rd, 2021 at 9:44:47 AM GMT+09:00
@takao-y @uwatoko
将来的にはMEPSの降水量も切り出して同じような処理をしていきたいと考えています。芳村研の方で少し過去分ですがMEPSのデータを気象庁からそのまま出された形で持っています(1時間毎)。こちらを使うことにするか、業務支援センターから出されているもの(3時間毎)を使うべきか、どう考えますか?前者は、データ自体がかなり複雑な構造をしているのと、オリジナル解像度なので、空間内挿しなければいけないのですが、気象庁と同じ内挿というものができない可能性があります。後者は3時間毎というのがネックです。
将来的にはMEPSの降水量も切り出して同じような処理をしていきたいと考えています。芳村研の方で少し過去分ですがMEPSのデータを気象庁からそのまま出された形で持っています(1時間毎)。こちらを使うことにするか、業務支援センターから出されているもの(3時間毎)を使うべきか、どう考えますか?前者は、データ自体がかなり複雑な構造をしているのと、オリジナル解像度なので、空間内挿しなければいけないのですが、気象庁と同じ内挿というものができない可能性があります。後者は3時間毎というのがネックです。
takao-yTuesday, February 9th, 2021 at 11:39:02 AM GMT+09:00
私が以前実施したものは後者の業務支援センターと同じフォーマットで、21アンサンブルデータを切り出す以外は特別な処理をせずに実行できました。気象庁データの切り出しには時間がかかるかもしれません。
uwatokoFriday, February 5th, 2021 at 4:33:29 PM GMT+09:00
@takao-y 様、@yamamoto.kosuke 様
ご依頼の切り出しの件です。
MSMは2007年~2018年まで作成済ですが、解析雨量は時間がかかるので、
とりあえず3年分(2007年~2009年)を用意しました。
また、3年分毎に出来上がったらお知らせします。
MSMは jsbach11:/data/trmmauto/AI_GSMaP/svm-msm-wj/MSMGPV/data1x/siteX/yyyymm
解析雨量は sbach11:/data/trmmauto/AI_GSMaP/svm-msm-wj/wget-Analyses_precipitation/data1x/siteX/yyyymm
ご依頼の切り出しの件です。
MSMは2007年~2018年まで作成済ですが、解析雨量は時間がかかるので、
とりあえず3年分(2007年~2009年)を用意しました。
また、3年分毎に出来上がったらお知らせします。
MSMは jsbach11:/data/trmmauto/AI_GSMaP/svm-msm-wj/MSMGPV/data1x/siteX/yyyymm
解析雨量は sbach11:/data/trmmauto/AI_GSMaP/svm-msm-wj/wget-Analyses_precipitation/data1x/siteX/yyyymm
yamamoto.kosukeWednesday, February 24th, 2021 at 5:02:48 PM GMT+09:00
@gyin -san,
Thank you for the meeting today! Could you share your slides?
Now MSM and Radar-AMeDAS data are ready, so we move on to prepare the classifier for each grid and each month in JAXA server toward the real-time operation. For securing enough space, could you tell the approximate storage needed to store all classifiers?
@takao-y 先生
頂いているツールはこちら(https://jaxa-ut-restec.slack.com/archives/C019QUY6WJD/p1607134874035800)が最新で、既にCDFt手法を含んでいただいてるもののようでした。過去分を処理するにはこちらを使用するのでOKかと思うのですが、定常運用化(リアルタイム処理)に向けては少し変更が必要かと思うので、ご対応いただければと思います。その際、以下の点について確認させてください。
• MSMの39時間予報をツールに入力するときのファイル形式はどのように考えていらっしゃいますか?ここが決まれば、こちらで先にMSM39時間予測切り出しの定常運用化を始めたいと思っています。
• 現状のツールでは、SVMの結果を出力した後、CDFtで再読み込みして結果出力という形になっていますが、定常運用では両者をひとまとめで処理したほうが処理時間短縮につながるのではと考えていますが、如何でしょうか。
gyinWednesday, February 24th, 2021 at 11:14:19 PM GMT+09:00
Dear Yamamoto-san,
Please find the attached slides for today’s meeting.
As for the storage of the classifier, I check current results I have. For the previous site C, including 8100 grid classifiers, using 2007-2018 July as training period, the folder size of “data-model” (which stores the classifiers as .pkl files) is 33 GB. Based on this, in order to save classifier for each grid and each month, we may approximately needs ~2.8TB.
Additionally, when generate the classifier, the storages needed for saving training data and testing data are larger. In the same case (site C, July, years 2007-2018, 8100 grids), the size of folders “data-training” and “data-testing” are 71 GB and 212 GB, respectively.
Please let me know if further information is needed.
Best regards,
Gaohong
yamamoto.kosukeThursday, February 25th, 2021 at 3:08:53 PM GMT+09:00
@gyin -san,
Thank you for the information! That helps us a lot. I will let you know if we get further question.
Thank you for the information! That helps us a lot. I will let you know if we get further question.
uwatokoFriday, February 26th, 2021 at 9:14:26 PM GMT+09:00
@yamamoto.kosuke 様
zico-n/pele-nに吉兼先生のアカウントはありますので、
gaohongさんのアカウントを作成しました。
(初期パスワード:Ka#8Aba6)
また、ご依頼のデータは下記に置きました。
解析雨量:/lebron_disk09/GPM/AI_GSMaP/DATA/SRF_GPV_Ggis1km_cut/siteX/yyyymm
MSM:/lebron_disk09/GPM/AI_GSMaP/DATA/MSM_GPV_Rjp_cut/siteX/yyyymm
ご依頼の2020年までの切り出しは行います。完了したらお知らせします。
zico-n/pele-nに吉兼先生のアカウントはありますので、
gaohongさんのアカウントを作成しました。
(初期パスワード:Ka#8Aba6)
また、ご依頼のデータは下記に置きました。
解析雨量:/lebron_disk09/GPM/AI_GSMaP/DATA/SRF_GPV_Ggis1km_cut/siteX/yyyymm
MSM:/lebron_disk09/GPM/AI_GSMaP/DATA/MSM_GPV_Rjp_cut/siteX/yyyymm
ご依頼の2020年までの切り出しは行います。完了したらお知らせします。
uwatokoMonday, March 1st, 2021 at 12:50:00 PM GMT+09:00
@yamamoto.kosuke 様
「gaohong」さんのアカウントの件、了解しました。
ディスクですが。/lebron_disk09/をお使いください。
宜しくお願いします。
「gaohong」さんのアカウントの件、了解しました。
ディスクですが。/lebron_disk09/をお使いください。
宜しくお願いします。
uwatokoMonday, March 1st, 2021 at 3:32:04 PM GMT+09:00
@yamamoto.kosuke様
先日作ってもらったアカウントは「gaohong」は削除しました。
また、作成依頼のあった/lebron_disk09/gyin/も作成致しました。
よろしくお願いいたします。
先日作ってもらったアカウントは「gaohong」は削除しました。
また、作成依頼のあった/lebron_disk09/gyin/も作成致しました。
よろしくお願いいたします。
takao-yWednesday, March 3rd, 2021 at 3:22:30 PM GMT+09:00
対応が遅くなり申し訳ありません。機械学習+CDFtの39時間予報に対応したソースコードを以下に添付します。基本的には以前にお渡ししたものと同じで、39時間予報値のデータをソースコードで指定したディレクトリに置けば作動すると思います。
https://www.dropbox.com/s/mngkwh8dqk8o4p6/mlcdft-bin-39h-src.tar.gz?dl=0
手順としては、解凍後に
1.ml-region1-all-python-39hに移動
2. auto-step01.shを実行: 識別器作成の入力用データの作成し、識別器を作成(オペレーション時は予め作成された識別器を使用するため、省略)
3. auto-step02.shを実行: 39時間予報値の入力データを作成後、2の識別器を使って機械学習推定値を出力
----以上が39時間予報値の機械学習推定過程---
4. ml-region1-all-python-39h-cdftに移動
5. data2ディレクトリに、2007年から2018年までの機械学習推定値(それぞれ推定対象年を除く期間で学習して対象年を推定したたもの)を置く。(オペレーション時は予め作成された推定値が置かれていることを想定)
6. auto-step03.shを実行: dataディレクトリに3,で出力した39時間予報値の機械学習推定がコピーされ、CDFtによる量的補正を実施。
7.data-outディレクトリに推定値データが出力 。
8. TE-Japanへ入力?
機械学習入力用データを作成するための中間ファイルについては、以前とフォーマットは同じですが、時間方向は744ではなく39のデータ数になります。
よろしくお願いいたします。
吉兼
uwatokoWednesday, April 28th, 2021 at 6:47:33 PM GMT+09:00
@takao-y 先生
お世話になっております。東上床@RESTECです。
頂いたプログラムのテストを行っておりますが、auto-step03で止まるところがあります。
auto-step03の入力データに2007-2018年のcsvファイルがありますが、これがないためテストできない
状況です。テストでも構わないので作成済のデータがございましたら、提供して頂けないでしょうか。
宜しくお願いします。
お世話になっております。東上床@RESTECです。
頂いたプログラムのテストを行っておりますが、auto-step03で止まるところがあります。
auto-step03の入力データに2007-2018年のcsvファイルがありますが、これがないためテストできない
状況です。テストでも構わないので作成済のデータがございましたら、提供して頂けないでしょうか。
宜しくお願いします。
takao-yWednesday, March 3rd, 2021 at 3:43:45 PM GMT+09:00
Dear Yin-san,
I have checked the test case using 39 hours forecast data in my directory on isotope2/3. I think you can get the ML system including input dataset. If you have time, please check the system after recovering isotope2/3.
I will inform you the directory later.
The procedure is as follows.
1. move to “ml-region1-all-python-39h”
2. execute “auto-step01.sh”
the program produces the input data and then, make classifiers using input data from 2007 to 2018 (if you select e.g. 2019).
3. execute “auto-step02.sh”
The program produces the input data for 39 hours forecast and then, estimate the precipitation using the classifiers. which is made in procedure 2.
4. move to “ml-region1-all-python-39h-cdft”
5. execute “auto-step03.sh”
The program corrects the amount of estimated precipitation produced in procedure 3 using the estimated precipitation (and observation data) from 2007 to 2018, which were produced in advance.
Best Regards,
T. Yoshikane
gyinThursday, March 4th, 2021 at 10:26:53 AM GMT+09:00
Dear Yoshikane-sensei,
Thank you for the information! I will check it once you inform the directory.
I am currently running the CDF and CDFt for the 39 hours forecast ML results based on the ML system I modified. I will let you know the results once the running finishes.
Best regards,
Gaohong
Thank you for the information! I will check it once you inform the directory.
I am currently running the CDF and CDFt for the 39 hours forecast ML results based on the ML system I modified. I will let you know the results once the running finishes.
Best regards,
Gaohong
takao-yFriday, March 5th, 2021 at 11:23:36 AM GMT+09:00
Dear Yin-san,
Thank you for your information.
FYI, I uploaded the my setting of ML system in the following directory.
/data33/yoshikane/python-ve2/region-ej/mlcdft-bin-39h
I hope this helps you.
Best Regards,
T. Yoshikane
Thank you for your information.
FYI, I uploaded the my setting of ML system in the following directory.
/data33/yoshikane/python-ve2/region-ej/mlcdft-bin-39h
I hope this helps you.
Best Regards,
T. Yoshikane
takao-yFriday, March 5th, 2021 at 11:26:43 AM GMT+09:00
Sorry, I have mistaken the directory.
The corrected directory is as follows.
/data33/yoshikane/python-ve2/region-ej/mlcdft-bin2/
T. Yoshikane
The corrected directory is as follows.
/data33/yoshikane/python-ve2/region-ej/mlcdft-bin2/
T. Yoshikane
uwatokoThursday, March 4th, 2021 at 2:17:19 PM GMT+09:00
@yamamoto.kosuke様
解析雨量の2019~2020年データ作成が完了いたしました。
MSMについては来週前半になる見込みです。
/lebron_disk09/GPM/AI_GSMaP/DATA/SRF_GPV_Ggis1km_cut/siteX/yyyymm
解析雨量の2019~2020年データ作成が完了いたしました。
MSMについては来週前半になる見込みです。
/lebron_disk09/GPM/AI_GSMaP/DATA/SRF_GPV_Ggis1km_cut/siteX/yyyymm
takao-yFriday, March 5th, 2021 at 11:52:45 AM GMT+09:00
識別器ですが、グリッドによっても異なるのですが1グリッドあたり大凡3MB(12年間学習した場合)となっています。私が実施している東日本領域(80x60 grids)では合計8.6GBになります。
ご参考になれば幸いです。
吉兼
ご参考になれば幸いです。
吉兼
takao-yFriday, March 5th, 2021 at 5:08:26 PM GMT+09:00
役割分担について再度確認させてください。
1. 新領域AEについて、MSM-GPV,雨量解析データの切り出し (RESTEC)
(来週中に終了予定)
2. 新領域AEについて、2007年から2018年までのデータを用いて機械学習推定値を出力 (定常運用CDFtで使用)(東京大学)
3. 新領域A~Eについて、2007年から2018年までの12年間のデータを用いて識別器作成(定常運用で使用)(東京大学)
4. 2,3で作成したデータを定常運用に提供
5. 定常運用:39時間予報値を用いて機械学習+CDFtを適用して算出された推定値をTE-Japanに適用(RESTEC)
もし問題がありましたらご指摘いただければ幸いです。
吉兼
1. 新領域A
(来週中に終了予定)
2. 新領域A
3. 新領域A~Eについて、2007年から2018年までの12年間のデータを用いて識別器作成(定常運用で使用)(東京大学)
4. 2,3で作成したデータを定常運用に提供
5. 定常運用:39時間予報値を用いて機械学習+CDFtを適用して算出された推定値をTE-Japanに適用(RESTEC)
もし問題がありましたらご指摘いただければ幸いです。
吉兼
takao-yFriday, March 5th, 2021 at 5:25:26 PM GMT+09:00
Dear Yin-san,
We have to provide the estimated precipitation data from 2007 to 2018 by ML and the classifier files produced by using 12 years data form 2007 to 2018 in A to E regions using the optimal hyper-parameters which is estimated by Kobayashi-san. The new regions are a little bit different from old ones but I think it can be ignored.
Could you start the experiments after finishing the RESTEC-san’s data conversion?
If you need some helps, please let me know. I will help you.
After finishing our tasks, we will prvide the estimated precipitation by ML and the classifiers to RESTEC because those are necessary for the routine operation of the TE-Japan.
If you have any questions, please let me know.
Best Regards,
T. Yoshikane
takao-ySaturday, March 6th, 2021 at 8:55:37 AM GMT+09:00
Dear Yin-san,
I will revise the term as follows.
Before: 2007 to 2018
After: 2007 to 2020 (present time)
Best Regards,
T. Yoshikane
I will revise the term as follows.
Before: 2007 to 2018
After: 2007 to 2020 (present time)
Best Regards,
T. Yoshikane
gyinMonday, March 8th, 2021 at 11:11:13 AM GMT+09:00
Dear Yoshikane-sensei,
Thank you very much for the guidance!
Can I confirm that the path for MSM-GPV and Radar-AMeDAS data are as below?
Radar-AMeDAS: /lebron_disk09/GPM/AI_GSMaP/DATA/SRF_GPV_Ggis1km_cut/siteX/yyyymm
MSM-GPV: /lebron_disk09/GPM/AI_GSMaP/DATA/MSM_GPV_Rjp_cut/siteX/yyyymm
Once all the data from 2007-2020 are prepared, I will start running the ML using the previously selected hyper-parameters.
Best regards,
Gaohong
takao-yMonday, March 8th, 2021 at 12:45:18 PM GMT+09:00
Dear Yin-san,
Thank you for your effort.
According to Higashiuwatoko-san, MSM-GPV data are expected to complete the conversion by this week.
Could you check the data before starting the ML run, just in case?
Best Regards,
T. Yoshikane
Thank you for your effort.
According to Higashiuwatoko-san, MSM-GPV data are expected to complete the conversion by this week.
Could you check the data before starting the ML run, just in case?
Best Regards,
T. Yoshikane
gyinMonday, March 8th, 2021 at 12:47:56 PM GMT+09:00
Dear Yoshikane-sensei,
I saw there are MSM-GPV data only until 2018 now. After Higashiuwatoko-san finished data preparation, I will check the data before start running ML. Thank you for your reminder!
Best regards,
Gaohong
I saw there are MSM-GPV data only until 2018 now. After Higashiuwatoko-san finished data preparation, I will check the data before start running ML. Thank you for your reminder!
Best regards,
Gaohong
takao-ySaturday, March 6th, 2021 at 8:53:19 AM GMT+09:00
上記に間違いがありました。2007年から2018年ではなく、正しくは2007年から2020年(現在)までのデータを使って、各年の推定値及び識別器を作成でした。
吉兼
吉兼
uwatokoTuesday, March 9th, 2021 at 4:53:35 PM GMT+09:00
@yamamoto.kosuke様、@takao-y 様
MSMの2019年、2020年分のデータ作成が完了致しました。
MSM:/lebron_disk09/GPM/AI_GSMaP/DATA/MSM_GPV_Rjp_cut/siteX/yyyymm
MSMの2019年、2020年分のデータ作成が完了致しました。
MSM:/lebron_disk09/GPM/AI_GSMaP/DATA/MSM_GPV_Rjp_cut/siteX/yyyymm
takao-yThursday, March 11th, 2021 at 3:50:30 PM GMT+09:00
ありがとうございます。データについて2点だけ質問させてください。
1. 閏年2月29日は変換されていますでしょうか。
2. 雨量解析ですが、2020年分のデータは最近公開されたデータを変換されたのでしょうか。
よろしくお願いいたします。
吉兼
1. 閏年2月29日は変換されていますでしょうか。
2. 雨量解析ですが、2020年分のデータは最近公開されたデータを変換されたのでしょうか。
よろしくお願いいたします。
吉兼
uwatokoWednesday, March 17th, 2021 at 5:58:48 PM GMT+09:00
@takao-y 様:
すみません、1の閏年2月29日に関しては、こちらの不手際でです。
こちらで作成をしましたので、今日中に準備できると思います。出来ましたら、お知らせします。
2の雨量解析ですが、2020年分のデータは最近公開されたデータですかというご質問ですが、
こちらは、最近公開されたというのは、気象業務支援センターでrenewとなっているもので
しょうかというご質問でしょうか。こちらは、JAXAさんが直接ネット(気象協会?)経由で入手
しているものですので、renewの定義がわからないのでなんともいえないのですが、バージョンが
あがったとか聞いてないので、当初のネットワーク経由で頂いたものそのままという理解です。
takao-yWednesday, March 17th, 2021 at 6:01:48 PM GMT+09:00
ご連絡ありがとうございます。
1についてはよろしくお願いいたします。2はオフラインデータが最近販売開始されたばかりなので、少し気になっていましたオンラインデータを直接入手されているのですね。承知いたしました。
吉兼
1についてはよろしくお願いいたします。2はオフラインデータが最近販売開始されたばかりなので、少し気になっていましたオンラインデータを直接入手されているのですね。承知いたしました。
吉兼
uwatokoWednesday, March 17th, 2021 at 6:37:06 PM GMT+09:00
@takao-y様
閏年2月29日の抜けていた解析雨量とMSM-GPVの下記の期間を用意しました。
2008年2月29日
2012年2月29日
2016年2月29日
2020年2月29日
場所は前回と同じで、下記のところになります。
解析雨量:/lebron_disk09/GPM/AI_GSMaP/DATA/SRF_GPV_Ggis1km_cut/siteX/yyyymm
MSM:/lebron_disk09/GPM/AI_GSMaP/DATA/MSM_GPV_Rjp_cut/siteX/yyyymm
宜しくお願いします。
閏年2月29日の抜けていた解析雨量とMSM-GPVの下記の期間を用意しました。
2008年2月29日
2012年2月29日
2016年2月29日
2020年2月29日
場所は前回と同じで、下記のところになります。
解析雨量:/lebron_disk09/GPM/AI_GSMaP/DATA/SRF_GPV_Ggis1km_cut/siteX/yyyymm
MSM:/lebron_disk09/GPM/AI_GSMaP/DATA/MSM_GPV_Rjp_cut/siteX/yyyymm
宜しくお願いします。
takao-yTuesday, March 23rd, 2021 at 10:19:36 AM GMT+09:00
@gyin -san,
Could you check the data of leap year?
Radar_AMeDAS
/lebron_disk09/GPM/AI_GSMaP/DATA/SRF_GPV_Ggis1km_cut/siteX/yyyymm
MSM:
/lebron_disk09/GPM/AI_GSMaP/DATA/MSM_GPV_Rjp_cut/siteX/yyyymm
Best Regards,
T. Yoshikane
Could you check the data of leap year?
Radar_AMeDAS
/lebron_disk09/GPM/AI_GSMaP/DATA/SRF_GPV_Ggis1km_cut/siteX/yyyymm
MSM:
/lebron_disk09/GPM/AI_GSMaP/DATA/MSM_GPV_Rjp_cut/siteX/yyyymm
Best Regards,
T. Yoshikane
gyinTuesday, March 23rd, 2021 at 11:37:19 AM GMT+09:00
Dear Yoshikane-sensei,
I have checked the leap year data for Radar_AMeDAS and MSM-GPV. It seems there is no problem with the data.
Thank you very much!
Best regards,
Gaohong
I have checked the leap year data for Radar_AMeDAS and MSM-GPV. It seems there is no problem with the data.
Thank you very much!
Best regards,
Gaohong
takao-yThursday, March 11th, 2021 at 6:40:43 PM GMT+09:00
作成していただいた解析雨量とMSM-GPVですが、1時間のズレがあるようです。データの確認をお願いできますでしょうか。
例えば、0UTCのデータでは、
MSM-GPVの地表面データでは、データの初期時刻(t=1)では降水プロダクト以外の0UTCの解析値が入力されており、t=2(次のタイムステップ)で、0UTC~1UTCの積算降水量が入っています。
http://www.jmbsc.or.jp/jp/online/file/f-online10200.html
解析雨量では、データの初期時刻では前1時間値、つまり前日の23UTCから0UTCまでの積算降水量が入っています。
http://www.jmbsc.or.jp/jp/offline/cd0100.html
---
特記事項
2003年5月までは1時間毎、2003年6月以降は30分毎の値がそれぞれ収録されています。
ただし、どちらも前1時間降水量です。
---
(私がかなり以前に作成したプログラムでは、解析雨量の0UTCノ初期時刻の積算降水を0UTCから1UTCまでの積算値として出力していました。)
よろしくお願いいたします。
uwatokoWednesday, March 17th, 2021 at 5:51:12 PM GMT+09:00
@takao-y 様:
作成した解析雨量とMSM-GPVですが、1時間のズレですが、認識を確認させてください。
現状こちらは、上記の認識でデータは用意していると思っています。
認識はどういうものかというとその時刻のデータはGSMaPは、0UTCのファイル名は、
0時から0時59分のデータと理解しております。これは、スタートの時刻が入っています。
MSM-GPVの地表面データと解析雨量はそうでなくて、エンドの時刻が入っていると理解しております。
そうすると、吉兼先生の理解と同じで、MSM-GPVの地表面データであれば、データの初期時刻
(t=1)はつまり前日の23UTCから0UTCまでの積算降水量が入っています。
解析雨量では、データの初期時刻では前1時間値で、つまり前日の23UTCから0UTCまでの積算降水量と
理解しております。
こちらはファイル名の命名規則を同じになるようにして作成しているので、その意味ではずれてないと
思っております。
1時間のずれがファイル名とマッチングしているので、ずれているという話であれば、そうですねという
理解で、こちらは吉兼先生のプログラムと同じ入力を入れれるようにしていますので、そこに関しては
何もいじっておりませんというお話になります。
私の指摘があっているのかわかりませんが、もし違うのであれば、zoom等でお話しできませんでしょうか。
takao-yThursday, March 18th, 2021 at 10:25:36 AM GMT+09:00
@uwatoko様
ご多忙のところありがとうございます。私の説明不足でした。
----
MSM-GPVの地表面データであれば、データの初期時刻
(t=1)はつまり前日の23UTCから0UTCまでの積算降水量が入っています。
----
MSM-GPVの場合、初期時刻は0,3,6,9,12,15,18,21UTC(そのうち0UTCと12UTCは51時間予報)でt=1で前日の230UTCの積算雨量が入っているとすれば、どの解析値を用いて計算したものかが問題になります。考えられる候補としては、前日21UTCの初期値から23時間後のデータ(t=4)などがありますが、それはちょっと不自然なように思われます。気象庁の資料でもそのような記載は見当たらないので、初期時刻0UTCに23UTC0UTCの降水量が入っているというのは間違いかと思います。http://database.rish.kyoto-u.ac.jp/arch/jmadata/data/gpv/original/README.pdf
------
吉兼先生のプログラムと同じ入力を入れれるようにしていますので、そこに関しては
何もいじっておりません
------
以前にお渡ししたプログラムは解析雨量の方で230UTCを01UTCと勘違いをして出力していたので、1時間のずれが生じていました。恐らく昨年の春先にお渡ししたプログラムが古いバージョンのままでしたので、それをお使いでしたら1時間すれた値をファイル出力していると思割れます。(ここは私の連絡ミスですので二度手間となってしまったことを申し訳なく思います。)
作成していただいたデータについてはYinさんにも確認していただいたので、私のプログラムを使用されたということであれば恐らく1時間のずれは間違いないかと思います。
ズレを修正するプログラムでは、1ヶ月分のデータについて、MSM-GPV、解析雨量ともに1日0UTC翌月1日0UTCまでのデータを入れるようにしており、観測とモデル値が対応するようにしています。もし問題がなければ、今まで作成していただいたデータに関してはこちらで変換いたします。
ただ、今後のことを考えられば、ズレがない方がそのまま使えるので、1月に添付したプログラムを参考に修正していただければありがたいです。
(もし必要があれば、JAXAサーバ上でのプログラム修正をサポートいたします。)
MSM-GPVについては、私のプログラムをそのまま使用していれば作成されたファイルの先頭は0~1UTCの積算値が入っていますので問題ありませんが、他の方にも分かりやすいように後ほど修正してお渡しいたします。
ご多忙のところ大変恐縮ですが、よろしくお願いいたします。
吉兼
ご多忙のところありがとうございます。私の説明不足でした。
----
MSM-GPVの地表面データであれば、データの初期時刻
(t=1)はつまり前日の23UTCから0UTCまでの積算降水量が入っています。
----
MSM-GPVの場合、初期時刻は0,3,6,9,12,15,18,21UTC(そのうち0UTCと12UTCは51時間予報)でt=1で前日の23
------
吉兼先生のプログラムと同じ入力を入れれるようにしていますので、そこに関しては
何もいじっておりません
------
以前にお渡ししたプログラムは解析雨量の方で23
作成していただいたデータについてはYinさんにも確認していただいたので、私のプログラムを使用されたということであれば恐らく1時間のずれは間違いないかと思います。
ズレを修正するプログラムでは、1ヶ月分のデータについて、MSM-GPV、解析雨量ともに1日0UTC
ただ、今後のことを考えられば、ズレがない方がそのまま使えるので、1月に添付したプログラムを参考に修正していただければありがたいです。
(もし必要があれば、JAXAサーバ上でのプログラム修正をサポートいたします。)
MSM-GPVについては、私のプログラムをそのまま使用していれば作成されたファイルの先頭は0~1UTCの積算値が入っていますので問題ありませんが、他の方にも分かりやすいように後ほど修正してお渡しいたします。
ご多忙のところ大変恐縮ですが、よろしくお願いいたします。
吉兼
takao-yThursday, March 18th, 2021 at 10:27:00 AM GMT+09:00
もし必要がありましたら、Zoomでご相談いたします。
よろしくお願いいたします。
吉兼
よろしくお願いいたします。
吉兼
uwatokoThursday, March 18th, 2021 at 10:49:42 AM GMT+09:00
@takao-y様
もし可能であれば、17時くらいに打ち合わせできますか(すみません、本日打ち合わせが
立て込んでおりまして、その時間までちょっと空きそうにないので)。
一応再度確認した方が良いみたいです。
宜しくお願いします。
もし可能であれば、17時くらいに打ち合わせできますか(すみません、本日打ち合わせが
立て込んでおりまして、その時間までちょっと空きそうにないので)。
一応再度確認した方が良いみたいです。
宜しくお願いします。
takao-yTuesday, March 16th, 2021 at 7:37:45 PM GMT+09:00
@uwatoko様
解析雨量データのMSMデータとの時間のズレの問題ですが、その後進捗はいかがでしょうか。とりあえず確認だけしていただいて、問題が確認できた段階で、対処法について検討できればと考えています。
よろしくお願いいたします。
吉兼
解析雨量データのMSMデータとの時間のズレの問題ですが、その後進捗はいかがでしょうか。とりあえず確認だけしていただいて、問題が確認できた段階で、対処法について検討できればと考えています。
よろしくお願いいたします。
吉兼
takao-yWednesday, March 17th, 2021 at 1:15:32 PM GMT+09:00
Dear Yin-san,
I will attach the conversion program of Radar_AMeDAS for 1h data shift.
Could you convert the Radar_AMeDAS files after we confirmed the data are not corresponded to the MSM-GPV?
The procedure is as follows.
1. extract the tar.gz file in your directory.
2. move the old files of Radar_AMeDAS to “old” directory.
3. edit the auto-shift1h.sh
4. execute the auto-shift1h.sh
This program requires the grads software. So, please set the path before executing the program.
takao-yWednesday, March 17th, 2021 at 3:29:35 PM GMT+09:00
Dear Yin-san,
Please edit the ctl setting (target area) in shift1h.sh before executing auto-shift1h.sh.
T.Yoshikane
Please edit the ctl setting (target area) in shift1h.sh before executing auto-shift1h.sh.
T.Yoshikane
takao-yWednesday, March 17th, 2021 at 3:58:55 PM GMT+09:00
データのズレの問題ですが、修正プログラムを作成しました。全ての領域に適用しても1時間程度あれば変換できると思います。ただ、変換にはGradsを使用していますので、gradsがインストールされている環境で実施する必要があります。JAXAでgradsが使えるサーバーを教えていただけますでしょうか。
吉兼
吉兼
uwatokoWednesday, March 17th, 2021 at 5:51:12 PM GMT+09:00
@takao-y 様:
作成した解析雨量とMSM-GPVですが、1時間のズレですが、認識を確認させてください。
現状こちらは、上記の認識でデータは用意していると思っています。
認識はどういうものかというとその時刻のデータはGSMaPは、0UTCのファイル名は、
0時から0時59分のデータと理解しております。これは、スタートの時刻が入っています。
MSM-GPVの地表面データと解析雨量はそうでなくて、エンドの時刻が入っていると理解しております。
そうすると、吉兼先生の理解と同じで、MSM-GPVの地表面データであれば、データの初期時刻
(t=1)はつまり前日の23UTCから0UTCまでの積算降水量が入っています。
解析雨量では、データの初期時刻では前1時間値で、つまり前日の23UTCから0UTCまでの積算降水量と
理解しております。
こちらはファイル名の命名規則を同じになるようにして作成しているので、その意味ではずれてないと
思っております。
1時間のずれがファイル名とマッチングしているので、ずれているという話であれば、そうですねという
理解で、こちらは吉兼先生のプログラムと同じ入力を入れれるようにしていますので、そこに関しては
何もいじっておりませんというお話になります。
私の指摘があっているのかわかりませんが、もし違うのであれば、zoom等でお話しできませんでしょうか。
作成した解析雨量とMSM-GPVですが、1時間のズレですが、認識を確認させてください。
現状こちらは、上記の認識でデータは用意していると思っています。
認識はどういうものかというとその時刻のデータはGSMaPは、0UTCのファイル名は、
0時から0時59分のデータと理解しております。これは、スタートの時刻が入っています。
MSM-GPVの地表面データと解析雨量はそうでなくて、エンドの時刻が入っていると理解しております。
そうすると、吉兼先生の理解と同じで、MSM-GPVの地表面データであれば、データの初期時刻
(t=1)はつまり前日の23UTCから0UTCまでの積算降水量が入っています。
解析雨量では、データの初期時刻では前1時間値で、つまり前日の23UTCから0UTCまでの積算降水量と
理解しております。
こちらはファイル名の命名規則を同じになるようにして作成しているので、その意味ではずれてないと
思っております。
1時間のずれがファイル名とマッチングしているので、ずれているという話であれば、そうですねという
理解で、こちらは吉兼先生のプログラムと同じ入力を入れれるようにしていますので、そこに関しては
何もいじっておりませんというお話になります。
私の指摘があっているのかわかりませんが、もし違うのであれば、zoom等でお話しできませんでしょうか。
uwatokoWednesday, March 17th, 2021 at 5:58:48 PM GMT+09:00
@takao-y 様:
すみません、1の閏年2月29日に関しては、こちらの不手際でです。
こちらで作成をしましたので、今日中に準備できると思います。出来ましたら、お知らせします。
2の雨量解析ですが、2020年分のデータは最近公開されたデータですかというご質問ですが、
こちらは、最近公開されたというのは、気象業務支援センターでrenewとなっているもので
しょうかというご質問でしょうか。こちらは、JAXAさんが直接ネット(気象協会?)経由で入手
しているものですので、renewの定義がわからないのでなんともいえないのですが、バージョンが
あがったとか聞いてないので、当初のネットワーク経由で頂いたものそのままという理解です。
すみません、1の閏年2月29日に関しては、こちらの不手際でです。
こちらで作成をしましたので、今日中に準備できると思います。出来ましたら、お知らせします。
2の雨量解析ですが、2020年分のデータは最近公開されたデータですかというご質問ですが、
こちらは、最近公開されたというのは、気象業務支援センターでrenewとなっているもので
しょうかというご質問でしょうか。こちらは、JAXAさんが直接ネット(気象協会?)経由で入手
しているものですので、renewの定義がわからないのでなんともいえないのですが、バージョンが
あがったとか聞いてないので、当初のネットワーク経由で頂いたものそのままという理解です。
uwatokoWednesday, March 17th, 2021 at 6:37:06 PM GMT+09:00
@takao-y様
閏年2月29日の抜けていた解析雨量とMSM-GPVの下記の期間を用意しました。
2008年2月29日
2012年2月29日
2016年2月29日
2020年2月29日
場所は前回と同じで、下記のところになります。
解析雨量:/lebron_disk09/GPM/AI_GSMaP/DATA/SRF_GPV_Ggis1km_cut/siteX/yyyymm
MSM:/lebron_disk09/GPM/AI_GSMaP/DATA/MSM_GPV_Rjp_cut/siteX/yyyymm
宜しくお願いします。
閏年2月29日の抜けていた解析雨量とMSM-GPVの下記の期間を用意しました。
2008年2月29日
2012年2月29日
2016年2月29日
2020年2月29日
場所は前回と同じで、下記のところになります。
解析雨量:/lebron_disk09/GPM/AI_GSMaP/DATA/SRF_GPV_Ggis1km_cut/siteX/yyyymm
MSM:/lebron_disk09/GPM/AI_GSMaP/DATA/MSM_GPV_Rjp_cut/siteX/yyyymm
宜しくお願いします。
uwatokoThursday, March 18th, 2021 at 10:49:42 AM GMT+09:00
@takao-y様
もし可能であれば、17時くらいに打ち合わせできますか(すみません、本日打ち合わせが
立て込んでおりまして、その時間までちょっと空きそうにないので)。
一応再度確認した方が良いみたいです。
宜しくお願いします。
もし可能であれば、17時くらいに打ち合わせできますか(すみません、本日打ち合わせが
立て込んでおりまして、その時間までちょっと空きそうにないので)。
一応再度確認した方が良いみたいです。
宜しくお願いします。
takao-yThursday, March 18th, 2021 at 11:09:31 AM GMT+09:00
本日(3/18) 17時からZoomでのご相談承知いたしました。
Zoomスケジュールを設定いたしました。
もしよろしければ、下記をお使いいただければと思います。
------------
トピック: Zoom meeting invitation
時間: 2021年3月18日 05:00 PM 大阪、札幌、東京
Zoomミーティングに参加する
https://u-tokyo-ac-jp.zoom.us/j/91933424757?pwd=K2VKeUJGSEZLUDdzVTFYMFd0bTY1UT09
ミーティングID: 919 3342 4757
パスコード: 133421
-----------
よろしくお願いいたします。
Zoomスケジュールを設定いたしました。
もしよろしければ、下記をお使いいただければと思います。
------------
トピック: Zoom meeting invitation
時間: 2021年3月18日 05:00 PM 大阪、札幌、東京
Zoomミーティングに参加する
https://u-tokyo-ac-jp.zoom.us/j/91933424757?pwd=K2VKeUJGSEZLUDdzVTFYMFd0bTY1UT09
ミーティングID: 919 3342 4757
パスコード: 133421
-----------
よろしくお願いいたします。
takao-yThursday, March 18th, 2021 at 5:15:21 PM GMT+09:00
@uwatoko様
Zoomを開始しました。
いつでも入室大丈夫です。
吉兼
Zoomを開始しました。
いつでも入室大丈夫です。
吉兼
takao-yThursday, March 18th, 2021 at 11:41:22 AM GMT+09:00
Dear Yin-san,
Could you confirm whether the MSM-GPV data produced by RESTEC is the same as our data or not just in case?
And could you wait to modify the data until finishing the meeting with Higashiuwatoko-san? I will tell you the detail of data conversion plan immediately after meeting.
Best Regards,
T. Yoshikane
takao-yThursday, March 18th, 2021 at 11:44:03 AM GMT+09:00
Our data are in the following directory.
/data28/yoshikane/pub/ml-bin/MSMGPV
T.Yoshikane
/data28/yoshikane/pub/ml-bin/MSMGPV
T.Yoshikane
gyinThursday, March 18th, 2021 at 1:46:45 PM GMT+09:00
Dear Yoshikane-sensei,
I checked the MSM-GPV data and it is the same as my results, and it is also the same as our data on isotope.
My concern is about Radar-AMeDAS data. Based on my understanding, for Radar-AMeDAS, for example:
Z__C__RJTD_20110312110000_SRF_GPV_Ggis1km** represent the rainfall data from 1000UTC to 1100UTC.
(I referred to the data description in page 52 in https://www.mri-jma.go.jp/Publish/Technical/DATA/VOL_76/C.pdf)
I found the data I processed for Radar-AMeDAS has one hour different with the data on JAXA server now. Please let me know if I understand something wrong. Thank you very much!
Best regards,
Gaohong
takao-yThursday, March 18th, 2021 at 4:50:11 PM GMT+09:00
Dear Yin-san,
Thank you very much!
I was very relieved to hear that.
Best Regards,
T. Yoshikane
Thank you very much!
I was very relieved to hear that.
Best Regards,
T. Yoshikane
takao-yThursday, March 18th, 2021 at 6:06:13 PM GMT+09:00
Dear Yin-san,
I had a meeting with Higashiuwatoko-san and confirmed the one hour lag of Radar_AMeDAS. So, let’s start the file conversion.
The machine environment setting for grads on lili as follows. (I am using Ma-san’s setting.)
If you have any questions, please let me know.
#bash
# set grads
export PATH=/lili_disk4/wma/grads-2.0.a9/bin:$PATH
export LD_LIBRARY_PATH=$PATH:/lili_disk4/wma/grads-2.0.a9/grads_lib/
## set for grads2.2 ##
export PATH=“$PATH:/lili_disk4/wma/grads-2.2.1/bin”
export GASCRP=“/lili_disk4/wma/grads-2.2.1/bin/grads”
export GADDIR=“/lili_disk4/wma/grads-2.2.1/lib/grads”
###
Best Regards,
T. Yoshikane
gyinThursday, March 18th, 2021 at 8:02:46 PM GMT+09:00
Dear Yoshikane-sensei,
Thank you for the information. Do you mean we will make the Radar-AMeDAS data again?
If so, I appreciate if you could provide a little more guidance such as the path of raw data, the new path to store the processed data, and am I supposed to conduct the conversion for sites A-E from 2007-2020 by myself?
Thank you very much!
Best regards,
Gaohong
takao-yFriday, March 19th, 2021 at 11:11:58 AM GMT+09:00
Dear Yin-san,
No, we don’t need to convert raw data but should convert the data produced by RESTEC.
Please use the auto-shift1h.tar.gz file I attached before on this slack.
The procedure is as follows.
1. extract the tar.gz file in your directory.
2. move the Radar_AMeDAS data produced by RESTEC to “old” directory. (The links are also OK.)
3. edit the auto-shift1h.sh
4. execute the auto-shift1h.sh
I expect that it takes about 20 min every region.
If you have any questions please let me know.
Best Regards,
T. Yoshikane
gyinFriday, March 19th, 2021 at 1:03:18 PM GMT+09:00
Dear Yoshikane-sensei,
Thank you so much for the guidance!
I will check it and start processing. I will let you know if I have any questions!
Best regards,
Gaohong
Thank you so much for the guidance!
I will check it and start processing. I will let you know if I have any questions!
Best regards,
Gaohong
gyinFriday, March 19th, 2021 at 4:52:20 PM GMT+09:00
@takao-y
Dear Yoshikane-sensei,
I have finished the 1hour shift for Radar-AMeDAS data for sites A-E from 2007-2020.
The shifted data are put at:
/lebron_disk09/gyin/Radar_new
I conducted the shift on server lala, and the codes are at:
/home/gyin/shift_siteA(or B, C, D, E)
I checked the new data and it look okay. But due to the lack of data in 2021, on December 31 2020, the last one hour data are missing.
Could you please check the shifted data if you have time? Thank you very much!
Best regards,
Gaohong
takao-yFriday, March 19th, 2021 at 6:09:35 PM GMT+09:00
Dear Yin-san,
Thank you for your quick response!
I will ask Higashiuwatoko-san about the data in 2021.
Best Regards,
T. Yoshikane
Thank you for your quick response!
I will ask Higashiuwatoko-san about the data in 2021.
Best Regards,
T. Yoshikane
takao-yFriday, March 19th, 2021 at 6:14:53 PM GMT+09:00
@uwatoko様
解析雨量ですが、2021年1月のオンラインデータは入手できますでしょうか?オフラインデータは恐らく9月頃になるので、オンラインデータを使わせていただければありがたいのですが。
吉兼
解析雨量ですが、2021年1月のオンラインデータは入手できますでしょうか?オフラインデータは恐らく9月頃になるので、オンラインデータを使わせていただければありがたいのですが。
吉兼
uwatokoTuesday, March 23rd, 2021 at 10:52:36 AM GMT+09:00
@takao-y 様
解析雨量はありますが、まだ処理が未解決なので、少しお待ちください。
解析雨量はありますが、まだ処理が未解決なので、少しお待ちください。
takao-yTuesday, March 23rd, 2021 at 5:53:49 PM GMT+09:00
@uwatoko様
ご連絡ありがとうございます。
よろしくお願いいたします。
ご連絡ありがとうございます。
よろしくお願いいたします。
uwatokoFriday, March 26th, 2021 at 11:49:12 AM GMT+09:00
@takao-y様
解析雨量とMSMの2021年1月のデータを作成して以下に格納致しました。
1時間ずれも対応しております。
解析雨量:/lebron_disk09/GPM/AI_GSMaP/DATA/SRF_GPV_Ggis1km_cut/siteX/202101
MSM:/lebron_disk09/GPM/AI_GSMaP/DATA/MSM_GPV_Rjp_cut/siteX/202101
ご確認頂けますでしょうか。
宜しくお願いします。
解析雨量とMSMの2021年1月のデータを作成して以下に格納致しました。
1時間ずれも対応しております。
解析雨量:/lebron_disk09/GPM/AI_GSMaP/DATA/SRF_GPV_Ggis1km_cut/siteX/202101
MSM:/lebron_disk09/GPM/AI_GSMaP/DATA/MSM_GPV_Rjp_cut/siteX/202101
ご確認頂けますでしょうか。
宜しくお願いします。
takao-ySaturday, March 27th, 2021 at 10:01:55 AM GMT+09:00
@uwatoko様@gyin 様
ありがとうございました。
Yin-san,
Could you check the Radar_AMeDAS data in January 2021?
/lebron_disk09/GPM/AI_GSMaP/DATA/SRF_GPV_Ggis1km_cut/siteX/202101
Best Regards,
T. Yoshikane
ありがとうございました。
Yin-san,
Could you check the Radar_AMeDAS data in January 2021?
/lebron_disk09/GPM/AI_GSMaP/DATA/SRF_GPV_Ggis1km_cut/siteX/202101
Best Regards,
T. Yoshikane
gyinMonday, March 29th, 2021 at 11:03:06 AM GMT+09:00
Dear Yoshikane-sensei,
I have checked the new Radar-AMeDAS data provided in the path:
/lebron_disk09/GPM/AI_GSMaP/DATA/SRF_GPV_Ggis1km_cut/siteX/
Since I do not have the raw data for 2021, I did not check the 202101 yet. But I checked the other years, and it seems the one hour shift has been corrected for all other years. Thank you very much!
Best regards,
Gaohong
takao-yMonday, March 29th, 2021 at 11:18:37 AM GMT+09:00
Dear Yin-san,
Thank you very much!
Best Regards,
T.Yoshikane
Thank you very much!
Best Regards,
T.Yoshikane
yamamoto.kosukeThursday, April 1st, 2021 at 2:52:13 PM GMT+09:00
チャンネル名を「machine-learning」から「01_machine-learning」に変更しました
yamamoto.kosukeThursday, April 1st, 2021 at 3:03:22 PM GMT+09:00
* RULES FOR USING THIS SLACK **
• Please make new thread ONLY when you post a new topic.
• Please REPLY IN THREADS when you discuss or answer existing topic.
• Please MENTION someone you want to talk to by using "@" .
**
• Please make new thread ONLY when you post a new topic.
• Please REPLY IN THREADS when you discuss or answer existing topic.
• Please MENTION someone you want to talk to by using "@" .
**
yamamoto.kosukeThursday, April 1st, 2021 at 3:05:45 PM GMT+09:00
@takao-y 様、@uwatoko様
slackが雑然としてきたので、上記のようにルールを設定しました。情報を見つけやすくするため、自分の仕事を忘れないためにも、お手数ですがご注意願います。
slackが雑然としてきたので、上記のようにルールを設定しました。情報を見つけやすくするため、自分の仕事を忘れないためにも、お手数ですがご注意願います。
uwatokoThursday, April 1st, 2021 at 4:56:01 PM GMT+09:00
@yamamoto.kosuke様
了解しました。
上記のルールで対応していきます。
宜しくお願いします。
了解しました。
上記のルールで対応していきます。
宜しくお願いします。
yamamoto.kosukeThursday, April 1st, 2021 at 3:19:12 PM GMT+09:00
@takao-y様
お世話になります。現状の役割分担と進捗状況を今一度確認させてください。
• 2007年から2020年までのMSMデータを使った定常運用用の識別機作成(@JAXAサーバ)の状況はいかがでしょうか。JAXAサーバ上での実施で問題がありましたらお知らせください(東上床さんと話して、定常処理化に向けて識別機のサンプルを頂ければありがたいとのことでした)。
• 定常運用用に、MSM39時間予測の領域切り出しを東上床さんに定常化していただこうとしています。定常化に向けて、以下二点確認させてください。
a. 現状ではsiteA-E毎に推定を行いますが、TE-Jへの入力時にすべての領域をつなげるので、機械学習推定も領域で分けずに全域で行ったほうが、処理後に繋げる必要がなくて良いと思うのですが、如何でしょうか。
b. 現状のツールでは、SVMの結果を出力した後、CDFtで再読み込みして結果出力という形になっていますが、定常運用では両者をひとまとめで処理したほうが処理時間短縮につながるのではと考えていますが、如何でしょうか。
a,bに関しては、今回の定常化では間に合わないとしても、今後の処理の早期化に向けて考えたいことですので、お考えを聞かせていただけますと幸いです。よろしくお願いいたします。
takao-ySaturday, April 3rd, 2021 at 12:34:22 PM GMT+09:00
ご連絡ありがとうございます。
a.ですが、1500x1320で、各領域に対応する格子のみで推定を行うという理解で良いでしょうか。問題はないと思いますが、並行処理ができるように何らかの工夫は必要かなと考えています。(例えば、1500x1320の領域で格子番号を統一していくつかの細かい領域に分割して並行処理を行い、計算終了後に1500x1320の領域に統合して日本全域での推定値を出力するなど。)
b.基本的には地点ごとに処理しているので特に問題はないと思います。
いずれにしても、若干シェルの書き換えが必要になると思いますが、その辺りはお任せしてよろしいでしょうか。
a.ですが、1500x1320で、各領域に対応する格子のみで推定を行うという理解で良いでしょうか。問題はないと思いますが、並行処理ができるように何らかの工夫は必要かなと考えています。(例えば、1500x1320の領域で格子番号を統一していくつかの細かい領域に分割して並行処理を行い、計算終了後に1500x1320の領域に統合して日本全域での推定値を出力するなど。)
b.基本的には地点ごとに処理しているので特に問題はないと思います。
いずれにしても、若干シェルの書き換えが必要になると思いますが、その辺りはお任せしてよろしいでしょうか。
yamamoto.kosukeMonday, April 5th, 2021 at 2:46:04 PM GMT+09:00
@takao-y様
お返事ありがとうございます。いずれも承知しました。今回はまず定常化を優先させたいので、RESTECさんと話をしながら簡単に対応できそうであれば進めたいと思います。
定常運用用の識別機作成については、どの程度で処理が終わりそうでしょうか?
お返事ありがとうございます。いずれも承知しました。今回はまず定常化を優先させたいので、RESTECさんと話をしながら簡単に対応できそうであれば進めたいと思います。
定常運用用の識別機作成については、どの程度で処理が終わりそうでしょうか?
takao-yTuesday, April 6th, 2021 at 5:32:38 PM GMT+09:00
@yamamoto.kosuke様 @gyin様
現在、領域A,B,Eについて2007~2020年までの識別器作成を実施しています。来週中には終了とのことです。
Yinさんが頑張ってくださいました。ありがとうございます。
現在、領域A,B,Eについて2007~2020年までの識別器作成を実施しています。来週中には終了とのことです。
Yinさんが頑張ってくださいました。ありがとうございます。
takao-yTuesday, April 6th, 2021 at 5:39:36 PM GMT+09:00
@yamamoto.kosuke 様、@gyin様
現在の領域ではRadar-AMeDASに欠測値が含まれるポイントが多いため、Yinさんの方で、欠測がある地点を除いて(NaN値を与えるなどして)計算に使用しないようにプログラムの作成をしてもらっています。
現在の領域ではRadar-AMeDASに欠測値が含まれるポイントが多いため、Yinさんの方で、欠測がある地点を除いて(NaN値を与えるなどして)計算に使用しないようにプログラムの作成をしてもらっています。
yamamoto.kosukeWednesday, April 7th, 2021 at 9:17:00 AM GMT+09:00
@takao-y 様、@gyin 様
ご対応いただきありがとうございます。状況について承知しました。可能であれば本日の打ち合わせで簡単にご報告いただければありがたいです。よろしくお願いいたします。
ご対応いただきありがとうございます。状況について承知しました。可能であれば本日の打ち合わせで簡単にご報告いただければありがたいです。よろしくお願いいたします。
takao-yWednesday, April 7th, 2021 at 10:33:40 AM GMT+09:00
@gyin -san
Could you report the progress toward to the operation of TE-Japan on Zoom meeting in detail?
My understanding is that
1. Making classifiers
(The making classifiers (2007 to 2020 in siteA to E) will be finished by the next week.)
2. Modification of the program for undef values
(Trying to modify the program for undefined values to remove the estimation of machine learning.)
Thank you very much for your dedication!
gyinWednesday, April 7th, 2021 at 10:42:42 AM GMT+09:00
Dear Yoshikane-sensei,
Yes, your understanding is correct. I will prepare a slide to report the progress. Thank you very much!
Best regards,
Gaohong
Yes, your understanding is correct. I will prepare a slide to report the progress. Thank you very much!
Best regards,
Gaohong

rkanekoFriday, April 2nd, 2021 at 1:31:20 PM GMT+09:00
@rkanekoさんがチャンネルに参加しました
takao-yThursday, April 8th, 2021 at 3:53:47 PM GMT+09:00
「1kmへのダウンスケーリングについて」
SVMは極めてシンプルで扱いやすいのですが、1kmへのダウンスケーリングの実施に合わせて深層学習に移行した方が良いかなと考えています。
I/Oへの負荷が大幅に軽減されることと、一旦識別器を作成すれば推論部分ではかなり大幅な時短が期待されます。識別器作成にマシンパワーが必要になりますが、板谷さんによるとSVMの数倍程度の時間で済むとのことですので、特に大きな問題はなさそうです。
一方で、深層学習でも量まで合わせるのはかなり難しいので、分位マッピングの処理は必要と思われます。並列化も含めて効率的に計算する方法を検討した方が良さそうです。
以前の計算結果と概要についてPPTファイルを添付します。ご参考にしていただければ幸いです。
https://www.dropbox.com/s/xba7yalwucmkgvt/20210407-downscaling.pptx?dl=0
取り急ぎ、報告まで。
吉兼
gyinThursday, April 15th, 2021 at 2:35:39 PM GMT+09:00
@takao-y
Dear Yoshikane-sensei,
Here is some update on the classifier generating. Since we decided to ignore those grids not covered by Radar-AMeDAS (always show -999000000), I updated the code and rerun classifier after last week’s meeting.
I found that the running was much slower than I expected. Therefore, I checked the time spent for each step. For one grid pixel, the time spend for making training data is ~5 seconds, but the time for generating classifier is ~48 seconds. Therefore, with this speed, to generate classifiers for one site and one month, it will take about ~53 sec/grid ~15000 grids = 795,000 sec = ~9 days.*
Therefore, I think I over-predict the running speed last time during the meeting. I am sorry for the wrong information provided previously. I am currently running for siteC (Dec-Jan-Feb as one running job; Jun-Jul-Aug as one job; Sep-Oct-Nov as one job). I did not run for more jobs because I am worrying that running more jobs will slow down the current process.
I also attached the codes I used for classifier generating here (siteC example).
Thank you very much!
Best regards,
Gaohong
takao-yMonday, April 19th, 2021 at 11:01:44 AM GMT+09:00
Dear Yin-san,
I’m sorry for the late replay.
What about the time spend of old version before updating?
I think it is too much slow. So, we should find out the cause. Could you try to run the updated version on isotope3?
Usually, it is expected to be faster than older version because the data is reduced.
Best Regards,
T. Yoshikane
gyinMonday, April 19th, 2021 at 3:38:40 PM GMT+09:00
Dear Yoshikane-sensei,
Thank you very much for your reply!
I tried to take a look into each step and found the reason of the much slower speed. The python code for making classifier was the same for the old and new version. I think the reason for the much longer time is related to the larger data size.
In the old version, we generate classifier using training data of every three hours (for example in July, training data size for each year is 248 instead of 744), and the training period was 2007-2018.
But for the new version, I let it generate classifier using hourly data (i.e., July has 744 data for each year) and the training period is 2007-2020. Therefore, the new version training data size is more than 3 times larger than the old version, and thus the time spent is longer than before.
I also tested the running speed on isotope3 and it is not very different from on JAXA server. I think a way to improve the current progress maybe run it at both JAXA server and isotope3 at the same time for different sites. Can I have your thoughts on it or should I keep working on JAXA server only for consistency?
Thank you very much!
Best regards,
Gaohong
takao-yTuesday, April 20th, 2021 at 8:17:07 AM GMT+09:00
Dear Yin-san,
Thank you very much for your reply.
I understood the situation.
Basically, the time spent increases sharply when the input data increases in SVM. (This is one of the disadvantages of SVM). I think that’s the reason why the time spent is increasing in comparison with the old version.
Please keep working it on JAXA’s server.
(But we should solve this problem in the future…)
Best Regards,
T. Yoshikane
gyinFriday, April 23rd, 2021 at 6:13:33 PM GMT+09:00
Dear @takao-y @uwatoko ,
I am currently still running for generating classifiers. However, it seems there is some problem with Radar-AMeDAS data in December.
I randomly selected some years and checked December data in sites A-E, but it seems all the values are given as -999000000. Could you please check it when you have time? Thank you very much!
Best regards,
Gaohong
takao-yMonday, April 26th, 2021 at 12:30:31 PM GMT+09:00
Dear @gyin san @uwatoko san,
I got it. What about the other months?
東上床さま
解析雨量の12月のデータが、A-Eの領域で欠測値となっているようです。確認をお願いできますでしょうか。
吉兼
I got it. What about the other months?
東上床さま
解析雨量の12月のデータが、A-Eの領域で欠測値となっているようです。確認をお願いできますでしょうか。
吉兼
uwatokoMonday, April 26th, 2021 at 1:04:50 PM GMT+09:00
@gyinさん、@takao-y 先生
了解しました。チェックします。
了解しました。チェックします。
uwatokoMonday, April 26th, 2021 at 2:45:37 PM GMT+09:00
@gyinさん、@takao-y 先生
「-999000000.」はレーダーアメダスで欠損値として定義している値です。
ですのでレーダーの範囲外の部分になります。
「-999000000.」はレーダーアメダスで欠損値として定義している値です。
ですのでレーダーの範囲外の部分になります。
gyinMonday, April 26th, 2021 at 4:00:11 PM GMT+09:00
@takao-y -sensei, @uwatoko -san,
Thank you for your reply!
I understand that -999000000 represents the no data area. But it seems for the Radar-AMeDAS data in December, all grids are assigned as -999000000. For example, I tried to read data from:
/lebron_disk09/GPM/AI_GSMaP/DATA/SRF_GPV_Ggis1km_cut/siteC/201212
Both GrADS and Matlab show the whole area is defined as -999000000.
Could you please check it? (I guess it may be related to the one hour shift conducted before). Thank you very much!
Best regards,
Gaohong
uwatokoMonday, April 26th, 2021 at 4:58:34 PM GMT+09:00
@gyin-san,、@takao-y -sensei,
I understand that all data is set to -999000000.
I apologize for the inconvenience. We will check the data immediately.
I understand that all data is set to -999000000.
I apologize for the inconvenience. We will check the data immediately.
uwatokoMonday, April 26th, 2021 at 5:11:02 PM GMT+09:00
@gyin-san,、@takao-y -sensei,
We have confirmed that the data in 201212 is NG.
We will investigate the cause and take action.
We have confirmed that the data in 201212 is NG.
We will investigate the cause and take action.
uwatokoTuesday, April 27th, 2021 at 12:00:59 PM GMT+09:00
@gyin-san,、@takao-y -sensei,
December of all years for all sites was NG.
I have confirmed that all other months are being handled correctly.
I apologize for the omission of confirmation.
We have recreated December for all sites for all years.
/lebron_disk09/GPM/AI_GSMaP/DATA/SRF_GPV_Ggis1km_cut/siteX/20xx12
December of all years for all sites was NG.
I have confirmed that all other months are being handled correctly.
I apologize for the omission of confirmation.
We have recreated December for all sites for all years.
/lebron_disk09/GPM/AI_GSMaP/DATA/SRF_GPV_Ggis1km_cut/siteX/20xx12
gyinTuesday, April 27th, 2021 at 8:49:09 PM GMT+09:00
@uwatoko -san,
I have checked the December data and it works now. Thank you very much for your quick response!
Best regards,
Gaohong
I have checked the December data and it works now. Thank you very much for your quick response!
Best regards,
Gaohong
uwatokoMonday, April 26th, 2021 at 1:04:50 PM GMT+09:00
@gyinさん、@takao-y 先生
了解しました。チェックします。
了解しました。チェックします。
uwatokoWednesday, April 28th, 2021 at 6:47:33 PM GMT+09:00
@takao-y 先生
お世話になっております。東上床@RESTECです。
頂いたプログラムのテストを行っておりますが、auto-step03で止まるところがあります。
auto-step03の入力データに2007-2018年のcsvファイルがありますが、これがないためテストできない
状況です。テストでも構わないので作成済のデータがございましたら、提供して頂けないでしょうか。
宜しくお願いします。
お世話になっております。東上床@RESTECです。
頂いたプログラムのテストを行っておりますが、auto-step03で止まるところがあります。
auto-step03の入力データに2007-2018年のcsvファイルがありますが、これがないためテストできない
状況です。テストでも構わないので作成済のデータがございましたら、提供して頂けないでしょうか。
宜しくお願いします。
takao-yFriday, April 30th, 2021 at 4:50:39 PM GMT+09:00
@uwatoko様
ご連絡ありがとうございます。データをlili:/home/takao-y/pub/ml-region1-all-python/data-out 以下に置きました。ただ、39時間予報の設定と微妙に変わっている可能性がありますので、ご確認いただけますでしょうか。機械学習推定値(CDF適用前)に関しては、Yinさんがすでに実施されていますので、詳細についてはYinさんの方にお問い合わせいただけますでしょうか。(リアルタイム予報で実際に使うのは、Yinさんが作成されているデータです)
@gyin san,
Could you tell us the data directory of estimated precipitation by ML before applying CDF? It seems that Higashiuwatoko-san needs the test data for 39 hour forecast to apply to the CDF.
Best Regards,
T. Yoshikane
gyinFriday, April 30th, 2021 at 5:23:23 PM GMT+09:00
Dear @takao-y -sensei, @uwatoko -san,
For the new defined sites, I only finished cross-validation run (2007-2020) for site C in July. The ML results before applying CDF can be found at:
/lebron_disk09/gyin/ml_backup/data-out
For the old defined sites, I have the ML results before applying CDF for all sites. But I am not sure whether it will work well because the used Radar-AMeDAS data has one hour shift issue. Some of the results can be found at: “/lebron_disk09/gyin/previous/“. If you think the old version will work, please let me know and I will organize them better.
Thank you very much!
Best regards,
Gaohong
takao-yFriday, April 30th, 2021 at 6:36:52 PM GMT+09:00
Dear @gyin @uwatoko
Thank you very much for your reply.
I appreciate for your effort.
東上床様、もし不明な点がありましらた、ご連絡していただければ幸いです。
よろしくお願いいたします。
Thank you very much for your reply.
I appreciate for your effort.
東上床様、もし不明な点がありましらた、ご連絡していただければ幸いです。
よろしくお願いいたします。
yamamoto.kosukeThursday, June 3rd, 2021 at 3:28:47 PM GMT+09:00
チャンネル名を「01_machine-learning」から「04_machine-learning」に変更しました
yamamoto.kosukeThursday, June 3rd, 2021 at 3:30:35 PM GMT+09:00
チャンネルのトピックを設定 : 機械学習による雨量推定
snm1.nextThursday, June 3rd, 2021 at 3:45:06 PM GMT+09:00
@snm1.nextさんがチャンネルに参加しました

andoh_takafusaThursday, June 3rd, 2021 at 3:56:29 PM GMT+09:00
@andoh_takafusaさんがチャンネルに参加しました

hayakawa-gen1010Thursday, June 3rd, 2021 at 4:15:48 PM GMT+09:00
@hayakawa-gen1010さんがチャンネルに参加しました

suzuki.s-hyThursday, June 3rd, 2021 at 4:43:57 PM GMT+09:00
@suzuki.s-hyさんがチャンネルに参加しました

oki.rikoThursday, June 3rd, 2021 at 7:14:16 PM GMT+09:00
@oki.rikoさんがチャンネルに参加しました

kakuda_ryosukeFriday, June 4th, 2021 at 9:51:14 AM GMT+09:00
@kakuda_ryosukeさんがチャンネルに参加しました

fujii.hideyukiFriday, June 4th, 2021 at 11:38:10 AM GMT+09:00
@fujii.hideyukiさんがチャンネルに参加しました

kenshi.hibinoFriday, June 4th, 2021 at 7:41:57 PM GMT+09:00
@kenshi.hibinoさんがチャンネルに参加しました
ooishi.h-ieWednesday, June 9th, 2021 at 11:48:58 PM GMT+09:00
@ooishi.h-ieさんがチャンネルに参加しました

yixisi1505Thursday, June 10th, 2021 at 9:45:21 AM GMT+09:00
@yixisi1505さんがチャンネルに参加しました

sasage.e-heFriday, June 11th, 2021 at 5:09:55 PM GMT+09:00
@sasage.e-heさんがチャンネルに参加しました

fujishima.s-fcMonday, June 14th, 2021 at 11:22:45 AM GMT+09:00
@fujishima.s-fcさんがチャンネルに参加しました
gyinWednesday, June 23rd, 2021 at 5:31:36 PM GMT+09:00
Dear @takao-y -sensei, @uwatoko -san,
The classifiers for sites A-E from Jan to Dec generated by using data from 2007-2020 are now available in:
/lebron_disk09/gyin/classifier_2007_2020
I am sorry that the process was a little slower than I expected. Please let me know if there is any problem or missing files. Thank you very much!
Best regards,
Gaohong
takao-yWednesday, June 23rd, 2021 at 5:39:14 PM GMT+09:00
@gyin -san, @uwatoko -san,
Thank you very much for your effort!
東上床様、Yinさんに作成していただいたデータのご確認いただければ幸いです。よろしくお願いいたします。
Thank you very much for your effort!
東上床様、Yinさんに作成していただいたデータのご確認いただければ幸いです。よろしくお願いいたします。
uwatokoWednesday, June 23rd, 2021 at 5:45:27 PM GMT+09:00
@takao-y 様、@gyin様
ありがとうございます。
了解しました。
ありがとうございます。
了解しました。
uwatokoThursday, June 24th, 2021 at 12:18:27 PM GMT+09:00
@takao-y 様、@gyin様
/lebron_disk09/gyin/classifier_2007_2020のディレクトリに
mod1_xxx_xxx-gamma_0.000005-cost_4-epsilon_0.0001.pkl
ファイルがsite毎、月事に存在する事を確認いたしました。このファイルが識別器なのでしょうか。
これまでの識別器はmod1_xx_xx.cmp というファイル名で600Kbyte程度だったのに対し、このファイルは20Mbyte以上あります。
/lebron_disk09/gyin/classifier_2007_2020のディレクトリに
mod1_xxx_xxx-gamma_0.000005-cost_4-epsilon_0.0001.pkl
ファイルがsite毎、月事に存在する事を確認いたしました。このファイルが識別器なのでしょうか。
これまでの識別器はmod1_xx_xx.cmp というファイル名で600Kbyte程度だったのに対し、このファイルは20Mbyte以上あります。
gyinThursday, June 24th, 2021 at 1:56:53 PM GMT+09:00
@uwatoko -san, @takao-y -sensei,
This is the classifier. I think based on the size of training data, the size of classifier is also changing. For my cross-validation using every three hour data during 2007-2020, the classifier size is usually ~7M. For the classifiers in /lebron_disk09/gyin/classifier_2007_2020, they are generated by using every hour data, as thus the size was much larger. Thank you!
This is the classifier. I think based on the size of training data, the size of classifier is also changing. For my cross-validation using every three hour data during 2007-2020, the classifier size is usually ~7M. For the classifiers in /lebron_disk09/gyin/classifier_2007_2020, they are generated by using every hour data, as thus the size was much larger. Thank you!
uwatokoThursday, June 24th, 2021 at 2:05:44 PM GMT+09:00
@gyin-san,、@takao-y -sensei,
I understand that all data is the classifier.
I apologize for the inconvenience. We will check the data immediately.
I understand that all data is the classifier.
I apologize for the inconvenience. We will check the data immediately.
uwatokoWednesday, June 23rd, 2021 at 5:45:27 PM GMT+09:00
@takao-y 様、@gyin様
ありがとうございます。
了解しました。
ありがとうございます。
了解しました。
uwatokoThursday, June 24th, 2021 at 12:18:27 PM GMT+09:00
@takao-y 様、@gyin様
/lebron_disk09/gyin/classifier_2007_2020のディレクトリに
mod1_xxx_xxx-gamma_0.000005-cost_4-epsilon_0.0001.pkl
ファイルがsite毎、月事に存在する事を確認いたしました。このファイルが識別器なのでしょうか。
これまでの識別器はmod1_xx_xx.cmp というファイル名で600Kbyte程度だったのに対し、このファイルは20Mbyte以上あります。
/lebron_disk09/gyin/classifier_2007_2020のディレクトリに
mod1_xxx_xxx-gamma_0.000005-cost_4-epsilon_0.0001.pkl
ファイルがsite毎、月事に存在する事を確認いたしました。このファイルが識別器なのでしょうか。
これまでの識別器はmod1_xx_xx.cmp というファイル名で600Kbyte程度だったのに対し、このファイルは20Mbyte以上あります。
uwatokoFriday, June 25th, 2021 at 6:30:00 PM GMT+09:00
@takao-y 様、@gyin様
すみません、サイトAで確かめているのですが、
新しい識別器(mod1_xxx_xxx-gamma_0.0000005-cost_8-epsilon_0.001.pkl)で
動作確認(auto-step02.sh)を実施したところ、データの読み込みはできたのですが、
predictedY1 = clf.predict(X)
を実行した際に以下のエラーとなります。
ValueError: X.shape[1] = 440 should be equal to 625, the number of features at training time
(学習時と特徴量が合っていない?)
新しい識別器に対応する推定処理プログラムがありますでしょうか。
gyinSunday, June 27th, 2021 at 9:08:14 PM GMT+09:00
@uwatoko -san, @takao-y -sensei,
I am sorry for the reply. If I understood it correctly, your current code cannot read the classifier? I am not sure which code you used, and I attached the code I used for reading classifiers and run ML here.
Because the classifiers are generated for each site and month based on the selection of hyper parameters and feature vectors (results provided by Kobayashi-san), the feature vector size are not always 12, I think that is why you have the error warning? Also, for the current classifier results, if the grid does not have Radar-AMeDAS data available, no classifier file was generated for that specific grid.
Please let me know if the attached code does not work or you have any other problem with running it. Thank you very much!
uwatokoMonday, June 28th, 2021 at 10:09:32 AM GMT+09:00
@yamamoto.kosuke さん
すみません、teamsに入れてないトラブルに見舞われております。
すみません、teamsに入れてないトラブルに見舞われております。
yamamoto.kosukeMonday, June 28th, 2021 at 10:10:36 AM GMT+09:00
ご連絡ありがとうございます。先に他の話題から始めさせてもらっています。
rkanekoMonday, June 28th, 2021 at 11:47:55 AM GMT+09:00
@yamamoto.kosuke @uwatoko @kubota.takuji
Thank you very much for just now.
I have finished sending the invitation to participate in our work-group of the S2S-AI-Challenge competition.
I would highly appreciate it if you would participate in our group.
Best Regards,
Ryo Kaneko
Thank you very much for just now.
I have finished sending the invitation to participate in our work-group of the S2S-AI-Challenge competition.
I would highly appreciate it if you would participate in our group.
Best Regards,
Ryo Kaneko
takao-yTuesday, June 29th, 2021 at 1:08:54 PM GMT+09:00
昨日の補足ですが、3時間積算値の降水分布が過去12年間では類似した事例がなく、学習できなかった可能性があります。過去の似た事例(降水が少ない?)に当てはめて推定しているのかもしれません。とりあえず、台風19号の事例を学習に取り入れて過学習を意図的に起こして推定できるのか確認いたします。
対策としては、
1. 外れ値(異常値)検出を実施し、予測に使用しない
2. 特徴量の範囲を狭めて強雨事例を学習しやすくする
1.では通常のパターンに当てはまらないパターンを検出し除去するもので、台風19号のようなケースを異常値として扱い、予測に使用しないようにします。
2.はYinさんが説明されていたように、特徴量の範囲を変えるとその範囲での強雨事例が増えることから極端な過小評価は解消されます。ただし、結果的に分布特性はMSMに近くなり、分布のバイアス補正効果が小さくなります(RG=0では実質的に分位マッピングと同じで単にアンサンブルメンバーが増えただけの効果しかない?)。1を活用して、異常値には特徴量範囲を狭めることもできるかと思います。
量的にはCDF-transform法を用いることにより、MSMの予報値を反映した値が推定されるため、過去に観測されていない降水にも対応可能です。特に台風19号のようなケースには効果的と推測されますが、元々は温暖化実験で使われているものを予報用に(やや強引に)適用したもので、もう少し検証が必要かもしれません。
takao-yThursday, July 1st, 2021 at 9:57:52 AM GMT+09:00

機械学習の感度実験の結果を添付します。
2019INは2019年10月を学習に入れたもの、ASOは8,9,10月の3ヶ月を学習データにしたもの(2019年は除外)です。
2019INでは、過小評価傾向がほとんど改善されず、ASOでは、やや改善が見られました。
推測ですが、10月で学習した場合は、台風ではなく通常の低気圧の通過に伴う降水分布パターンを認識して過小評価になっていると考えられます。設定のミスはないと思いますが、念の為2019年だけで学習、推定する実験も実施してみます。ASOで改善されたのは、台風による降水分布パターンを学習したためと考えられます。(10月の低気圧によるパターンも含まれるためやや過小評価?)。3時間積算値については通常の低気圧に伴う前線通過による降水では全体的に降水分布(ピーク)が均されてしまい、過小評価になっていると想定されます。(台風では持続して強雨が形成)。これらの結果から、例えば台風事例だけを学習することにより過小評価は大幅に改善できるかもしれません。
keiyoshi08Thursday, July 1st, 2021 at 10:19:58 AM GMT+09:00
台風事例の学習は良いと思いますが、リアルタイムで起こっている現象に台風識別機を当てるかどうかの判断も必要になってきますね。この調子で、線状降水帯用、梅雨用とか出てくるのはちょっと避けたほうがよいとは思います。(尹さんがやってるRG変えるのも、本質的には同様だと捉えてます。)
takao-yThursday, July 1st, 2021 at 10:57:42 AM GMT+09:00
リアルタイムではなく、長時間積算降水量(5日間予報など?)にすると本手法の強みが活かされると思います。GSMGPV20kmでは強雨が過小評価傾向ですので、分布、量共に改善が期待できると思います。ただ、機械学習の特性が徐々に明らかになってきているので、例えばMSMGPVの予測値に対して、どのサンプリング、どの特徴量範囲を使えば最適になるのか判断できる仕組みを構築できれば、リアルタイムでもそこそこ使えるものになるのではないかと思います。原因が明確になれば対処もしやすくなるので、とりあえず今は十分に調査して機械学習の振る舞いを把握することが必要と思います。
takao-ySaturday, July 3rd, 2021 at 9:33:26 AM GMT+09:00

2019年を含んで学習した実験(2019IN)が間違っていました(プログラムミスで2019年は含んでおらず、2007年から2018年までの12年間のデータを使っていました。CTLでは2007年から2017年までの11年間のデータ)。今回、2007年から2019年までの13年間のデータを使って実験しました。結果を添付します。
降水量は大幅に改善され、観測に近くなりました。この結果から2019年10月の台風事例が異例で、3時間降水データの学習では対応できないと考えられます。
1時間降水では、低気圧に伴う前線の降水(それなりに強雨)を認識して推定したと思われます。(台風19号のような強雨ケースもCDF-transformにより変換(外挿?)して推定)。
機械学習が100km四方(1時間程度)のメソベーター降水を認識するように設定されているため、1時間降水を扱うのが最適かと思います。地形性降水の場合は前線も台風によるものも違いはないとして認識?1時間値でも過去に例のないパターンは認識しにくい?もう少し調査する必要があると思います。
いずれにしても、台風19号のようなケースは極めて稀で(3時間積算降水では)パターン認識ができず、大幅な過小評価になったと推測されます。
uwatokoMonday, July 12th, 2021 at 3:15:52 PM GMT+09:00
@takao-y 先生
前回の識別機のエラーの件ですが、解決しました。
---------------------------------------------------------------------------------------------------
新しい識別器(mod1xxx_xxx-gamma_0.0000005-cost_8-epsilon_0.001.pkl)で
動作確認(auto-step02.sh)を実施したところ、データの読み込みはできたのですが、
predictedY1 = clf.predict(X)
を実行した際に以下のエラーとなります。
ValueError: X.shape[1] = 440 should be equal to 625, the number of features at training time
(学習時と特徴量が合っていない?)
---------------------------------------------------------------------------------------------------
特徴量の数を指定するパラメータ(range of feature vectors)にrg2とnumsがあるのですが、
この値は現状10と441を設定しています。
しかし、新しい識別器には、この値が12と625になっているものもあると認識しています。
ここの値を12と625にしたところ、上記のエラーがなく問題なく動作しました。
これですべて動作できると思ったのですが、推定処理でsiteA~siteCはエラーにはならない
のですが、siteD,siteEでは以下のエラーになってしまいます。
何か、お心当たりがあれば、教えて頂きたく、お願いいたします。
---------------------------------------------------------------------------------------------------
エラーの箇所:step02-ml_test.sh の predictedY1 = clf.predict(X)
メッセージ:AttributeError: 'SVR' object has no attribute 'probA'
---------------------------------------------------------------------------------------------------
作業している環境は以下のとおりです。
zico-n:/goemon_disk2/trmmauto/AI_GSMaP/tool/MSMGPV-39h-forecast-site/mlcdft-bin-39h/ml-region1-all-python/
新しい識別器を使用した推定値からCDF補正を行うため、site単位の学習データが必要
になります。
convert_svmcdft-39hgyin.sh を見ると2007年~2020年のデータを読み込む作りになって
いるのですが、ここで読み込む2007年~2020年のデータは既に作成済なのでしょうか、
それともこちらで作成する必要があるのでしょうか。
宜しくお願いします。
uwatokoWednesday, July 14th, 2021 at 11:57:35 AM GMT+09:00
@takao-y 先生
追加情報です。
現在siteDおよびsiteEの推定処理(step02-mltest.sh)を実行した際に
predictedY1 = clf.predict(X)で
AttributeError: 'SVR' object has no attribute 'probA'
のエラーになる原因を調べています。
試しにsiteDのMSMデータに対してsiteAの識別器を読み込ませたところ、
predictedY1 = clf.predict(X)でエラーとならず、推定結果が出力されました。
同様にsiteEのMSMデータに対してもsiteAの識別器を読み込ませると推定結果が出力されました。
逆にsiteAのMSMデータに対してsiteDやsiteEの識別器を読み込ませると
predictedY1 = clf.predict(X)でエラーとなってしまいます。
この事からsiteD/siteEの識別器に問題があるのではないかと考えています。
siteD/siteEの識別器が正常に作成されているか、ご確認頂けないでしょうか。
takao-yWednesday, July 14th, 2021 at 1:03:20 PM GMT+09:00
@gyin -san, @uwatoko san
It seems Higashiuwatoko-san found some errors in the classifier reading part in siteD and E. Did you change the size of FV in siteD and E? According to Higashiuwatoko-san, there is no problem with the classifier in the case of “rg=12”. Actually, the rg2 is fixed by 10 in all sites.
They are working on the following machine. zico-n:/goemon_disk2/trmmauto/AI_GSMaP/tool/MSMGPV-39h-forecast-site/mlcdft-bin-39h/ml-region1-all-python/
Could you check the error?
It seems they need the estimated precipitation data from 2007 to 2020 for CDF correction. Could you tell them the directory with the data?
Best Regards,
T. Yoshikane
gyinWednesday, July 14th, 2021 at 9:34:26 PM GMT+09:00
@takao-y -sensei, @uwatoko -san,
I am sorry for replying late.
For the classifier, I am sorry but I was not told that all sites should use rg=10. Therefore, I used the hyper-parameters and feature vector from the previous results from Kobayashi-san (I think) based on different seasons. I attached the excel files that records the selection of hyper-parameters and feature vector size.
As for the CDF, I asked last time but was told do not need to run cross-validation from 2007-2020 at this moment. So I did not do it yet. I only have the 2007-2020 cross validation for site C in July for my analysis purpose. And I have 2007-2019 cross validation results based on the previous sites area definition (smaller than current study site area; and I may deleted some results because of storage). If it is needed, I will start running it from this week.
If I need to run the cross-validation case for 2007-2020, the code I am currently using is running for each grid separately. But from the code you sent me last time for 39hr forecast, it seems you started to collect all grids at the same longitude into one file when making training/testing data. May I ask is that the final version you decided to use? Should I keep current code version which run for each grid or move to the new version? Thank you very much!
Best regards,
Gaohong
gyinWednesday, July 14th, 2021 at 9:35:42 PM GMT+09:00


Sorry I forgot to attach the spreadsheets.
gyinThursday, July 15th, 2021 at 12:05:38 AM GMT+09:00
@takao-y -sensei, @uwatoko -san,
I tried to run the ML using the generated classifier at site D (Oct as example) and it works for me without showing error (I also attached the codes I used for step2, which are the same as what I sent a few weeks ago).
I went to the guided directory on zico-n but I did not find the specific file indicating the error message. Could you please provide a little more information on it? Also, based on my understanding, codes the folder “ml-region1-all-python” are for cross-validation purpose and the classifiers should not be used here? Please let me know if I understand something wrong.
Thank you very much!
Best regards,
Gaohong
takao-yThursday, July 15th, 2021 at 9:44:51 AM GMT+09:00
@gyin -san, @uwatoko san,
Thank you very much for the information. I’m sorry I forgot it. Kobayashi-san also investigated the optimal size of feature vector as you mentioned. I also forgot the cross validation from 2007 to 2020.
東上床様、rg2についても小林さんが最適値を算出されていて、Yinさんが添付の通りに実行されています。ご確認をいただけますでしょうか。2007年から2020年については交差検証をしていないためCDF用ファイルは作成していません。基本的には推定年を除いた年で学習、推定できると思いますので、作成をお願いできますでしょうか。
takao-yThursday, July 15th, 2021 at 10:04:32 AM GMT+09:00
@uwatoko さま, @gyin -san,
> started to collect all grids at the same longitude into one file
I think this is latest version for the binary data input and output. I thought you are using the latest version. If not, that’s my mistake. Could you tell me the original version for making classifiers just in case?
The latest version is in the following directory.
isotope3:/data28/yoshikane/ml-bin/ml-region1-all-python-isotope3
takao-yThursday, July 15th, 2021 at 10:14:23 AM GMT+09:00
@gyin san
Could you check the README-python.txt? If you find the sentence of “2020.10.29 T. Yoshikane” in the file, that is the latest version.
Could you check the README-python.txt? If you find the sentence of “2020.10.29 T. Yoshikane” in the file, that is the latest version.
gyinThursday, July 15th, 2021 at 2:20:00 PM GMT+09:00
@takao-y -sensei,
Thank you very much for your guidance! I will update the codes I am using to the latest version you provided and make accordingly modification (small changes such as make the lat/lon_ind as 3 digits). The codes I am using are collecting and saving training/testing data for each grid.
The codes I used to make classifiers are available on isotope3 (for sites B,D, E): /data37/gyin/classifier_2007_2020/classifier_siteX
It is also available on JAXA server for site A and C): /lebron_disk09/gyin/siteX_MM
Can I confirm that should I run the cross-validation for 2007-2020 or not? Or you are asking Higashiuwatoko-san to run it? (I tried to translate the Japanese using google translate but not sure whether I understood it correctly. I am sorry for the inconvenience)
Thank you very much!
Best regards,
Gaohong
takao-yThursday, July 15th, 2021 at 2:38:59 PM GMT+09:00
@gyin san, @uwatoko -san
Thank you very much for your reply. I understood the situation.
Higashiuwatoko-san, could you tell us your(s) opinion about the cross validation data (for CDF) from 2007 to 2020? Should we share the task? In my opinion, thinking about the future, I would like you (RESTEC members) to be familiar with the task because the task will need to conduct the forecast operation.
takao-yThursday, July 22nd, 2021 at 12:57:35 PM GMT+09:00
@uwatoko様
問題は解決されましたでしょうか。あと、CDFのための推定値作成についてご意見いただければ幸いです。よろしくお願いいたします。
問題は解決されましたでしょうか。あと、CDFのための推定値作成についてご意見いただければ幸いです。よろしくお願いいたします。
uwatokoWednesday, July 14th, 2021 at 11:57:35 AM GMT+09:00
@takao-y 先生
追加情報です。
現在siteDおよびsiteEの推定処理(step02-mltest.sh)を実行した際に
predictedY1 = clf.predict(X)で
AttributeError: 'SVR' object has no attribute 'probA'
のエラーになる原因を調べています。
試しにsiteDのMSMデータに対してsiteAの識別器を読み込ませたところ、
predictedY1 = clf.predict(X)でエラーとならず、推定結果が出力されました。
同様にsiteEのMSMデータに対してもsiteAの識別器を読み込ませると推定結果が出力されました。
逆にsiteAのMSMデータに対してsiteDやsiteEの識別器を読み込ませると
predictedY1 = clf.predict(X)でエラーとなってしまいます。
この事からsiteD/siteEの識別器に問題があるのではないかと考えています。
siteD/siteEの識別器が正常に作成されているか、ご確認頂けないでしょうか。
追加情報です。
現在siteDおよびsiteEの推定処理(step02-mltest.sh)を実行した際に
predictedY1 = clf.predict(X)で
AttributeError: 'SVR' object has no attribute 'probA'
のエラーになる原因を調べています。
試しにsiteDのMSMデータに対してsiteAの識別器を読み込ませたところ、
predictedY1 = clf.predict(X)でエラーとならず、推定結果が出力されました。
同様にsiteEのMSMデータに対してもsiteAの識別器を読み込ませると推定結果が出力されました。
逆にsiteAのMSMデータに対してsiteDやsiteEの識別器を読み込ませると
predictedY1 = clf.predict(X)でエラーとなってしまいます。
この事からsiteD/siteEの識別器に問題があるのではないかと考えています。
siteD/siteEの識別器が正常に作成されているか、ご確認頂けないでしょうか。
takao-yFriday, July 30th, 2021 at 2:49:32 PM GMT+09:00
@uwatoko さま
お疲れ様です。スレッドにも記載したのですが、問題は解決されましたでしょうか。私も小林さんがrgの最適値を調査してくださったのをすっかり忘れていました。siteD/siteEではrgを変更して使用することになると思います。詳細はYinさんが添付されたファイルをご確認いただければと思います。
あと,CDFのための推定値作成についてはどうしましょうか。個人的には、今後のことも含めてRESTECさんに作成していただいた方が良いかと思いますが、もし大変そうなら東大側でも手伝います。よろしくお願いいたします。
お疲れ様です。スレッドにも記載したのですが、問題は解決されましたでしょうか。私も小林さんがrgの最適値を調査してくださったのをすっかり忘れていました。siteD/siteEではrgを変更して使用することになると思います。詳細はYinさんが添付されたファイルをご確認いただければと思います。
あと,CDFのための推定値作成についてはどうしましょうか。個人的には、今後のことも含めてRESTECさんに作成していただいた方が良いかと思いますが、もし大変そうなら東大側でも手伝います。よろしくお願いいたします。
uwatokoMonday, August 2nd, 2021 at 2:45:25 PM GMT+09:00
@Takao Yoshikane 先生
返事が遅くなって申し訳ございません。
情報ありがとうございます。スレッドを見て、現在こちらで確認中です。
CDFのための推定値作成も同様な問題かと思い、こちらも現在確認中です。
また、ヘルプが必要になりましたら、お願いすると思います。
返事が遅くなって申し訳ございません。
情報ありがとうございます。スレッドを見て、現在こちらで確認中です。
CDFのための推定値作成も同様な問題かと思い、こちらも現在確認中です。
また、ヘルプが必要になりましたら、お願いすると思います。
takao-yWednesday, August 4th, 2021 at 11:01:01 AM GMT+09:00
ご連絡ありがとうございます。
CDFのための推定値については、検証を含めて、こちらでもYinさんに実施していただいています。ただ、できればRESTECさんの方でも実施していただければ作業時間は短縮できますし、今後更新のために推定値を作成する場合もスムーズに実施できるかと思います。
よろしくお願いいたします。
CDFのための推定値については、検証を含めて、こちらでもYinさんに実施していただいています。ただ、できればRESTECさんの方でも実施していただければ作業時間は短縮できますし、今後更新のために推定値を作成する場合もスムーズに実施できるかと思います。
よろしくお願いいたします。
uwatokoThursday, August 5th, 2021 at 10:30:38 PM GMT+09:00

@Takao Yoshikane 先生
合わせられるものはすべて合わしたつもりですが、siteDとsiteEが動作しないです。
設定ファイルとエラーについてまとめました。ご確認いただけますでしょうか。
「scikit-learn のバージョンが合っていない」というようなエラーが出ております。
すみませんが、そちらで使っているscikit-learn等のライブラリーのバージョンを
教えていただけないでしょうか。
宜しくお願いします。
合わせられるものはすべて合わしたつもりですが、siteDとsiteEが動作しないです。
設定ファイルとエラーについてまとめました。ご確認いただけますでしょうか。
「scikit-learn のバージョンが合っていない」というようなエラーが出ております。
すみませんが、そちらで使っているscikit-learn等のライブラリーのバージョンを
教えていただけないでしょうか。
宜しくお願いします。
takao-ySaturday, August 7th, 2021 at 1:43:16 PM GMT+09:00
@gyin @uwatoko
It seems that Higashiuwatoko-san still have problem with execution of ML (scikit-learn version error?). I think you have the ML codes, which can operate normally on JAXA’s server. Could you please provide your setting (codes) to Higashiuwatoko-san? May be we should use common codes to run the ML system smoothly.
It seems that Higashiuwatoko-san still have problem with execution of ML (scikit-learn version error?). I think you have the ML codes, which can operate normally on JAXA’s server. Could you please provide your setting (codes) to Higashiuwatoko-san? May be we should use common codes to run the ML system smoothly.
gyinSaturday, August 7th, 2021 at 3:08:11 PM GMT+09:00
Dear @takao-y -sensei, @uwatoko -san
I have attached the code I used for 39 hour forecast (39_hr_fcst_v1.zip), I did not run for sites D and E yet, but it works well for site C. This version of codes should fit the classifiers I generated before (note: need to change 1) path based on where you put classifiers and the 39 hour forecast data and 2) parameter setting based on site and month in the code).
Recently, I updated my 39hr forecast codes based on Yoshikane-sensei’s codes (39_hr_fcst_v2.zip). Because the files are saved in a different format, if Higashiuwatoko-san is using that code, it may have version related error so that cannot read classifier correctly. In the updated version, subfolder “new_step1_cross” is used for cross-validation run, and subfolder “new_step2_39hr” is for generating classifier and run 39 hour forecast.
(1) If the “39_hr_fcst_v1” code does not work, could you share a little more of the error message and I will try to find out the problem.
(2) Another way is to shift to “39_hr_fcst_v2", which is the version that I will use afterwards. This version is pretty fast and it took ~2hr to generate classifier for each month using data from 2007-2019 with rg=10 (on isotope3, JAXA server recently is a little slow). You can run the code to generate the classifiers or I can prepare it if needed.
I am sorry for making the process complicated. Please let me know if any further information or action is needed. Thank you!
Best regards,
Gaohong
gyinSaturday, August 7th, 2021 at 3:08:41 PM GMT+09:00
Sorry, forgot to attach the codes.
takao-ySunday, August 8th, 2021 at 8:45:54 PM GMT+09:00
@uwatoko さま@gyin san
Yin-san: Thank you very much!
東上床様:
私のコードで作成した識別器ファイルは形式がやや異なるようです。Yinさんのコードを使って試していただけますでしょうか。
Yin-san: Thank you very much!
東上床様:
私のコードで作成した識別器ファイルは形式がやや異なるようです。Yinさんのコードを使って試していただけますでしょうか。
rkanekoWednesday, August 11th, 2021 at 3:25:07 PM GMT+09:00
【Solution of SVR Error】
I found the same question on stack overflow about SVR's attribution error.
According to that, the error happens when the scikit-learn version is different between the training process and the prediction process.
【About Cross-Validation for time series data】
For your reference:
As cross-validation (CV) for time series data, I think "Expanded window CV," "sliding window CV," and "Nested CV" are famous in the field of machine learning. As Yoshimura-sensei mentioned, the basic idea is to predict the future with a model learned using past data.
Maybe "expanding window" is the same way that Yoshimura-sensei mentioned.
This article which is about Nested CV, also might help you.
おつかれさまです。
既にご存じかもしれませんが、ご参考になれば幸いです。
gyinWednesday, August 11th, 2021 at 11:14:34 PM GMT+09:00
Great thanks for the information! I will check it out.
takao-yThursday, August 12th, 2021 at 1:21:42 PM GMT+09:00
@rkaneko-san @gyin-san,
Thank you very much for the valuable information!
Thank you very much for the valuable information!
rkanekoThursday, August 12th, 2021 at 1:44:29 PM GMT+09:00
@takao-y Most welcome!
gyinThursday, August 12th, 2021 at 11:56:48 AM GMT+09:00
Dear @takao-y -sensei, @uwatoko -san,
I have checked the SVR issue on JAXA server. As indicated by Kaneko-san, it is due to the scikit-learn version difference.
Because the JAXA server (zico-n) was a little slow, I generated classifiers for site D (all 12 months), E (all 12 months), and site B (month 1-4, 7-9) on isotope3. I found these classifiers work on isotope3 but not on zico-n. For those classifiers generated on zico-n (for sites A, C, and some months for siteB), they work on zico-n. I am sorry for causing this problem.
To solve this problem, I have several possible options.
(1) Using the old version of code and re-run classifiers for sites D, E, and some months of B on zico-n; (using all hours as training data)
(2) Using the new version of code and re-run classifiers for all sites and all months on zico-n; (using all hours as training data)
(3) Using the new version of code and re-run classifiers for all sites and all months on zico-n; (using every 3 hour as training data)
Below is some information of how previous classifiers were generated:
• the old version of code
• 2007-2020 as training data
• used all hour data (i.e., when making training data, used all hours — first three hour forecasts, instead of every 3 hour), which makes the classifier generating process much slower
I am sorry that I did not notice the package version problem before. I think option (3) would be the fastest way to recover all things and better accommodate future demands. May I have your opinion on this? Thank you very much!
Best regards,
Gaohong
takao-yThursday, August 12th, 2021 at 1:20:36 PM GMT+09:00
@gyin san, @uwatoko さま
Thank you very much for the information!
I agree to your opinion (The option 3 would be best for now.) Higashiuwatoko-san, What do you think?
東上床様
Yinさんのご提案通り、3時間毎のデータ(解析値)を使って学習して識別器を作成するのが良いかと思いますが、いかがでしょうか。
Thank you very much for the information!
I agree to your opinion (The option 3 would be best for now.) Higashiuwatoko-san, What do you think?
東上床様
Yinさんのご提案通り、3時間毎のデータ(解析値)を使って学習して識別器を作成するのが良いかと思いますが、いかがでしょうか。
uwatokoThursday, August 12th, 2021 at 1:42:36 PM GMT+09:00
@takao-y さん、@gyinさん
私の理解が正しいかを確認させてください。
今回の動作しない事象を簡単にいうとscikit-learnのバージョンの違いである。
そこで、今後の作業のご提案が、(3)の方法である。
(3)のご提案を実行するには、
まず、こちらのJAXA server (zico-n)のscikit-learnのバージョンをあげる。
前回頂いたGaohongさんのコードを使って動かす。
ここからが、理解がまだできてないのですが、今頂いてる分類器はそのまま使用なのか、
それとも新規に作成する必要があるのかというところです。
私の理解が正しいかを確認させてください。
今回の動作しない事象を簡単にいうとscikit-learnのバージョンの違いである。
そこで、今後の作業のご提案が、(3)の方法である。
(3)のご提案を実行するには、
まず、こちらのJAXA server (zico-n)のscikit-learnのバージョンをあげる。
前回頂いたGaohongさんのコードを使って動かす。
ここからが、理解がまだできてないのですが、今頂いてる分類器はそのまま使用なのか、
それとも新規に作成する必要があるのかというところです。
takao-yThursday, August 12th, 2021 at 1:47:57 PM GMT+09:00
@uwatoko さま、@gyin san
Yinさんの(3)ご提案では、3時間毎のデータを使って識別器を新規で作り直すことになると思います。以前は1時間値を使って作成していたため時間がかかっていましたが、3時間ごとのデータを用いることにより作業時間の大幅の短縮ができると思われます。
Yinさんの(3)ご提案では、3時間毎のデータを使って識別器を新規で作り直すことになると思います。以前は1時間値を使って作成していたため時間がかかっていましたが、3時間ごとのデータを用いることにより作業時間の大幅の短縮ができると思われます。
uwatokoThursday, August 12th, 2021 at 2:02:11 PM GMT+09:00
@takao-y さん、@gyinさん
入力を1時間ではなく、3時間ごとのデータとするの識別器を新規に作成する
ということでよろしいでしょうか。
入力を1時間ではなく、3時間ごとのデータとするの識別器を新規に作成する
ということでよろしいでしょうか。
takao-yThursday, August 12th, 2021 at 2:02:43 PM GMT+09:00
@uwatoko さま@gyin
そうです。
そうです。
takao-yThursday, August 12th, 2021 at 2:03:43 PM GMT+09:00
@uwatoko さま、@gyin san
Yinさんのご提案(3)に対してご意見いただければ幸いです。
Yinさんのご提案(3)に対してご意見いただければ幸いです。
uwatokoThursday, August 12th, 2021 at 2:24:09 PM GMT+09:00
@takao-y さん、@gyinさん
まず、ちょっとこちらで出来るかどうかをまず確認します。
処理時間等を見ながら、調整させてください。
まず、ちょっとこちらで出来るかどうかをまず確認します。
処理時間等を見ながら、調整させてください。
takao-yThursday, August 12th, 2021 at 2:30:16 PM GMT+09:00
@uwatoko さま@gyin san
差し当たり、2007年~2020年のデータを用いた識別器の作成はYinさんに実施していただけると思いますが、定常運用を考えるとRESTECさん側でも実施可能な状況にしていただいた方が良いかなと考えています。これは、CDFtのための推定値作成も同様なのですが。ご連絡お待ちしております。
差し当たり、2007年~2020年のデータを用いた識別器の作成はYinさんに実施していただけると思いますが、定常運用を考えるとRESTECさん側でも実施可能な状況にしていただいた方が良いかなと考えています。これは、CDFtのための推定値作成も同様なのですが。ご連絡お待ちしております。
gyinThursday, August 12th, 2021 at 3:48:22 PM GMT+09:00
@takao-y -sensei, @uwatoko -san,
The previous “39hr_fcst_v2” code was set for generating classifiers using data from 2007-2019, and run 39 hour forecast for 2020.
I now updated it for real operation purpose, i.e., generate classifier using data from 2007-2020, and also run cross-validation for 2007-2020 to prepare for CDF/CDFt. You can find the updated code here:
/lebron_disk09/gyin/39hr_fcst/39hr_fcst_2007_2020
For generating classifiers, just need to run the code under “/new_step2_39hr/auto-step01.sh” (change site, month, and hyperparameter values).
For running cross-validation, just need to run the code “/new_step1_cross/auto-allgrid.sh” (also change site, month, and hyperparameter values).
I think with this code, we can reproduce the classifiers easily. Please let me know if you found any problem with this code. Thank you very much!
Best regards,
Gaohong
uwatokoThursday, August 12th, 2021 at 3:55:21 PM GMT+09:00
@gyin-san,
Please let me know what version of scikit-learn you are using.
Please let me know what version of scikit-learn you are using.
gyinThursday, August 12th, 2021 at 5:27:58 PM GMT+09:00
@uwatoko -san,
I didn’t specify the scikit-learn version. I think that is based on the package installed on zico-n and isotope3. So if we consistent run the code on zico-n, there should be no problem.
Since the error message is “Trying to unpickle estimator SVR from version 0.23.1 when using version 0.22.2.post1.” I think maybe the version on zico-n is 0.22.2 while on isotope is 0.23.1? But I am not sure about this.
Best regards,
Gaohong
uwatokoThursday, August 12th, 2021 at 5:58:13 PM GMT+09:00
@gyin-san,
Thank you for your answer, the SVR version is the key. I understand.
I'll check it out now.
Thank you for your answer, the SVR version is the key. I understand.
I'll check it out now.
keiyoshi08Thursday, August 12th, 2021 at 8:39:48 PM GMT+09:00
@gyin @uwatoko @takao-y
I’m sorry that I haven’t followed.
Is there any compromise by adopting option 3)? If no obvious bad impact in the performance, it’d be good option.
I’m sorry that I haven’t followed.
Is there any compromise by adopting option 3)? If no obvious bad impact in the performance, it’d be good option.
gyinFriday, August 13th, 2021 at 11:21:44 AM GMT+09:00
@keiyoshi08 -sensei, @takao-y -sensei, @uwatoko -san,
In my opinion, I do not see obvious compromise although using every three hour reduced the training data size. But by using every 3 hour, it is actually using the first hour forecast of the 39 hour forecast time series. If we use every hour as training data, that is a mixed performance of the first three hour forecast of the 39 hour forecast time series. (I am not sure if I describe this clearly)
Based on this, I think it would be okay to use option 3). I think can do a test to compare the estimation accuracy acquired by using every 3 hour and every hour as training data.
Best regards,
Gaohong
uwatokoMonday, August 16th, 2021 at 10:02:05 AM GMT+09:00
@takao-y さん、@gyinさん
scikit-learn の最新バージョン(0.24.2) をインストールして推定処理を
実施した結果、siteD/Eについては正常に動作し、siteA-Cについては
アトリビュートエラーになる事(想定どおり)を確認いたしました。
@keiyoshi08先生、@takao-y さん、@gyinさん、@yamamoto.kosuke さん、
誠に申し訳ございませんが、作業方針に関しては、こちらでは判断
できませんので、ご検討いただければと思います。
scikit-learn の最新バージョン(0.24.2) をインストールして推定処理を
実施した結果、siteD/Eについては正常に動作し、siteA-Cについては
アトリビュートエラーになる事(想定どおり)を確認いたしました。
@keiyoshi08先生、@takao-y さん、@gyinさん、@yamamoto.kosuke さん、
誠に申し訳ございませんが、作業方針に関しては、こちらでは判断
できませんので、ご検討いただければと思います。
keiyoshi08Tuesday, August 17th, 2021 at 1:15:38 AM GMT+09:00
Thanks Gaohong. I probably understood you. Your concern is derived from the fact that the skills of 1st hour, 2nd hour and 3rd hour are not the same. So there might be inconsistency and contamination. Whereas in 3-hourly version, only the 1st hour is trained, so the skill is consistent and the classifier would perform as if the 1st hour forecast is given for all the 39 hours. I agree with you.
Well, then, since there is no obvious degradation by reducing the training data, let’s adopt the 3) option.
というわけで、3)で良いと思います。
Well, then, since there is no obvious degradation by reducing the training data, let’s adopt the 3) option.
というわけで、3)で良いと思います。
uwatokoTuesday, August 17th, 2021 at 1:50:15 PM GMT+09:00
@keiyoshi08 先生、@takao-y さん、@gyinさん、@yamamoto.kosuke さん、
ありがとうございます。了解しました。
これでシステムを検討したいと思います。
ありがとうございます。了解しました。
これでシステムを検討したいと思います。
takao-yTuesday, August 17th, 2021 at 3:52:20 PM GMT+09:00
@uwatoko さま
ありがとうございます。
よろしくお願いいたします。
ありがとうございます。
よろしくお願いいたします。
gyinWednesday, August 18th, 2021 at 1:03:02 PM GMT+09:00
@uwatoko -san, @takao-y -sensei,
Thank you for the information!
I understood that the SVR version on zico-n was updated to 0.24.2. I am wondering if it is possible to make both the previous version (0.22.2) and the new version (0.24.2) work?
I think because of the update, the previously generated classifiers (not related to the classifiers I provided to you, but something else I ran for evaluation purpose) does not work under the current environment now.
I wonder if there is anyway to specify the SVR version? If no, that is okay, and I will just try to re-run the classifiers. Thank you very much!
Best regards,
Gaohong
takao-yWednesday, August 18th, 2021 at 5:25:12 PM GMT+09:00
@gyin san, @uwatoko san
Thank you for your inquiry. Higashiuwatoko-san, Could you check the version dependency of SVR? Thank you.
Thank you for your inquiry. Higashiuwatoko-san, Could you check the version dependency of SVR? Thank you.
gyinSunday, October 3rd, 2021 at 10:40:57 PM GMT+09:00
@uwatoko -san, @takao-y -sensei,
Please find the attached python version code for 39hour forecast. The code logic is the same as before. The main differences include:
(1) under-sampling was used in preparing training data (additional package “imblearn” is required)
(2) results are saved as netcdf format (additional package “netCDF4" is required)
I attached a ReadMe file to describe the codes briefly. Please let me know if you found any problem/bug with the code. Thank you very much!
takao-yWednesday, October 6th, 2021 at 1:05:59 PM GMT+09:00
@gyin -san, Thank you very much!
uwatokoWednesday, October 6th, 2021 at 1:31:01 PM GMT+09:00
@gyin -san,
Thank you very much.
I've got the program and will check it out.
If I have any questions, I will ask.
Thank you very much.
I've got the program and will check it out.
If I have any questions, I will ask.
uwatokoTuesday, October 12th, 2021 at 10:29:13 AM GMT+09:00
@takao-y先生、@gyin 様
早速ですが、教えてください。
頂いたプログラムでは、rg=12,nums=625,gm=0.000005,c2=4,ep=0.001の値を
設定していますが、これらの値はsiteや月で変えないのでしょうか。
変える場合、site毎、月毎に設定する値を教えて頂けないでしょうか。
よろしくお願い致します。
早速ですが、教えてください。
頂いたプログラムでは、rg=12,nums=625,gm=0.000005,c2=4,ep=0.001の値を
設定していますが、これらの値はsiteや月で変えないのでしょうか。
変える場合、site毎、月毎に設定する値を教えて頂けないでしょうか。
よろしくお願い致します。
gyinTuesday, October 12th, 2021 at 12:35:16 PM GMT+09:00
@uwatoko -san, @takao-y -sensei,
I changed the hyper-parameters for each site and month based on the values provided by Kobayashi-san before (you can find the the excel sheets under the thread message on July 12). But Yoshikane-sensei seems mentioned using constant parameters before. Therefore I am not sure about that and may need the confirmation from Yoshikane-sensei.
Best regards,
Gaohong
takao-yTuesday, October 12th, 2021 at 3:43:17 PM GMT+09:00
@uwatoko san, @gyin san,
please change the values to the ones estimated by Kobayashi-san. The areas are a little different, but I think we can use the same values for similar corresponding areas.
please change the values to the ones estimated by Kobayashi-san. The areas are a little different, but I think we can use the same values for similar corresponding areas.
uwatokoWednesday, October 13th, 2021 at 8:51:03 PM GMT+09:00
@takao-y先生、@gyin 様
サイト毎、時期毎で値を変えることについて、了解しました。
確認なのですが、1月、4月、7月、10月と4時期にありますが、
その間は、12月と2月は、1月の値を使い、3月と5月は4月の値を使うという
感じでよろしいでしょうか。
サイト毎、時期毎で値を変えることについて、了解しました。
確認なのですが、1月、4月、7月、10月と4時期にありますが、
その間は、12月と2月は、1月の値を使い、3月と5月は4月の値を使うという
感じでよろしいでしょうか。
takao-yThursday, October 14th, 2021 at 9:20:01 AM GMT+09:00
@uwatoko 様 はい。計画ではそのようになっていたと思います。よろしくお願いいたします。
takao-yTuesday, October 26th, 2021 at 3:00:06 PM GMT+09:00
Microsoft Teamsの起動に時間がかかっているようです。
少し遅れます。
少し遅れます。
takao-yTuesday, October 26th, 2021 at 4:52:21 PM GMT+09:00

GSMaPの補足資料を添付します。長期平均を見ても地形性降水の再現性が良いとは言えず、全体的に過小評価になっています。(P1:左上図)
yamamoto.kosukeWednesday, October 27th, 2021 at 11:18:16 AM GMT+09:00
情報ありがとうございます。地形降雨の改良についてはGSMaPチームも問題意識をもっていて、以下のような改良がなされていますが、まだ不十分な部分も多いことは確かです。
https://journals.ametsoc.org/view/journals/apme/56/9/jamc-d-16-0332.1.xml
打合せでもありました通り、ひとまずGSMaP_gauge(以下参考)を利用していただければと思います。
https://sharaku.eorc.jaxa.jp/GSMaP/faq/GSMaP_faq06_j.html
また、打合せでおっしゃっていた千葉大広瀬さんの機械学習を用いたGSMaP補正は以下でしょうか。広瀬さんは現在JAXA招聘職員として、EORCのGPMチームで一緒に働いています。
https://www.jstage.jst.go.jp/article/jmsj/advpub/0/advpub_2019-040/_article/-char/ja/
takao-yWednesday, October 27th, 2021 at 9:28:45 PM GMT+09:00
情報ありがとうございます。期待しています。個人的には、雲の組織的な動きのパターンから地形性降水を推定可能ではないかと考えています。局所的に見ると風などの影響を受けて雨域と雲域が一致しないのですが、擾乱の全体的な動きと観測降水(解析雨量)が関係していれば、補正は可能ではないかと考えています。観測値同士なのでうまくいきそうな気もするのですが。
takao-yFriday, October 29th, 2021 at 9:57:08 AM GMT+09:00

かなり以前に実施した実験ですが、MTSAT-IR1から降水推定を試みています。地形性降水がそれなりに推定されています。
パラメータ設定やIR1データの欠測処理が甘く、一部学習データが不適切になっていることやCDFを適用していないため、今のシステムに置き換えればもう少し精度向上できると思います。ご参考まで。 GSMaPの精度向上に役立てば幸いです。
パラメータ設定やIR1データの欠測処理が甘く、一部学習データが不適切になっていることやCDFを適用していないため、今のシステムに置き換えればもう少し精度向上できると思います。ご参考まで。 GSMaPの精度向上に役立てば幸いです。
gyinTuesday, November 30th, 2021 at 4:04:19 PM GMT+09:00
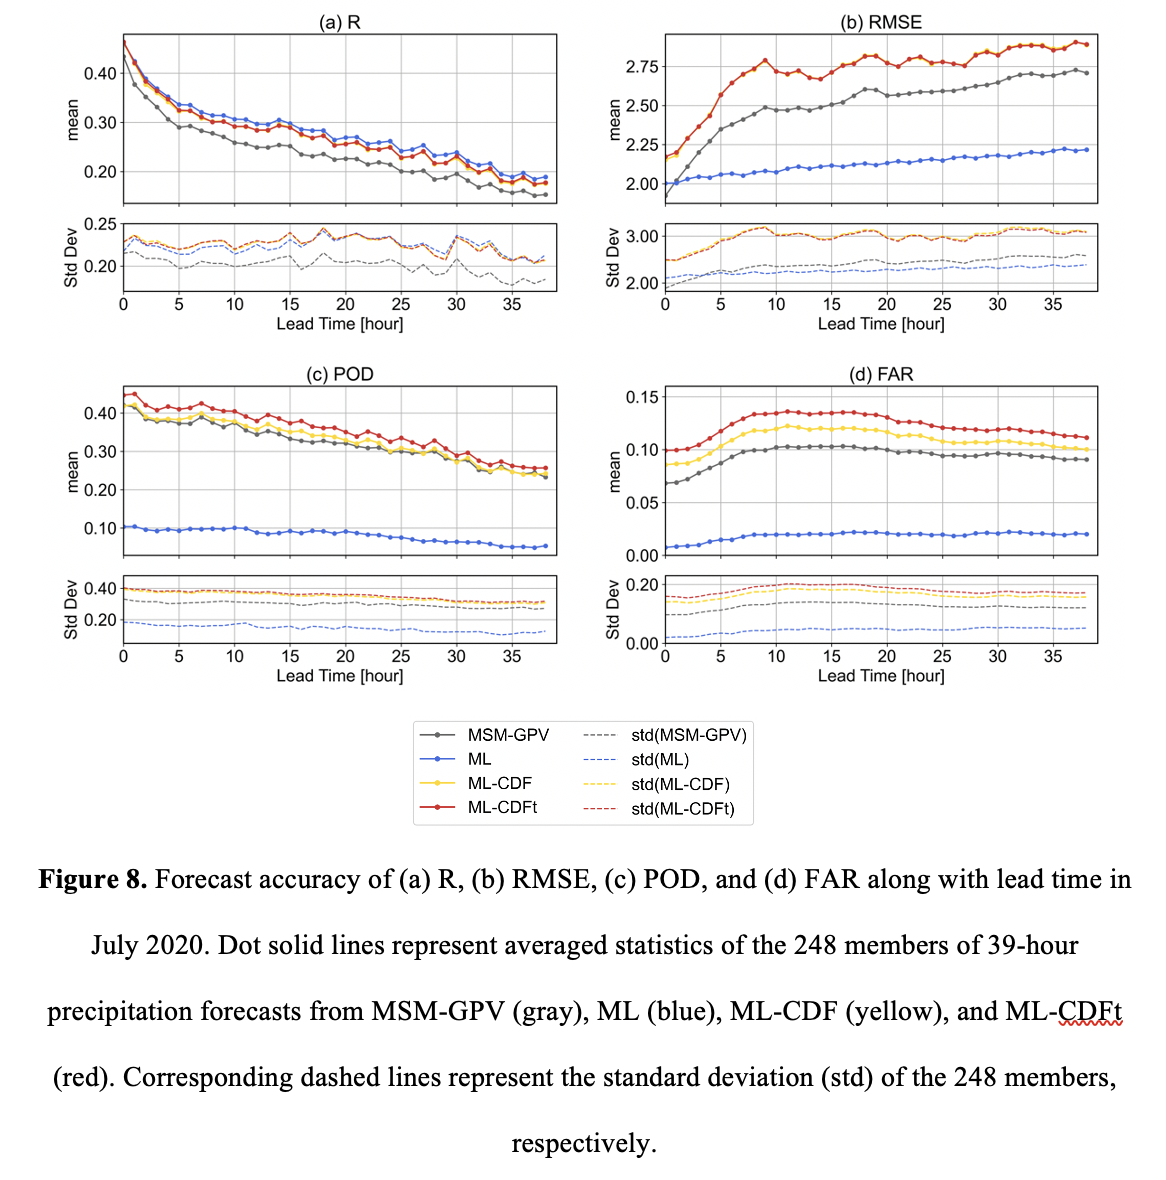

Results for 39-hour forecast accuracy, and extreme precipitation analysis (siteC).
yamamoto.kosukeFriday, December 3rd, 2021 at 7:45:53 PM GMT+09:00
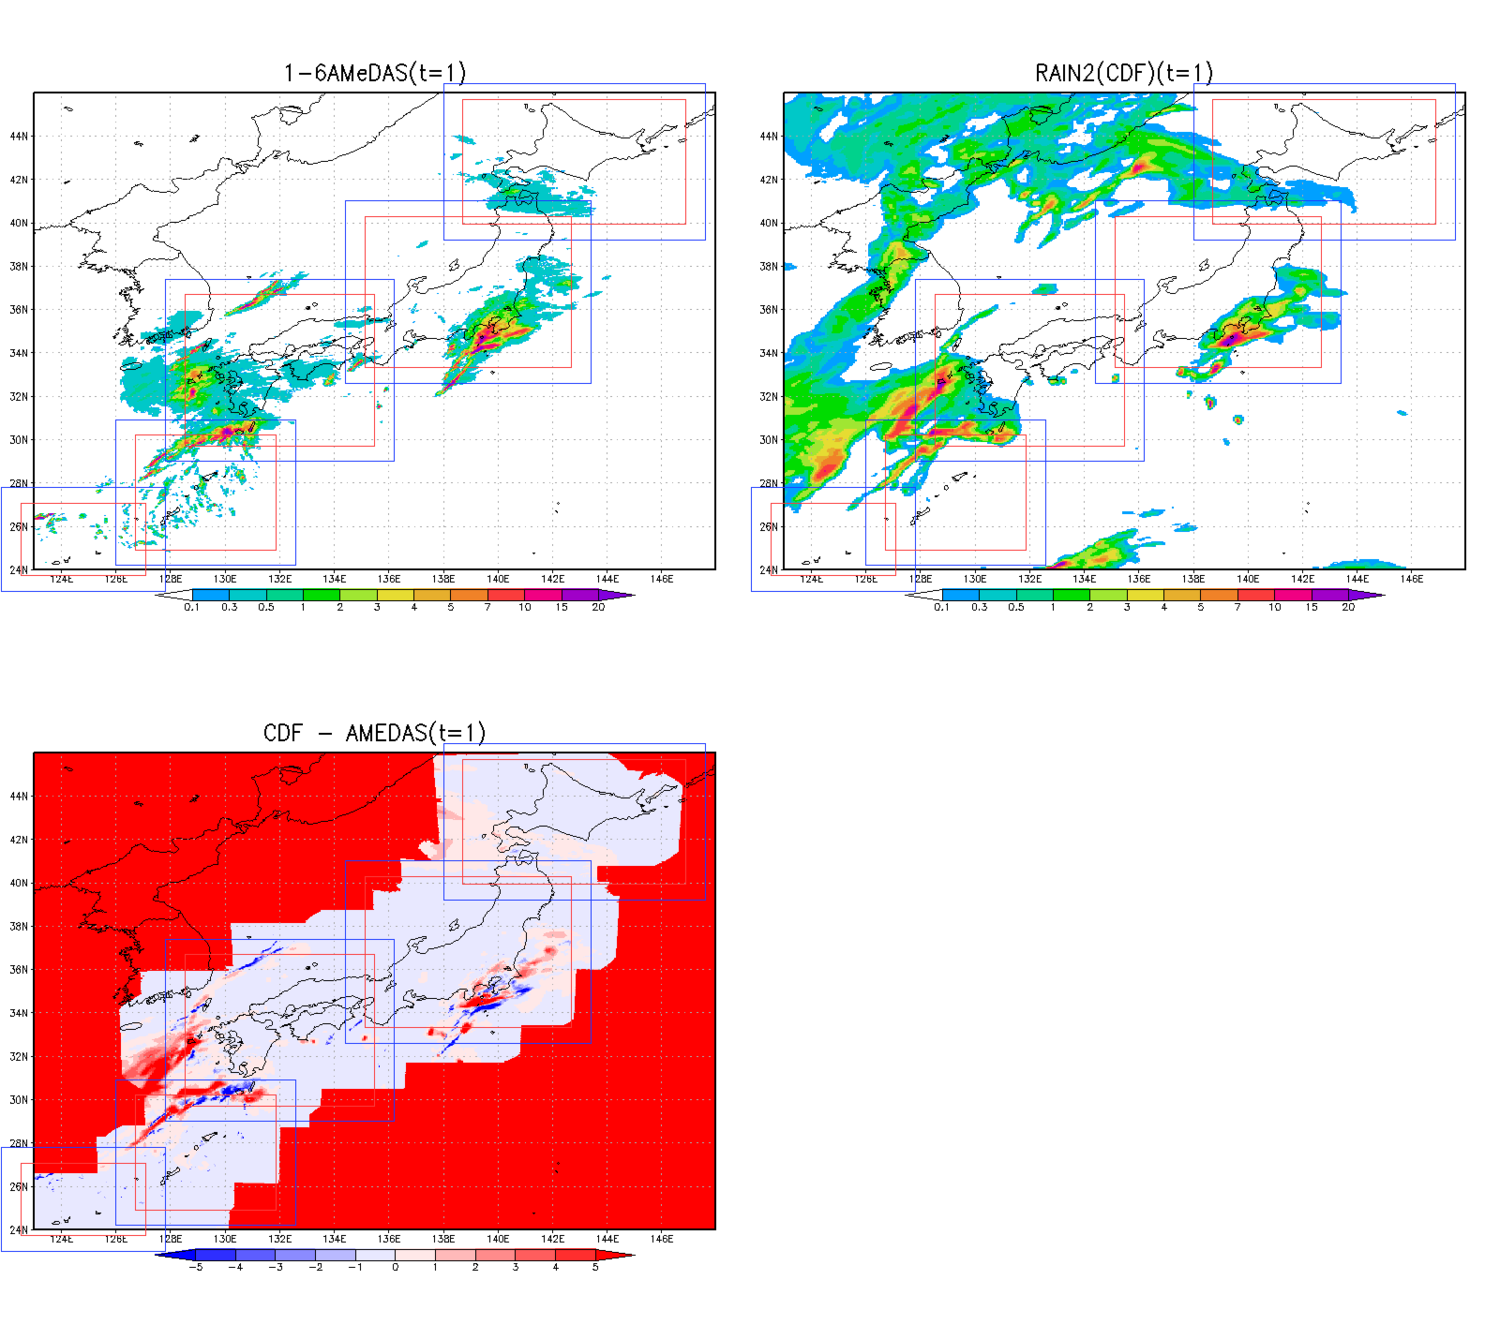
@keiyoshi08 先生
TE-Jでのリアルタイムまでのレーダアメダス利用ですが、機械学習補正雨量の時のように、MSMをベースにレーダ観測域のみ差し替える方針で良いでしょうか?
添付左下のように領域外は欠損とするか、それとも添付右上の機械学習補正時のように当該領域のみ置き換えるかを@uwatoko さんと話していました。
見かけだけの問題で、置き換えると境界がやや不連続にはなると思いますが、アジアを含めた雨域の全体構造をの内のどの辺がレーダによって高精度になっているのかが分かるほうが良いかと個人的には思いました。
TE-Jでのリアルタイムまでのレーダアメダス利用ですが、機械学習補正雨量の時のように、MSMをベースにレーダ観測域のみ差し替える方針で良いでしょうか?
添付左下のように領域外は欠損とするか、それとも添付右上の機械学習補正時のように当該領域のみ置き換えるかを@uwatoko さんと話していました。
見かけだけの問題で、置き換えると境界がやや不連続にはなると思いますが、アジアを含めた雨域の全体構造をの内のどの辺がレーダによって高精度になっているのかが分かるほうが良いかと個人的には思いました。
keiyoshi08Friday, December 3rd, 2021 at 8:14:15 PM GMT+09:00
@yamamoto.kosuke さま、欠損をMSMで補間するのが良いと思います!
ひと手間は増えてしまいますがよろしくおねがいします。
ひと手間は増えてしまいますがよろしくおねがいします。
yamamoto.kosukeFriday, December 3rd, 2021 at 8:18:49 PM GMT+09:00
@keiyoshi08 先生、早速ありがとうございます。
@uwatoko さま、上記方針でよろしくお願いします!
@uwatoko さま、上記方針でよろしくお願いします!
takao-ySaturday, December 4th, 2021 at 9:25:17 AM GMT+09:00
@uwatoko -san, @gyin -san, Regarding the conversion to CDFt, how is the progress? Basically, I think you can convert it by just replacing the shell program with one for CDFt. Please let me know if you have any problems.
gyinTuesday, December 7th, 2021 at 11:36:02 AM GMT+09:00
@takao-y -sensei, @uwatoko -san
I am sorry for the late reply.
Please find the attached file for the updated codes.
(1) I added the R codes for CDFt as “step4_39hr_cdft.R”. To run the code, required packages in R are “CDFt”, “ncdf4”, and “abind”.
(2) I made slight change in the “step4_39hr_cdf.py” code. It should not influence mlcdf results, but corrected potential errors in the svm saving process.
(3) Explanation of the updates were added to the “ReadMe” file, please check it.
Please let me know if you have any problem or find any mistake in the codes. Thank you so much!
uwatokoTuesday, December 7th, 2021 at 9:51:13 PM GMT+09:00
@gyin-san,@takao-y -sensei,
Thank you for submitting the code that includes the R functions.
I will check it as soon as possible.
If there are any problems, I will contact you.
Thank you for submitting the code that includes the R functions.
I will check it as soon as possible.
If there are any problems, I will contact you.
uwatokoThursday, December 9th, 2021 at 5:13:30 PM GMT+09:00
@gyin-san,@takao-y -sensei,
I am checking the operation of the R program, and when I execute
the process of siteA or siteB, I get the following error.
If you run siteA or siteB, you will get an error message as shown below.
siteC to siteE will terminate normally without error.
----------------- Error messages for siteA/siteB ---------
[1] "processing 2021112115"
Error in CDFt(obs_data, svm_data, com_svm, dev = 0):
In CDFt, dev must be higher
------------------------------------------------------------------
I am currently specifying dev=0, but could you please check
if the value of dev needs to be changed for each site?
To test this, I ran it with dev=100 and got an error, and
ran it with dev=1000 and it succeeded.
uwatokoThursday, December 9th, 2021 at 5:24:54 PM GMT+09:00
@gyin-san,@takao-y -sensei,
The directory where the R program (step4_39hr_cdft.R) is being tested is as follows.
gaga:/lebron_disk09/GPM/AI_GSMaP/program/fcst_code_python_eorc2
The step4_39hr_cdft.R program is modified to work for each site as follows.
S4_39hr_cdft_tA.R (for siteA)
S4_39hr_cdft_tB.R (for siteB)
S4_39hr_cdft_tC.R (for siteC)
S4_39hr_cdft_tD.R (for siteD)
S4_39hr_cdft_tE.R (for siteE)
The program is started as follows.
/export/trmm5/tool/RHEL8/gnu/R-3.6.3/bin/R --vanilla --no-slave < S4_39hr_cdft_tA.R
gyinThursday, December 9th, 2021 at 5:25:08 PM GMT+09:00
@uwatoko -san,
I basically set the dev=0 following Yoshikane-sensei’s setting.
I met similar error while I was writing the code, and I found that among “obs_data”, “svm_data”, “svm_val”, when any of them showed all zeros or having NaN, such error occurred. Therefore, I added the “if” condition.
“if (length(obs_data)==0 || length(svm_data)==0 || length(val_svm)==0 || sum(svm_data,na.rm=TRUE)==0 || sum(obs_data,na.rm=TRUE)==0 || sum(val_svm,na.rm=TRUE)==0 )”
Could you please check at which grid (ilat, ilon) this error occurred, and are the data showing similar issue (all zeros, NaN) but I didn’t considered in the if statement first?
I am sorry for the inconvenience. Please let me know if that is not the cause.
gyinThursday, December 9th, 2021 at 5:26:12 PM GMT+09:00
Thank you for the path information. I will try to check it and get you back as soon as possible!
gyinThursday, December 9th, 2021 at 7:08:09 PM GMT+09:00
@uwatoko -san,
Could you please try this updated code.
I think the error is because of at grid (132, 97), although “obs_data” data size is large, there is only one non-zero value, which makes the CDFt do not work.
Therefore, I modified the if condition to now as:
if (sum(obs_data>0,na.rm=TRUE)<10 || sum(svm_data>0,na.rm=TRUE)<10 || length(val_svm)==0 || sum(val_svm,na.rm=TRUE)==0 )
When the non-zero values are too less, the CDFt will not be conducted. Please let me know if there is still problem with running the code.
Best regards,
Gaohong
uwatokoFriday, December 10th, 2021 at 2:38:58 PM GMT+09:00
@gyin-san,@takao-y -sensei,
When I ran the code you gave me, siteA terminated normally.
However, when I tried to run siteB with the same modification, siteB had the same error as yesterday.
1] "processing 2021112115"
Error in CDFt(obs_data, svm_data, com_svm, dev = 0):
In CDFt, dev must be higher
Execution has been halted.
When I ran the code you gave me, siteA terminated normally.
However, when I tried to run siteB with the same modification, siteB had the same error as yesterday.
1] "processing 2021112115"
Error in CDFt(obs_data, svm_data, com_svm, dev = 0):
In CDFt, dev must be higher
Execution has been halted.
gyinFriday, December 10th, 2021 at 2:57:49 PM GMT+09:00
Thank you for the feedback and I am sorry for the issue in the code.
Today I looked into the CDFt source code (https://rdrr.io/cran/CDFt/src/R/CDFt.R) and did some tests, I think the problem is still associated with too less non-zero values in the historical data (usually caused by obs_data). I would suggest increase the threshold used in the if condition (change from 10 to 30 or even larger, now I am using 30 for testing). I think it will not influence the results too much but help the code running smoothly.
@takao-y -sensei, can I have your comment on this? Could you please let me know if you have better idea? Thank you very much!
Best regards,
Gaohong
takao-yMonday, December 13th, 2021 at 4:38:34 PM GMT+09:00
@gyin -san, @uwatoko -san,
Sorry for the delay in contacting you. If the number of zero values is too small, how about artificially increasing it? In my method, I create a CDF without the zero values, but I did not get such an error. Are you creating a CDF that includes a zero value?
Sorry for the delay in contacting you. If the number of zero values is too small, how about artificially increasing it? In my method, I create a CDF without the zero values, but I did not get such an error. Are you creating a CDF that includes a zero value?
gyinMonday, December 13th, 2021 at 4:41:02 PM GMT+09:00
@takao-y -sensei, sorry for the confusion. I think the problem is the number of non-zero values are too small, therefore, it may not be able to artificially increasing it. (I am creating CDF including zero values)
takao-yMonday, December 13th, 2021 at 4:58:31 PM GMT+09:00
@gyin -san,
How about increasing the “dev” value when the number of zero value is too small? Basically, there should be no problem with low zero values, but are there some bugs in CDFt?
How about increasing the “dev” value when the number of zero value is too small? Basically, there should be no problem with low zero values, but are there some bugs in CDFt?
takao-yMonday, December 13th, 2021 at 5:01:05 PM GMT+09:00
@gyin -san,
Basically, dev value expands the range of maximum and minimum values.
https://rdrr.io/cran/CDFt/src/R/CDFt.R
Basically, dev value expands the range of maximum and minimum values.
a=abs(mean(DataGf, na.rm=TRUE)-mean(DataGp, na.rm=TRUE))
  m=min(ObsRp, DataGp, DataGf, na.rm=TRUE)-dev*a
  M=max(ObsRp, DataGp, DataGf, na.rm=TRUE)+dev*a
https://rdrr.io/cran/CDFt/src/R/CDFt.R
gyinMonday, December 13th, 2021 at 5:17:00 PM GMT+09:00
@takao-y -sensei,
I am sorry but I may not understand it correctly.
For me, I checked some grids when the CDFt showed error as “In CDFt, dev must be higher”. In that case, “obs_data” usually has about 6000-7000 data, but only 2 or 3 of them are NOT zeros, all the remaining data are zeros. Or among 6000-7000 data, there are 17 data are NOT zeros, but the 17 data are all the same NON-zero values.
Therefore, I think when the obs_data does not have enough dynamics (99.99% are zeros, and only few data are not zeros), conducting CDFt may not be meaningful. Adding dev value may make the code run successfully, but by adding too large dev, the “min” can become very negative, and I am unsure if it will give very negative adjusted precipitation value (need to look into the source code to check). Can I have your thought on it? Thank you very much!
takao-yMonday, December 13th, 2021 at 6:12:52 PM GMT+09:00
@gyin -san,
Sorry. I just misunderstood. In that case, there is no problem if you replace the estimation value with zero value. I think the observation value is 0.4 mm (the minimum value of Radar AMeDAS)?
Sorry. I just misunderstood. In that case, there is no problem if you replace the estimation value with zero value. I think the observation value is 0.4 mm (the minimum value of Radar AMeDAS)?
gyinWednesday, December 15th, 2021 at 9:54:07 AM GMT+09:00
@takao-y -sensei,
I am sorry for the late reply. Thank you for your confirmation. For the observation value, the original minimum may be 0.4mm, but since we did spatial interpolation (1km to 0.06 degree), I think the minimum value can be less than 0.4 mm.
Best regards,
Gaohong
I am sorry for the late reply. Thank you for your confirmation. For the observation value, the original minimum may be 0.4mm, but since we did spatial interpolation (1km to 0.06 degree), I think the minimum value can be less than 0.4 mm.
Best regards,
Gaohong
takao-yThursday, December 16th, 2021 at 3:53:48 PM GMT+09:00
@gyin -san, @uwatoko -san,
Can you identify where the grid point that cause the error is? I am guessing that the observed precipitation is almost zero, which means that most of it is missing at sea, far from land. If so, I think there is no problem if we replace the MSM-GPV precipitation value without applying CDFt to the grid point. Could you tell me your opinion?
Can you identify where the grid point that cause the error is? I am guessing that the observed precipitation is almost zero, which means that most of it is missing at sea, far from land. If so, I think there is no problem if we replace the MSM-GPV precipitation value without applying CDFt to the grid point. Could you tell me your opinion?
gyinThursday, December 16th, 2021 at 4:21:32 PM GMT+09:00
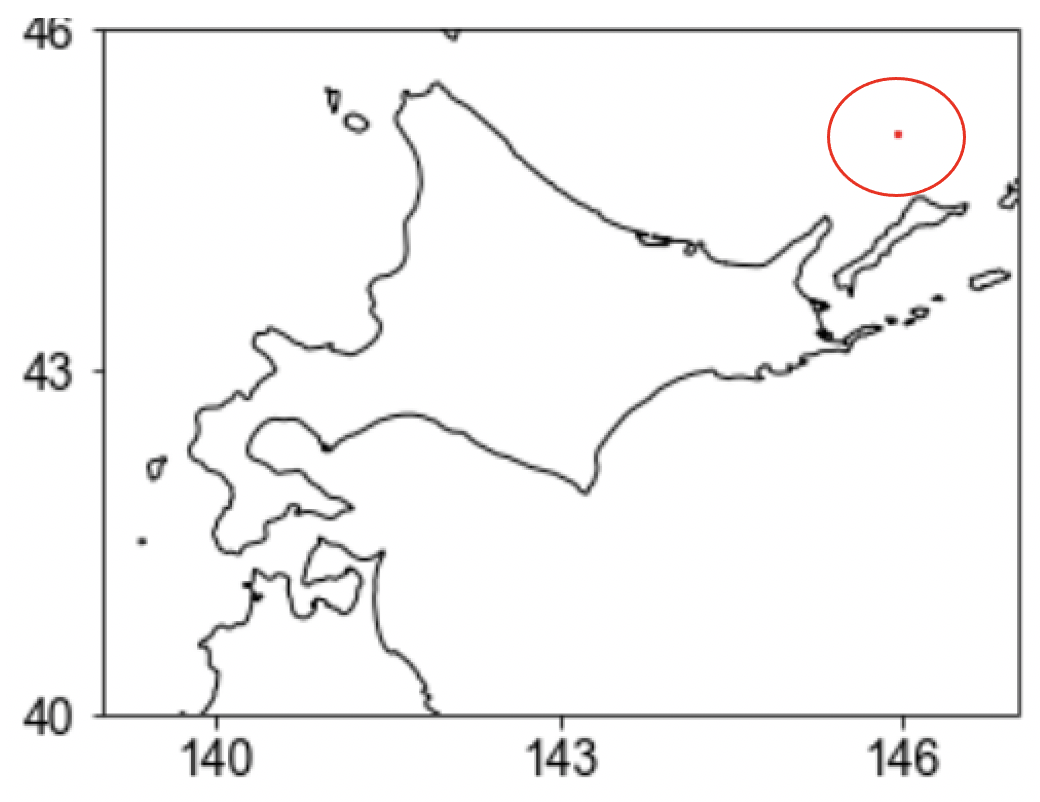
@takao-y -sensei,
Thank you for your reply! I agree with your thought. I didn’t check all grids having the problem, but for the problem Higashiuwatoko-san met at site A, it is at the location (132,97). I tried to plot it on the map and it is at the sea area (the red pixel in northeast area in the attached figure).
Thank you for your reply! I agree with your thought. I didn’t check all grids having the problem, but for the problem Higashiuwatoko-san met at site A, it is at the location (132,97). I tried to plot it on the map and it is at the sea area (the red pixel in northeast area in the attached figure).
takao-yFriday, December 17th, 2021 at 11:38:34 AM GMT+09:00
@gyin -san,
Thank you very much!
@uwatoko -san
Could you please tell me your opnion?
Thank you very much!
@uwatoko -san
Could you please tell me your opnion?
takao-yMonday, December 20th, 2021 at 2:17:30 PM GMT+09:00
@uwatoko -san,
I don’t think that the point ([32,92] in site A, as shown by Yin-san) is relevant for flood prediction, so how about replacing that point with the MSM-GPV value? I’d appreciate it if you could let me know if this is possible.
I don’t think that the point ([32,92] in site A, as shown by Yin-san) is relevant for flood prediction, so how about replacing that point with the MSM-GPV value? I’d appreciate it if you could let me know if this is possible.
uwatokoMonday, December 20th, 2021 at 5:01:32 PM GMT+09:00
@takao-y -sensei,@gyin-san,
I'm sorry, I don't understand, please tell me.
I don't understand why you are concerned about the change here, since the A process handles it well.
I can respond to your request for the above change, but I don't think it's necessary.
What we are currently having trouble with is the processing of B, so we believe that B is necessary to respond.
takao-yMonday, December 20th, 2021 at 5:08:58 PM GMT+09:00
@uwatoko -san,
I’m sorry. I misunderstood. Could you please tell me where in siteB the error is occurring? If the error is caused at the grid point over sea, I think you can replace it with the value of MSM-GVP to avoid the error.
I’m sorry. I misunderstood. Could you please tell me where in siteB the error is occurring? If the error is caused at the grid point over sea, I think you can replace it with the value of MSM-GVP to avoid the error.
uwatokoMonday, December 20th, 2021 at 5:19:25 PM GMT+09:00
@takao-y -sensei
Looking at the attached log, the position where the error occurred is "ilat= 126" and "ilon= 37", suggesting that the program terminated abnormally.
Looking at the attached log, the position where the error occurred is "ilat= 126" and "ilon= 37", suggesting that the program terminated abnormally.
takao-yMonday, December 20th, 2021 at 5:30:51 PM GMT+09:00
@uwatoko -san
I think the point (ilon,ilat)=(37,126) (136.62E; 40.16N) is at sea. Therefore, I think we can replace it with MSM-GPV, how about that? Could you tell me your opinion?
I think the point (ilon,ilat)=(37,126) (136.62E; 40.16N) is at sea. Therefore, I think we can replace it with MSM-GPV, how about that? Could you tell me your opinion?
uwatokoMonday, December 20th, 2021 at 5:40:25 PM GMT+09:00
@takao-y -sensei
I think there is no problem with that response here.
Then, I would like to handle that point in response to the replacement of the MSM-GPV.
I think there is no problem with that response here.
Then, I would like to handle that point in response to the replacement of the MSM-GPV.
takao-yMonday, December 20th, 2021 at 5:43:07 PM GMT+09:00
@uwatoko -san, @gyin -san
Then let’s do that. Thank you very much!
Then let’s do that. Thank you very much!
gyinMonday, December 20th, 2021 at 5:49:17 PM GMT+09:00
@uwatoko -san, I am sorry but can I confirm that, even you increased the threshold in the if condition (i.e., the updated code set the threshold as 10), site B still showed the same error and terminate abnormally?
Because for grids on land, the number of non-zero values in “obs_data” will be about at least 2000-3000, I think setting the threshold up to 100 (or even larger) does not matter.
I do not suggest increasing “dev” because based on my understanding of the CDFt source code, increasing the dev may produce many unrealistic negative precipitation values (but I may be wrong).
takao-yTuesday, December 21st, 2021 at 5:00:51 PM GMT+09:00
@uwatoko -san, @gyin -san,
“increasing the dev may produce many unrealistic negative precipitation values”
If so, why don’t we also replace the siteA grid points with MSM-GPV values?
“increasing the dev may produce many unrealistic negative precipitation values”
If so, why don’t we also replace the siteA grid points with MSM-GPV values?
gyinTuesday, December 21st, 2021 at 5:32:29 PM GMT+09:00
@uwatoko -san, @takao-y -sensei,
Please find the attached updated code.
(1) For the error in CDFt, I now changed the if condition to “tryCatch”: instead of finding a threshold, it try to run CDFt and if it has error, CDFt was not conducted, and SVM (or MSM) results were used (I put both options in the code and you can choose).
(2) In my experiment run, I used 2007-2019 as training data and 2020 as testing data. However, for real-time operation, I think we should use all available data (2007-2020) and forecast 2021. It seems current cross-validation only run for 2007-2019 on JAXA server? Therefore, I updated the years information in all the scripts. I am sorry that I didn’t notice this mismatch earlier.
Could you please check the updated codes? I am sorry for the inconvenience, and if you have further concerns or questions, please let me know.
uwatokoTuesday, December 21st, 2021 at 6:28:10 PM GMT+09:00
@takao-y -sensei, @gyin -san,
Following Dr. Yoshikane's instructions, I modified the code so that it does not process the part of site B where the process is terminating abnormally ("ilat= 126" and "ilon= 37").
The temporary fix is as follows.
The following if statement was added before the CDFt processing so that the error locations do not proceed to the CDFt. This allowed me to execute the process without any problems.
if ( ilat==126 && ilon==37 ) {
mlcdft_mat[1:fcst_time,ilat,ilon] = val_svm
next
}
Sorry. I can't report back in time for tomorrow about applying the modified code. However, we will replace it with this one and process it in the future.
takao-yTuesday, December 21st, 2021 at 6:38:01 PM GMT+09:00
@uwatoko -san, @gyin -san,
Thank you very much!
Thank you very much!
gyinTuesday, December 21st, 2021 at 8:13:06 PM GMT+09:00
@uwatoko -san,
I am sorry that I could not provide the updated code earlier. Just fixed a bug on the codes that I just shared. Please use the attached latest version. I am sorry for the possible confusion that brought.
I am sorry that I could not provide the updated code earlier. Just fixed a bug on the codes that I just shared. Please use the attached latest version. I am sorry for the possible confusion that brought.
uwatokoTuesday, December 21st, 2021 at 8:46:47 PM GMT+09:00
@gyin -san,
Thank you very much.
I will use the program you gave me.
However, please be aware that we will probably not be able to confirm your program in time for tomorrow's report.
Thank you very much.
I will use the program you gave me.
However, please be aware that we will probably not be able to confirm your program in time for tomorrow's report.
gyinTuesday, December 21st, 2021 at 8:59:31 PM GMT+09:00
@uwatoko -san,
I understood it. Sorry that I did not provide it earlier. Please let me know if you found any problem with the codes later.
I understood it. Sorry that I did not provide it earlier. Please let me know if you found any problem with the codes later.
uwatokoThursday, December 23rd, 2021 at 2:27:18 PM GMT+09:00
@gyin-san,@takao-y -sensei,
I tried to use the new program you gave me, but I got the same error in the same place in B of the site.("ilat= 126" and "ilon= 37").
Could you please confirm this for me?
I tried to use the new program you gave me, but I got the same error in the same place in B of the site.("ilat= 126" and "ilon= 37").
Could you please confirm this for me?
gyinThursday, December 23rd, 2021 at 2:33:16 PM GMT+09:00
@uwatoko -san,
could you please guide me the script path on the server you are using? I will take a look at it and get it back to you as soon as possible. Thank you!
could you please guide me the script path on the server you are using? I will take a look at it and get it back to you as soon as possible. Thank you!
uwatokoThursday, December 23rd, 2021 at 3:06:52 PM GMT+09:00
@gyin-san
The following environment is used for processing.
Machine name: gaga
Directory: /lebron_disk09/GPM/AI_GSMaP/program/fcst_code_python_cdft
Environment setting: source env_gaga.txt
How to run: /export/trmm5/tool/RHEL8/gnu/R-3.6.3/bin/R --vanilla --no-slave < S4_39hr_cdft_A.R
The following environment is used for processing.
Machine name: gaga
Directory: /lebron_disk09/GPM/AI_GSMaP/program/fcst_code_python_cdft
Environment setting: source env_gaga.txt
How to run: /export/trmm5/tool/RHEL8/gnu/R-3.6.3/bin/R --vanilla --no-slave < S4_39hr_cdft_A.R
gyinThursday, December 23rd, 2021 at 4:01:20 PM GMT+09:00
@uwatoko -san,
I didn’t find the code for site B. For site A, it seems the S4_39hr_cdft_A.R in the folder is not the latest code I shared.
Could you please use the latest code (I attached it here again) ? I am sorry for the confusion. In the latest version, Line 178 “if (CT==0)” was changed to “if (length(CT)==1)“.
Also, you can check my running under “/lebron_disk09/gyin/test_cdft/S4_39hr_cdft_tB.R”. It seems there is no problem in running it.
In the new code, I set it as when it cannot do CDFt, it will skip the grid, set values the same as SVM (or MSM; default is SVM, if want to replace with MSM, just comment line 171 and uncomment lines 174-176) and display message “error in CDFt” on screen. Please let me know if there is still problem in running the code
uwatokoThursday, December 23rd, 2021 at 5:15:57 PM GMT+09:00
@gyin-san,@takao-y -sensei,
We apologize for the inconvenience caused by our mistake in checking.
I have confirmed that the new program you gave me works fine.
When I ran the code you gave me, I got a lot of "error in CDFt" messages, but the process was completed.
I think there is no problem because the file is also output.
There is one thing I would like to confirm.
In the previous python program, I specified hyperparameters (gm/c2/ep) and feature values (RG/NUM) as parameters, but in the R program, I can't find any variables that represent these parameters. Are they unnecessary?
gyinThursday, December 23rd, 2021 at 5:21:13 PM GMT+09:00
@uwatoko -san,
Thank you for the feedback! In the previous codes, when the values of one grid are all zeros, it skipped without showing any warning message. Since I now changed it to the tryCatch function, they all belong to the cases of not conducting CDFt. I think that is why it has so many “error in CDFt” messages.
For the CDF/CDFt, hyperparameters and feature values are not necessary. CDF and CDFt only used the svm and observed data during the cross-validation period. In the previous CDF python code, they are put there for consistency but not used in running. I am sorry for the confusion.
@takao-y -sensei, could you please confirm that my answer was correct? Thank you very much!
gyinThursday, December 23rd, 2021 at 5:35:09 PM GMT+09:00
@uwatoko -san, @takao-y -sensei,
Additionally, grids not covered by Radar-AMeDAS (always NaN) are also counted in the “error in CDFt” cases.
Additionally, grids not covered by Radar-AMeDAS (always NaN) are also counted in the “error in CDFt” cases.
takao-yThursday, December 23rd, 2021 at 9:16:05 PM GMT+09:00
@gyin -san, @uwatoko -san,
I don’t think there is any problem.
Thank you very much!
I don’t think there is any problem.
Thank you very much!
gyinWednesday, December 22nd, 2021 at 3:11:32 PM GMT+09:00
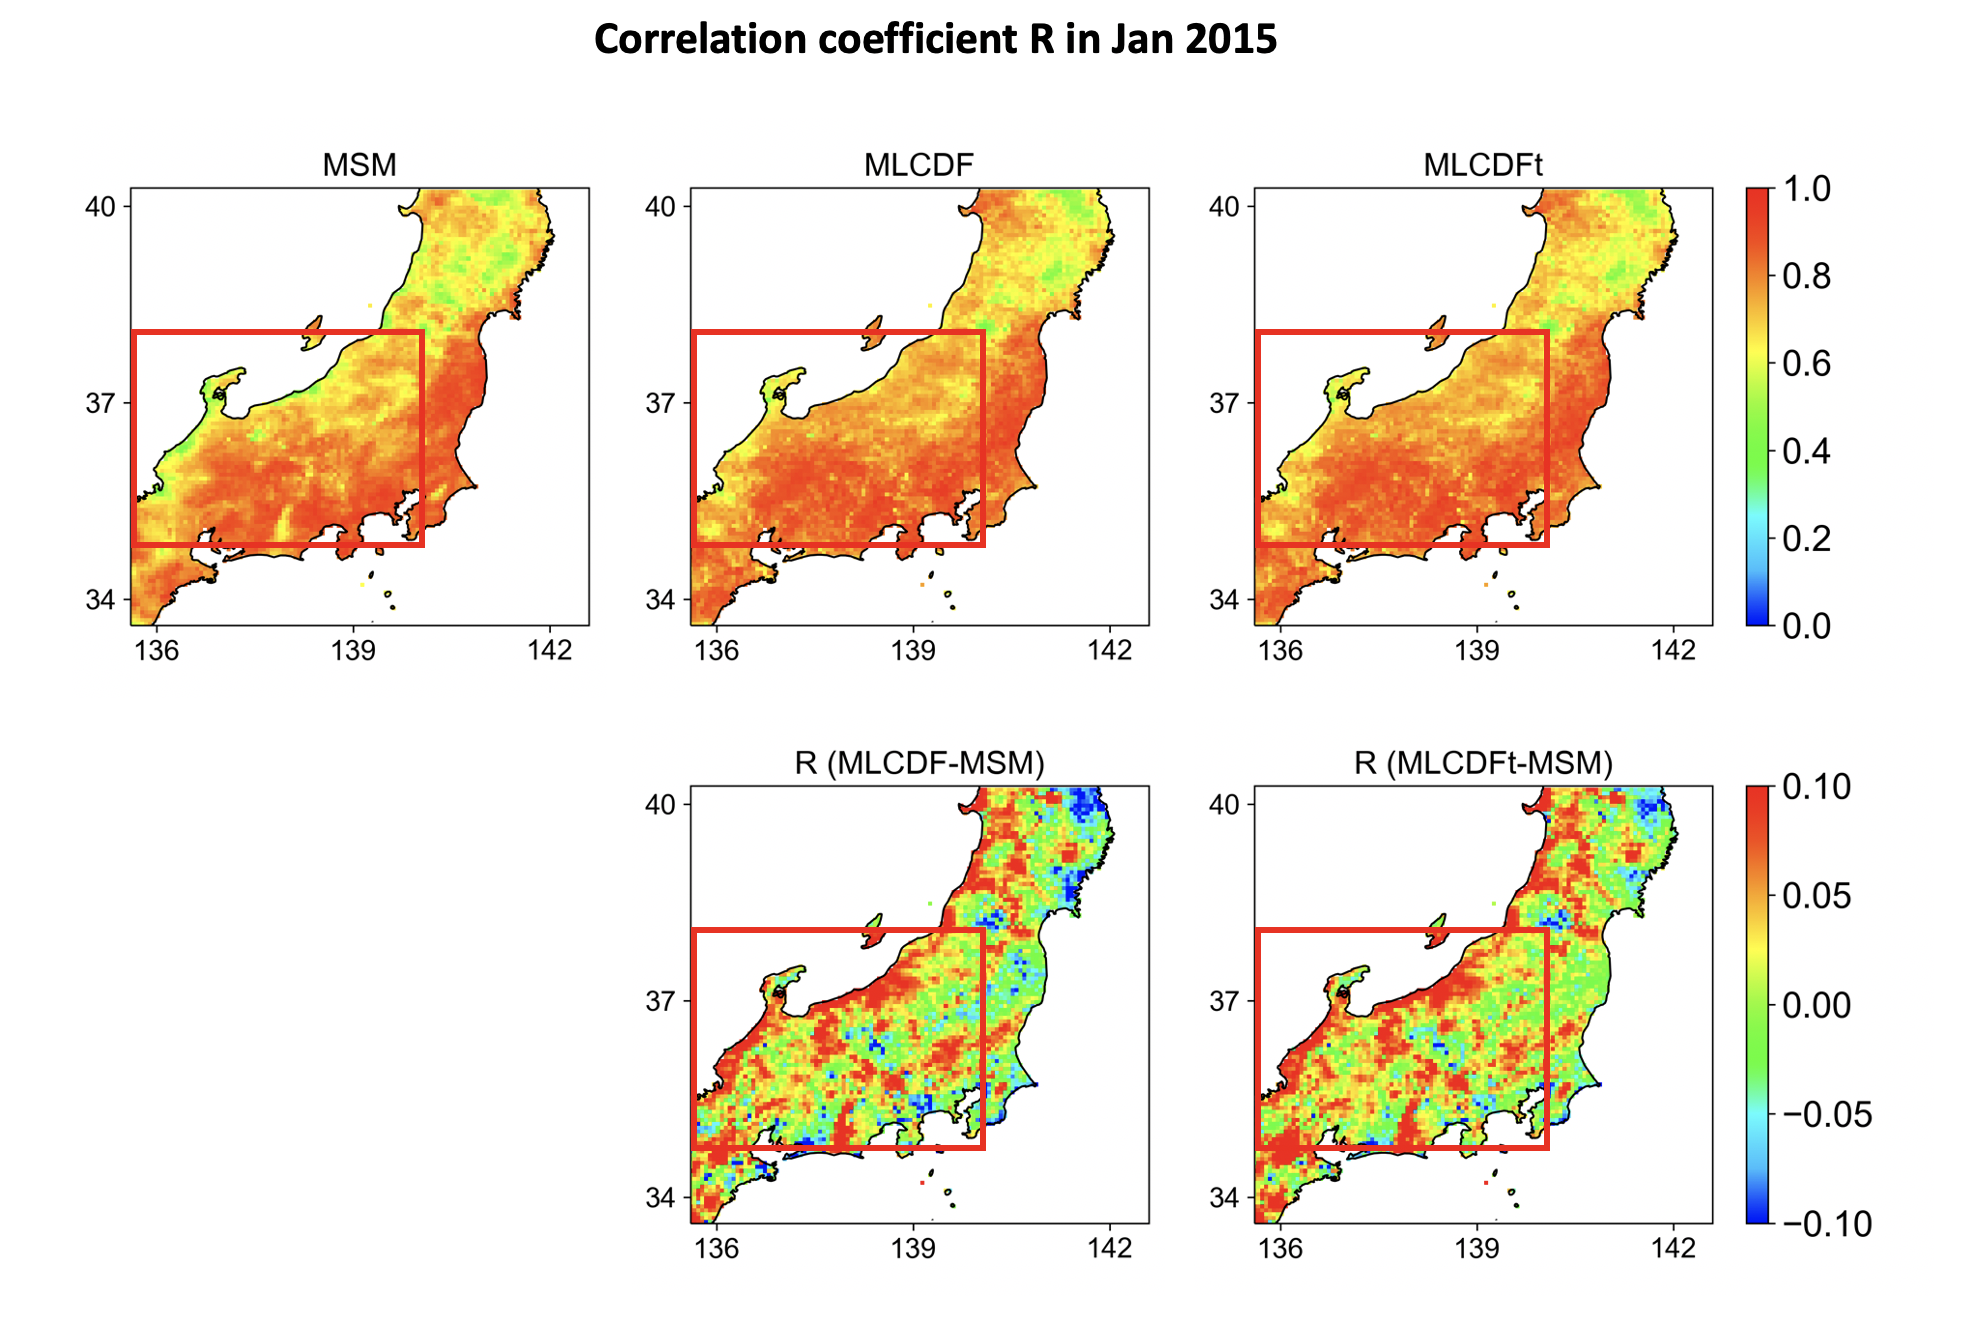
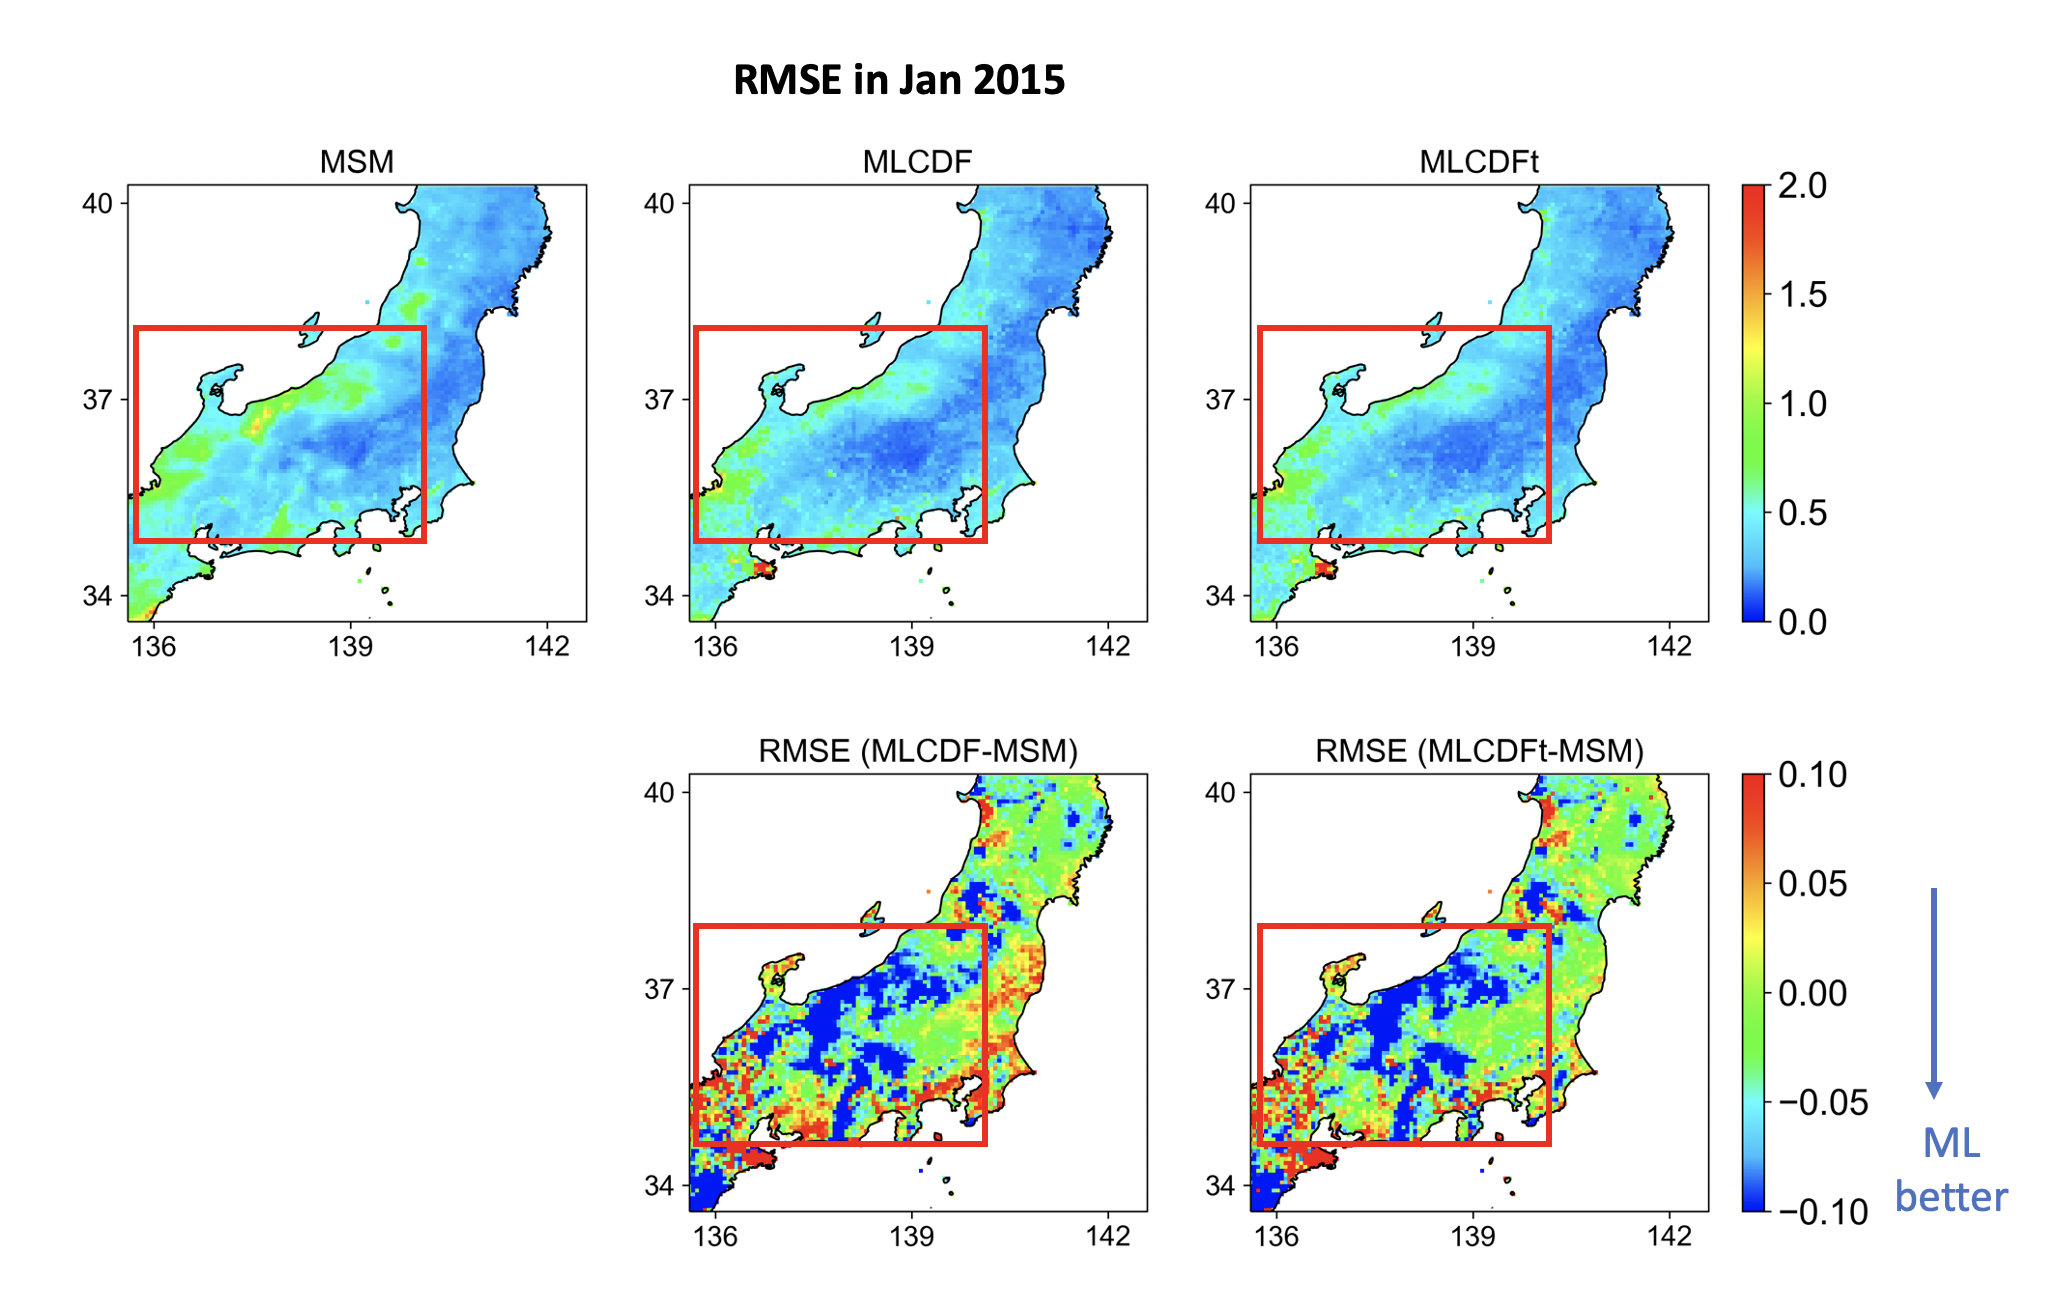
@keiyoshi08 -sensei, @takao-y -sensei,
The correlation coefficient R and RMSE map in 2015 Jan was attached. The red box region corresponds to the region in Yoshikane-sensei’s slides. Basically MSM and ML-based results showed good R in this region. Improvements in R can be found in ML-CDF and ML-CDFt cases along coastal area. I think it showed similar pattern as the NSE of Yoshikane-sensei’s results.
The correlation coefficient R and RMSE map in 2015 Jan was attached. The red box region corresponds to the region in Yoshikane-sensei’s slides. Basically MSM and ML-based results showed good R in this region. Improvements in R can be found in ML-CDF and ML-CDFt cases along coastal area. I think it showed similar pattern as the NSE of Yoshikane-sensei’s results.
keiyoshi08Wednesday, December 22nd, 2021 at 3:36:56 PM GMT+09:00
Wow! Thanks for checking, Gaohong!
takao-yMonday, February 21st, 2022 at 9:57:29 AM GMT+09:00
MTSAT IR1データと解析雨量を用いた機械学習推定値を添付します。
https://www.dropbox.com/s/eie0ksd5uljasj3/20220221.pptx?dl=0
1月のみで学習期間が2011~2018年(テスト期間を除く)として、特徴量は5kmにアップスケーリングしたMTSAT-IR1データ(1時間毎)を21x21gridで設定しました。(7月については現在実行中です)
基本的には降水空間分布およびその時間変化をよく推定できていると思います。一部、欠測処理が適切でないため、観測と一致しない場合もあります。MSMでは再現が難しい筋状の雲からの降水が推定されているのは興味深いです。
日本海沿岸の一部で若干過大評価になっています。学習期間を延長することで、汎化能力を高められるのではないかと考えています。
取り急ぎ、報告まで。
yamamoto.kosukeTuesday, March 1st, 2022 at 6:18:42 PM GMT+09:00
@uwatoko さま
先日の機械学習打ち合わせでのA/Iとなっていた以下について、個人的な備忘録もかねてリマインドさせていただきます。
「できれば3/9まで結果を東大へ受け渡し」となっていたかと思いますが、間に合いそうでしょうか。
ーーーーーーーーーーー
–精度評価として、2021年8月13-17日に期間を絞って絞ってCDFt+TE-Japan処理(RESTEC)。
•処理開始日は8/13以前で既存のTE-Jリスタートファイルがある日時からスタートする。
•次回打合せ(3/9)までにRESTECから東大に処理結果を受け渡しできていればベスト。
–上記を受け、東大で検証を行う(今年度中)。
先日の機械学習打ち合わせでのA/Iとなっていた以下について、個人的な備忘録もかねてリマインドさせていただきます。
「できれば3/9まで結果を東大へ受け渡し」となっていたかと思いますが、間に合いそうでしょうか。
ーーーーーーーーーーー
–精度評価として、2021年8月13-17日に期間を絞って絞ってCDFt+TE-Japan処理(RESTEC)。
•処理開始日は8/13以前で既存のTE-Jリスタートファイルがある日時からスタートする。
•次回打合せ(3/9)までにRESTECから東大に処理結果を受け渡しできていればベスト。
–上記を受け、東大で検証を行う(今年度中)。
uwatokoThursday, March 3rd, 2022 at 11:46:53 AM GMT+09:00
@yamamoto.kosuke さん
すみません、トラブっている関係で処理が遅れておりますが、次回打合せ(3/9)まで頑張ります。
あと、確認なのですが、今回の処理って最初の5時間は解析雨量が入った現在のバージョンでよかったでしょうか。
すみません、トラブっている関係で処理が遅れておりますが、次回打合せ(3/9)まで頑張ります。
あと、確認なのですが、今回の処理って最初の5時間は解析雨量が入った現在のバージョンでよかったでしょうか。
yamamoto.kosukeFriday, March 4th, 2022 at 8:54:32 PM GMT+09:00
@uwatoko さま、お返事遅くなりすみません。今回はAIの効果のみを評価したいので、解析雨量無しのランでお願いできればと思います。お忙しいところ恐れ入りますがよろしくお願いします。
uwatokoFriday, March 4th, 2022 at 9:13:58 PM GMT+09:00
@yamamoto.kosuke さん
あ、そうなんですか。
今から処理をしないと間に合わないので’(土日に回したくて)、解析雨量が入った
現在のバージョンで回すのをお願いしてしまいました。
来週、修正版をお願いするので、すみませんが、ちょっと時間がかかります。
あ、そうなんですか。
今から処理をしないと間に合わないので’(土日に回したくて)、解析雨量が入った
現在のバージョンで回すのをお願いしてしまいました。
来週、修正版をお願いするので、すみませんが、ちょっと時間がかかります。
yamamoto.kosukeFriday, March 4th, 2022 at 9:53:31 PM GMT+09:00
@uwatoko さま
返事が遅くなったため手戻りとなってしまいすみません。。
@keiyoshi08 先生
念のため確認ですが、上記、できれば解析雨量なしでの評価の方が良いですよね?
返事が遅くなったため手戻りとなってしまいすみません。。
@keiyoshi08 先生
念のため確認ですが、上記、できれば解析雨量なしでの評価の方が良いですよね?
keiyoshi08Saturday, March 5th, 2022 at 9:43:07 AM GMT+09:00
@yamamoto.kosuke @uwatoko
手間もありますので、解析雨量+AI-MSM予報で回そうとしている「TE-Japan2」の評価とすればよいのでは。
論文にする場合は、別途、AI-MSM予報だけで回したランもつかって、何がよく効いたのか、という検討もあったほうがよいとは思いますが。
手間もありますので、解析雨量+AI-MSM予報で回そうとしている「TE-Japan2」の評価とすればよいのでは。
論文にする場合は、別途、AI-MSM予報だけで回したランもつかって、何がよく効いたのか、という検討もあったほうがよいとは思いますが。
keiyoshi08Saturday, March 5th, 2022 at 9:43:29 AM GMT+09:00
昨日の午後ワクチン打って、返事が遅れました。すみません。
yamamoto.kosukeMonday, March 7th, 2022 at 9:05:46 AM GMT+09:00
@keiyoshi08 さま、ありがとうございます。
@uwatoko さま、ということですので、現在のバージョンでの結果が出たらひとまず結果を東大に渡していただき、その後余力があればAI-MSM予報だけのランをお願いできればと思います。
@uwatoko さま、ということですので、現在のバージョンでの結果が出たらひとまず結果を東大に渡していただき、その後余力があればAI-MSM予報だけのランをお願いできればと思います。
uwatokoMonday, March 7th, 2022 at 5:51:28 PM GMT+09:00
@keiyoshi08 先生、@yamamoto.kosuke さん、
@takao-y 先生、@gyin さん
現在のバージョンでのMSM推定を利用したJustNowの動作試験に関しまして、
2021年8月13日~8月17日の処理が終了していましたのでご連絡します。
データは以下に作成しております。
/lili1_disk2/waterop/TE/JPN_Justnow/netcdf/MATSIRO/MSM/hourly/2021/08/
/lili1_disk2/waterop/TE/JPN_Justnow/netcdf/CaMa/MSM/hourly/2021/08/
該当日時以外のデータは前処理を行ったデータなので無視してください。
@takao-y 先生、@gyin さん
現在のバージョンでのMSM推定を利用したJustNowの動作試験に関しまして、
2021年8月13日~8月17日の処理が終了していましたのでご連絡します。
データは以下に作成しております。
/lili1_disk2/waterop/TE/JPN_Justnow/netcdf/MATSIRO/MSM/hourly/2021/08/
/lili1_disk2/waterop/TE/JPN_Justnow/netcdf/CaMa/MSM/hourly/2021/08/
該当日時以外のデータは前処理を行ったデータなので無視してください。
keiyoshi08Tuesday, March 8th, 2022 at 9:08:40 AM GMT+09:00
@gyin
Since Ma-san and Yoshikane-san are busy due to revision of the report and S-20 project, respectively, would you kindly take a lead on this comparison? Ma-san has original TE-Japan result and knows how to run it for this period. This should be included in this year’s report. Sorry for urgent work.
Since Ma-san and Yoshikane-san are busy due to revision of the report and S-20 project, respectively, would you kindly take a lead on this comparison? Ma-san has original TE-Japan result and knows how to run it for this period. This should be included in this year’s report. Sorry for urgent work.
keiyoshi08Tuesday, March 8th, 2022 at 9:16:22 AM GMT+09:00
For your information,
Original (TE-Japan): MSM only
New (TE-Japan2(-beta)): Radar for (-9 to -5) hours and AI-MSM for (-4 to 30) hours (assuming our MSM operation is 9 hours late and Radar is 4 hours late)
Since we use Radar amedas as much as possible, we have to mind the initial time and data availability at real time (e.g. we should not use Radar data for future).
gyinTuesday, March 8th, 2022 at 10:12:52 AM GMT+09:00
@keiyoshi08 -sensei,
Just want to confirm that I understood the task correctly. So what I should do is to
(1) Run AI-MSM for Japan region between Aug 13-17, 2021
(2) Use the AI-MSM results as forcing into TE-Japan
(3) Compare the results from original TE-Japan and TE-Japan2(which uses AI-MSM)?
Just want to confirm that I understood the task correctly. So what I should do is to
(1) Run AI-MSM for Japan region between Aug 13-17, 2021
(2) Use the AI-MSM results as forcing into TE-Japan
(3) Compare the results from original TE-Japan and TE-Japan2(which uses AI-MSM)?
keiyoshi08Tuesday, March 8th, 2022 at 10:16:45 AM GMT+09:00
(1) is already done by Uwatoko-san (right? @uwatoko) Note that first 5 slices (hours) are replaced by Radar Amedas. (which is the same as operational run shown in the current TE-Japan system)
(2) and (3) are correct.
(2) and (3) are correct.
gyinTuesday, March 8th, 2022 at 10:31:05 AM GMT+09:00
@uwatoko -san, could you please guide the directory for the AI-MSM results on Aug 13-17,2021? Also, it seems I do not have access permission to lili1 (or not account there?). If data was stored there, could you please help solving this access issue. Thank you very much!
uwatokoTuesday, March 8th, 2022 at 1:18:46 PM GMT+09:00
@keiyoshi08 -sensei,、@gyin san
As @keiyoshi08 -sensei surmised, (1) has already been processed.
@gyin-san , please use the GAGA machine, not the LILI machine.
I think that you have an account on the GAGA machine, where you can see the data.
As @keiyoshi08 -sensei surmised, (1) has already been processed.
@gyin-san , please use the GAGA machine, not the LILI machine.
I think that you have an account on the GAGA machine, where you can see the data.
gyinTuesday, March 8th, 2022 at 1:24:25 PM GMT+09:00
@uwatoko -san,
As I am always using “zico-n” beofre, I tried “ssh gyin@gaga”, but it does not work (no response). May I confirm that “gaga” is the correct name to use?
Also, I am sorry but can you please give the detailed path of the (1) processed data?
As I am always using “zico-n” beofre, I tried “ssh gyin@gaga”, but it does not work (no response). May I confirm that “gaga” is the correct name to use?
Also, I am sorry but can you please give the detailed path of the (1) processed data?
gyinTuesday, March 8th, 2022 at 2:46:52 PM GMT+09:00
@uwatoko -san, Please disregard the previous message. I found the data under “/lebron_disk09/GPM/AI_GSMaP/AI_MSM”. I will use it for the next steps. Sorry for bothering before.
keiyoshi08Wednesday, March 9th, 2022 at 12:23:27 PM GMT+09:00
@uwatoko
1. TE-Japan2用降水(Radar+MSM-AI)について、TEも回してくださっているのですね。ただし、期間が短いそうなので、延長していただけますか?
2. TE-Japan2’降水(MSM-AIのみ)についても、動いてくださっていると本日聞きました。こちらについてもTEまで流してくれるという理解であっていますか?
1. TE-Japan2用降水(Radar+MSM-AI)について、TEも回してくださっているのですね。ただし、期間が短いそうなので、延長していただけますか?
2. TE-Japan2’降水(MSM-AIのみ)についても、動いてくださっていると本日聞きました。こちらについてもTEまで流してくれるという理解であっていますか?
keiyoshi08Wednesday, March 9th, 2022 at 12:24:17 PM GMT+09:00
詳細については、@gyin さんに尋ねてもらいます。
gyinWednesday, March 9th, 2022 at 12:31:57 PM GMT+09:00
@uwatoko -san, I found there is a folder “/lili1_disk2/waterop/TE/JPN_Justnow/netcdfAI” with CaMa flood results on August 13 and 14 available. May I ask
(1) Would you continue this running for August 13-17 the whole period?
(2) The AI-MSM used in this running is all AI-MSM or the first 5 hours have been replaced by Radar-AMeDAS?
If you could continue finishing the TE-Japan-AI running from August 13 to 17, that would be very helpful because we do not have the AI-related restart file for CaMa flood. Thank you!
uwatokoWednesday, March 9th, 2022 at 11:38:38 PM GMT+09:00
@keiyoshi08 先生、@yamamoto.kosuke さん、
@takao-y 先生、@gyin さん
返事が遅くなって申し訳ございません。
下記に、TE-Japan2用降水である(Radar+MSM-AI)と(MSM-AIのみ)の二つを用意しております。
期間は8月13日から17日を用意しております。こちらは完了しております。
Radar+MSM-AI gaga:/pecan03/water/restec/TE-JustNow/2021/08/dd/hh
MSM-AIのみ gaga:/pecan03/water/TE/RAIN/TE-JustNow/2022_allMSM/08/dd/hh
TEの処理ですが、(Radar+MSM-AI)のTE処理は完了しておりますが、
(MSM-AIのみ)は、まだ完了しておりません。現在、同じ期間になるように処理をしている最中です。
(8月13日から14日まで処理が終わっている認識は正しいです)
上記の質問だと、Radar+MSM-AIのTE処理が全期間ないようにも読めますが、こちらの認識では完了しています。
(明日確認します)。
Radar+MSM-AI
/lili1_disk2/waterop/TE/JPN_Justnow/netcdf/MATSIRO/MSM/hourly/2021/08/
/lili1_disk2/waterop/TE/JPN_Justnow/netcdf/CaMa/MSM/hourly/2021/08/
MSM-AIのみ
/lili1_disk2/waterop/TE/JPN_Justnow/netcdfAI/
gyinThursday, March 10th, 2022 at 10:02:29 AM GMT+09:00
@uwatoko -san, great thanks for the information!
uwatokoFriday, March 11th, 2022 at 8:53:26 AM GMT+09:00
@gyin さん
MSM-AI-only processing for the entire period of August 13-17 was also completed.
I believe we now have all the data we need for this time.
MSM-AI-only processing for the entire period of August 13-17 was also completed.
I believe we now have all the data we need for this time.
gyinFriday, March 11th, 2022 at 9:13:53 AM GMT+09:00
@uwatoko -san, thank you very much!
uwatokoFriday, March 4th, 2022 at 7:12:52 PM GMT+09:00
@takao-y先生、@gyin さん
2月25日から、TEのところにAI版のMSMを導入したのですが、
3月から、沖縄あたりのsiteEのところで変な雨が出ております。
https://www.eorc.jaxa.jp/water/TE-japan/map/index_j.html
現状動かしているsiteEだけのテスト環境を下記に用意しました。
ご確認いただけないでしょうか。
gaga:/lebron_disk09/GPM/AI_GSMaP/test
手順は以下のファイルに記述しています。
gaga:/lebron_disk09/GPM/AI_GSMaP/test/readme.txt
2月25日から、TEのところにAI版のMSMを導入したのですが、
3月から、沖縄あたりのsiteEのところで変な雨が出ております。
https://www.eorc.jaxa.jp/water/TE-japan/map/index_j.html
現状動かしているsiteEだけのテスト環境を下記に用意しました。
ご確認いただけないでしょうか。
gaga:/lebron_disk09/GPM/AI_GSMaP/test
手順は以下のファイルに記述しています。
gaga:/lebron_disk09/GPM/AI_GSMaP/test/readme.txt
uwatokoFriday, March 4th, 2022 at 7:25:24 PM GMT+09:00
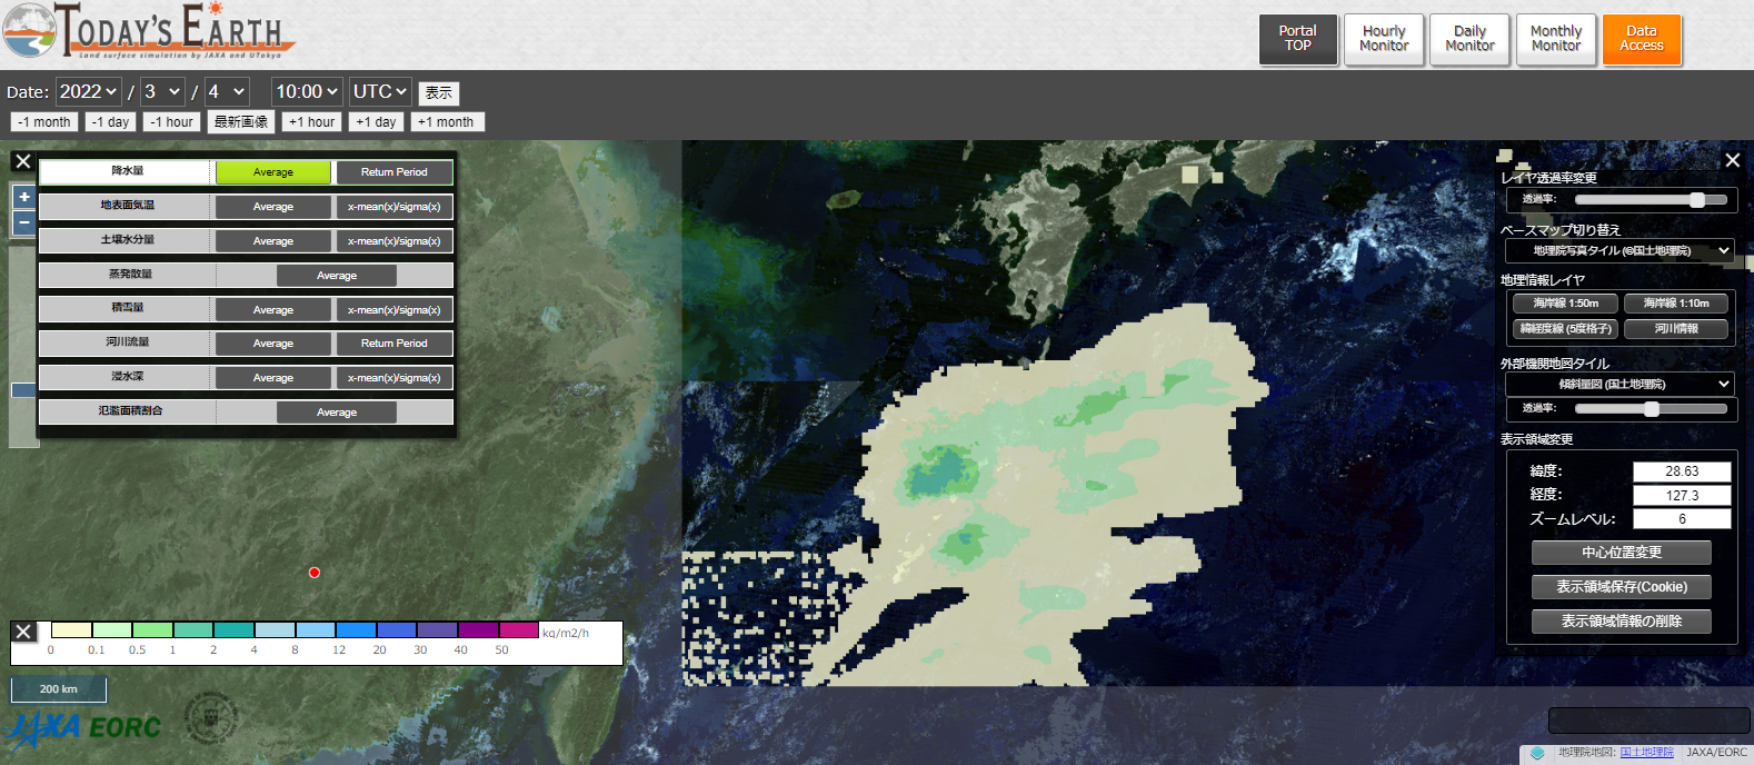
@takao-y先生、@gyin さん
変な雨の画像はこのような感じです。
変な雨の画像はこのような感じです。
gyinSaturday, March 5th, 2022 at 11:26:22 AM GMT+09:00
@uwatoko -san,
I am sorry for the problem. Could you please guide the results directory for SVM only without CDFt? I would like to check after SVM step, does it show the odd pattern or not.
One of my guess is it may be related to the CDFt step. In the current code, when CDFt cannot be conducted due to to less variation in the historical data (e.g., all zeros), svm value was assigned. But if there is no svm value available, it may cause missing values.
If this is the issue, then please try to comment line 187 in “s4_39hr_cdft.R”:
mlcdft_mat[1:fcst_time,ilat,ilon] = val_svm
and then uncommented lines 190-192 (assign msm-gpv value):
point_msm = current_msm[,ilat,ilon]
point_msm[point_msm<0.1] = 0.0
mlcdft_mat[1:fcst_time,ilat,ilon] = point_msm
uwatokoMonday, March 7th, 2022 at 6:14:46 PM GMT+09:00
@gyin -san, @takao-y-sensei
Sorry, sorry for the late reply.
The strange rain that is currently appearing is at the SVM stage.
We have an environment where only SVM works in the following places.
gaga:/lebron_disk09/GPM/AI_GSMaP/test
Sorry, sorry for the late reply.
The strange rain that is currently appearing is at the SVM stage.
We have an environment where only SVM works in the following places.
gaga:/lebron_disk09/GPM/AI_GSMaP/test
gyinMonday, March 7th, 2022 at 7:59:46 PM GMT+09:00
@uwatoko -san, I was trying to check the results for middle steps. However, in “ai_msm_main.sh”, it seems all middle step results were deleted after running (including MSM-GPV siteE 39 hr fcst; svm results). Is that correct?
I just want to confirm if I want to check MSM-GPV on March 01 2020 in site E, and check SVM results, I need to re-run the first few steps of the program?
I just want to confirm if I want to check MSM-GPV on March 01 2020 in site E, and check SVM results, I need to re-run the first few steps of the program?
uwatokoMonday, March 7th, 2022 at 8:50:55 PM GMT+09:00
@gyin -san, @takao-y-sensei
If the CDFt step is called the middle step, it is intentionally not processed up to the middle step.
Because, at the step in the SVM, there is a funny rain, so the program we gave you can only process up to the SVM.
If necessary, I will give you the full script tomorrow.
If the CDFt step is called the middle step, it is intentionally not processed up to the middle step.
Because, at the step in the SVM, there is a funny rain, so the program we gave you can only process up to the SVM.
If necessary, I will give you the full script tomorrow.
gyinMonday, March 7th, 2022 at 10:50:24 PM GMT+09:00
@uwatoko -san, it is okay with the current script. I did run it and saw the odd results. Currently I do not find the reason for this strange pattern, and I may need a little more time to explore it. I will try to get it back to you as soon as possible. I am sorry for that.
keiyoshi08Saturday, March 5th, 2022 at 9:37:54 AM GMT+09:00
@uwatoko that’s odd. @gyin @takao-y, please check. FYI, AI-MSM has been already implemented in TE-Japan, as Uwatoko-san showed.
gyinWednesday, March 9th, 2022 at 10:00:57 AM GMT+09:00
Sorry I got some problem in login Teams, will joint soon
takao-yWednesday, March 9th, 2022 at 10:07:37 AM GMT+09:00
音声が入らないみたいです。
gyinWednesday, March 9th, 2022 at 11:32:42 AM GMT+09:00
@uwatoko -san,
Please find the attached file for the codes with under-sampling step commented.
To use all data instead of under-sampling data, classifiers for March-May need to be re-generated. Cross-validation for the three months also need to re-run.
(1) step1_cross.py: line 269-285 were commented, line 264-265 were added to include all data.
(2) step2_classifier.py: line 240-256 were commented, line 237-238 were added to include all data.
(3) No changes for step3_39hr_fcst.py and step4_39hr_cdft.R, except that the classifier folder name was changed from “data-model-under” to “data-model”.
Also, I attached the classifiers generated for March using 2007-2020 data in site E (corresponding to results in today’s slide page 4, column 4). Hope this can help you reduce some computational time (but it is generated on isotope3, not sure if it will have version issue).
Please let me know if you found any errors or have any issue in using the code. Thank you!
gyinWednesday, March 9th, 2022 at 1:12:33 PM GMT+09:00
March classifiers (using 2007-2020) are available under: /lebron_disk09/gyin/debug_siteE/siteE/03
uwatokoWednesday, March 9th, 2022 at 11:41:49 PM GMT+09:00
@gyin -san,
Thank you for your kind explanation.
I will check the program tomorrow.
Thank you for your kind explanation.
I will check the program tomorrow.
gyinThursday, March 10th, 2022 at 12:09:45 AM GMT+09:00

@keiyoshi08 -sensei, @takao-y -sensei, @uwatoko -san,
Here is the update on the site E issue. It is confirmed that the odd pattern is caused by the hyper-parameters mismatch.
After re-tuning hyper-parameters using under-sampling data, the results became reasonable (please see the attached figure c and d).
Additional information found from this figure:
(1) by conducting under-sampling, the magnitude of SVM estimates was larger (although still smaller than MSM-GPV)
(2) selecting hyper-parameters based on RMSE provides a larger SVM estimates than based on R (still far smaller than MSM-GPV)
uwatokoTuesday, March 15th, 2022 at 4:00:31 PM GMT+09:00

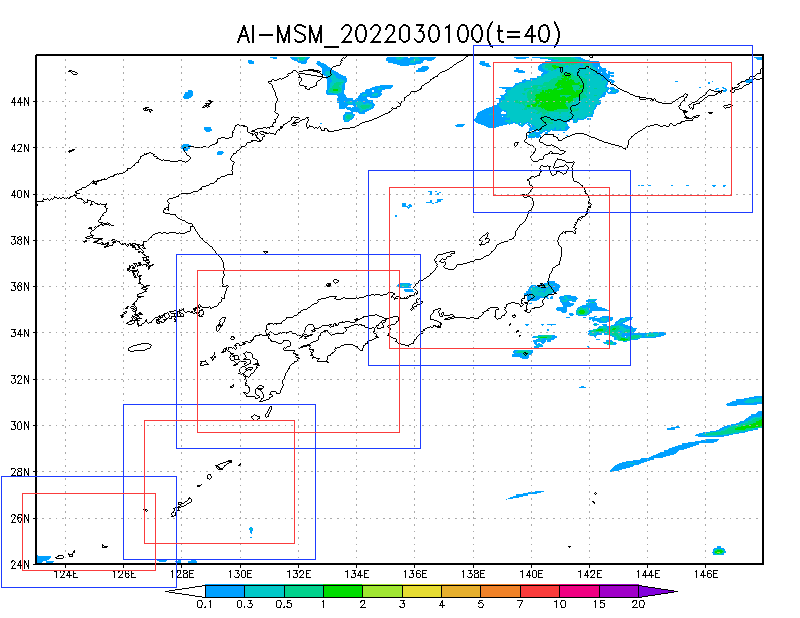
@yamamoto.kosuke様
@keiyoshi08 先生, @takao-y 先生
@gyin様
添付のとおり、@gyinさんが用意してくれたプログラムで対応できました。
(左の画像が、前回までのもの。右が今回新しいプログラムで対応したもの)
サイトEに関しては問題ない感じです。ただ、前回もお話ししたサイトAと
前回では気づいてなかったサイトBの上のところも同様に出ております。
全部のサイトに適用した方がよさげですが、いかがしましょうか
(すみません、もしかしたら、最初からその意図だったのでしょうか)。
とりあえず、現段階のものでもサイトEは問題なさげなので、差し替えてよろしいでしょうか。
よろしくお願いします。
@keiyoshi08 先生, @takao-y 先生
@gyin様
添付のとおり、@gyinさんが用意してくれたプログラムで対応できました。
(左の画像が、前回までのもの。右が今回新しいプログラムで対応したもの)
サイトEに関しては問題ない感じです。ただ、前回もお話ししたサイトAと
前回では気づいてなかったサイトBの上のところも同様に出ております。
全部のサイトに適用した方がよさげですが、いかがしましょうか
(すみません、もしかしたら、最初からその意図だったのでしょうか)。
とりあえず、現段階のものでもサイトEは問題なさげなので、差し替えてよろしいでしょうか。
よろしくお願いします。
keiyoshi08Tuesday, March 15th, 2022 at 4:09:49 PM GMT+09:00
東上床様
はい、差し替えてください。
また問題が出てきたら随時対応しましょう。
はい、差し替えてください。
また問題が出てきたら随時対応しましょう。
uwatokoWednesday, March 16th, 2022 at 9:40:58 AM GMT+09:00
@yamamoto.kosuke様
@keiyoshi08 先生, @takao-y 先生
@gyin様
siteEについては3月15日6時(UTC)のMSMから新プログラムで処理しております。
@keiyoshi08 先生, @takao-y 先生
@gyin様
siteEについては3月15日6時(UTC)のMSMから新プログラムで処理しております。
uwatokoWednesday, March 16th, 2022 at 6:19:36 PM GMT+09:00
@yamamoto.kosuke様
@keiyoshi08 先生, @takao-y 先生
@gyin様
すみません、またトラブルです。
差し替えがうまいこといったと思ったら、入力データが入っているディスク(/pecan03)が
見えなくなりました。予測が入っているのでしばらくは大丈夫ですが、このあとエラーがでるのは
それが原因です。
定時過ぎているため、担当がいない状況ですので、明日の対応となると思います。
@keiyoshi08 先生, @takao-y 先生
@gyin様
すみません、またトラブルです。
差し替えがうまいこといったと思ったら、入力データが入っているディスク(/pecan03)が
見えなくなりました。予測が入っているのでしばらくは大丈夫ですが、このあとエラーがでるのは
それが原因です。
定時過ぎているため、担当がいない状況ですので、明日の対応となると思います。
yamamoto.kosukeWednesday, March 16th, 2022 at 6:37:53 PM GMT+09:00
@uwatoko 様、色々とご対応ありがとうございます。ゆっくり対応していただいて構いませんので、よろしくお願いいたします。
uwatokoWednesday, March 23rd, 2022 at 10:53:54 AM GMT+09:00
@yamamoto.kosuke様
@keiyoshi08 先生, @takao-y 先生
@gyin様
お気づきかもしれませんが、siteE以外の全てのサイトに新プログラムを適用開始しました。
新プログラムを適用開始したMSMファイルは以下の通りです。
siteA: 2022年3月18日6時~
siteB: 2022年3月18日9時~
siteC: 2022年3月18日21時~
siteD: 2022年3月17日21時~
siteE: 2022年3月15日6時~
トラブっていないので、確認は取れていませんが、AMeDASが最初の3時間分揃っていない場合は揃う
まで待つ「3時間対応」というのは、対応済みです。
@keiyoshi08 先生, @takao-y 先生
@gyin様
お気づきかもしれませんが、siteE以外の全てのサイトに新プログラムを適用開始しました。
新プログラムを適用開始したMSMファイルは以下の通りです。
siteA: 2022年3月18日6時~
siteB: 2022年3月18日9時~
siteC: 2022年3月18日21時~
siteD: 2022年3月17日21時~
siteE: 2022年3月15日6時~
トラブっていないので、確認は取れていませんが、AMeDASが最初の3時間分揃っていない場合は揃う
まで待つ「3時間対応」というのは、対応済みです。
yamamoto.kosukeThursday, March 24th, 2022 at 12:05:04 AM GMT+09:00
@uwatoko さま、ご対応ありがとうございました!ひとまず異常降水パターンは出なくなっていることを確認しました。
rkanekoWednesday, April 13th, 2022 at 12:19:21 PM GMT+09:00
@takao-y 単に自己相関というと「時系列データにおいて、時刻tのデータと、そこからラグn時間をとった時刻t-nのデータの相関」がおおよその定義だと思います。今回のSpatial自己相関というのは、時間方向には平均しているだけで、あくまで空間の相関を見ているという認識で良いのでしょうか?
@gyin Thank you for the presentation. I’m just curious. On page number 7, why did the RMSE of fig (a) oscillate cyclically?
@gyin Thank you for the presentation. I’m just curious. On page number 7, why did the RMSE of fig (a) oscillate cyclically?
gyinWednesday, April 13th, 2022 at 4:11:02 PM GMT+09:00
@rkaneko -san, Thank you for your question! I found similar thing in S2S real-time forecast. A close look into the S2S case found that it maybe related to the large RMSE for one particular time regardless of lead time. For example, if estimated precipitation has large RMSE for one target time, and when the lead time is shorter, it still failed to estimate the precipitation pattern correctly. Then the large RMSE propagate along the lead time. For the Jan case, I will look into it and explore more.
takao-yThursday, April 14th, 2022 at 5:04:39 PM GMT+09:00
@rkaneko 様 説明が不十分でした。ラグ相関ではなく、Hourlyデータを使った空間自己相関です。観測では時空間スケールの小さい(たとえば積雲対流スケール)が卓越しているのに対し、数値モデルではそれよりも若干大きなスケール(5km解像度で再現される巨大積雲対流?)が卓越していると推測されます。機械学習では、観測と数値モデルの双方に関係するメソベータスケール(100km四方)の降水システムを認識していると推測されます。結果的に、機械学習ではメソベータスケール降水システムに対応した局地降水の時間変化を推定しますが、積雲対流に伴う激しい降水は推定できないため、全体的に均されて過小評価になります。積雲対流スケールの効果をQMで補うことにより定量的に推定可能になります。積雲対流スケールの現象は単独で形成するよりも親雲?であるメソベータ・アルファスケールの降水システムに伴って形成することの方が多いため、局地降水の変動(大小)に合わせてQMを適用することは合理的であると考えています。積雲対流の効果をダイレクトに取り込むために金子さんのされているようなナウキャストの手法を組み込む方法もあるかと思いますが、、、少し検討してみます。
keiyoshi08Thursday, May 12th, 2022 at 6:06:57 PM GMT+09:00
@gyin @uwatoko
What about the status of hindcasting of TE-Japan’s MSM-AI run and AMEDAS run? Can anybody update?
TE-JのMSM-AIランとAMeDASランについて、進捗をどなたか教えていただけないでしょうか。
What about the status of hindcasting of TE-Japan’s MSM-AI run and AMEDAS run? Can anybody update?
TE-JのMSM-AIランとAMeDASランについて、進捗をどなたか教えていただけないでしょうか。
yixisi1505Thursday, May 12th, 2022 at 6:16:57 PM GMT+09:00
@keiyoshi08 sensei, I am working on running TE-AI rightnow. The Matsiro is finished, but Camaflood is not finished yet. I might can get DPI result in next week. But I don't know the AMeDAS situation. May I ask where is the results of it on JAXA? Thank you!
keiyoshi08Thursday, May 12th, 2022 at 7:15:51 PM GMT+09:00
@yixisi1505 Ma-san, thanks for your reply. I meant Radar-run. In previous mail, it was Step 2, whereas your run is Step 4.
> 1. Prepare Radar precipitation for TE-Japan use. (Uwatoko-san, do you
> already have them?)
> 2. After step 1, conduct a TE-Japan run with Radar. (Is it possible to
> do this, Uwatoko-san?)
> 3. Prepare MSM-AI precipitation (cross-validation results) for
> TE-Japan use. (I’d like Gaohong to take this task, for all the sites
> and all the months, For re-formatting to TE-Japan input, RESTEC will
> help.)
> 4. After step 3, conduct a TE-Japan run with MSM-AI (cross-validation
> results) (Is this possible to run it in U-Tokyo?)
gyinThursday, May 12th, 2022 at 7:24:40 PM GMT+09:00
@keiyoshi08 -sensei, as Ma-san mentioned, step 3 (prepare MSM-AI precipitation) has finished and she is now using the data from step 3 to run step 4 now. I am sorry but I do not know the status for steps 1-2 at the moment.
keiyoshi08Thursday, May 12th, 2022 at 10:09:51 PM GMT+09:00
@gyin Thanks.
@uwatoko さん、レーダー雨量によるTEランの進捗を教えていただけないでしょうか。
@uwatoko さん、レーダー雨量によるTEランの進捗を教えていただけないでしょうか。
uwatokoFriday, May 13th, 2022 at 1:35:02 AM GMT+09:00
@keiyoshi08 先生
すみません、レーダー雨量によるTEランというのが分かってないです。
@gyinさんが用意してくれた2007年から2019年の
MSM、レーダアメダス、SVM、CDFtのTEが動かせれるデータ((gtool形式)を用意すれば
私の仕事は終わりと思っておりました。
レーダー雨量(=レーダアメダス)でTEを動かさせば良いのでしょうか。
すみません、レーダー雨量によるTEランというのが分かってないです。
@gyinさんが用意してくれた2007年から2019年の
MSM、レーダアメダス、SVM、CDFtのTEが動かせれるデータ((gtool形式)を用意すれば
私の仕事は終わりと思っておりました。
レーダー雨量(=レーダアメダス)でTEを動かさせば良いのでしょうか。
keiyoshi08Friday, May 13th, 2022 at 1:51:56 AM GMT+09:00
@uwatoko さま
なんと。@yamamoto.kosuke さんのほうでもやっていませんか?
なんと。@yamamoto.kosuke さんのほうでもやっていませんか?
yamamoto.kosukeFriday, May 13th, 2022 at 8:42:57 AM GMT+09:00
@keiyoshi08 先生、遅くなりすみません。レーダを使ったTE過去ランは私のA/Iで、対応中です。ちょっと走らせる環境を移したこともあって遅くなっていますが、来週中いっぱいくらいには終わるかなと思っています。
keiyoshi08Friday, May 13th, 2022 at 8:46:06 AM GMT+09:00
@yamamoto.kosuke さん、ありがとうございます!さすがです。今後、こういった対応を学生にバイトでやってもらえるよう整えます。よろしくお願いします。
keiyoshi08Thursday, May 12th, 2022 at 7:15:51 PM GMT+09:00
@yixisi1505 Ma-san, thanks for your reply. I meant Radar-run. In previous mail, it was Step 2, whereas your run is Step 4.
> 1. Prepare Radar precipitation for TE-Japan use. (Uwatoko-san, do you
> already have them?)
> 2. After step 1, conduct a TE-Japan run with Radar. (Is it possible to
> do this, Uwatoko-san?)
> 3. Prepare MSM-AI precipitation (cross-validation results) for
> TE-Japan use. (I’d like Gaohong to take this task, for all the sites
> and all the months, For re-formatting to TE-Japan input, RESTEC will
> help.)
> 4. After step 3, conduct a TE-Japan run with MSM-AI (cross-validation
> results) (Is this possible to run it in U-Tokyo?)
> 1. Prepare Radar precipitation for TE-Japan use. (Uwatoko-san, do you
> already have them?)
> 2. After step 1, conduct a TE-Japan run with Radar. (Is it possible to
> do this, Uwatoko-san?)
> 3. Prepare MSM-AI precipitation (cross-validation results) for
> TE-Japan use. (I’d like Gaohong to take this task, for all the sites
> and all the months, For re-formatting to TE-Japan input, RESTEC will
> help.)
> 4. After step 3, conduct a TE-Japan run with MSM-AI (cross-validation
> results) (Is this possible to run it in U-Tokyo?)
gyinTuesday, June 14th, 2022 at 4:21:05 PM GMT+09:00
@uwatoko -san, @keiyoshi08 -sensei, @yixisi1505 -san,
As Ma-san found problem of TE-AI in Hokkaido region (cross-validation from 2007-2019), I checked the ML-CDFt precipitation data sets. I found that due to data transferring issue, precipitation in 200901 and 201001 in site A has problem. Therefore, I re-uploaded the precipitation to the JAXA server at:
/lebron_disk09/gyin/MSM_AI/siteA/01
(other sites and months should be no problem)
@uwatoko -san, can you please help re-generate the merged precipitation for 200901 and 201001? I am so sorry for adding additional work to your busy schedule. Thank you so much for your help!
Best regards,
Gaohong
yixisi1505Tuesday, June 14th, 2022 at 4:58:04 PM GMT+09:00
@gyin san, thank you for your quick action. After the rainfall data is re-generated, I will rerun TE system as soon as possible.
uwatokoWednesday, June 15th, 2022 at 12:50:23 AM GMT+09:00
@gyin san,
I understand that only the precipitation for 200901 and 201001 at site A is wrong and that this needs to be replaced.
I will contact you after I recreate the data for 200901 and 201001.
Please wait for a little while longer.
I understand that only the precipitation for 200901 and 201001 at site A is wrong and that this needs to be replaced.
I will contact you after I recreate the data for 200901 and 201001.
Please wait for a little while longer.
gyinWednesday, June 15th, 2022 at 10:11:18 AM GMT+09:00
@uwatoko -san, yes, 200901 and 201001 at site A should be replaced. Sorry again for adding your workload. Thank you so much for your kind help!
uwatokoThursday, June 16th, 2022 at 6:50:03 PM GMT+09:00
@gyin san,
We have re-created gtool format data in 1-day (26h) units for January 2009 and January 2010 and stored them below.
/harden_disk09/GPM/AI_GSMaP/DATA/MSM_AI/CDFt/
/harden_disk09/GPM/AI_GSMaP/DATA/MSM_AI/MSM/
/harden_disk09/GPM/AI_GSMaP/DATA/MSM_AI/OBS/
/harden_disk09/GPM/AI_GSMaP/DATA/MSM_AI/SVM/
Could you can confirm that the data is correct?
gyinThursday, June 16th, 2022 at 8:56:38 PM GMT+09:00
@uwatoko -san, great thanks!
yixisi1505Tuesday, June 14th, 2022 at 4:58:04 PM GMT+09:00
@gyin san, thank you for your quick action. After the rainfall data is re-generated, I will rerun TE system as soon as possible.
keiyoshi08Tuesday, June 14th, 2022 at 5:29:39 PM GMT+09:00
Thanks @gyin @yixisi1505 for your effort. Please check the data carefully so that we don’t have to rerun the simulation again…
gyinWednesday, June 15th, 2022 at 10:16:17 AM GMT+09:00
@keiyoshi08 -sensei, I apologize for my carelessness. I will be more careful when checking the data.
uwatokoSunday, July 3rd, 2022 at 11:56:34 AM GMT+09:00
@here
TEのインプットでTE-AIを現在、gagaで処理をしておりますが、半日ほど遅延が発生しております。
原因は、gagaのアカウントwateropのpython3の処理負荷が大きくなっているためです。
wateropの作業を止めて頂けると助かります。
よろしくお願いします。
TEのインプットでTE-AIを現在、gagaで処理をしておりますが、半日ほど遅延が発生しております。
原因は、gagaのアカウントwateropのpython3の処理負荷が大きくなっているためです。
wateropの作業を止めて頂けると助かります。
よろしくお願いします。
yamamoto.kosukeSunday, July 3rd, 2022 at 1:16:16 PM GMT+09:00
@uwatoko 様、ありがとうございます。AI処理はgagaだったのですね…以前からレアメ過去ランはgagaを使ってたのですが、以前は問題なかったのでしょうか。いずれにしても出先のため、すみませんが対応が夜になります。対応しましたらまたご報告します。
yamamoto.kosukeMonday, July 4th, 2022 at 7:38:59 AM GMT+09:00
@uwatoko 遅くなりましたがひとまず停止しました。
yamamoto.kosukeMonday, July 4th, 2022 at 1:30:22 PM GMT+09:00

@uwatoko 様、@kakuda_ryosuke様
防災科研ハブラ―様から以下の問い合わせを受けました。予報ウェブでは、予報初期時刻: 2022年07月03日 06時 (JST)となっているので、以下の記述(UTC)と齟齬はなく、原因が上記の処理負荷だとすると改善される見込みと思いますが、現状はいかがでしょうか。ご確認いただけると幸いです。
------------------------------------
シミュレーション結果ですが、送信時刻と原点時刻の差は本来であれば約9時間の差となっていました。原点時刻7/1 21:00(UTC)のデータから送信時刻と原点時刻の差が大きくなり(19時間)、現在受信している最新の7/2 15:00のものでは32.5時間差になっております。7月3日のデータはまだ受信できておらず、なにかトラブル発生でしょうか?ご確認お願い致します。
------------------------------------
kakuda_ryosukeMonday, July 4th, 2022 at 4:07:05 PM GMT+09:00
@yamamoto.kosuke様
処理について本日停止対応頂いたとの事で、以降数回分の処理状況しか確認できませんが、
JustNowの解析処理の開始時刻は以下の通りとなり、改善傾向にある状況となります。
解析処理とフォーシング作成については別計算機で動作しており、
解析処理は1時間程度、フォーシング作成に2時間程度要している状況で、
解析処理がフォーシング作成を待つような状態になっております。
フォーシング作成処理に2時間程度は想定しているより長い処理時間となるのですが、
この要因について確認中の状態となります。
処理について本日停止対応頂いたとの事で、以降数回分の処理状況しか確認できませんが、
JustNowの解析処理の開始時刻は以下の通りとなり、改善傾向にある状況となります。
2022-07-04 08:15
2022-07-04 10:45
2022-07-04 12:45
2022-07-04 15:00
解析処理とフォーシング作成については別計算機で動作しており、
解析処理は1時間程度、フォーシング作成に2時間程度要している状況で、
解析処理がフォーシング作成を待つような状態になっております。
フォーシング作成処理に2時間程度は想定しているより長い処理時間となるのですが、
この要因について確認中の状態となります。
yamamoto.kosukeMonday, July 4th, 2022 at 5:01:07 PM GMT+09:00
@kakuda_ryosuke さま、ありがとうございます。gagaで処理を回していたのはかなり前からですが、最近になって遅れが出たという点が気になります。。すみませんが引き続きご確認いただければと思います。よろしくお願いいたします。
kakuda_ryosukeMonday, July 4th, 2022 at 5:23:06 PM GMT+09:00
@yamamoto.kosuke様
ご確認ありがとうございます。
直近で開始したものではないとの事承知しました。
停止頂いてから処理速度があがったため、関連するものと思いましたが、
同時期に別の問題が解消したことにより、速度が向上した可能性があるのですね。
問題点の切り分けとしてpecan03の負荷について問題はなかったかを確認したく思っております、
東上床様より、pecan03は別グループでありこちらでは確認できないとの事で、
確認依頼等の対応をお願いしたいのですが、可能でしょうか。
ご確認ありがとうございます。
直近で開始したものではないとの事承知しました。
停止頂いてから処理速度があがったため、関連するものと思いましたが、
同時期に別の問題が解消したことにより、速度が向上した可能性があるのですね。
問題点の切り分けとしてpecan03の負荷について問題はなかったかを確認したく思っております、
東上床様より、pecan03は別グループでありこちらでは確認できないとの事で、
確認依頼等の対応をお願いしたいのですが、可能でしょうか。
yamamoto.kosukeMonday, July 4th, 2022 at 5:29:42 PM GMT+09:00
@kakuda_ryosuke 様 詳しく述べると、確かに今回処理が遅くなったのは私の再処理をwateropで再実行開始した時期と重なってはいます(先週金曜頃)。ただし、それ以前にも全く同じ内容の処理を同じ場所で行っていたことがあり(しかも今回より長期にわたって)、
• その時期には何の問題もなかったこと
• また今回、処理停止後も完全復旧はしていない様子であること
が気になっている、ということです。pecan03への負荷は、私が回していた処理でも使っていたのであると思いますが(Forcingデータ読み込み)、他のユーザの影響も考えられると思います。@kachi.misako 様、pecan03の管理グループってどこでしたっけ?
• その時期には何の問題もなかったこと
• また今回、処理停止後も完全復旧はしていない様子であること
が気になっている、ということです。pecan03への負荷は、私が回していた処理でも使っていたのであると思いますが(Forcingデータ読み込み)、他のユーザの影響も考えられると思います。@kachi.misako 様、pecan03の管理グループってどこでしたっけ?
kachi.misakoMonday, July 4th, 2022 at 5:36:06 PM GMT+09:00
@yamamoto.kosuke さま
pecan03はpecan01/02と同様複合利用の共通管理なので、可知→加藤智さん管理です。
pecan03はpecan01/02と同様複合利用の共通管理なので、可知→加藤智さん管理です。
kachi.misakoMonday, July 4th, 2022 at 5:42:52 PM GMT+09:00
なお、計算機にアラートが出てたのはpecan02で、ベンダーに加藤さんが今日連絡して特にサーバに異常は出てないって話になってますが、そっちで問題になってるのは03なんですか?
yamamoto.kosukeMonday, July 4th, 2022 at 5:45:24 PM GMT+09:00
@kachi.misako さま はい、間違いなくpecan03です。過去2週間程度の期間、大幅に処理負荷が変化した時期がないか、可知さんから加藤さんに聞いていただくことは可能でしょうか?
yamamoto.kosukeMonday, July 4th, 2022 at 6:11:07 PM GMT+09:00
@kakuda_ryosuke さま、pecan03に関して可知さんにzabixで確認してもらいましたが、6/30に2時間ほどcpu/ネットワーク負荷が高くなっていましたが、それ以外は特段目立った負荷は確認できませんでした。pecanの影響とは考えづらいかと思います。
kakuda_ryosukeMonday, July 4th, 2022 at 6:58:13 PM GMT+09:00
@yamamoto.kosuke様、@kachi.misako様
ご確認、ご対応頂きありがとうございました。
pecan03では目立った負荷は確認されなかったとの事承知いたしました。
遅延については他の要因によるものと考え、
引き続き調査致します。
ご確認、ご対応頂きありがとうございました。
pecan03では目立った負荷は確認されなかったとの事承知いたしました。
遅延については他の要因によるものと考え、
引き続き調査致します。
kachi.misakoMonday, July 4th, 2022 at 7:53:00 PM GMT+09:00
👍
keiyoshi08Friday, July 8th, 2022 at 7:07:58 PM GMT+09:00
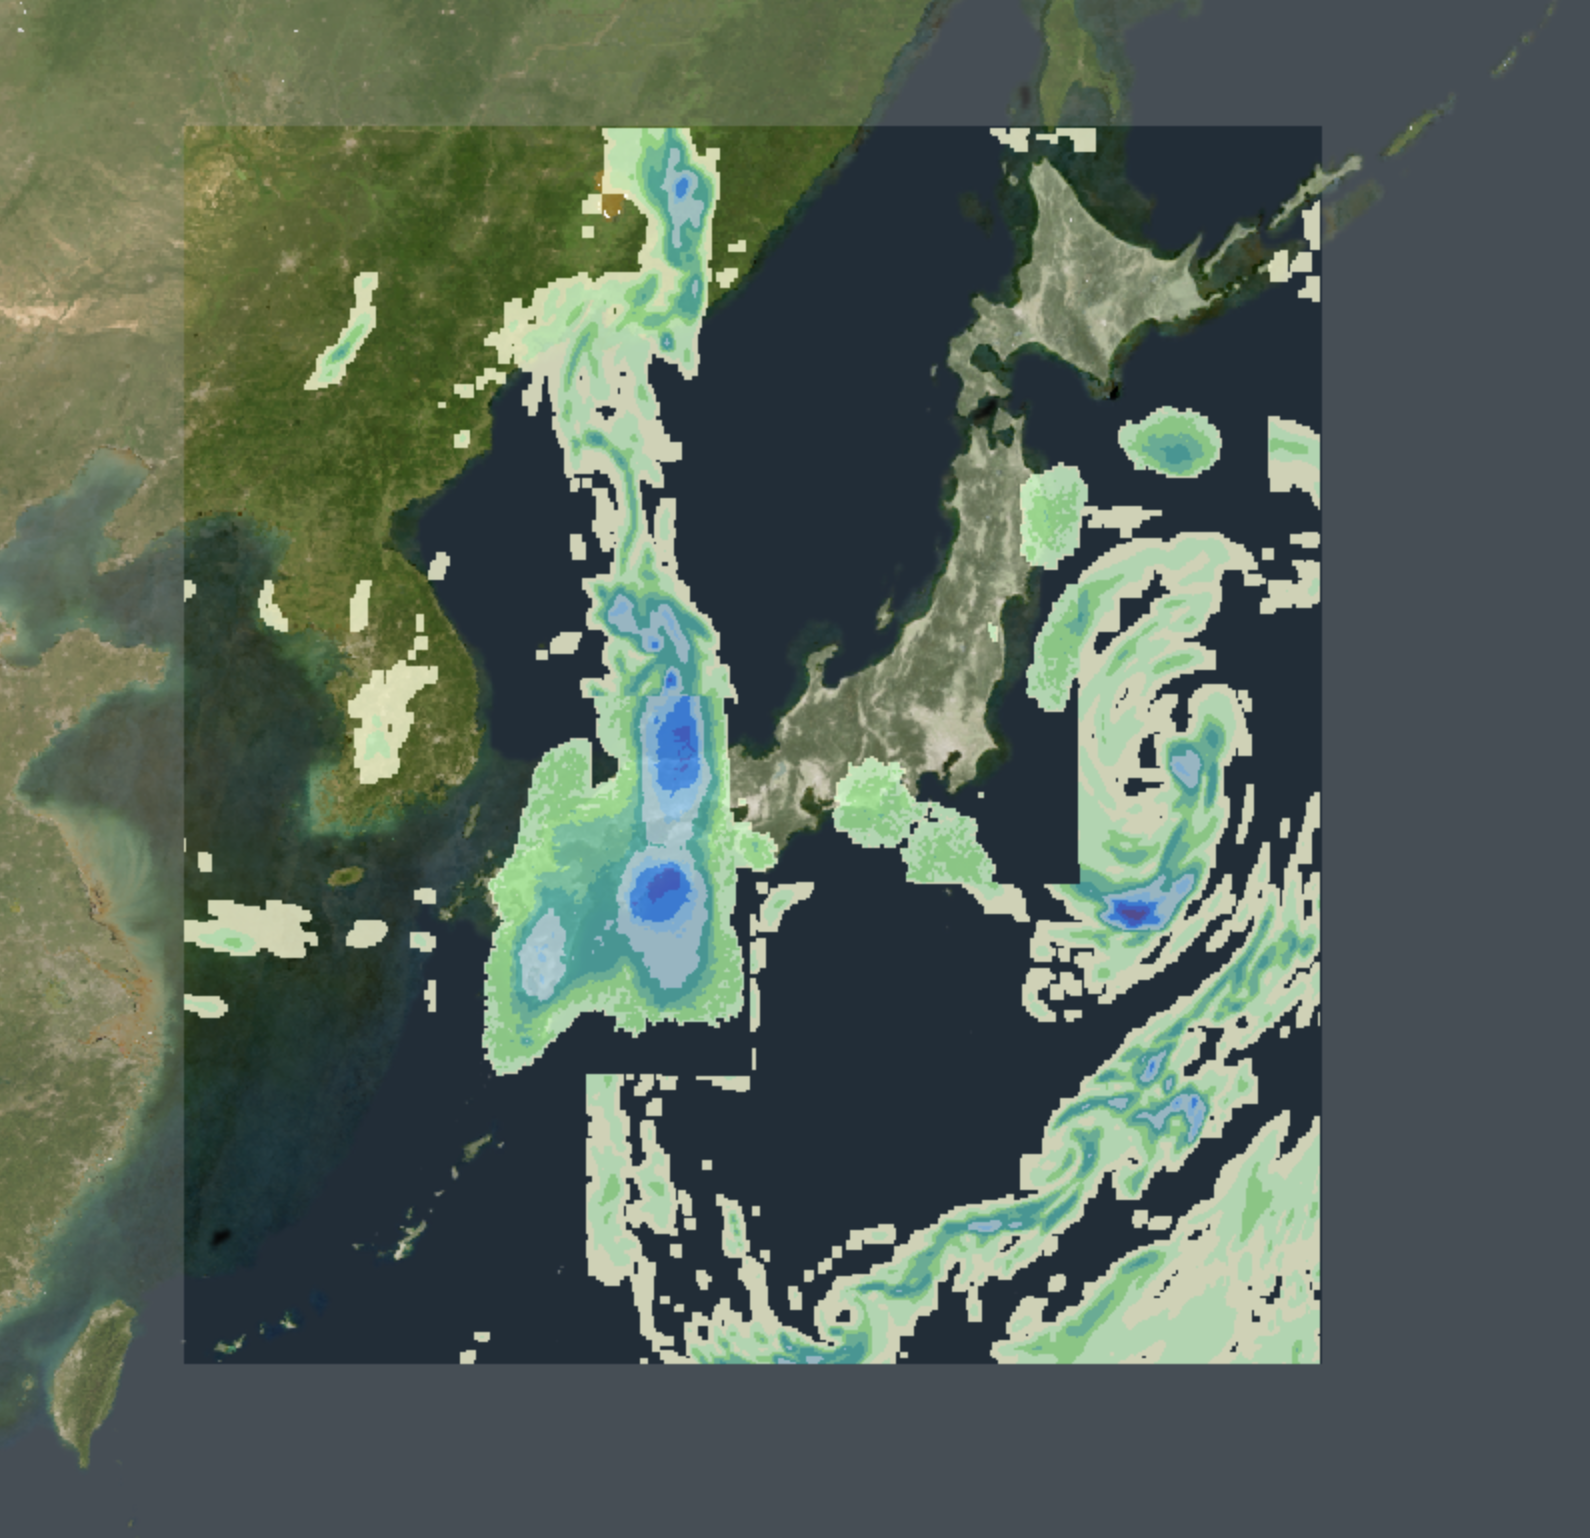
@takao-y @gyin
The discontinuity of the AI’ed precip and Sim’ed precip are little too obvious. How should we resolve this issue??
The discontinuity of the AI’ed precip and Sim’ed precip are little too obvious. How should we resolve this issue??
gyinFriday, July 8th, 2022 at 7:21:25 PM GMT+09:00
Dear @keiyoshi08 -sensei,
I am not sure how is the combination conducted, but I guess the discontinuity maybe related to the use of feature vector range (rg=10). In the current version, because of the feature vector range, ML was not conducted for grids at the edge of each site. I can think of two options for now:
(1) simply use MSM-GPV forecasts to fill those edge grids.
(2) run ML for edge grids using all neighborhood grids located inside the feature vector range. Note that the number of neighborhood grids used varies based on the location of the target grid.
I would like to hear Yoshikane-sensei’s thought on it, too.
keiyoshi08Friday, July 8th, 2022 at 8:05:54 PM GMT+09:00
It’s combined with original MSM precip with AI’ed precip.
When Site A~E were combined, how did you treat with the edge grids? Aren’t there any overlap grids? I think similar treatment should be done with original MSM precip data.
I may misunderstand the method. Please correct me if I’m wrong.
When Site A~E were combined, how did you treat with the edge grids? Aren’t there any overlap grids? I think similar treatment should be done with original MSM precip data.
I may misunderstand the method. Please correct me if I’m wrong.
gyinFriday, July 8th, 2022 at 9:04:49 PM GMT+09:00
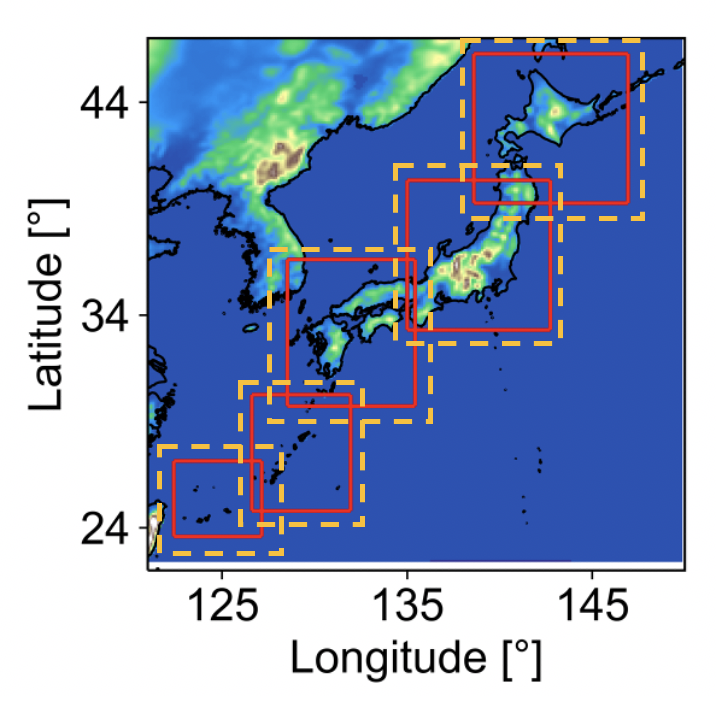
@keiyoshi08 -sensei, as shown in the attached figure, the yellow dashed squares are defined as site A-E, after machine learning, we will get merged sites A-E shown in red squares. So there will be no missing data connecting sites A-E. But for combining AI’ed and Sim’ed precipitation, I do not know how was that processed. I am sorry but may I ask from whom you get this combined figures? If I can check the processing code, I will try to fix the issue.
takao-yMonday, July 11th, 2022 at 2:15:58 PM GMT+09:00
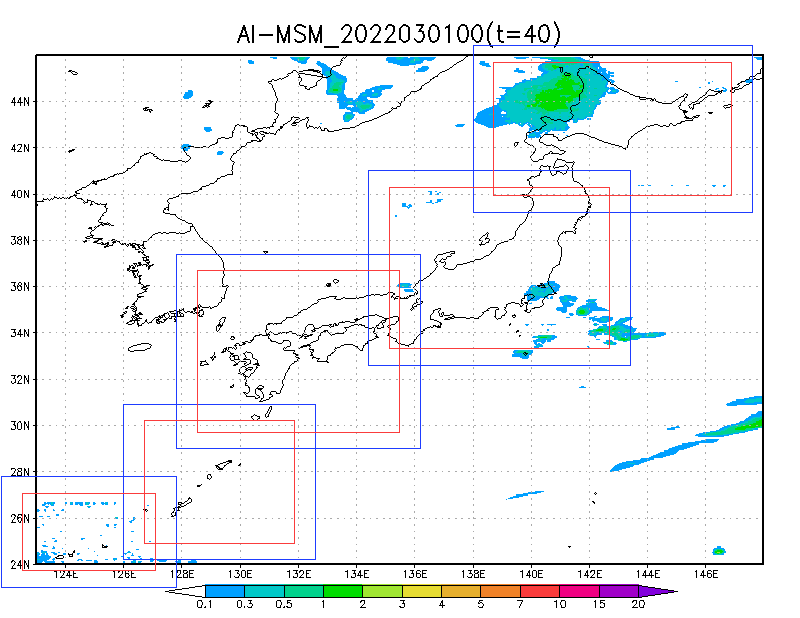
@keiyoshi08 @gyin @uwatoko
Sorry for the late reply. Where is the data of this figure? I don’t think there was such a mismatch when I was shown this before by Higashiuwatoko-san. Perhaps, there may be some kind of error in the synthesis of the MSM and AI data.
Sorry for the late reply. Where is the data of this figure? I don’t think there was such a mismatch when I was shown this before by Higashiuwatoko-san. Perhaps, there may be some kind of error in the synthesis of the MSM and AI data.
keiyoshi08Monday, July 11th, 2022 at 2:20:59 PM GMT+09:00
takao-yMonday, July 11th, 2022 at 4:34:25 PM GMT+09:00

I confirmed the data.
I think the discontinuity is due to missing of Radar AMeDAS observation. Therefore, it would be better to replace the missing area of Radar-AMeDAS data with MSM-GPV. (Or , it may be better to estimate the precipitation by AI only on land.)
I think the discontinuity is due to missing of Radar AMeDAS observation. Therefore, it would be better to replace the missing area of Radar-AMeDAS data with MSM-GPV. (Or , it may be better to estimate the precipitation by AI only on land.)
keiyoshi08Wednesday, July 13th, 2022 at 10:08:09 AM GMT+09:00
Thanks @takao-y -san.
Not only spatial discontinuity, but also temporal discontinuity seems also became bigger in MSM-AI precip (just in my feeling).
For example, last night, there was huge rain in Saitama prefecture in the late evening, but AI predicted rainfall did not have heavy rain there.
Can you quickly check the rainfall march and discontinuity of Radar, MSM, and MSM-AI focusing from 18:00JST July 12 till 3:00JST July 13 over Saitama Area. With various forecast streams from initial conditions of 6, 9, 12, 15, 18, 21, 24 of July 12 (for example).
https://www.eorc.jaxa.jp/water/map/private/index_j.html?date=2022071213&lon=139.1702&lat=35.7915&zoom=10.667483320856222&prod=GPRCT&calc=ave
keiyoshi08Monday, July 18th, 2022 at 8:58:18 AM GMT+09:00
@takao-y さん、日本語でも書いておきます。空間の非連続性に加えて、時間の方の非連続性も少し見えており、気になっています。また、山本さん指摘の同心円的な分布も気になります。
https://isotope.iis.u-tokyo.ac.jp/~kei/tmp/anim_gprct_2022071100.gif
は、7/11 0ZからのTE-Japanに使用された39時間予測雨量ですが、FT=0からFT=4までは解析雨量が入り、FT=5以降MSM-AIに切り替わっています。(予測なのにFT=4まで解析雨量というのは、実際には0Zの予測は、配信時間等の遅れから6〜10時間程度遅れてされており、それまでにある程度の解析雨量が手に入るからです)
ここでのFT=4とFT=5の切り替わりのことを言っています。
リアルタイム運用に実装されているので、研究ではまあいいかと思っていた点も、大きな影響になることがあり、注意が必要です。吉兼さんのほうでも常日頃からプロダクトを見ていてもらえると助かります。
https://isotope.iis.u-tokyo.ac.jp/~kei/tmp/?C=M;O=D
のanim_gprct_YYYYMMDDHH.gifにGIFアニメファイルを置いています。
takao-yFriday, July 22nd, 2022 at 4:00:52 PM GMT+09:00

The AI estimates seem to underestimate the heavy rainfall around midnight of the 12th in the Kanto Plain. The small precipitation even after applying QM suggests that the data sampling is inadequate. It may be possible to reduce the underestimation by adding the heavy precipitation cases in warm season (May to September?) to training data (only in July for now) and QM process.
takao-yFriday, July 22nd, 2022 at 4:31:20 PM GMT+09:00
The spatial discrepancy with Radar observation may also be related to the reproducibility of the MSM. If the MSM is not able to reproduce the characteristics of the observed heavy rainfall, it will be difficult for the AI to estimate. For example, if the precipitation is not reproduced at all, or if the formation position is significantly separated in MSM beyond the range of feature vector.
AI is strongly influenced by past precipitation cases. It has been noted that evening showers in the Kanto Plain are influenced by diurnal changes. Concentric precipitation bands may reflect evening showers in northern Kanto. It may be necessary to take other heavy rainfall cases excluding evening showers into the training data.
https://www.metsoc.jp/tenki/pdf/1998/1998_07_0541.pdf
https://www.metsoc.jp/tenki/pdf/2003/2003_10_0777.pdf
keiyoshi08Saturday, July 23rd, 2022 at 8:38:47 AM GMT+09:00
Thanks, Yoshikane-san. So don’t you have any solution and/or suggestions to overcome those issues?
keiyoshi08Friday, July 8th, 2022 at 8:05:54 PM GMT+09:00
It’s combined with original MSM precip with AI’ed precip.
When Site A~E were combined, how did you treat with the edge grids? Aren’t there any overlap grids? I think similar treatment should be done with original MSM precip data.
I may misunderstand the method. Please correct me if I’m wrong.
When Site A~E were combined, how did you treat with the edge grids? Aren’t there any overlap grids? I think similar treatment should be done with original MSM precip data.
I may misunderstand the method. Please correct me if I’m wrong.
yamamoto.kosukeMonday, July 11th, 2022 at 7:32:34 PM GMT+09:00

@gyin -san,
Sorry to complicate, but it seems that some of the MLCDFt data you processed for the past period is missing. Attached is a list of the data with missing.
One is the case when the MSM is missing. In this case, the associated SVM and CDFt are also missing. The other case is that the radar-AMeDAS (OBS) is missing. Could you please confirm this?
gyinMonday, July 11th, 2022 at 7:42:28 PM GMT+09:00
@yamamoto.kosuke -san, sorry for that. I will check it and get back to you as soon as possible.
gyinMonday, July 11th, 2022 at 8:32:37 PM GMT+09:00
@yamamoto.kosuke -san,
I traced all the way back to the original data and found that the interpolated data (grd files) are missing at those hours.
@uwatoko -san, could you please check the interpolated data? I got the MSM and Radar-AMeDas from the path:
/lebron_disk09/GPM/AI_GSMaP/DATA/MSM_GPV_Rjp_cut
/lebron_disk09/GPM/AI_GSMaP/DATA/SRF_GPV_Ggis1km_cut
I am sorry that I did not notice the missing data before.
keiyoshi08Tuesday, July 12th, 2022 at 7:15:26 PM GMT+09:00
@uwatoko さん、@yamamoto.kosuke さん、Gaohongと話しましたが、こちらで対応することは可能です。お忙しいと思いますので、どうぞ遠慮なくお任せください。ただその場合、そちらで作業しているコード一式が必要なので、シェアしてください。(ML処理内容が同じかの確認と、最終的なTE-Japan用のデータとする部分をこちらは持っていないためです。)
uwatokoFriday, July 15th, 2022 at 7:58:21 PM GMT+09:00


@keiyoshi08 先生、@yamamoto.kosuke さん、@gyin -san,
遅くなりましたが、とりあえず、こちらで対応できるところをやりました。
• MSMと解析雨量の欠損しているところのオリジナルデータがEORCにあるかどうか?
色々ありましたが、オリジナルデータがこちらにあることを確認しました。
MSM(grib2形式)、解析雨量(正確にはオリジナルではなく、オリジナルのインデック値から雨量(mm/h)に変換したもの)を
下記に置いてあります(詳細は、欠損データ格納場所.xlsxに記載)。
MSM:/lebron_disk09/GPM/AI_GSMaP/DATA/MSM_GPV_Rjp_cut/missing/
解析雨量:/lebron_disk09/GPM/AI_GSMaP/DATA/SRF_GPV_Ggis1km_cut/missing/
• オリジナルMSMからstation切り出しが出来るか(オリジナルMSMから3時間毎の雨を切り出して1か月のデータにする)。
計算機のOS切り替えの際に、プログラムが消えたので、再度作成が必要。
これがないため、必然的にCDFtとSVMのデータ処理が出来ない。
• gtool形式が作成できるか。
CDFtとSVMはデータがないのでできないですが、MSMと解析雨量は出来る。
下記に置いてあります(詳細は、欠損データgtoolファイル格納場所.xlsxに記載)。
MSM:/harden_disk09/GPM/AI_GSMaP/DATA/tmp/MSM/
解析雨量:/harden_disk09/GPM/AI_GSMaP/DATA/tmp/OBS/
ということで、最終的なTE-Japan用はこちらで対応が可能です。
keiyoshi08Saturday, July 16th, 2022 at 12:52:47 AM GMT+09:00
Thank you @uwatoko san!
> 計算機のOS切り替えの際に、プログラムが消えたので、再度作成が必要。
は、オオゴトそうに聞こえますが、大丈夫でしょうか?
@gyin , would you please check the excel files?
> 計算機のOS切り替えの際に、プログラムが消えたので、再度作成が必要。
は、オオゴトそうに聞こえますが、大丈夫でしょうか?
@gyin , would you please check the excel files?
gyinSaturday, July 16th, 2022 at 4:01:34 PM GMT+09:00
@keiyoshi08 -sensei, @uwatoko -san,
Sorry for the late reply! I am sorry but it seems google translate does not work well for the technical notes. I do not completely understood the situation now.
So are the data processing codes (for example, the conversion codes from original MSM-GPV to interpolated 0.06 degree for each sides) not available now? What I need to do is to prepare those missing data, and run SVM-CDFt to make up those missing hours?
keiyoshi08Monday, July 18th, 2022 at 8:11:43 AM GMT+09:00
@uwatoko san,
私も少しわかっておりません。
> オリジナルMSMからstation切り出しが出来るか
> これがないため、必然的にCDFtとSVMのデータ処理が出来ない。
ということですが、これがなくても現状機械学習補正済みデータ(いわゆるMSM-AI降水)は自動作成できているわけですよね。
抜け期間は短いので、SVM 識別機やCDFt変換テーブルの作り直しまでは不要、つまりすでにある該当期間用の識別機及び変換テーブルで、MSMデータからSVN及びCDFt変換がされればよいのですが、それも不可能でしょうか?
将来的には、そういった処理コードは、すべて共有化しておくべきだと思いますが。
@gyin san,
Yes, it seems that the codes for processing from the original MSM to “cut” files are missing. But I believe that the process is needed to remake the classifiers, etc. This time, I think the missing periods are short, so we don’t need to make the SVM classifiers and/or CDFt conversion tables. Is this OK?
gyinMonday, July 18th, 2022 at 9:48:28 AM GMT+09:00
@keiyoshi08 -sensei, @uwatoko -san,
Thank you for the explanation! I think previously Yoshikane-sensei shared his codes of cutting sites with me. As Higashiuwatoko-san provided the original data of MSM-GPV and Radar-AMeDAS in the missing months, I will try to process and cut sites A-E, and use the existed classifiers to generate SVM-CDFt results.
After finishing all, I will share all the results and codes. I will try to finish the process as soon as possible.
keiyoshi08Monday, July 18th, 2022 at 9:54:37 AM GMT+09:00
@gyin I see it. Thank you.
uwatokoTuesday, July 19th, 2022 at 10:26:57 PM GMT+09:00
@keiyoshi08 先生、@gyinさん
返事が遅くなりまして、申し訳ございません。
すみません、私の方で勘違いしておりました。
SVM 識別機やCDFt変換テーブルの作り直しまでは不要とは思わず、
再度過去データと同じように1か月分のデータを作成する必要があると思っておりました。
@gyinさんが作成されるとおっしゃるように、処理コードは@gyinさんから
頂いているので、こちらも共有しております。
よろしくお願いします。
返事が遅くなりまして、申し訳ございません。
すみません、私の方で勘違いしておりました。
SVM 識別機やCDFt変換テーブルの作り直しまでは不要とは思わず、
再度過去データと同じように1か月分のデータを作成する必要があると思っておりました。
@gyinさんが作成されるとおっしゃるように、処理コードは@gyinさんから
頂いているので、こちらも共有しております。
よろしくお願いします。
gyinThursday, July 21st, 2022 at 5:33:01 PM GMT+09:00
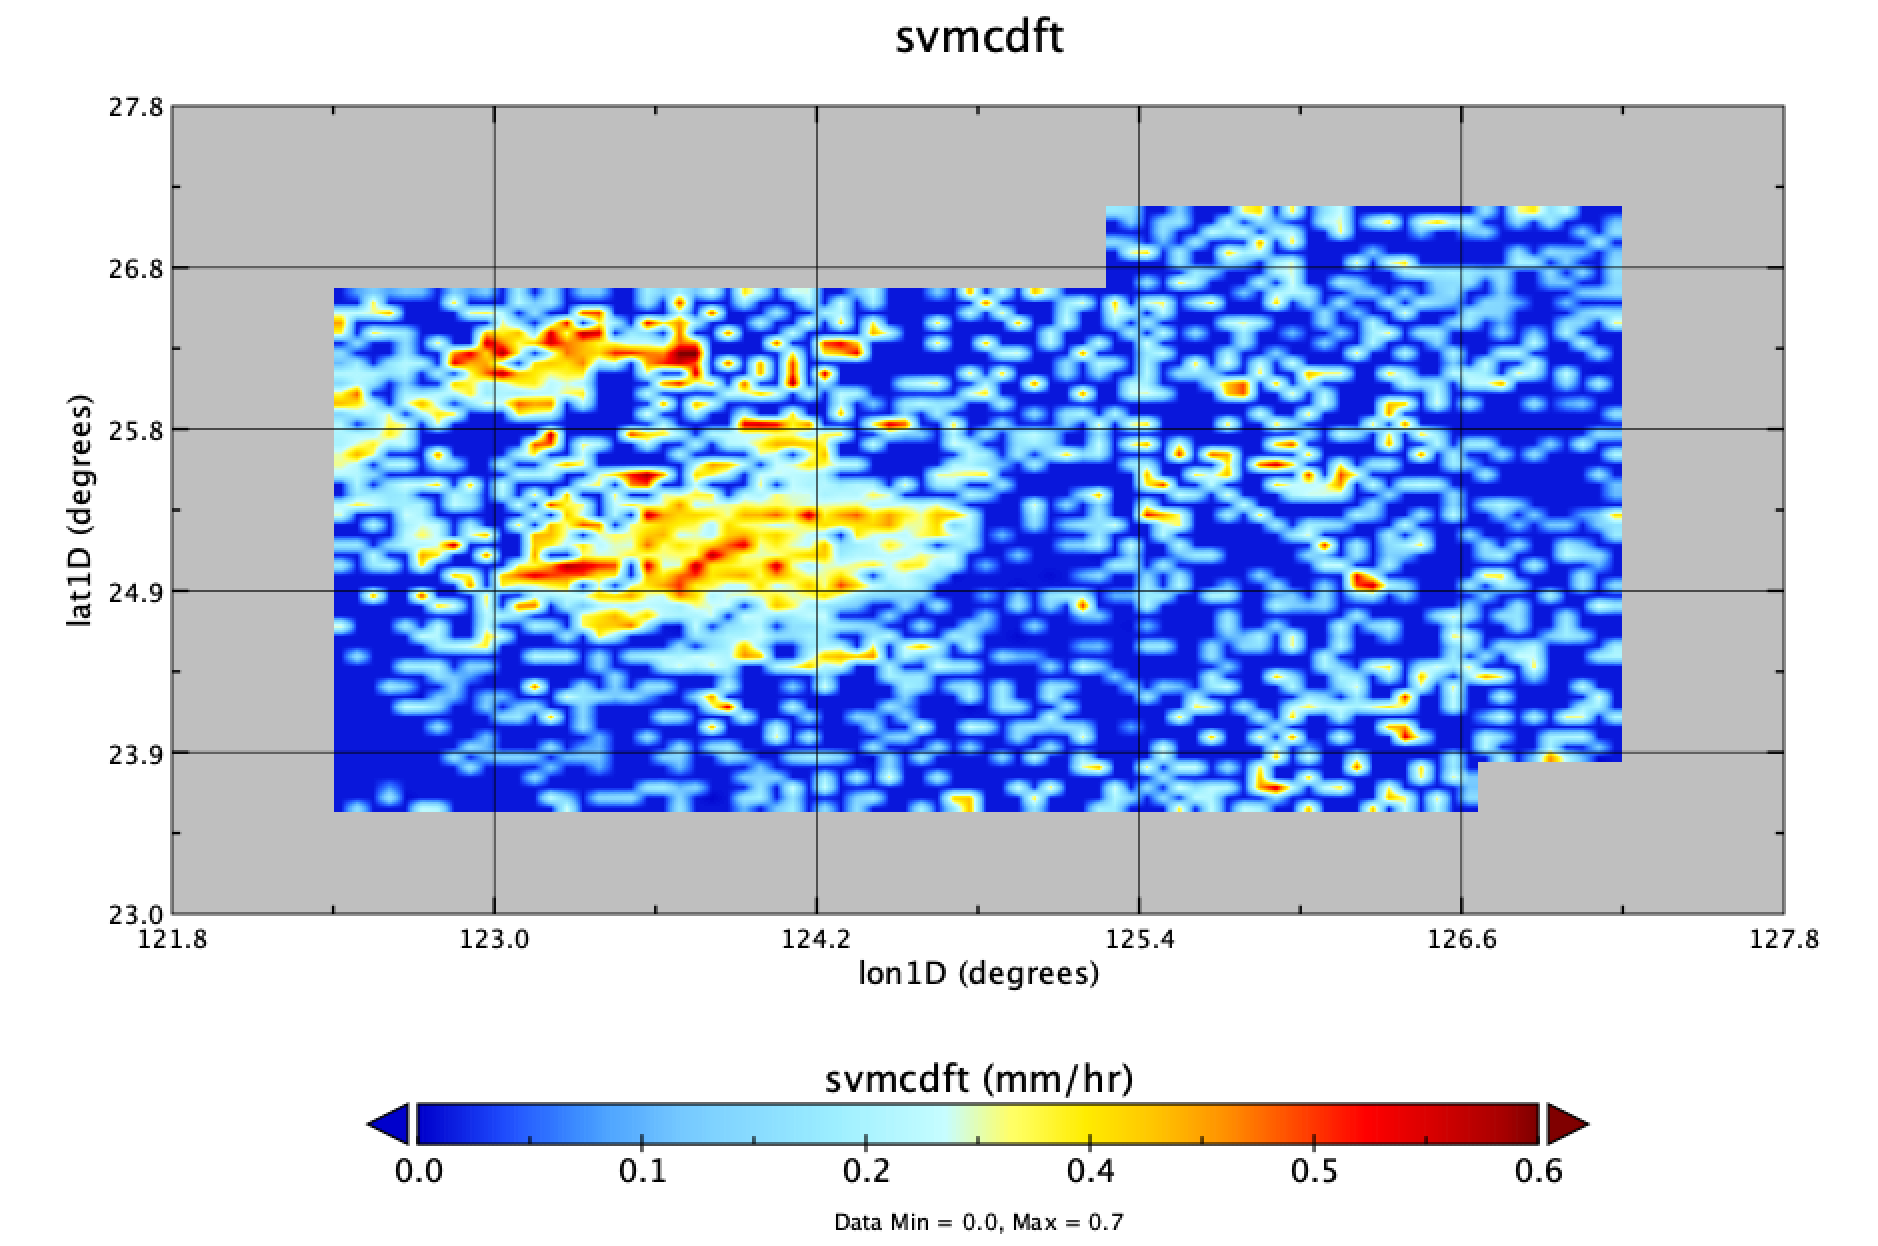
@yamamoto.kosuke -san, @uwatoko -san, @keiyoshi08 -sensei,
I have filled the missing periods and uploaded the results for those months to JAXA server at:
/lebron_disk09/gyin/MSM_AI/missing
Codes I used are modified based on Yoshikane-sensei’s codes (/lebron_disk09/gyin/MSM_AI/MSM_code ; /lebron_disk09/gyin/MSM_AI/radar_code).
Here are some notes on the issues I found and how I processed the data:
• Except the listed 11 months, OBS in 16 July 2017 at 7 am is also missing. So I also provided the results for July 2017.
• Site E SVMCDFt results in April still have unrealistic signals in some years (e.g., 200704, 201104) as attached. I think it is related to the CDFt process does not work well for the data in site E. Additionally, at some hours, Radar-AMeDAS data does not provide values across whole site E, therefore, sometimes the OBS are only available for sub-regions (e.g., 2011-04-06 2am). I will work more on solving the unrealistic signal issue.
• For missing MSM (which caused missing SVM and SVMCDFt), What I did is:
(1) cut MSM-GPV data for each sites on the missing date.
(2) run SVM to get SVM estimates on the missing date.
(3) merge SVM results on the missing date with previously SVM file
(4) run CDFt with the merged file from step (3) for the whole month of all years (2007-2019)
• For missing OBS:
(1) I did not re-run SVM or CDFt, just cut Radar-AMeDAS data during the missing months for each sites
(2) fill OBS on the missing date with data from step (1)
(3) Since I do not have the gtool codes you used for data preparation, I do not know how to deal with the radar data you provided (“xxxx.dat”). I used the Radar-AMeDAS data (“xxx.bin”) and processing codes provided by Yoshikane-sensei. The processed Radar-AMeDAS data for each sites are almost identical to your processed data with some minor differences.
Please let me know if you find any errors in the data. Thank you!
yamamoto.kosukeWednesday, July 27th, 2022 at 10:48:58 PM GMT+09:00
@gyin -san, thank you so much for your effort! Just for quick check, could you change the permission of the following directories?
/lebron_disk09/gyin/MSM_AI/missing
/lebron_disk09/gyin/MSM_AI/MSM_code
/lebron_disk09/gyin/MSM_AI/radar_codegyinThursday, July 28th, 2022 at 9:13:08 AM GMT+09:00
@yamamoto.kosuke -san, I am sorry for that. The permission has been changed. Please let me know if there is any other problems with it.
gyinTuesday, August 9th, 2022 at 3:44:04 PM GMT+09:00
@uwatoko -san,
Here is some update on site E. I’ve tried several methods trying to resolve the scattered values. However, the results are not very satisfactory:
(1) by re-selecting hyperparameters for site E based on R or MAE (instead of RMSE), the problem in April was resolved, but scattered values start to occur in other months (SVM somehow do not provide zero values, causing problem in CDFt process).
(2) By increasing the threshold to define rain or not (from 0.1 mm/hr to 1 mm/hr), the strange scattered pattern can be reduced, but it also missed some spatial pattern of rainfall, leading to more zeros.
For flood forecast purpose, I think you may use the current results of site E because it mostly covers ocean, which may not have a very large impact on land flood forecasting. But for visualization and reality purpose, I may still need to explore a better way to solve it. Sorry for the late update.
@takao-y -sensei, may I have your suggestion on this? Thank you so much!
keiyoshi08Wednesday, July 13th, 2022 at 10:08:09 AM GMT+09:00
Thanks @takao-y -san.
Not only spatial discontinuity, but also temporal discontinuity seems also became bigger in MSM-AI precip (just in my feeling).
For example, last night, there was huge rain in Saitama prefecture in the late evening, but AI predicted rainfall did not have heavy rain there.
Can you quickly check the rainfall march and discontinuity of Radar, MSM, and MSM-AI focusing from 18:00JST July 12 till 3:00JST July 13 over Saitama Area. With various forecast streams from initial conditions of 6, 9, 12, 15, 18, 21, 24 of July 12 (for example).
https://www.eorc.jaxa.jp/water/map/private/index_j.html?date=2022071213&lon=139.1702&lat=35.7915&zoom=10.667483320856222&prod=GPRCT&calc=ave
Not only spatial discontinuity, but also temporal discontinuity seems also became bigger in MSM-AI precip (just in my feeling).
For example, last night, there was huge rain in Saitama prefecture in the late evening, but AI predicted rainfall did not have heavy rain there.
Can you quickly check the rainfall march and discontinuity of Radar, MSM, and MSM-AI focusing from 18:00JST July 12 till 3:00JST July 13 over Saitama Area. With various forecast streams from initial conditions of 6, 9, 12, 15, 18, 21, 24 of July 12 (for example).
https://www.eorc.jaxa.jp/water/map/private/index_j.html?date=2022071213&lon=139.1702&lat=35.7915&zoom=10.667483320856222&prod=GPRCT&calc=ave
takao-yFriday, August 26th, 2022 at 5:08:16 PM GMT+09:00
すみません。音声が聞こえないようです。再起動します。
rkanekoFriday, August 26th, 2022 at 6:19:06 PM GMT+09:00
ミーティングお疲れ様でした。
話の論点がずれてしまうかもしれませんが、、ご参考になれば!
SVMにもGPU対応版があって、計算の高速化に繋がるかもしれません。
NVIDIAが提供するライブラリ群RAPIDSに含まれていて、「おそらく」ですが、今までのコードをほとんど変えることなく実装可能です。
https://docs.rapids.ai/api/cuml/stable/api.html#cuml.svm.SVR
NVIDIA’s RAPIDS-cuML Library is one of the GPU solutions of SVM.
You might use this library without a big change in your original code.
takao-yFriday, August 26th, 2022 at 6:46:34 PM GMT+09:00
ありがとうございます。少し検討してみます。私の手法だと識別器を格子点毎に作成する必要があるので、どうしてもI/Oへの負担が大きくなるのですが、DSの部分だけディープラーニングで実行することも考えています。何となくですが、その方が線状降水帯などスコールラインなどの推定精度(メリハリ)も良くなるのではないかと考えています。
rkanekoSaturday, August 27th, 2022 at 8:31:37 AM GMT+09:00
データセットが多いですから、IOもきつそうなのかなとは思っていました。CPU/GPUの問題の他に、ディスクの問題もあるのですねぇ。。。早いディスク(SSDとかRAIDのレベルが高いディスクなど)を使っても計算速度が改善されるかもしれませんね。
超解像系も興味深いですね。別のタスクで取り組んでいますが、ちょっと難しさは感じていますが、何かしらの突破口にはなるような気もしています。体感ですが。。
超解像系も興味深いですね。別のタスクで取り組んでいますが、ちょっと難しさは感じていますが、何かしらの突破口にはなるような気もしています。体感ですが。。
keiyoshi08Friday, August 26th, 2022 at 6:44:26 PM GMT+09:00
いいですね!ためしましょう
takao-ySaturday, August 27th, 2022 at 8:26:54 AM GMT+09:00
比較的簡単にできそうな改善方法について考えてみました。ご意見いただければ幸いです。
-----
AI降水量推定値の過大評価軽減方法
本手法の問題点から効果が期待される方法
(比較的簡単に対処可能)
1. 空間高解像度化:格子間隔の差だけ輪郭がシャープになる?
2. 時間高解像度化:30分値データを用いる。1時間積算値よりも降水帯がシャープになる?
3. 特定格子で降水が観測されるが、(特徴量の範囲内で)シミュレーション降水が再現されていない場合を除外
4. (特徴量の範囲内で)降水は観測されないが、シミュレーション降水がある場合を除外
5. オーバーサンプリング(過去の極端現象を認識しやすくする)
3,4,5は比較的簡単にできる方法
3,4について、学習データ及び分位マッピングから除外することにより、推定精度が向上し、推定される降水帯にメリハリが出る(現実的な降水帯を推定できる)かもしれない
(アンダーサンプリングを厳格に適用し、より明確な関係性を学習)
5.について、たとえば、観測降水とシミュレーション降水の雨量に応じてオーバーサンプリングの比率を変化させる?(頻度の多い小雨と頻度の少ない豪雨-->頻度を同じにして、豪雨を認識しやすくする)。5は少し難しそう。
Yin-san,
I have considered ways to improve the overestimation of AI precipitation (that seem to be relatively easy to do). Please let us know your opinion.
Reduction Method for overestimated AI Precipitation Estimates
It is expected to be effective based on the problems with this method
1. Improve spatial resolution: Sharpen the contours only by the difference of grid spacing?
2. Improve temporal high-resolution: Use 30-minute data; the precipitation zone is sharper than that of hourly integrated data?
3. Exclude cases where precipitation is observed on a particular grid but simulated precipitation is not reproduced within the range of feature vectors.
4. Excludes cases where precipitation is not observed within the range of feature vectors. but simulated precipitation is present
5. Apply an oversampling method (strong recognition of past extreme events)
3, 4, and 5 are relatively easy methods
Excluding the cases of 3 and 4 from the training data and quantile mapping may improve the accuracy of the estimation and make the estimated precipitation zones more realistic (i.e., allow estimation of realistic precipitation zones).
(rigorous application of undersampling and learning of clearer relationships)
Regarding 5., for example, vary the ratio of oversampling according to the amount of rainfall of observed and simulated precipitation? (frequent light rainfall and infrequent heavy rainfall--> keep the frequency the same and make the heavy rainfall more strongly recognized). It may be difficult to conduct.
takao-ySaturday, August 27th, 2022 at 8:42:08 AM GMT+09:00
高解像度化への問題点について、CPUよりもI/Oの問題が大きそうです。格子点毎に識別器を作成するため、HDDへの負荷が大きく、CPU(GPU)を増やしても書き込みで遅くなっているようです。対処方法として、HDDを複数用意して、それぞれのHDDに割り当てる領域を細分化することにより、早くなるかもしれません。本手法では最新のスパコンより低スペックのPCを複数使った分散コンピューティングシステムの方が相性が良いかもしれません。
https://www.geekly.co.jp/column/cat-technology/1903_050/
https://www.geekly.co.jp/column/cat-technology/1903_050/